Highly Stable Oil-in-Water Emulsions with a Gemini ... · Highly Stable Oil-in-Water Emulsions with...
19
Supporting Information for: Highly Stable Oil-in-Water Emulsions with a Gemini Amphiphilic Pseudopeptide Ahmed H. Lotfallah, a M. Isabel Burguete, a Ignacio Alfonso b, * and Santiago V. Luis a, * a Departamento de Química Inorgánica y Orgánica,Universidad Jaume I, Avd. Sos Baynat s/n, Castellón, Spain. Fax: +34 964728214; Tel: +34 964728239; E-mail: [email protected]. b Instituto de Química Avanzada de Cataluña, IQAC-CSIC, Jordi Girona 18-26, Barcelona, Spain. E-mail: [email protected]. Table of contents: General experimental and synthetic procedures S-2 Copies of the NMR and ESI-MS spectra S-5 Calculation of the CAC of compound 1 S-6 Synthetic procedure of compound 2 (DEA) S-7 SEM micrographs of compound 1 S-8 TEM micrographs of compound 1 S-9 AFM micrographs of compound 1 S-10 AFM profile analysis of two selected vesicles S-11 Optical microscopy pictures of o/w microemulsion with compound 1 S-12 Long term studies S-13 Mechanical stability studies S-14 Thermal stability test S-15 pH effect S-16 Thermolysin effect S-18 Size distribution diagram S-19 Electronic Supplementary Material (ESI) for RSC Advances. This journal is © The Royal Society of Chemistry 2015
Transcript of Highly Stable Oil-in-Water Emulsions with a Gemini ... · Highly Stable Oil-in-Water Emulsions with...

Supporting Information for:
Highly Stable Oil-in-Water Emulsions with a Gemini
Amphiphilic Pseudopeptide
Ahmed H. Lotfallah,a M. Isabel Burguete,
a Ignacio Alfonso
b,* and Santiago V. Luis
a,*
aDepartamento de Química Inorgánica y Orgánica,Universidad Jaume I, Avd. Sos
Baynat s/n, Castellón, Spain. Fax: +34 964728214; Tel: +34 964728239; E-mail:
bInstituto de Química Avanzada de Cataluña, IQAC-CSIC, Jordi Girona 18-26,
Barcelona, Spain. E-mail: [email protected].
Table of contents:
General experimental and synthetic procedures S-2
Copies of the NMR and ESI-MS spectra S-5
Calculation of the CAC of compound 1 S-6
Synthetic procedure of compound 2 (DEA) S-7
SEM micrographs of compound 1 S-8
TEM micrographs of compound 1 S-9
AFM micrographs of compound 1 S-10
AFM profile analysis of two selected vesicles S-11
Optical microscopy pictures of o/w microemulsion with compound 1 S-12
Long term studies S-13
Mechanical stability studies S-14
Thermal stability test S-15
pH effect S-16
Thermolysin effect S-18
Size distribution diagram S-19
Electronic Supplementary Material (ESI) for RSC Advances.This journal is © The Royal Society of Chemistry 2015

S-2
General experimental and synthetic procedures
Chemicals and starting materials: The solvents such as methanol, dichloromethane,
2-propanol, ethelyene glycol dimethyl ether, chloroform, acetonitirile, tetrahydrofuran,
n-pentane, ethyl acetate, aqueous ammonia, conc HCl , borane pyridine complex and
reagents such as NaCl, NaOH, MgSO4 and deuterated solvents for NMR such as
DMSO, CD3OD, CDCl3, were purchased from Scharlab. The N-Cbz-Valine, N-
hydroxysuccinamide, N,N´dicyclohexylcarbodiimide, HBr/AcOH(33%), diethyl amine,
diethyl triamine, dansyl chloride, citric acid and pyrene were purchased from Aldrich.
4-n-Decycloxybenzaldehyde was purchased from abcr GmbH&Co.KG Germany and
tri-sodium citrate dihydrate was purchased from E-Merk Germany.
The reagents and solvents were used without further purification exception pyrene was
recrystallized. The precursor bis(amido amine) was prepared as previously described [1]
Electron microscopy: Scanning Electron Microscopy was performed either in a LEO
440I or in a JEOL 7001F microscope with a digital camera. Samples were obtained by
slow evaporation of a solution of the compounds (~1-2 mg/ml) directly onto the sample
holder, and were conventionally coated previous to the measurement. Transmission
Electron Microscopy was carried out in a JEOL 2100 microscope at 120 KV. The
micrographs were obtained from ~1 mg/ml solutions onto a holey carbon copper grid.
The samples were sonicated for 10 minutes previous to the measurement, one drop
added onto the grid and collected directly without staining. Atomic Force Microscopy
was carried out in a JEOL JSPM 5200 scanning probe microscope with a digital camera.
The micrographs were obtained from ~1 mg/ml solutions, previously sonicated for 10
minutes. One drop of such solution was added onto a previously prepared smooth
surface mica and left for 24hrs slow evaporation prior to the measurement.
NMR spectroscopy: The NMR experiments were carried out on a Varian INOVA 500
spectrometer (500 MHz for 1H and 125 MHz for
13C). Chemical shifts are reported in
ppm using TMS as a reference.
Steady-state fluorescence spectroscopy: Steady-state fluorescence spectra were
recorded in a Spex Fluorog 3-11 equipped with a 450 W xenon lamp. Fluorescence
spectra were recorded in the front face mode. All the samples were measured in aerated
conditions. 30 μM 9,10 dimethyl anthracene was prepared by serial water dilution and
its intensity was measured at excitation = 358 nm.
Optical fluorescence microscopy: Optical microscopy images were captured in Epi-
fluorescence microscope N-400FL by a digital USB camera and using 100x / 1.25 oil
immersion plan-achromatic objective.
Emulsion preparation: 1.26 mM A4NVal_a10obenz (1) was prepared in acidic 1:1
MeOH :H2O which then was evaporated by rotavap at 45ºC. 99.4 :0.6 corresponding oil
: water mixture was added to the completely dried (1) and was vigorously stirred at
room temperature for 30-90 minutes in order to obtain smooth stable emulsion.
S-3
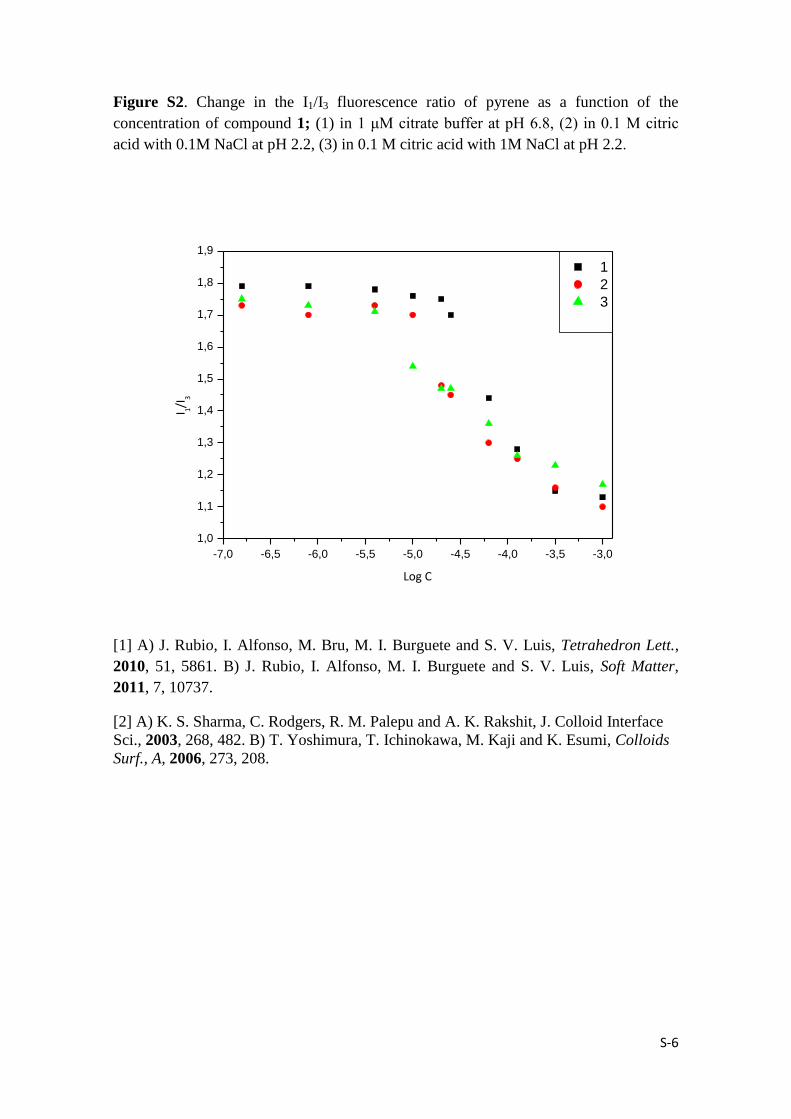
Calculation of the critical aggregation concentration (CAC) of compound 1: A
series of aqueous solutions containing different concentrations of compound 1 (10-3
M –
1.5 10-7
M) were prepared. Each solution (2 mL) was mixed with a saturated
recrystallized pyrene solution (2 mL) contained in small vials. The small vials were
tightly sealed at 25 ºC for more than two hours to achieve the equilibrium. Finally, the
measurements were carried out by steady state fluorescence spectroscopy and the
emission spectra were recorded (exc = 352 nm). The CAC was obtained by plotting the
ratio between the first and third band emission of the pyrene (I1/I3) versus the overall
concentration of 1 (in log scale) [2].
Stability studies:
●Long term effect: the previously prepared GAPs emulsion was left for more than 8
weeks and every week, the sphere photos were captured by optical microscope.
●Mechanical effect (centrifugal effect): the previously prepared GAPs emulsion was
centrifuged at 3000 rpm for 30 minutes. Every 5 or 15 or 30 minutes, an aliquot was
taken for measurement under the optical microscope and its photos were captured
Thermal effect: the previously prepared GAPs emulsion was heated at 45º C for four
months previous to its vesicles photos capture.
pH effect: the previously prepared GAPs emulsion was exposed to the acidic and basic
effect by the addition of 1 M HCl and 0.1 M NaOH respectively.
Thermolysin effect: 200 μL of thermolysin (1.5 mg / mL) was added to the previously
prepared GAPs emulsion. The enzymatically disassembled vesicles photos were
captured.
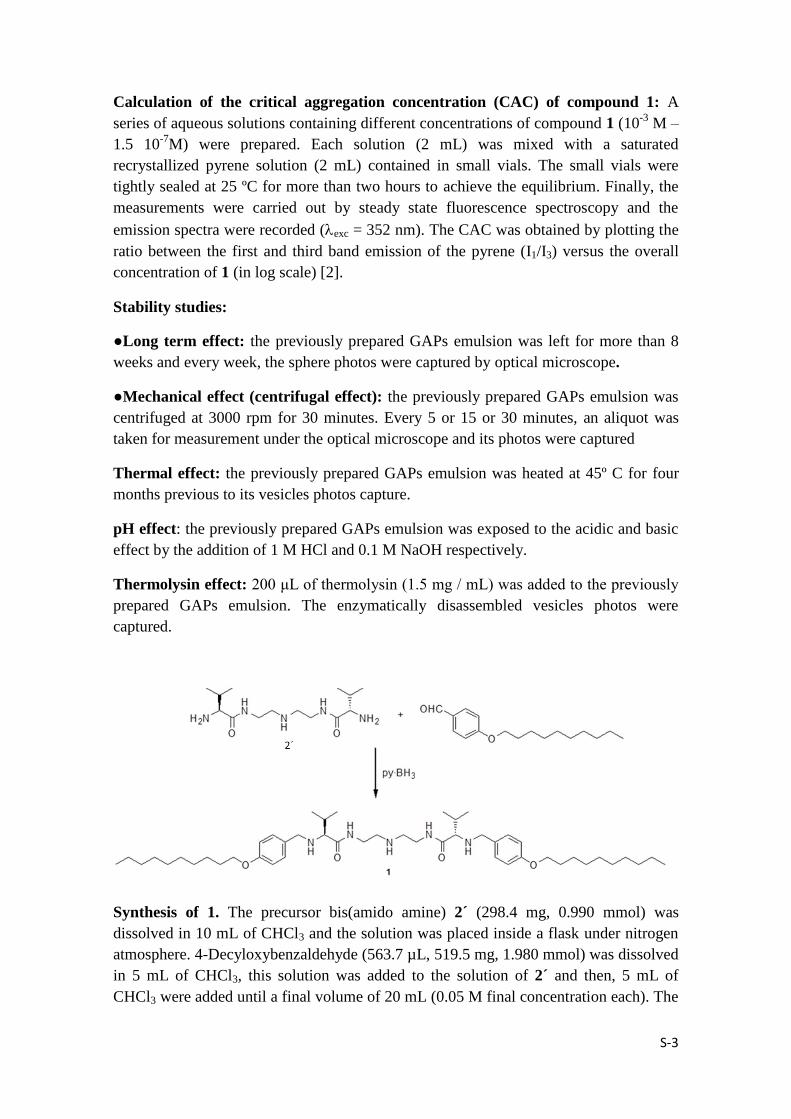
Synthesis of 1. The precursor bis(amido amine) 2´ (298.4 mg, 0.990 mmol) was
dissolved in 10 mL of CHCl3 and the solution was placed inside a flask under nitrogen
atmosphere. 4-Decyloxybenzaldehyde (563.7 µL, 519.5 mg, 1.980 mmol) was dissolved
in 5 mL of CHCl3, this solution was added to the solution of 2´ and then, 5 mL of
CHCl3 were added until a final volume of 20 mL (0.05 M final concentration each). The
S-4
mixture was stirred overnight, then a large excess of py·BH3 complex, 95% (1052.7 µL,
968.5 mg, 9.900 mmol) was carefully added at 35 ºC, and the mixture was allowed to
react for 24 h before being hydrolysed (conc. HCl, to acidity) and evaporated to
dryness. The residue thus obtained was dissolved in water, basified with 1N NaOH, and
extracted with CHCl3. The combined organic layers were dried (MgSO4) and
evaporated in vacuum. The product was purified by flash chromatography on silica gel
using CH2Cl2 as eluent, increasing slowly the polarity with MeOH and several drops of
aqueous ammonia.
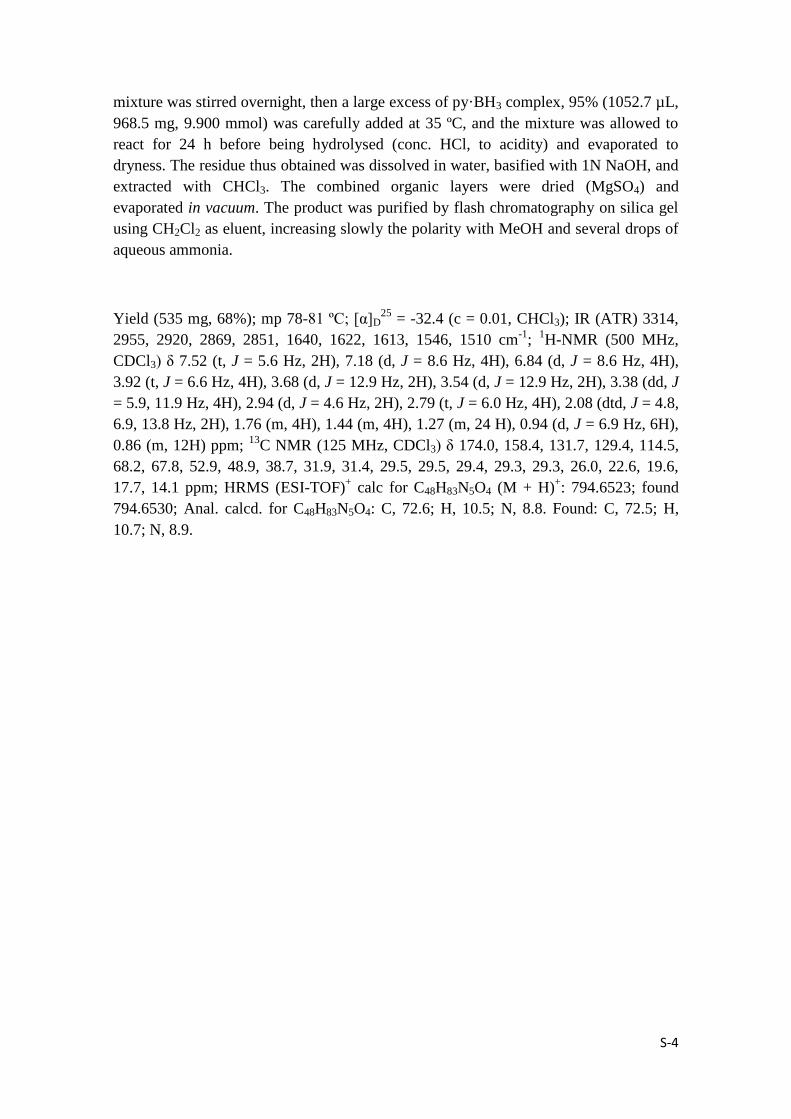
Yield (535 mg, 68%); mp 78-81 ºC; [α]D25
= -32.4 (c = 0.01, CHCl3); IR (ATR) 3314,
2955, 2920, 2869, 2851, 1640, 1622, 1613, 1546, 1510 cm-1
; 1H-NMR (500 MHz,
CDCl3) δ 7.52 (t, J = 5.6 Hz, 2H), 7.18 (d, J = 8.6 Hz, 4H), 6.84 (d, J = 8.6 Hz, 4H),
3.92 (t, J = 6.6 Hz, 4H), 3.68 (d, J = 12.9 Hz, 2H), 3.54 (d, J = 12.9 Hz, 2H), 3.38 (dd, J
= 5.9, 11.9 Hz, 4H), 2.94 (d, J = 4.6 Hz, 2H), 2.79 (t, J = 6.0 Hz, 4H), 2.08 (dtd, J = 4.8,
6.9, 13.8 Hz, 2H), 1.76 (m, 4H), 1.44 (m, 4H), 1.27 (m, 24 H), 0.94 (d, J = 6.9 Hz, 6H),
0.86 (m, 12H) ppm; 13
C NMR (125 MHz, CDCl3) δ 174.0, 158.4, 131.7, 129.4, 114.5,
68.2, 67.8, 52.9, 48.9, 38.7, 31.9, 31.4, 29.5, 29.5, 29.4, 29.3, 29.3, 26.0, 22.6, 19.6,
17.7, 14.1 ppm; HRMS (ESI-TOF)+ calc for C48H83N5O4 (M + H)
+: 794.6523; found
794.6530; Anal. calcd. for C48H83N5O4: C, 72.6; H, 10.5; N, 8.8. Found: C, 72.5; H,
10.7; N, 8.9.
S-5
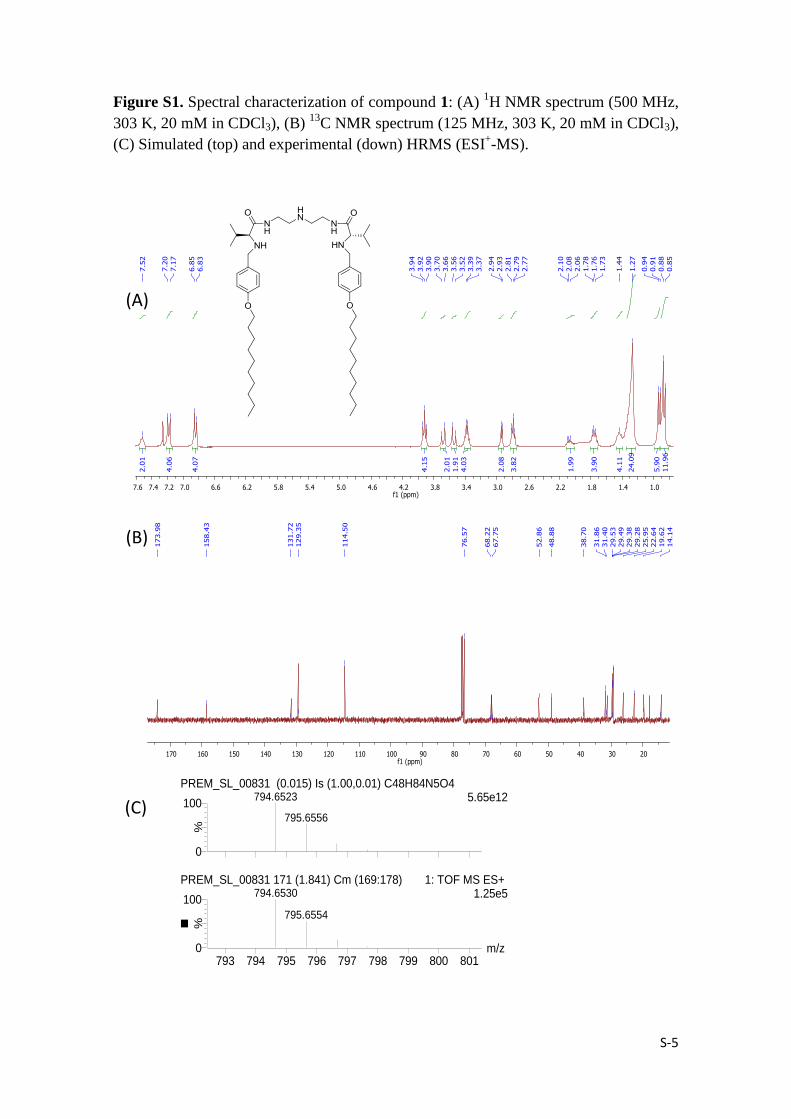
Figure S1. Spectral characterization of compound 1: (A) 1H NMR spectrum (500 MHz,
303 K, 20 mM in CDCl3), (B) 13
C NMR spectrum (125 MHz, 303 K, 20 mM in CDCl3),
(C) Simulated (top) and experimental (down) HRMS (ESI+-MS).
(A)
(B)
ahmed_1
m/z793 794 795 796 797 798 799 800 801
%
0
100
%
0
100
PREM_SL_00831 (0.015) Is (1.00,0.01) C48H84N5O45.65e12794.6523
795.6556
PREM_SL_00831 171 (1.841) Cm (169:178) 1: TOF MS ES+ 1.25e5794.6530
795.6554
(C)
S-6
Figure S2. Change in the I1/I3 fluorescence ratio of pyrene as a function of the
concentration of compound 1; (1) in 1 μΜ citrate buffer at pH 6.8, (2) in 0.1 M citric
acid with 0.1M NaCl at pH 2.2, (3) in 0.1 M citric acid with 1M NaCl at pH 2.2.
[1] A) J. Rubio, I. Alfonso, M. Bru, M. I. Burguete and S. V. Luis, Tetrahedron Lett.,
2010, 51, 5861. B) J. Rubio, I. Alfonso, M. I. Burguete and S. V. Luis, Soft Matter,
2011, 7, 10737.
[2] A) K. S. Sharma, C. Rodgers, R. M. Palepu and A. K. Rakshit, J. Colloid Interface
Sci., 2003, 268, 482. B) T. Yoshimura, T. Ichinokawa, M. Kaji and K. Esumi, Colloids
Surf., A, 2006, 273, 208.
-7,0 -6,5 -6,0 -5,5 -5,0 -4,5 -4,0 -3,5 -3,0
1,0
1,1
1,2
1,3
1,4
1,5
1,6
1,7
1,8
1,9
I 1/I3
Log C
1
2
3

S-7
the N,N-diethyldansylamide 2
Synthesis of 2. 0.275 g Dansyl chloride (yellowish solid, 1 mmol) was dissolved in 10
mL dried acetonitrile and added drop wise to an acetonitrile solution of diethyl amine (1
mmol).This mixture was reflux at 89 ºC over the night. A few drops 1N NaOH was
added to basify the medium and thus the residue obtained was extracted with
CHCl3.The combined organic layers were evaporated by the rotavap and then dried in
vacuum in order to get the semi-oily (pasty) greenish black compound 2 [3].
Yield ( 65%); 1H NMR (500 MHz, CDCl3) δ 8.44 (s, 1H), 8.23 (d, J = 8.7 Hz, 1H), 8.11
(d, J = 7.3 Hz, 1H), 7.44 (m, 2H), 7.10 (d, J = 7.5 Hz, 1H), 3.30 (d, J = 7.1 Hz, 4H),
2.81 (s, 6H), 1.02 (d, J = 7.2 Hz, 6H); 13C NMR (126 MHz, CDCl3) δ 151.6 (s), 135.6
(s), 130.1 (m), 129.4 (s), 127.8 (d, J = 14.4 Hz), 123.1 (d, J = 15.3 Hz), 119.7 (s), 115.1
(d, J = 12.7 Hz), 45.4 (q, J = 10.0 Hz), 40.9 (t, J = 8.3 Hz), 13.7 (q, J = 8.9 Hz); ESI-
MS m/z 307.3 (M+H+), 329.2 (M+Na
+), 345.2 (M+K
+).
[3] R. R. Naredla, D. A. Klumpp, Tetrahedron Lett, 2013, 54, 5945.

S-8
Figure S3. SEM micrographs of 1 grown from 1:1 MeOH : H2O at acidic pH values.
The corresponding scale bars are shown for every picture

S-9
Figure S4. TEM micrographs of 1 grown from 1:1 MeOH : H2O at acidic pH values.
The corresponding scale bars are shown for every picture.
A
C
B

S-10
Figure S5. AFM micrographs of 1 grown from 1:1 MeOH : H2O at acidic pH values.
The corresponding scale bars are shown for every picture
A
C
B

S-11
Figure S6. AFM profile analysis of two selected vesicles showing the width and height
of the microstructures
.
S-12
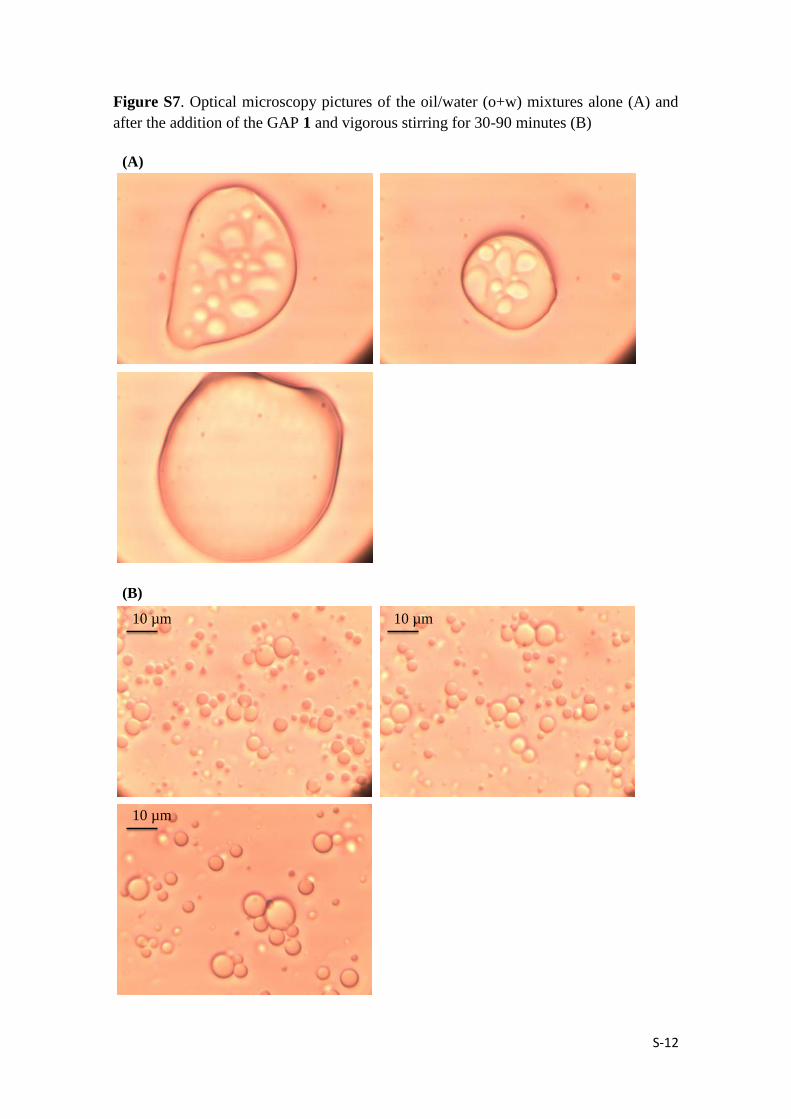
Figure S7. Optical microscopy pictures of the oil/water (o+w) mixtures alone (A) and
after the addition of the GAP 1 and vigorous stirring for 30-90 minutes (B)
(A)
(B)
10 µm10 µm
10 µm

S-13
Figure S8. Optical microscopy images of the emulsion formed by GAP 1 after one,
two, three, four, five, six, seven and eight weeks.
21
3 4
10 µm
10 µm 10 µm
10 µm
10 µm
6
7 8
5
10 µm10 µm
10 µm

S-14
Figure S9. Optical microscopy of o/w emulsion formed by GAP 1 after centrifugation
at 3000 rpm for 30 minutes; mechanical stability test (A) 5 min, (B) 10 min, (C) 15 min,
(D) 20 min, (E) 25 min and (F) 30 min.
D
B
C
10 µm
A
10 µm
10 µm
10 µm
E F
10 µm 10 µm
S-15
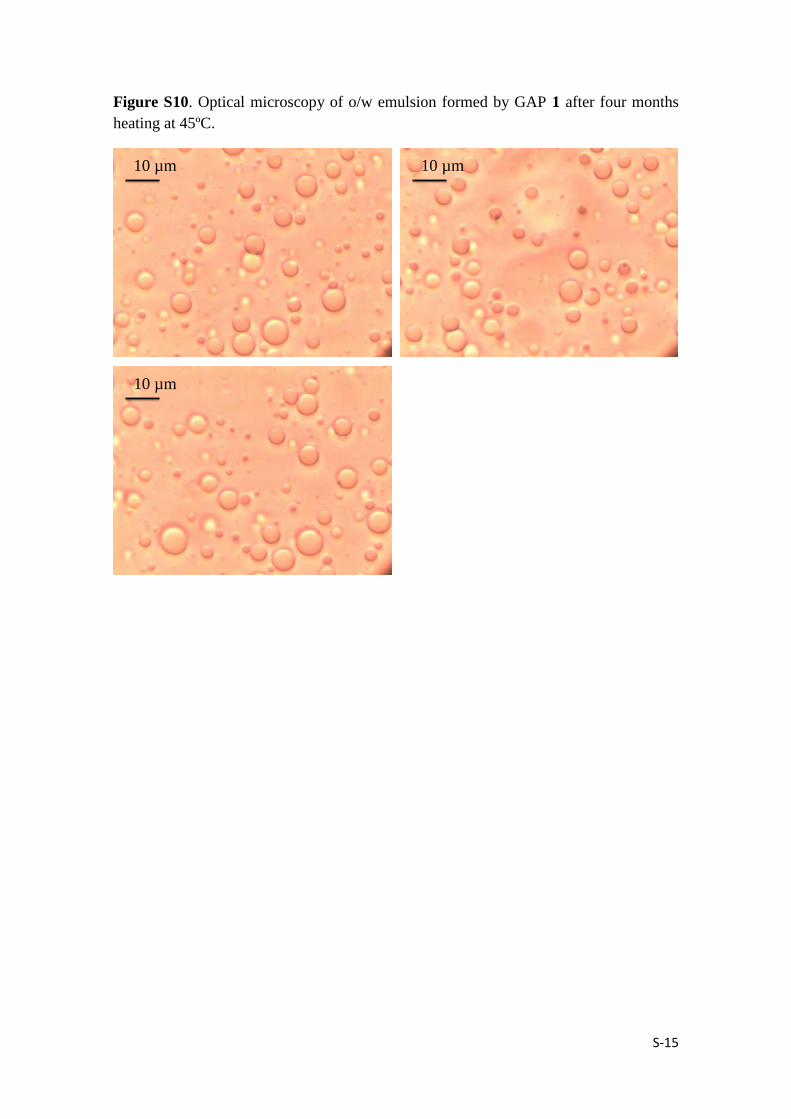
Figure S10. Optical microscopy of o/w emulsion formed by GAP 1 after four months
heating at 45ºC.
10 µm
10 µm
10 µm

S-16
Figure S11. Optical microscopy of o/w emulsion formed by GAP 1 in acidic medium:
pH 4 (A),pH 3 (B), pH 2 (C), pH 1 (D) and pH 0 (E&F)
A
DC
B
10 µm10 µm
10 µm10 µm
E F
10 µm10 µm

S-17
Figure S12. Optical microscopy of o/w emulsion formed by GAP 1 in basic medium
i.e. pH 10
.
10 µm
10 µm
10 µm
S-18
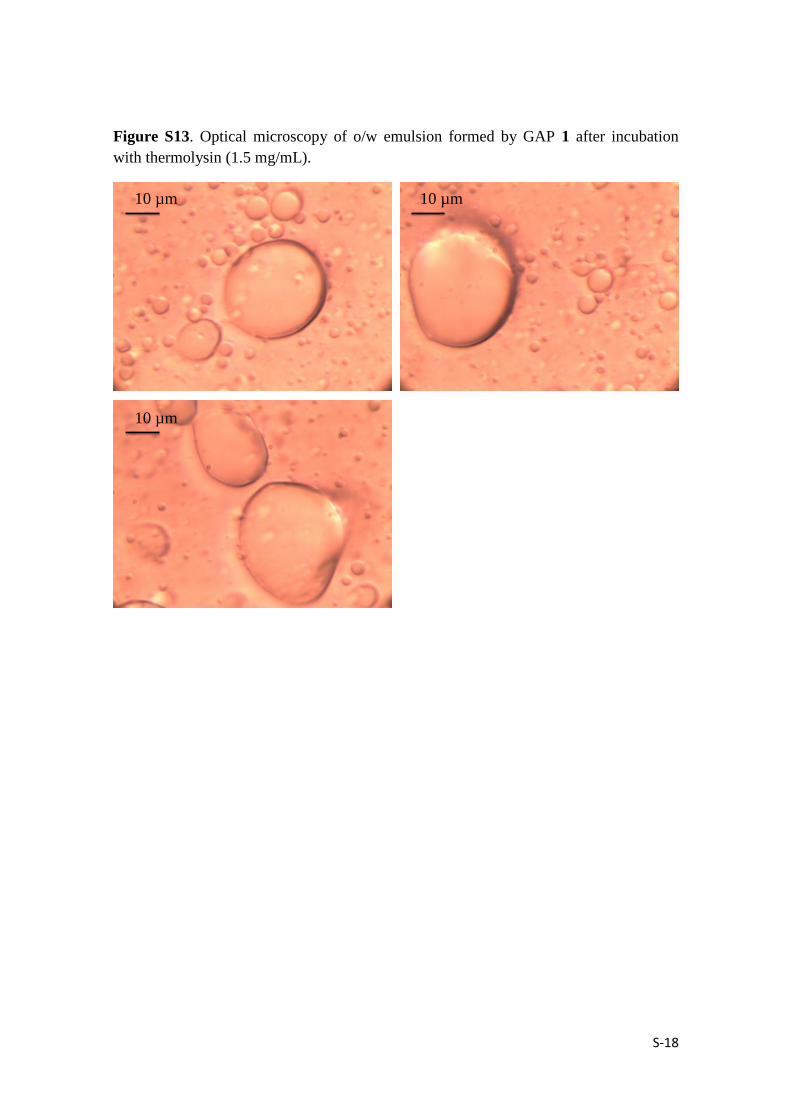
Figure S13. Optical microscopy of o/w emulsion formed by GAP 1 after incubation
with thermolysin (1.5 mg/mL).
10 µm
10 µm
10 µm

S-19
Figure S14. Size distribution diagram of GAPs vesicles in o/w emulsion
0
5
10
15
20
0 1 2 3 4 5 6 7 8
Diameter (m)