DEVELOPMENT OF TRANSIT ORIENTED DEVELOPMENT (TOD) MODEL...
12
Journal of Built Environment, Technology and Engineering, Vol. 1 (Sept.) ISSN 0128-1003 2016 36 DEVELOPMENT OF TRANSIT ORIENTED DEVELOPMENT (TOD) MODEL FOR MALAYSIA Arina Rahmat Department of Civil Engineering Universiti Teknologi MARA (UiTM), 40450 Shah Alam, Malaysia Email: [email protected], Tel: 017- 756 3600 Intan Rohani Endot Department of Civil Engineering Universiti Teknologi MARA (UiTM), 40450 Shah Alam, Malaysia Email: [email protected], Tel: 019- 210 5006 Zakaria Ahmad Department of Town and Regional Planning Universiti Teknologi MARA (UiTM), 40450 Shah Alam, Malaysia Email: [email protected], Tel: 019-2332995 Zaharah Ishak Department of Civil Engineering Universiti Teknologi MARA (UiTM), 40450 Shah Alam, Malaysia Email: [email protected], Tel: 0133643471 Che Khairil Izam Ibrahim Department of Civil Engineering Universiti Teknologi MARA (UiTM), 40450 Shah Alam, Malaysia Email: [email protected], Tel: 012-4947874 ABSTRACT Recently, Transit Oriented Development (TOD) is an increasingly popular concept of development to be implemented at all levels in the world. This concept has several advantages, especially for preserving the environment, hence improve the quality of life for future generations. This concept also helps the public transport system more effective and efficient. The aim of the study is to develop the TOD model. In order to achieve aims, several objectives had been identified, such as to identify and compare best practice of TOD in foreign countries and the suitability of its implementation in Malaysia. Identify the design process based on performance criteria for determining potential areas of TOD and to establish the performance criteria for potential of TOD. Methods of execution in the development of TOD model are divided into three stages, namely: Stage 1 is the data collection, which involves the collection of primary and secondary data throughout the site survey. Stage 2 is the analysis of the distribution of land use consists of commercial, housing and public facilities throughout the site survey by using Geographic Information System (GIS). Stage 3 is the process for development of the TOD model by using the Land Use Public Transport Accessibility Index (LUPTAI) techniques. The model combines the type of land use such as residential, commercial, shop offices, open space and public facilities where this concept emphasizes the walking distance and public transport user in an integrated manner. This situation allows the user to use transit services, public transport, walking and cycling to reduce congestion, air pollution and can help in avoiding urban sprawl occurring in high-density areas. Keywords: design process; performance criteria; transit oriented development; urban planning Introduction Transit Oriented Development (TOD) is a development concept that has been implemented in several countries such as Singapore, China, Australia, India and the United States. TOD is an integrated development of housing, offices, shopping and carrying out their daily activities. Indirectly, it can improve the economy and quality of life to lead more comfortable, and organized according to their respective capabilities (Calthorpe, 1994). Although, there were a lot of efforts and incentives by the Malaysian policies related to TOD were constructed under the 10th Malaysian Plan RMK-10 (Chapter 6), National Physical Plan (NPP), National Urban Plan (NUP) and draft Planning and Design Guidelines for Compact and Livable Development to encourage the use of public transportation, walking and cycling as an alternative to the main modes in this development, however it has not made headway. Practically, various issues pertaining to achieve the Malaysia Plan target is poor diffusion conventional strategies and method systematically to identify the location that is potential to be as TOD. This paper gives focus on this issue, concerning the aim of the study is to develop the TOD model. To achieve its objective study, outlined a number of objectives, namely to identify and compare best practice of TOD in foreign countries and the suitability of its implementation in Malaysia. In addition to identify the design process based on performance criteria for determining potential areas of TOD. Next to establish the performance criteria for the potential area to be as TOD.
Transcript of DEVELOPMENT OF TRANSIT ORIENTED DEVELOPMENT (TOD) MODEL...

Journal of Built Environment, Technology and Engineering, Vol. 1 (Sept.) ISSN 0128-1003 2016
36
DEVELOPMENT OF TRANSIT ORIENTED DEVELOPMENT (TOD) MODEL FOR MALAYSIA Arina Rahmat Department of Civil Engineering Universiti Teknologi MARA (UiTM), 40450 Shah Alam, Malaysia Email: [email protected], Tel: 017- 756 3600 Intan Rohani Endot Department of Civil Engineering Universiti Teknologi MARA (UiTM), 40450 Shah Alam, Malaysia Email: [email protected], Tel: 019- 210 5006 Zakaria Ahmad Department of Town and Regional Planning Universiti Teknologi MARA (UiTM), 40450 Shah Alam, Malaysia Email: [email protected], Tel: 019-2332995 Zaharah Ishak Department of Civil Engineering Universiti Teknologi MARA (UiTM), 40450 Shah Alam, Malaysia Email: [email protected], Tel: 0133643471 Che Khairil Izam Ibrahim Department of Civil Engineering Universiti Teknologi MARA (UiTM), 40450 Shah Alam, Malaysia Email: [email protected], Tel: 012-4947874
ABSTRACT
Recently, Transit Oriented Development (TOD) is an increasingly popular concept of development to be implemented at all levels in the world. This concept has several advantages, especially for preserving the environment, hence improve the quality of life for future generations. This concept also helps the public transport system more effective and efficient. The aim of the study is to develop the TOD model. In order to achieve aims, several objectives had been identified, such as to identify and compare best practice of TOD in foreign countries and the suitability of its implementation in Malaysia. Identify the design process based on performance criteria for determining potential areas of TOD and to establish the performance criteria for potential of TOD. Methods of execution in the development of TOD model are divided into three stages, namely: Stage 1 is the data collection, which involves the collection of primary and secondary data throughout the site survey. Stage 2 is the analysis of the distribution of land use consists of commercial, housing and public facilities throughout the site survey by using Geographic Information System (GIS). Stage 3 is the process for development of the TOD model by using the Land Use Public Transport Accessibility Index (LUPTAI) techniques. The model combines the type of land use such as residential, commercial, shop offices, open space and public facilities where this concept emphasizes the walking distance and public transport user in an integrated manner. This situation allows the user to use transit services, public transport, walking and cycling to reduce congestion, air pollution and can help in avoiding urban sprawl occurring in high-density areas. Keywords: design process; performance criteria; transit oriented development; urban planning
Introduction Transit Oriented Development (TOD) is a development concept that has been implemented in several countries such as Singapore, China, Australia, India and the United States. TOD is an integrated development of housing, offices, shopping and carrying out their daily activities. Indirectly, it can improve the economy and quality of life to lead more comfortable, and organized according to their respective capabilities (Calthorpe, 1994). Although, there were a lot of efforts and incentives by the Malaysian policies related to TOD were constructed under the 10th Malaysian Plan RMK-10 (Chapter 6), National Physical Plan (NPP), National Urban Plan (NUP) and draft Planning and Design Guidelines for Compact and Livable Development to encourage the use of public transportation, walking and cycling as an alternative to the main modes in this development, however it has not made headway. Practically, various issues pertaining to achieve the Malaysia Plan target is poor diffusion conventional strategies and method systematically to identify the location that is potential to be as TOD. This paper gives focus on this issue, concerning the aim of the study is to develop the TOD model. To achieve its objective study, outlined a number of objectives, namely to identify and compare best practice of TOD in foreign countries and the suitability of its implementation in Malaysia. In addition to identify the design process based on performance criteria for determining potential areas of TOD. Next to establish the performance criteria for the potential area to be as TOD.

Journal of Built Environment, Technology and Engineering, Vol. 1 (Sept.) ISSN 0128-1003 2016
37
Literature review TOD has been implemented in several countries such as Singapore, China, Australia, India and United States of America (USA). i. Singapore
Singapore, has improved their land transportation system since 2008 such as making public transport a choice mode by expanding the rail services at Boon Lay Extension, Circle Line with extension to Marina Bay and Downtown Line, North-South Line Extension and Tuas West Extension; improving bus services with greater bus priority on the roads and measures to reduce dwell time at bus stops. In addition, the service level of Rapid Transit System (RTS) has been improved because the new RTS routes take a long time to be prepared in order to meet the demands of public service. For instance, awaiting transit within 2 to 3 minutes during the morning peak on time and within 5 to 6 minutes during the afternoon (LTA, 2008).
As part of overall efforts to improve rail service reliability, the Land Transport Authority (LTA) has strengthened the Rapid Transit Systems (RTS) regulatory framework in four key areas, namely: (i) Maintenance of Rail Assets; (ii) Incident Management; (iii) Operating Performance Standards (OPS) and (iv) Penalty Framework. Otherwise, Singapore has implemented fully integrated distance fares since 2010 prior to support a more integrated public transport system. The benefits which could be gained from the implementation of distance fares is the transfer penalty was removed and all commuters pay fares based on the total distance travelled. In an attempt to develop a sustainable development in the transport system, LTA will continue to review the Electronic Road Pricing (ERP) system and has taken initiative of managing road usage by enhancing the effectiveness of the ERP system to improve its efficacy. In 2013, LTA has upgraded all existing bus interchanges by expanding barrier-free accessibility and about half of our public buses are now wheelchair-accessible. By providing more and better bicycle parking facilities at MRT stations and bus interchanges. For example, fordable bicycles allowed on trains and buses during off-peak hours and has been implemented in 2009 (LTA, 2008).
ii. China
The studies were conducted by Christian Bruce, 2012, TOD concept comes from developing countries such as Europe and the United States and has received much attention in China. Some important aspects of the concept of TOD in China are the density, diversity, design, destination accessibility and the proximity to transit stations (distance to transit). In Guangzhou, there are Urban Metro Rail System in five important cities in China, namely Beijing, Shanghai, Tianjin, Shenzhen, and Nanjing (Peng et al., 2012). Meanwhile, in line with the rapid development in Guangzhou, they prioritize how to live a healthy and safe by introducing 'Greenways Project'. It is a safe infrastructure for pedestrians and cyclists. There are 8 principles that are used in China, namely: (1) Encourage users to walk (Walk), (2) The promotion of non-motorized vehicles (Cycle), (3) Creating a balanced network of roads with pavements (Connect), (4) Placing development near public transport quality (Transit), (5) Designing a diversity of land use (Mix), (6) Optimising density and capacity transit (Densify), (7) Establish an area with a short trip (Compact), (8) Changing the mode of transport to non-motorized vehicles such as cycling and walking (Shift) (ITDP China, 2013). Meanwhile, the MTR train system in Hong Kong is one of the most efficient railways in the world. By providing residential purposes with an attractive option of public transport, TOD has the potential to offer a better alternative to private transport in urban areas by improving the quality of life of the population. The Hong Kong MTR also includes Hong Kong Island, Kowloon and the New Territories (Karen, 2000). iii. Australia
TOD in Australia aims to focus on jobs, housing, services and facilities around major transit facilities, especially railway stations. It is also a strategy to reduce dependence on the automobile and promote sustainability. In addition, it also promotes urban structure that supports and integrates economic, social and environmental sustainability. The method of Land Use Public Transport Accessibility Index (LUPTAI) is one of the method that used for study in Gold Coast, Australia (Pitot et al. 2005). There are four principles that are given attention, namely, (1) Composite Index, (2) Population and Dwelling Targets, (3) Public Transport Infrastructure / Service Provision, (4) Public Transit. Meanwhile, The State of Queensland Transport (2005) used Geographic Information System (GIS) application system as a method to analyse the data from site survey (Warren Rowe, 2008). Department of Infrastructure and Planning in Queensland, Australia (2005) identified six principles of TOD which are Location (Infrastructure and Service Levels, Development levels, New development); Land Use (Type, Extent, Density, Intensity, Mix, Continuity); Design (Adaptability, built form, Public Realm, Integration, Safety and Accessibility, Parking); Transport (Mode share and transport efficiency); Social (Social Diversity and Inclusion); and Process (Coordination, Community Engagement, Timeframes). In Western Australia, have implemented policies and programs to facilitate cooperation between government bodies to promote TOD. In developing areas of pedestrian activity around the train station is not a new concept, but it is a popularity. Dunphy (2003) suggested with 10 principles for development around transit, namely, (1) Develop the region to be better with the right vision (2) Using the power of partnership (partnership) (3) Thinking about development when thinking about transit (4) Getting the right parking (5) Build a place, not a project (6) Encourage the development of the current market, not driven by transit (7)

Journal of Built Environment, Technology and Engineering, Vol. 1 (Sept.) ISSN 0128-1003 2016
38
The diversity order, not necessarily the same in all locations (8) To make buses as a great idea (9) Encourage every corner of the prices for live around transit (10) Making themselves as corporate focus. iv. Ahmedabad Janmarg, India
Ahmedabad Railway Station is the main railway station and it is also the largest and most vibrant railway station in Gujarat, India. In addition, it accounts for the second highest generating income for Western Railway parts of Mumbai. The main railway station in Ahmedabad, also known as Ahmedabad Junction Railway Station or Kalupur Railway Station, which is the main station for urban railway transport in Ahmedabad in Gujarat, India. Urban growth has led to improved quality of service to existing modes of transport in this country. The growing nature of the city has forced a rethink on the existing transport modes within the city (Srikanth, 2010). Therefore, none of the existing modes available that can satisfy the demand of users in this city. In order to overcome this, the authority already takes an action to invest the BRT system which known as Ahmadabad Bus Rapid Transit System (BRTS). The BRTS began operation in October 2009. Some 155 kilometres have been identified for this ART corridor and it will be complete with three phases. Technically, the network expanded to 89 kilometres for this Ahmedabad BRTS by December 2015 with daily ridership of 1,32,000 passengers. BRTS won several nations and international awards for design, implementation and operation and it was rated Silver on BRT standard in 2013 (UNFCC, 2009). v. The United States of America (USA)
City planners and transportation planners particularly hoping that this Transit Oriented Development (TOD) concept will encourage the use of transit, increase housing opportunities, promoting a mode of walking and cycling as well as facilitate the renewal of a neighbourhood center. For example, at present, there are approximately 100 neighbourhood TOD concept in the United States (Cervero et al, 2004). But there are many positive and negative issues that can prove the validity of the concept plan submitted by the city planner for the Transit Oriented Development (TOD). It shows from the that has been made by Lund (2006), examine the reasons why people in a neighbourhood centre choose to stay in the neighbourhood of Transit Oriented Development (TOD) and its relation to the use of transit. In this study, Lund (2006) has carried out "Household survey" involved 605 respondents against the people who had moved to the neighbourhood of Transit Oriented Development (TOD) centre concept within "walking distance" of rail transit stations in the region. The findings of the study revealed that easy access to transit is one of the three main reasons that cause them to choose to live in TOD concept of neighbourhood centres (Journal of the American Planning Association, 2006). There are five criteria that were used in the study in Calgary, United States of America, namely: (1) Transit Supportive Land Use; (2) Density Around Transit Stations; (3) Pedestrian-Oriented Design; (4) Make each station area a “place”; (5) Manage parking, bus and vehicular traffic (Calgary Land Use and Planning Policy, 2004). Methodology And Tools This section describes the technique use in selecting the potential area for TOD in Selangor. The methods of execution in the development of TOD model are divided into three stages, namely: Stage 1: Method of Data Collection The collection of data which involves the collection of primary and secondary data throughout the site survey. The primary data that results from the site study and can be done in accordance with the set path of bus and train routes. Data were collected by using a checklist and scoreboard (Table 1 and Table 2) for site visits. Secondary data are regarded to the study area that obtained from the local government. It is consisting of (1) Technical report from the Local Authority (LA); (2) Distribution of land use data of commercial, residential and public facilities around the site area and (3) Data regarding to the rail and bus routes in the site area.
Table 1: The checklist to determine the location of TOD in Selangor, Malaysia

Journal of Built Environment, Technology and Engineering, Vol. 1 (Sept.) ISSN 0128-1003 2016
39
Phase Indicators Weak Low Moderate High
Radius (meter) >700m 500m < x ≤ 700m 250m < x ≤500m ≤ 250m
1
LA
ND
USE
Commercial Maximum plot ratio in Negeri Selangor is 1:4 Source: RSN Selangor (Draft) 2035
x Within >700m x High/Low Density
x Within 500m < x ≤ 700m
x Within 250m < x ≤ 500m Plot Ratio 1:3
x High Density
x Within ≤ 250 m
x Plot Ratio > 1:4 x High Density
Residential Density of Population 1 km² = 100 hec 60 unit/hec Source: Manual Garis Panduan dan Piawaian Perancangan Negeri Selangor. RSN Selangor (Draft) 2035
x Within >700m
x Density High/Low
Eg: x Terrace Housing /
Semi Detached x Detached x Apartment
x Within 500m < x ≤ 700m
x High Density
Eg: x Terrace Housing /
Semi Detached x Detached x Apartment
x Within 250m < x ≤ 500m
x Plot Ratio 1:4 x High Density
Eg: x Terrace Housing /
Semi Detached x Detached x Apartment
x Within ≤ 250m x Plot Ratio > 1:4 x High Density
Eg: x Terrace Housing /
Semi Detached x Detached x Apartment
Public facilities Density: 1 km² = 100 hec Source: Manual Garis Panduan dan Piawaian Perancangan Negeri Selangor. RSN Selangor (Draft) 2035
x Within >700m walking distance
x School PS:Class =1:25 SS:Class =1:25 3,000 population (12 classroom) 10,800 population (40 classroom)
x Hospital : bed:ppl 1:5
x Within 500m < x ≤ 700m walking distance
x School PS:Class =1:25 SS:Class =1:25 3,000 population (12 classroom) 10,800 population (40 classroom)
x Hospital : bed:ppl 1:5
x Within 250m < x ≤ 500m walking distance
x School PS:Class =1:25 SS:Class =1:25 3,000 population (12 classroom) 10,800 population (40 classroom)
x Hospital : bed:ppl 1:5
x Within ≤ 250 m walking distance
x School PS:Class =1:25 SS:Class =1:25 3,000 population (12 classroom) 10,800 population (40 classroom)
x Hospital : bed:ppl 1:5
*(Area [km2/percentage [%])

Journal of Built Environment, Technology and Engineering, Vol. 1 (Sept.) ISSN 0128-1003 2016
40
Table 2: The scoreboard to determine the location of TOD in Selangor, Malaysia
SCOREBOARD 1 POINT 2 POINT 3 POINT 4 POINT Weak (25%) Low (50%) Moderate (75%) High (100%)
2 W
AL
KIN
G
DIS
TA
NC
E WALKING DISTANCE
General walking distance is about 5 minutes or 200m Sumber: O’Sullivan (1996); Manual Garis Panduan dan Piawaian Perancangan Negeri Selangor
>400m walking 10 minute
400m < x ≤ 600m walking; 7.5 minute
200m < x ≤ 400m walking; 5 minute
≤ 200m walking 2.5 minute
Distance and time walking distance from transit station Distance to achieve public transportation Distance and time walking distance connect with the other land use
3 PA
RK
ING
SPA
CE
PARKING SPACE Source: Manual Garis Panduan dan Piawaian Perancangan Negeri Selangor
>600m walking 10 minute
400m < x ≤ 600m walking; 7.5 minute
200m < x ≤ 400m walking; 5 minute
≤ 200m walking 2.5 minute
Walking Distance to Park and Ride Walking Distance to Parking Area Walking Distance to Motorcycle Parking Area On Street Parking ≥ 35% from site < 35% from site < 25% from site < 15% from site Total of Private Car Total of Motorcycle Off Street Parking < 20% from car park < 40% from car park < 60% from car park > 80% from car park Total of Private Car Total of Motorcycle
4 R
AN
GE
OF
CA
R P
AR
K THE CHARGE RATE OF CAR PARK
Source: Manual Garis Panduan dan Piawaian Perancangan Negeri Selangor < 31% rates <30% rates <20% rates 100% rates
According to the rates set by the Council Parking area in residential area, commercial area
Except in the local authority’s area or private parking area
5 SA
FET
Y U
RB
AN
D
ESI
GN
SAFETY AND URBAN DESIGN Source: Manual Garis Panduan dan Piawaian Perancangan Negeri Selangor < 30% from overall <50% from overall <74% from overall >75% from overall
Pedestrian walkways provided with shading and shelter Pedestrian walkways provided with safety infrastructure or bollard and railing etc.
Pedestrian walkways are continuously Pedestrian walkways connected with bus station and lay by bus and taxi station
Pedestrian walkways provided with shaded tree, hardscape and landscape
Total (%)
Total Overall
Journal of Built Environment, Technology and Engineering, Vol. 1 (Sept.) ISSN 0128-1003 2016
41
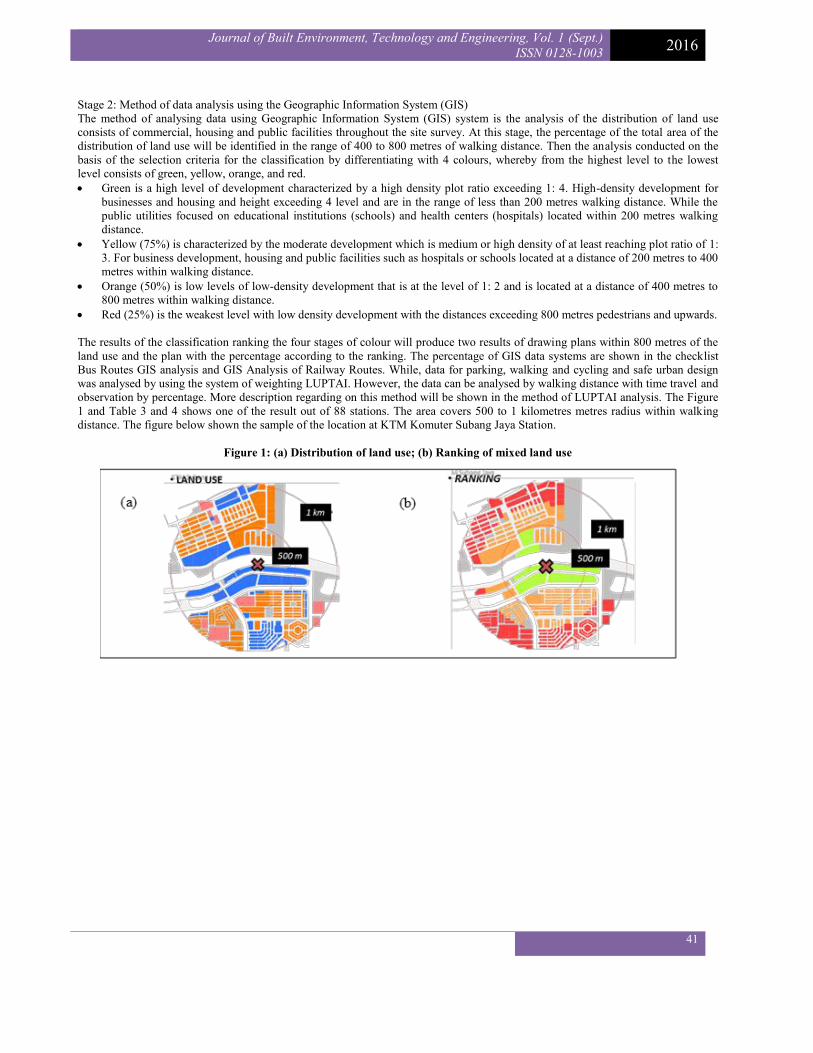
Stage 2: Method of data analysis using the Geographic Information System (GIS) The method of analysing data using Geographic Information System (GIS) system is the analysis of the distribution of land use consists of commercial, housing and public facilities throughout the site survey. At this stage, the percentage of the total area of the distribution of land use will be identified in the range of 400 to 800 metres of walking distance. Then the analysis conducted on the basis of the selection criteria for the classification by differentiating with 4 colours, whereby from the highest level to the lowest level consists of green, yellow, orange, and red. x Green is a high level of development characterized by a high density plot ratio exceeding 1: 4. High-density development for
businesses and housing and height exceeding 4 level and are in the range of less than 200 metres walking distance. While the public utilities focused on educational institutions (schools) and health centers (hospitals) located within 200 metres walking distance.
x Yellow (75%) is characterized by the moderate development which is medium or high density of at least reaching plot ratio of 1: 3. For business development, housing and public facilities such as hospitals or schools located at a distance of 200 metres to 400 metres within walking distance.
x Orange (50%) is low levels of low-density development that is at the level of 1: 2 and is located at a distance of 400 metres to 800 metres within walking distance.
x Red (25%) is the weakest level with low density development with the distances exceeding 800 metres pedestrians and upwards.
The results of the classification ranking the four stages of colour will produce two results of drawing plans within 800 metres of the land use and the plan with the percentage according to the ranking. The percentage of GIS data systems are shown in the checklist Bus Routes GIS analysis and GIS Analysis of Railway Routes. While, data for parking, walking and cycling and safe urban design was analysed by using the system of weighting LUPTAI. However, the data can be analysed by walking distance with time travel and observation by percentage. More description regarding on this method will be shown in the method of LUPTAI analysis. The Figure 1 and Table 3 and 4 shows one of the result out of 88 stations. The area covers 500 to 1 kilometres metres radius within walking distance. The figure below shown the sample of the location at KTM Komuter Subang Jaya Station.
Figure 1: (a) Distribution of land use; (b) Ranking of mixed land use

Journal of Built Environment, Technology and Engineering, Vol. 1 (Sept.) ISSN 0128-1003 2016
42
Table 3: Distribution of land use
Table 4: Ranking of mixed land use
Stage 3: The process for development of the TOD model by using the Land Use Public Transport Accessibility Index (LUPTAI) techniques. The third stage is the method of data analysis system by using the Land Use Public Transport Accessibility Index (LUPTAI) techniques. LUPTAI aims to simplify analysing methods for accessibility by taking into consideration the distance to educational institutions, health, business, housing and public transportation or walk (Pitot et al, 2005). Analysing the data by using the LUPTAI weighting system has its own value and the analysis is based on the scoreboard set. This stage is the combinations of stage 1 and 2 which includes of data analysis, data of GIS and a scoreboard. The model combines the type of land use such as residential, commercial, shop offices, open space and public facilities where this concept emphasizes the walking distance and public transport user in an integrated manner. Result And Findings Scoreboard is based on the method of determining the TOD score assigned by the selection criteria of the TOD area as shown in Table 5. Selection is determined by area and the percentage in each of the five criteria of land use which consists of commercial, housing and public facilities, walking or cycling mode, parking and urban design form. The determination of the site of Transit Oriented Development (TOD) has been identified based on a 2 stages techniques as above. As a result, there are 88 potential TOD areas that have been identified in four colour level ranking was developed by the GIS system (as shown in the appendix). Analysis of the percentage of each class will be judged by the colour of preference to green (high). All the analysis that has been designated by the GIS system will be prepared based on the highest percentage, followed by the low percentage to obtain accurate data collection analysis for potential TOD centers. The results of the data collection and analysis are based on the land use GIS distribution and the ranking for rail and bus routes.
Table 5: The result of scoreboard set of the LUPTAI weighting system of Subang Jaya Station
Distribution of Land Use Mixed Land Use Area (km2) Percent (%) Commercial 0.368 44.07 Housing 0.442 52.93 Public Facilities 0.025 2.99 Total 0.835 km2 100
Ranking Level Weak Low Moderate High
Area/Percent km2 % km2 % km2 % km2 % Mixed Land Use
A Commercial 0.210 57.07 - - - - 0.158 42.93 Housing 0.360 81.45 0.082 18.55 - - - - Public Facilities 0.006 24 0.019 76.00 - - - -
Total (km2/100) 0.58 162.52 0.1 94.55 - - 0.158 42.93 Total (A+300x100%) - 54.17 - - - - - 14.31
Ranking Level Weak Low Moderate High
Mixed Land Use Area/Percent km2 % km2 % km2 % km2 %
A
Commercial 0.210 57.07 - - - - 0.158 42.93 Housing 0.360 81.45 0.082 18.55 - - - - Public Facilities 0.006 24 0.019 76.00 - - - - Total (km2/100) 0.58 162.52 0.1 94.55 - - 0.158 42.93 Total (A+300x100%) - 54.17 - - - - - 14.31

Journal of Built Environment, Technology and Engineering, Vol. 1 (Sept.) ISSN 0128-1003 2016
43
Meanwhile, the total of 88 locations has been identified by using LUPTAI techniques as potential to be as TOD areas (as shown in the appendix), it has been sort down to only 27 locations all over Selangor which suited the criteria listed from the previous analysis. The list of 27 locations are shown in the Table 6 as below:
Table 6: The list of 27 locations of TOD potential areas
• Innovation This LUPTAI tool is innovative and representative of the determination of potential areas of TOD. Meanwhile, it also makes the public transport system more effective, efficient and protect the environment while enhancing the quality of life for future generations. This concept is the best practice that it builds on the principles of existing accessibility to create a first in Malaysia and one of the tools existing elsewhere. • Advantages This concept prevents urban sprawl from happening and to reduce traffic congestion and air pollution. Meanwhile, it also can form a variety of benefits at the local level and by encouraging the development of feature walkability, compact and infill development. • Entrepreneurship This technique has the potential to create greater sales as well as can be applied by the Department of Town and Country Planning, Local authority, Land Public Transport Commission and Consultant as well as support the local business by achieving an appropriate provision and level of public transport. Conclusions The development of Transit Oriented Development (TOD) model has been proposed with the aim of developing the TOD model and of determining potential areas of TOD. The development of TOD model and determining the potential areas itself can be executed through three stages, which are the following: data collection, analyzing the distribution of land use and the Land Use Public Transport Accessibility Index (LUPTAI) techniques. The development of TOD model introduces checklist and scoreboard of detailed requirements which can be used as a guide to determining the potential areas of TOD process itself. In fact, the method has also the aim of being an effort in providing the suitability of the implementation of TOD concept for creating a systematic and comprehensive implementation of transit stations in urban areas to overcome the problem and conflict of traffic congestion. i.e. it can be used as a guide to determine the potential areas of TOD by local government or planners to solve the problem of rapid and massive urbanization recently. I believed that the proposed model has also the effect of increasing the level of implementation of project development in the transport planning phase, as detailed requirements of the determining the potential areas of TOD process.
Level Percentage Weak Low Moderate High
B
2 Walking Distance - - - 100 3 Parking Area - - - 100 4 Safety Urban Design - - - 100 Total (%) - - - - (B ÷ 300) x 100% - - - -
A+B 54.17 31.52 - 114.31
(A+B ÷ 200) x 100% 27.09 15.76 - 57.16
TOD Potential Areas Mass Rapid Transit (MRT) Routes KTM Commuter Routes Light Rapid Transit (LRT) Routes
1. Kota Damansara 1. Subang Jaya 1. Taman Bahagia 2. Taman Cuepacs 2. Petaling 2. Taman Jaya 3. Bandar Kajang 3. Klang 3. Taman Melati 4. The Curve 4. Serdang 4. Cahaya 5. One Utama 5. Setia Jaya 5. Ara Damansara 6. Balakong 6. Kajang 6. Taman Paramount 7. Bandar Tun Hussein Onn 7. Shah Alam 7. Universiti 8. Taman Sunway 8. Sungai Buloh 8. Putra Height 9. Taman Suntex 9. Seri Setia 9. Ampang

Journal of Built Environment, Technology and Engineering, Vol. 1 (Sept.) ISSN 0128-1003 2016
44
The purposed development of TOD model is based on the three (3) stages requirements identified from pertinent literature and existing standards. A model and the weightage of indicators has been developed and the weighted sum of every level in each criteria has been indicated to be the Development of TOD model of the evaluated schedule. It is believed that a main result has been the description of the best potential areas for TOD development and will achieve comprehensive implementation of TOD in Selangor state listed in the appendix (Table 1A), which is seen as inspired by the existence of communication network infrastructure and efficient public transport services, as well as municipal development is concentrated in the central area transit. Therefore, from these findings, the policy maker will learn systematically of the implementation of TOD. The implementation of this study prior to the needs and objectives which can make comparisons of the TOD’s best practice implement by the foreign countries and the suitability of its implementation in this state. Additionally, it is necessary to allows the user to use transit services, public transport, walking and cycling as well as to reduce congestion, air pollution and can help in avoiding urban sprawl occurring in high-density areas. Finally, since the development of TOD model focused on the public transportation in Selangor, further research should be conducted in other state and on the other types of transportation project by applying the same research method for comparative purposes. ACKNOWLEDGEMENTS The authors wish to acknowledge the financial support by the Selangor Town and Country Planning Department and Malaysia Institute of Transport (MITRANS). This research was supported by the Universiti Teknologi MARA (UiTM), Shah Alam, Malaysia. References C. Bruce (2012). Transit-Oriented Development in China: Designing A New Transit-Oriented Neighbourhood in Hexi New Town,
Nanjing, Based On Hong Kong Case Studies. Urban Design Program, China & Europe Blekinge Institute of Technology and Nanjing Forestry University Nanjing, China.
Calthorpe Peter (1994). The Next American Metropolis: Ecology, Community, and Planning. Princeton, NJ, Princeton Architectural Press.
Cervero, R., Murphy, S., Ferrell, C., Goguts, N., Tsai, Y.H., Arrington, G.B., Boroski, J., Smith-Heimer, J., Golem, R., Peninger, P., Nakajima, E., Chui, E., Dunphy, R., Myers, M., & McKay, S. (2004). Transit-Oriented Development in the United States: Experiences, Challenges, and Prospects. Transit Cooperative Research Program (TCRP) Report 102, published by the Transportation Research Board, Washington.
Draft Rancangan Struktur Negeri Selangor 2035 (2015). Jabatan Perancangan Bandar dan Desa. Dunphy. R et al. (2003). Ten Principles for Successful Development Around Transit. Urban Land Institute. Washington, D.C.: ULI–
the Urban Land Institute, 2003. Institute for Transportation and Development Policy (ITDP) China, 2013. TOD Standard v1.0. ITDP China. Karen, 2000. Bus routing strategies in a transit oriented city: a case study of Kowloon Motor Bus (1975-1986). The University of
Hong Kong. Land Transport Authority (2008). Improvements to Singapore’s Land Transport System. Ministry of Transport (MOT), Singapore. Lund, H. (2007). Reasons for Living in a Transit-Oriented Development, and Associated Transit Use. Journal of the American
Planning Association (2006). Volume 72. Issue 3. Pg. 357-366. Lund, H., R. Cervero, and R.W. Wilson (2004). Travel Behaviour of Transit-oriented Development in California (Final Report).
Sacramento: California Department of Transportation. Manual Garis Panduan dan Piawaian Perancangan Negeri Selangor: Edisi Kedua (2013) O'Sullivan, Sean and John Morrall (1996). Walking Distances to and from Light-Rail Transit Stations. Transportation Research
Board, Washington, D.C. Pitot. M et al. (2005). Land Use & Public Transport Accessibility Index (LUPTAI) Tool - The development and pilot application of
LUPTAI for the Gold Coast. The State of Queensland (Queensland Transport) 2005. 29th Australasian Transport Research Forum.
Queensland Department of Transport (2005). Draft TransLink Network Plan South East Queensland: 3 Year Program 2004-2005 to 2006-2007.
Queensland Government (2005). South East Queensland Regional Plan 2005-2006. Government, Brisbane, Queensland Government. Rowe. W (2008) Is Transit Oriented Development (TOD) the answer? Buckley Vann, Town Planning Consultants. Srikanth Shastry (2010). Spatial Assessment of Transit Oriented Development in Ahmedabad, India. University of Twente, ITC The City of Calgary Land Use Planning Policy (2004). Attachment1: Transit Oriented Development Policy Guidelines. United Nations Framework Convention on Climate Change (2009). Ahmedabad, Bus Rapid Transit system, Janmarg from
Momentum for Change. Ahmedabad Municipal Corporation, CEPT University.

Journal of Built Environment, Technology and Engineering, Vol. 1 (Sept.) ISSN 0128-1003 2016
45
APPENDIX
Table A1: The location of potential areas of TOD (station)
No The Location of Potential TOD (station) Location Weak Low Moderate High
1 Kota Damansara MRT 36.91 5.64 - 57.46 2 Subang Jaya KTM 27.09 15.76 - 57.16 3 Taman Cuepacs MRT 23.34 18.32 1.05 57.30 4 Bandar Kajang MRT 31.81 13.56 - 54.63 5 The Curve MRT 35.72 13.89 - 50.38 6 Petaling KTM 12.12 23.63 14.25 50.00 7 One Utama MRT 24.28 15.32 10.41 50.00 8 Taman Bahagia Kelana Jaya Line 33.52 8.76 7.69 50.00 9 Taman Jaya Kelana Jaya Line 28.38 13.38 7.17 50.00 10 Balakong MRT 31.36 13.03 5.60 50.00 11 Bandar Tun Hussein Onn MRT 31.57 15.42 3.01 50.00 12 Taman Sunway MRT 39.28 8.04 2.68 50.00 13 Taman Suntex MRT 36.78 11.24 1.86 50.00 14 Saujana Impian MRT 24.77 25.24 - 50.00 15 Taman Mesra MRT 24.80 25.21 - 50.00 16 Kampung Baru Sungai Buloh MRT 34.70 17.31 - 50.00 17 Sungai Buloh MRT 30.79 14.32 - 50.00 18 Kajang MRT 38.77 11.23 - 50.00 19 Klang KTM 39.10 10.91 - 50.00 20 Taman Koperasi MRT 44.79 5.21 - 50.00 21 Serdang KTM 37.88 6.34 - 39.12 22 Taman Melati LRT Extension 21.42 3.67 19.14 39.11 23 Setia Jaya KTM 35.01 12.21 9.21 35.25 24 Cahaya Ampang Line 40.41 7.89 13.27 34.27 25 Kajang KTM 34.89 15.11 12.50 33.33 26 PJU5 MRT 27.96 5.04 12.85 29.17 27 SMK Taman Selayang KL-Tanjung Malim 38.45 6.14 12.50 26.25 28 RRI MRT 39.97 10.04 - 25.00 29 Ara Damansara LRT Extension 18.95 15.66 15.60 24.81 30 Sek. Men. Teknik Klang KL-Sepang 26.43 15.07 12.96 24.72 31 Jusco Bukit Tinggi KL-Sepang 30.03 12.92 15.53 20.68 32 Sekolah Tengku Ampuan Rahimah KL-Sepang 35.32 0.77 12.50 20.58 33 Shah Alam KTM 42.34 3.92 25.00 20.42 34 Taman Paramount Kelana Jaya Line 38.14 16.15 12.82 20.40 35 Convent Tengku Kelana KL-Sepang 39.14 10.64 12.50 16.67 36 Kompleks Amaniah KL-Tanjung Malim 33.14 32.18 1.36 16.67 37 Simpangan Jalan Duku KL-Sepang 26.67 19.44 - 16.39 38 Universiti Kelana Jaya Line 38.30 - 10.65 16.39 39 Kolej MARA KL-Beranang 33.88 15.33 - 13.56 40 Kajang Prima KL-Beranang 24.33 13.95 12.50 13.30 41 Masjid Al-Jamiyah KL-Sepang 23.15 18.39 12.50 13.00 42 Masjid Al-Rahimah KL-Sepang 37.46 7.13 12.50 12.63 43 Sungai Buloh KTM 41.70 8.49 - 9.58 44 Klang Parade KL-Sabak 31.10 19.42 12.50 8.14 45 Taman Dato Hormat KL-Sepang 35.55 15.31 25.00 7.80 46 Hospital Kajang KL-Beranang 35.55 27.09 - 7.48 47 Kedai Jubin KL-Beranang 41.32 11.55 - 6.03 48 Seri Setia KTM 34.92 18.58 25.00 5.47 49 Putra Height LRT Extension 38.73 4.30 15.92 4.82 50 Ampang Ampang Line 29.56 34.91 6.17 4.74 51 Kota Kajang KL-Beranang 37.49 16.52 12.50 4.37 52 Dato Harun KTM 38.90 32.10 - 4.32

Journal of Built Environment, Technology and Engineering, Vol. 1 (Sept.) ISSN 0128-1003 2016
46
53 Rasa, Hulu Selangor KL-Tanjung Malim 26.55 35.27 1.08 4.00 54 Teluk Panglima Garang KL-Sepang 26.70 24.74 12.50 3.77 55 Pekan Meru KL-Sabak 31.97 15.49 25.00 2.73 56 Rawang Centre KL-Tanjung Malim 48.82 12.95 2.68 2.54 57 Starbucks, Setia Alam KL-Sabak 34.74 29.74 - 2.22 58 Cempaka Ampang Line 40.49 16.23 25.00 2.19 59 Bangunan UMNO Kapar KL-Sabak 33.90 15.33 25.00 1.62 60 Batang Kali KTM 20.14 29.86 37.50 0.78 61 Rawang KTM 37.06 12.93 37.50 - 62 UKM KTM 39.61 10.40 37.50 - 63 Stesen Hentian KL-Sabak 24.87 13.80 36.34 - 64 Asia Jaya Kelana Jaya Line 37.58 13.18 28.42 - 65 Warta Lama KL-Tanjung Malim 41.06 16.73 25.55 - 66 Bangi KTM 33.76 24.57 25.00 - 67 Jalan Templer KTM 41.46 16.88 25.00 - 68 Wangsa Maju LRT Extension 15.23 34.77 16.67 - 69 KTM Batu Caves KTM 49.18 9.16 12.50 - 70 Kelana Jaya Kelana Jaya Line 39.54 27.13 12.50 - 71 Subang Jaya LRT Extension 40.76 24.87 10.45 - 72 Gombak KTM 24.28 40.13 10.41 - 73 Glenmarie LRT Extension 47.36 40.31 4.43 - 74 Sri Rampai LRT Extension 48.16 10.72 3.23 - 75 Hospital Baru Kajang KL-Beranang 23.17 11.16 - - 76 Rasa KTM 27.42 41.50 - - 77 Taman Rimba Templer KL-Tanjung Malim 16.00 47.58 - - 78 Simpang Jln Rinching Tengah KL-Beranang 23.38 43.29 - - 79 Batang Kali KL-Tanjung Malim 26.17 40.50 - - 80 USJ 21 LRT Extension 32.68 33.99 - - 81 Simpang Taman Asia Jaya KL-Beranang 35.64 31.03 - - 82 Serendah KTM 45.87 24.97 - - 83 Simpangan Jalan Utama KL-Sepang 39.25 23.25 - - 84 USJ 7 LRT Extension 39.71 22.79 - - 85 Taman Industri Sungai Buloh MRT 50.32 20.51 - - 86 Taman Mewah, Jalan Semenyih KL-Beranang 45.07 13.26 - - 87 Serendah KL-Tanjung Malim 50.04 11.82 - - 88 Kedai Hardware Rinching KL-Beranang 48.97 9.37 - -

Journal of Built Environment, Technology and Engineering, Vol. 1 (Sept.) ISSN 0128-1003 2016
47