TRANSIT ORIENTED DEVELOPMENT (TOD) & CLIMATE...
71
Dialogue. Insight. Solutions. TRANSIT ORIENTED DEVELOPMENT (TOD) & CLIMATE CHANGE Benefits and Opportunities for Panama Steve Winkelman Director, Transportation & Adaptation Programs Briefing for President Varela January 22, 2015 Panama City, Panama
Transcript of TRANSIT ORIENTED DEVELOPMENT (TOD) & CLIMATE...
Dialogue. Insight. Solutions.
TRANSIT ORIENTED DEVELOPMENT
(TOD) & CLIMATE CHANGE Benefits and Opportunities for Panama
Steve Winkelman Director, Transportation & Adaptation Programs
Briefing for President Varela
January 22, 2015
Panama City, Panama
1
CENTER FOR CLEAN AIR POLICY
Key themes
GHG Mitigation • “MAIN”
• Colombia TOD
NAMA
• Electricity
Public-private
collaboration
Climate
Adaptation • Green
Resilience
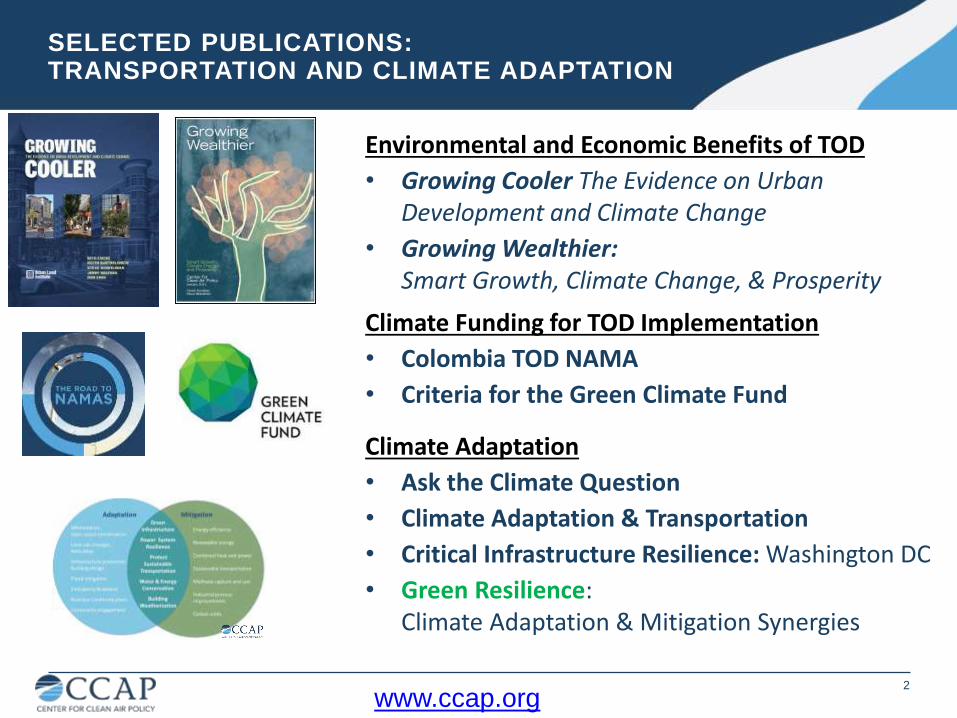
SELECTED PUBLICATIONS: TRANSPORTATION AND CLIMATE ADAPTATION
Environmental and Economic Benefits of TOD
• Growing Cooler The Evidence on Urban Development and Climate Change
• Growing Wealthier: Smart Growth, Climate Change, & Prosperity
Climate Funding for TOD Implementation
• Colombia TOD NAMA
• Criteria for the Green Climate Fund
Climate Adaptation
• Ask the Climate Question
• Climate Adaptation & Transportation
• Critical Infrastructure Resilience: Washington DC
• Green Resilience: Climate Adaptation & Mitigation Synergies
2
www.ccap.org
3
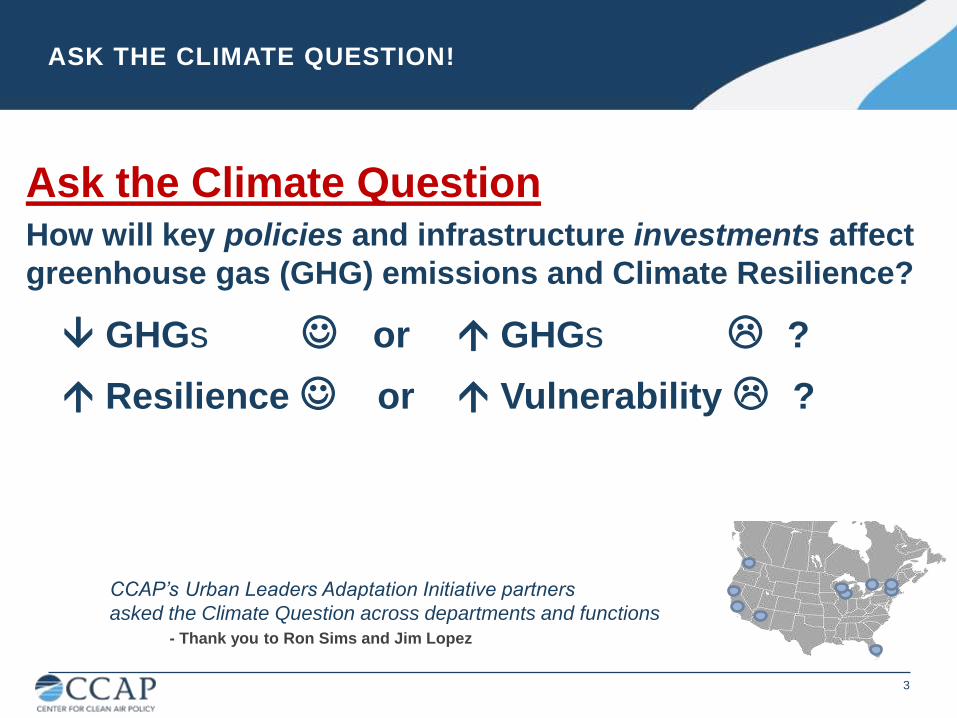
Ask the Climate Question How will key policies and infrastructure investments affect
greenhouse gas (GHG) emissions and Climate Resilience?
GHGs or GHGs ?
Resilience or Vulnerability ?
CCAP’s Urban Leaders Adaptation Initiative partners
asked the Climate Question across departments and functions
- Thank you to Ron Sims and Jim Lopez
ASK THE CLIMATE QUESTION!
4
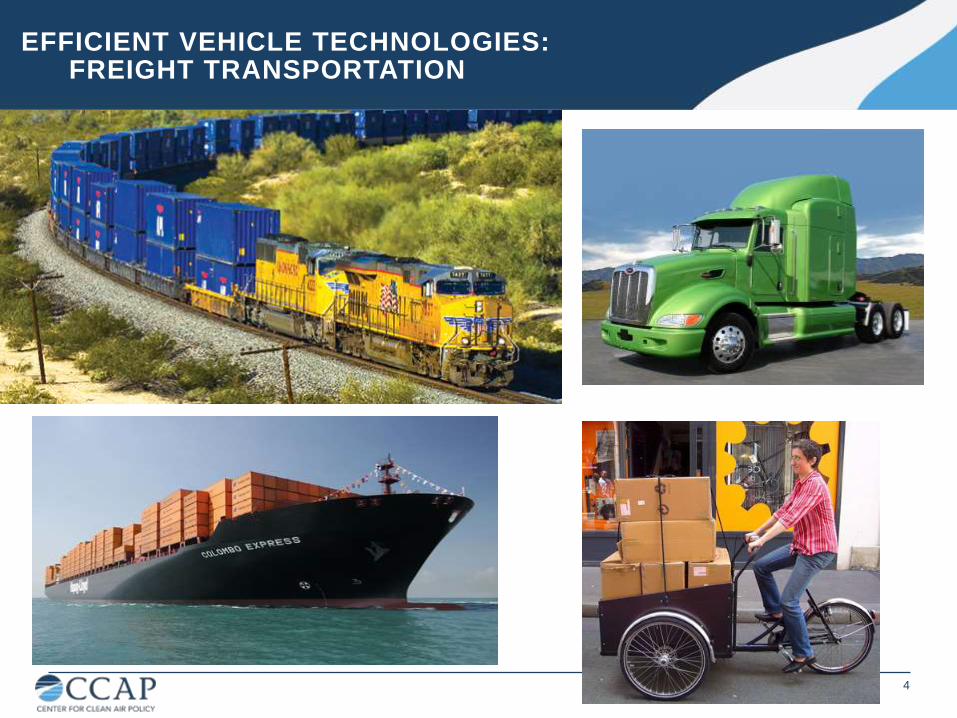
EFFICIENT VEHICLE TECHNOLOGIES: FREIGHT TRANSPORTATION
5
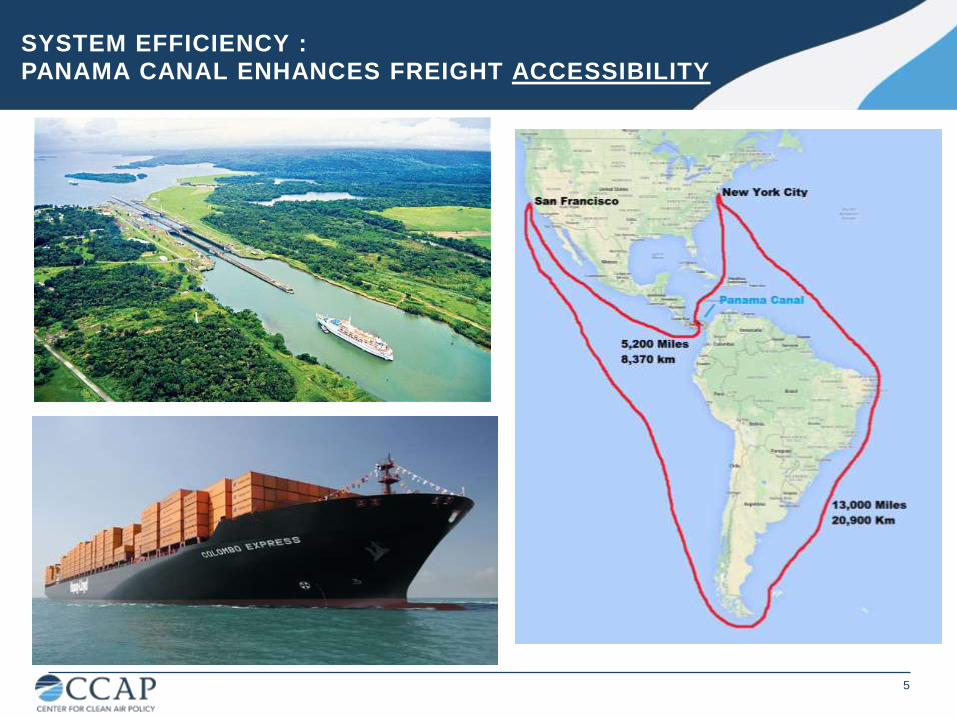
SYSTEM EFFICIENCY : PANAMA CANAL ENHANCES FREIGHT ACCESSIBILITY
6
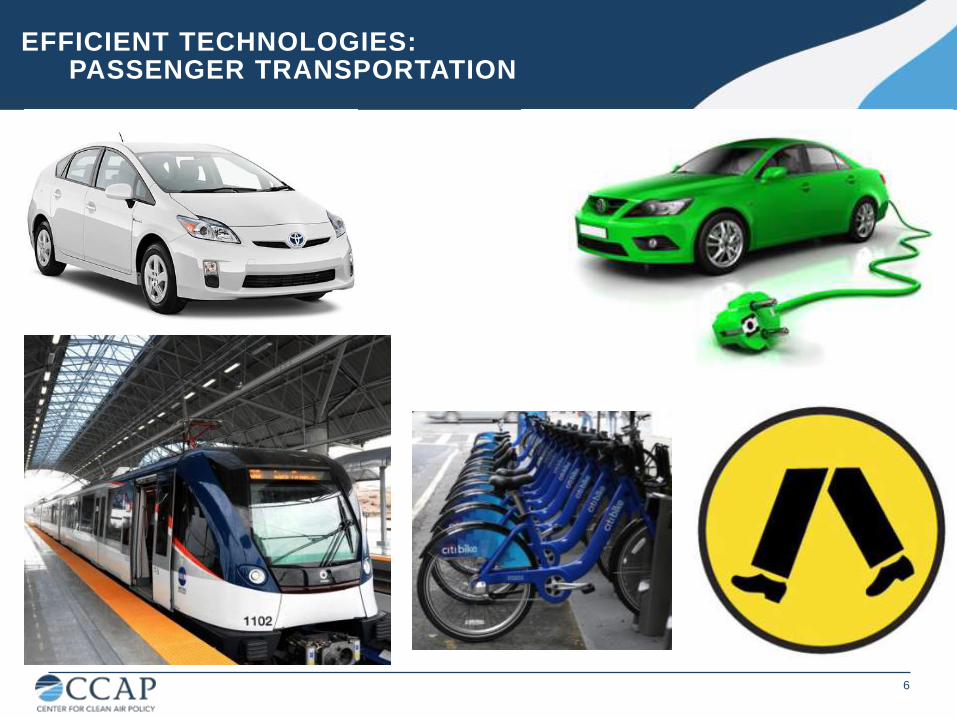
EFFICIENT TECHNOLOGIES: PASSENGER TRANSPORTATION

Image source: Larry Frank
SIDEWALKS ARE AS SEXY AS HYBRIDS
2 km “Cabo de Hornos”
7
1 km “Panama Canal”
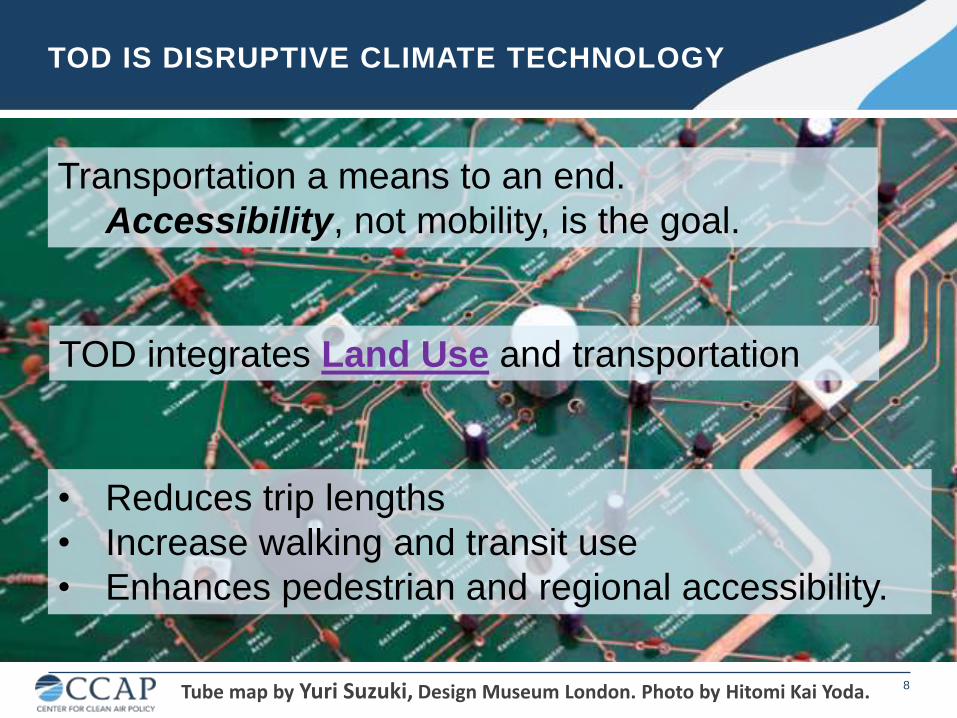
TOD IS DISRUPTIVE CLIMATE TECHNOLOGY
8
• Reduces trip lengths
• Increase walking and transit use
• Enhances pedestrian and regional accessibility.
Transportation a means to an end.
Accessibility, not mobility, is the goal.
TOD integrates Land Use and transportation
Tube map by Yuri Suzuki, Design Museum London. Photo by Hitomi Kai Yoda.
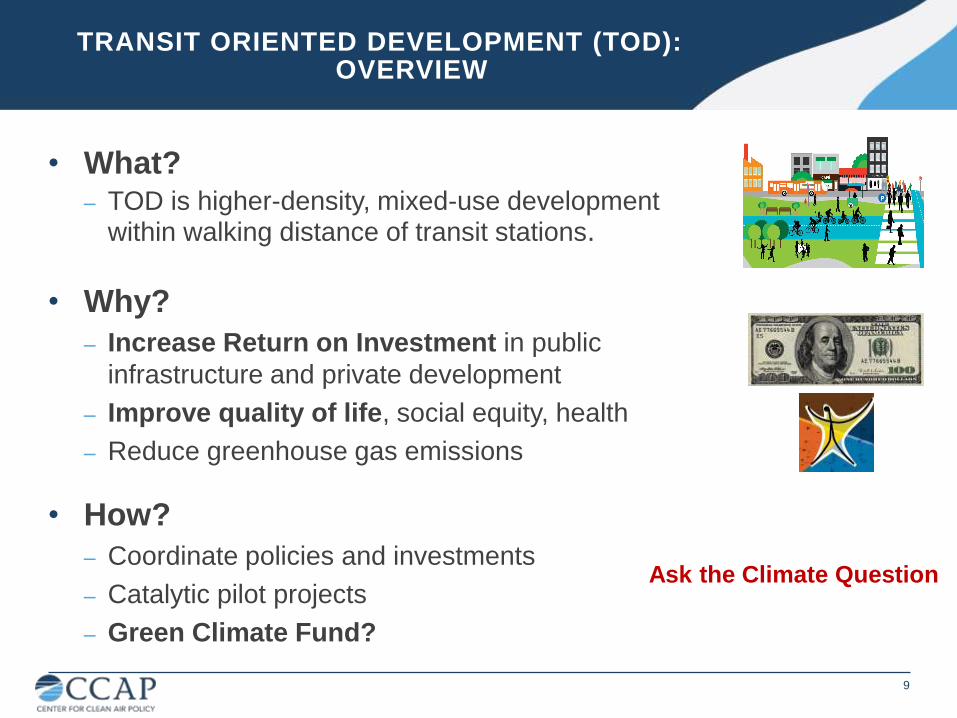
• What? – TOD is higher-density, mixed-use development
within walking distance of transit stations.
9
TRANSIT ORIENTED DEVELOPMENT (TOD): OVERVIEW
• Why?
– Increase Return on Investment in public
infrastructure and private development
– Improve quality of life, social equity, health
– Reduce greenhouse gas emissions
Ask the Climate Question
• How?
– Coordinate policies and investments
– Catalytic pilot projects
– Green Climate Fund?
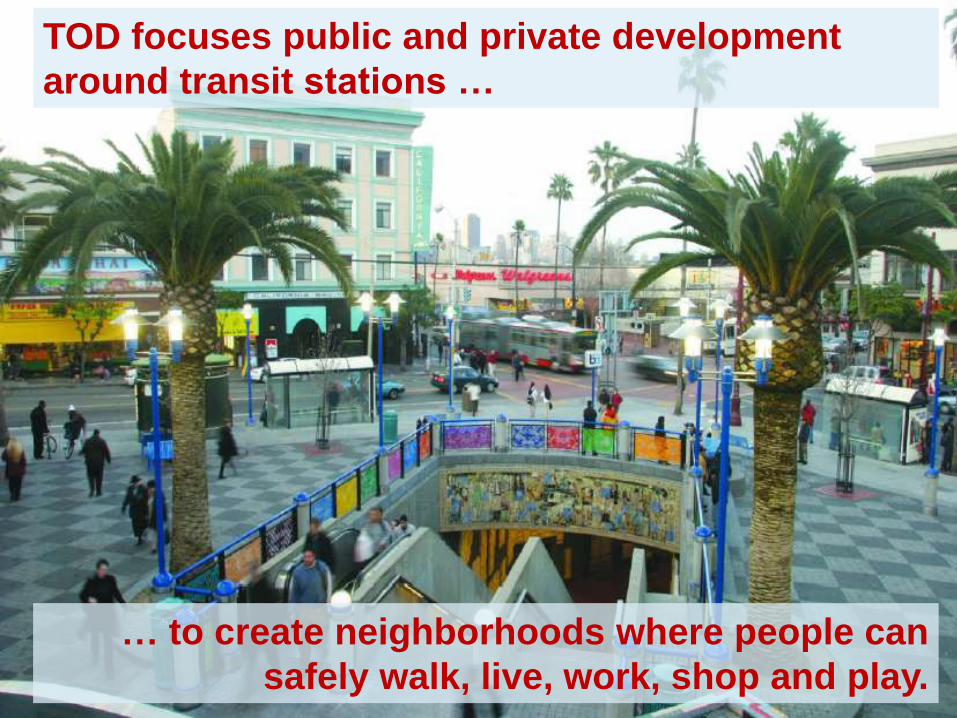
TOD focuses public and private development
around transit stations …
… to create neighborhoods where people can
safely walk, live, work, shop and play.

VITAL INGREDIENTS FOR TOD
Images:
CityLab - Felipe Targa
12
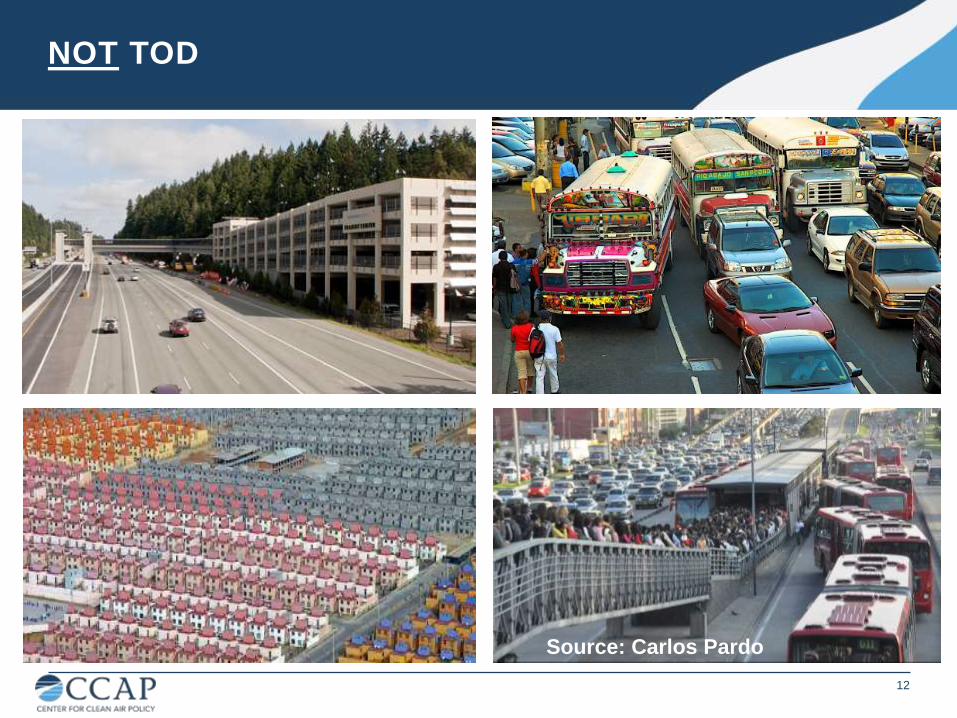
NOT TOD
Source: Carlos Pardo
13
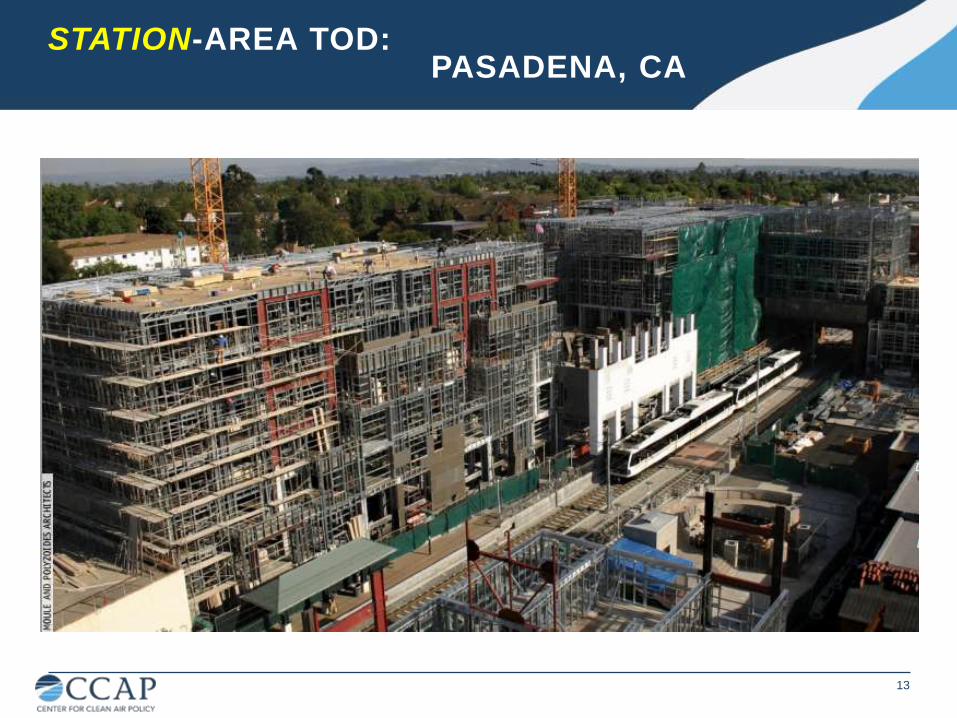
STATION-AREA TOD: PASADENA, CA
14
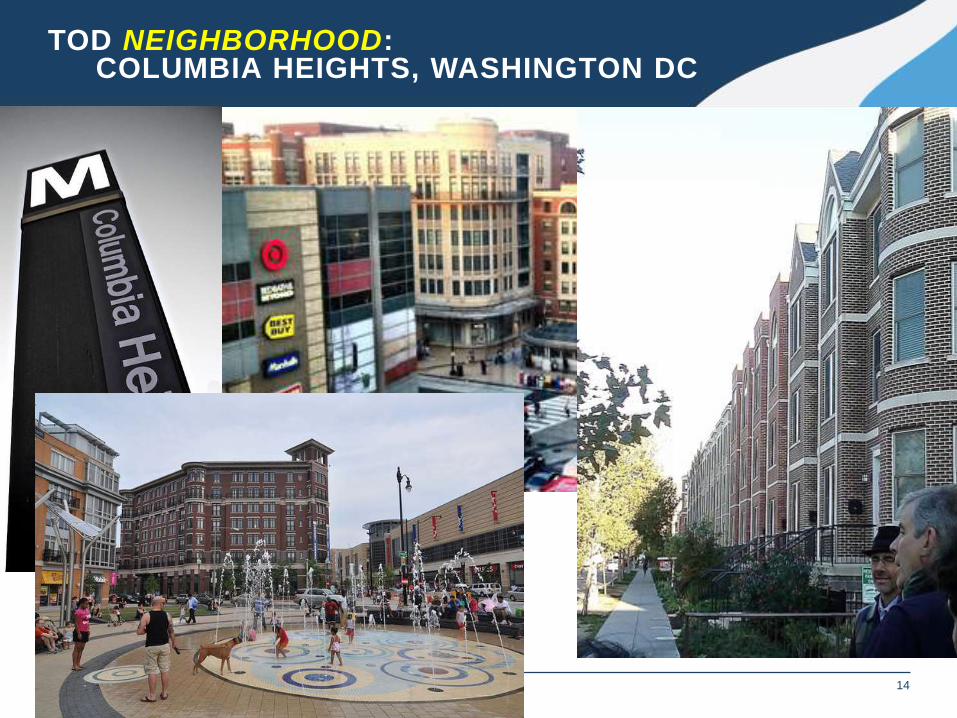
TOD NEIGHBORHOOD: COLUMBIA HEIGHTS, WASHINGTON DC

15
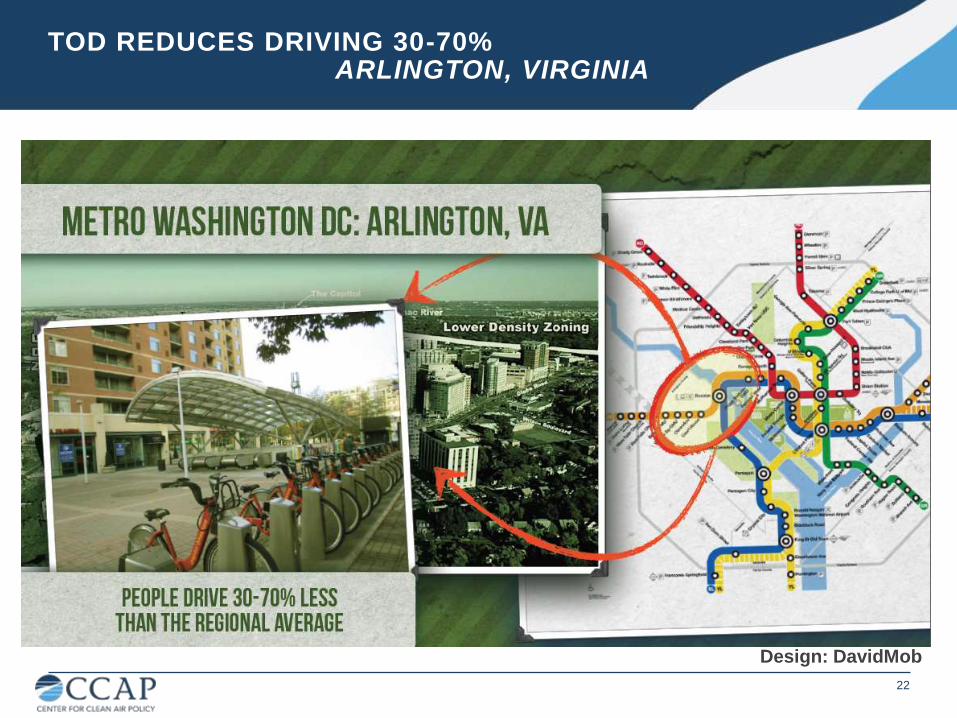
TOD CORRIDOR: ARLINGTON VIRGINIA
8% of County land generates 33% real estate taxes
16
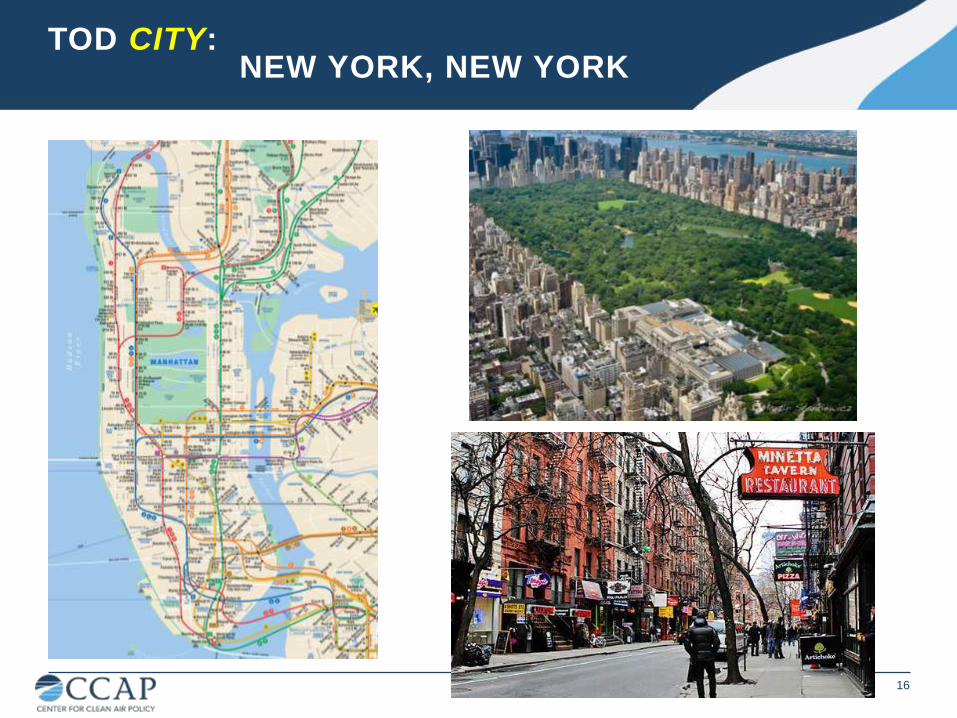
TOD CITY: NEW YORK, NEW YORK
17
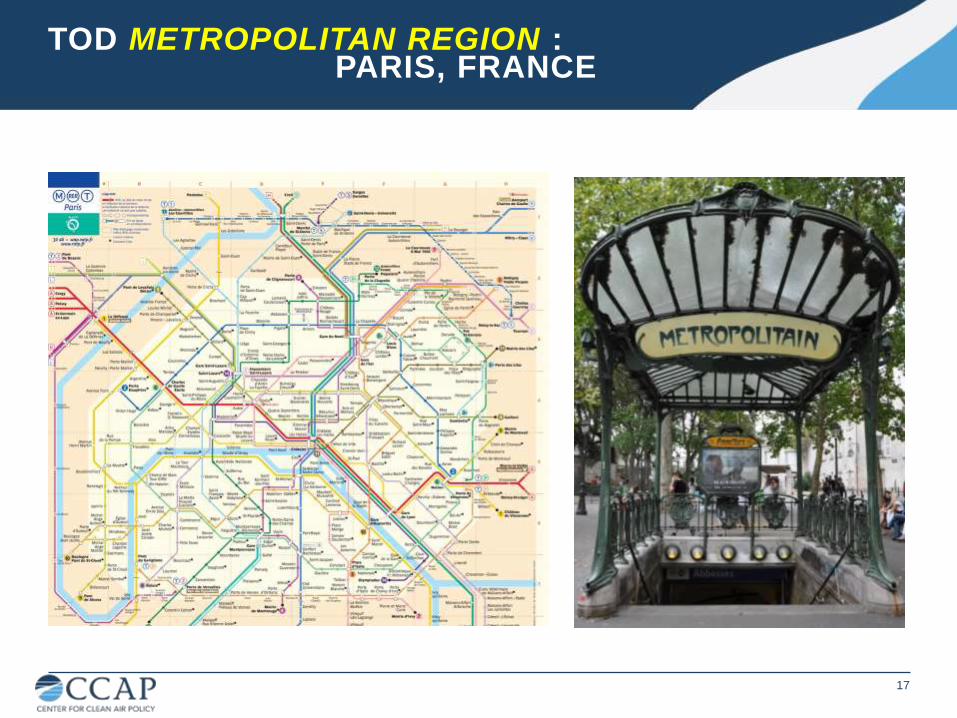
TOD METROPOLITAN REGION : PARIS, FRANCE
• What? TOD is higher-density, mixed-use development within walking distance of transit stations.
18
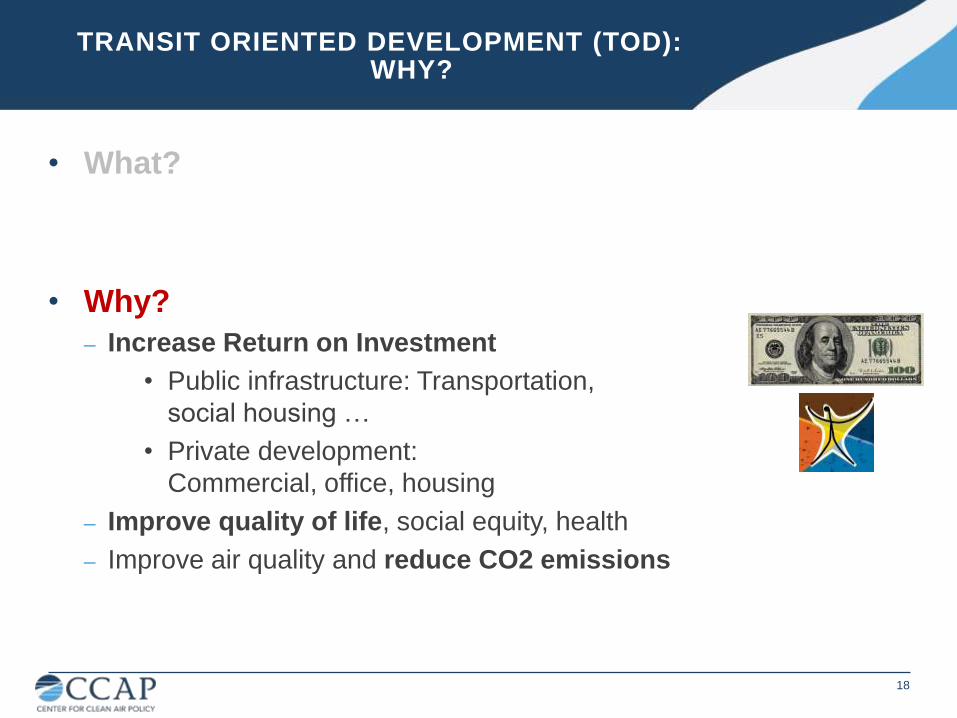
TRANSIT ORIENTED DEVELOPMENT (TOD): WHY?
• Why?
– Increase Return on Investment
• Public infrastructure: Transportation,
social housing …
• Private development:
Commercial, office, housing
– Improve quality of life, social equity, health
– Improve air quality and reduce CO2 emissions
19
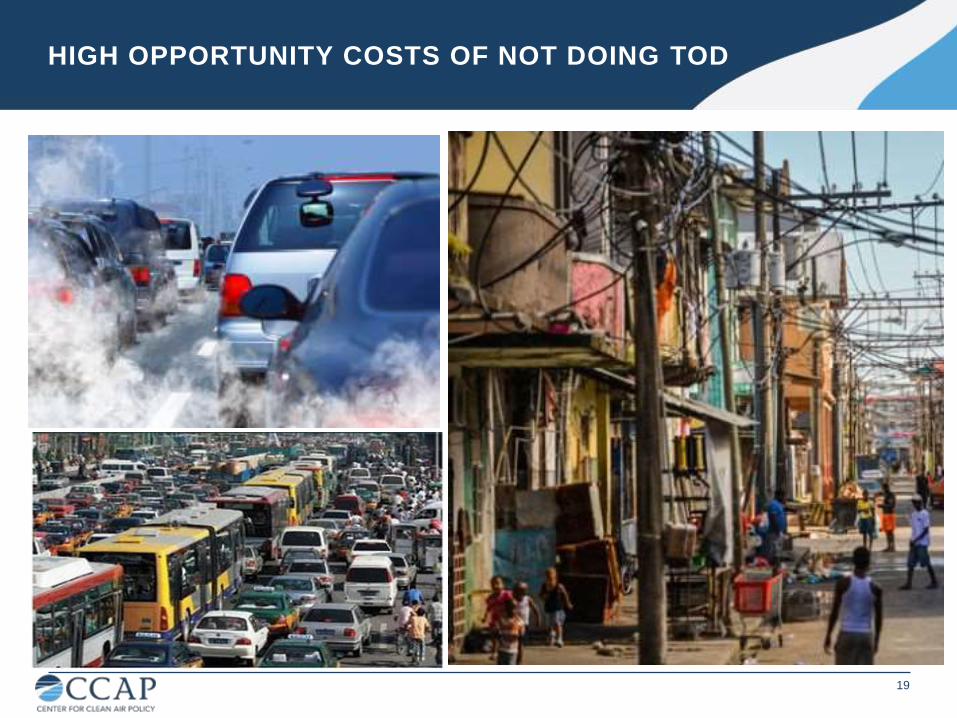
HIGH OPPORTUNITY COSTS OF NOT DOING TOD
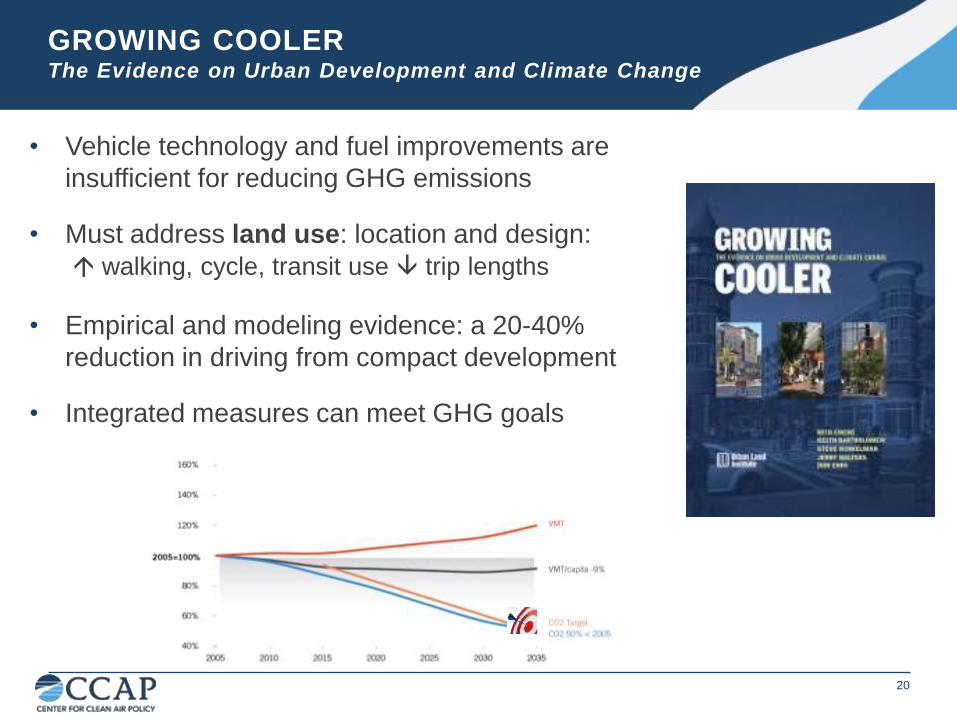
• Vehicle technology and fuel improvements are
insufficient for reducing GHG emissions
• Must address land use: location and design:
walking, cycle, transit use trip lengths
• Empirical and modeling evidence: a 20-40%
reduction in driving from compact development
• Integrated measures can meet GHG goals
GROWING COOLER The Evidence on Urban Development and Climate Change
20
20
21
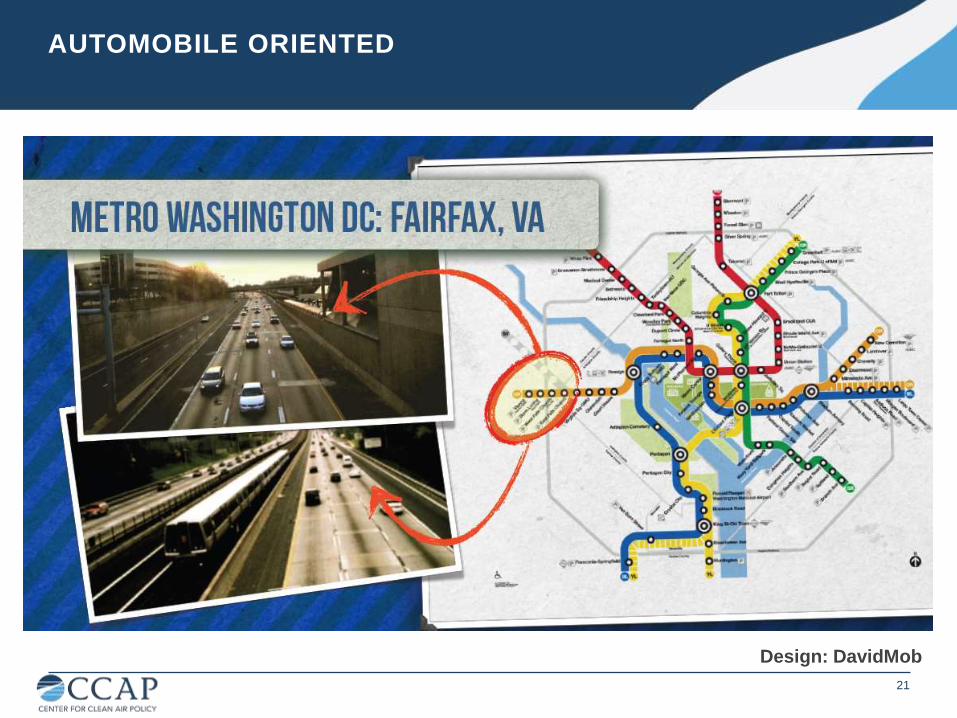
AUTOMOBILE ORIENTED
Design: DavidMob
22
TOD REDUCES DRIVING 30-70% ARLINGTON, VIRGINIA
Design: DavidMob
CCAP 23
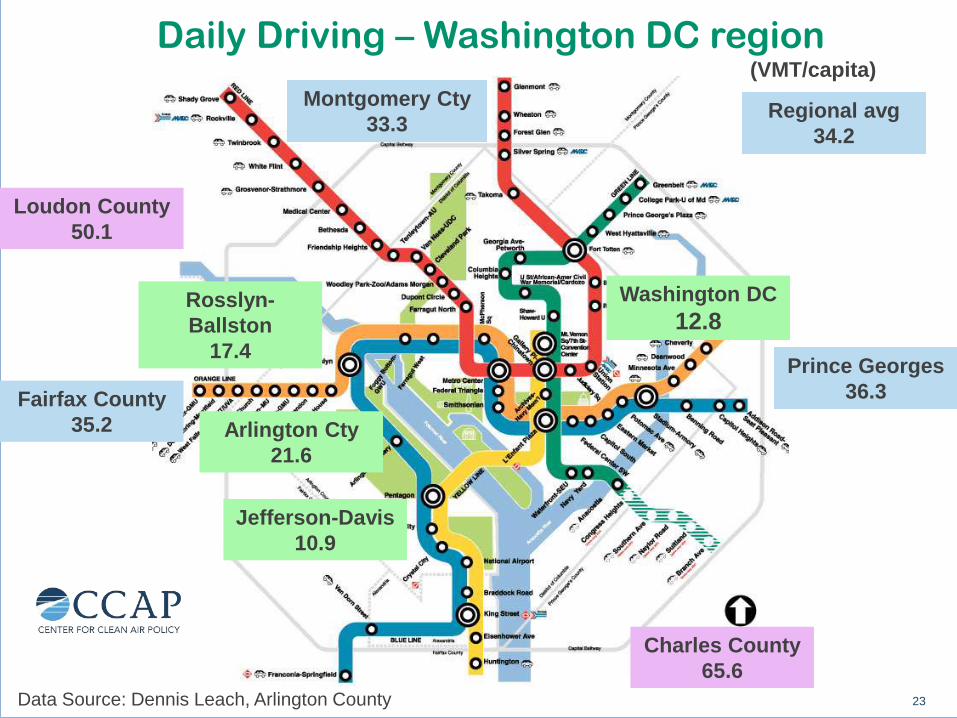
Jefferson-Davis
10.9
Rosslyn-
Ballston
17.4
Washington DC
12.8
Loudon County
50.1
Fairfax County
35.2
Charles County
65.6
Daily Driving – Washington DC region (VMT/capita)
Data Source: Dennis Leach, Arlington County
Regional avg
34.2
Montgomery Cty
33.3
Prince Georges
36.3
Arlington Cty
21.6
23
24
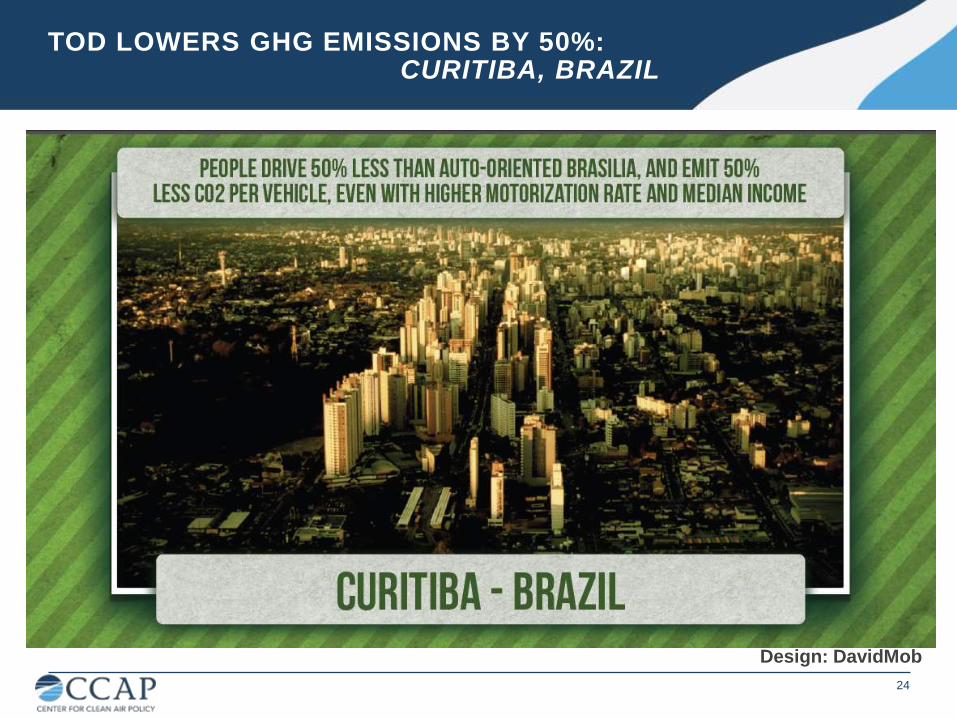
TOD LOWERS GHG EMISSIONS BY 50%: CURITIBA, BRAZIL
Design: DavidMob
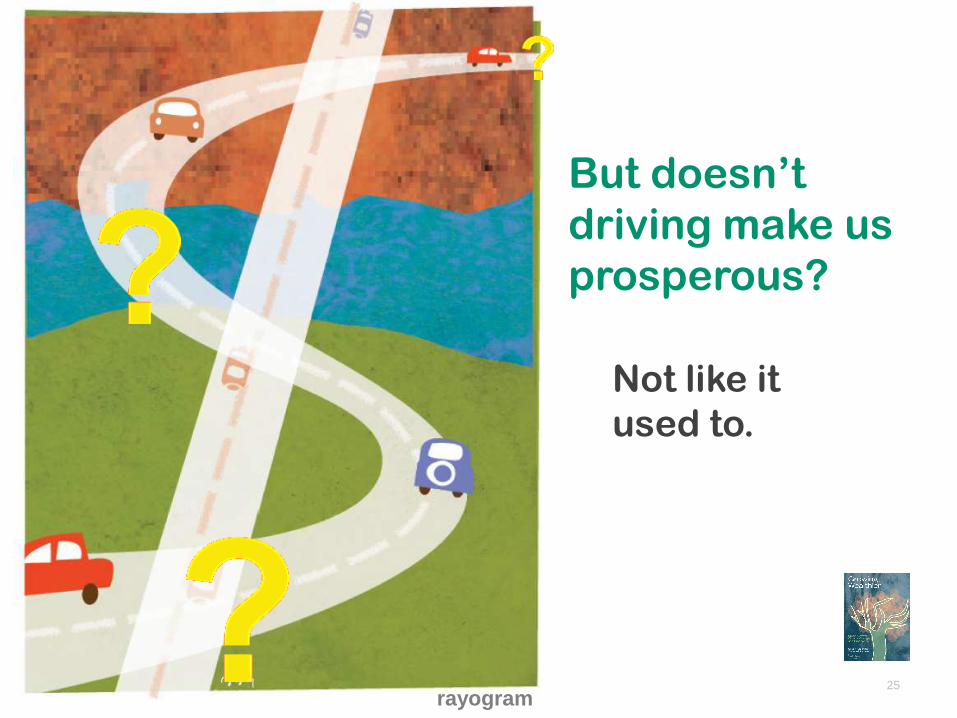
But doesn’t
driving make us
prosperous?
25
Not like it
used to.
rayogram
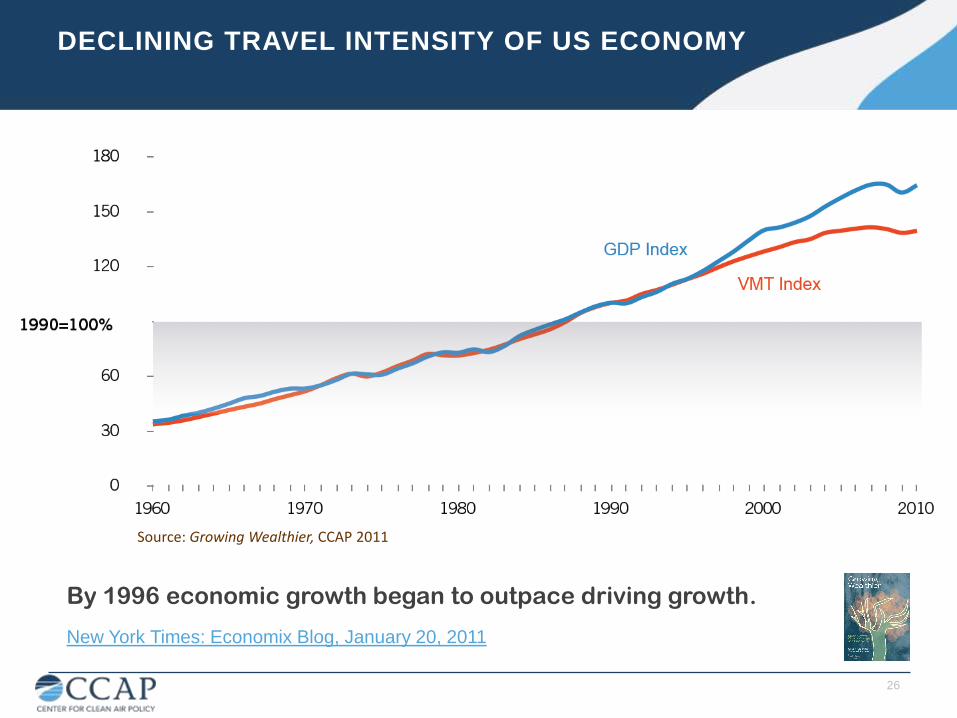
By 1996 economic growth began to outpace driving growth.
New York Times: Economix Blog, January 20, 2011
Source: Growing Wealthier, CCAP 2011
DECLINING TRAVEL INTENSITY OF US ECONOMY
26

Travel (VKT) that contributes little or nothing to
households and local economies.
EMPTY KILOMETERS
27
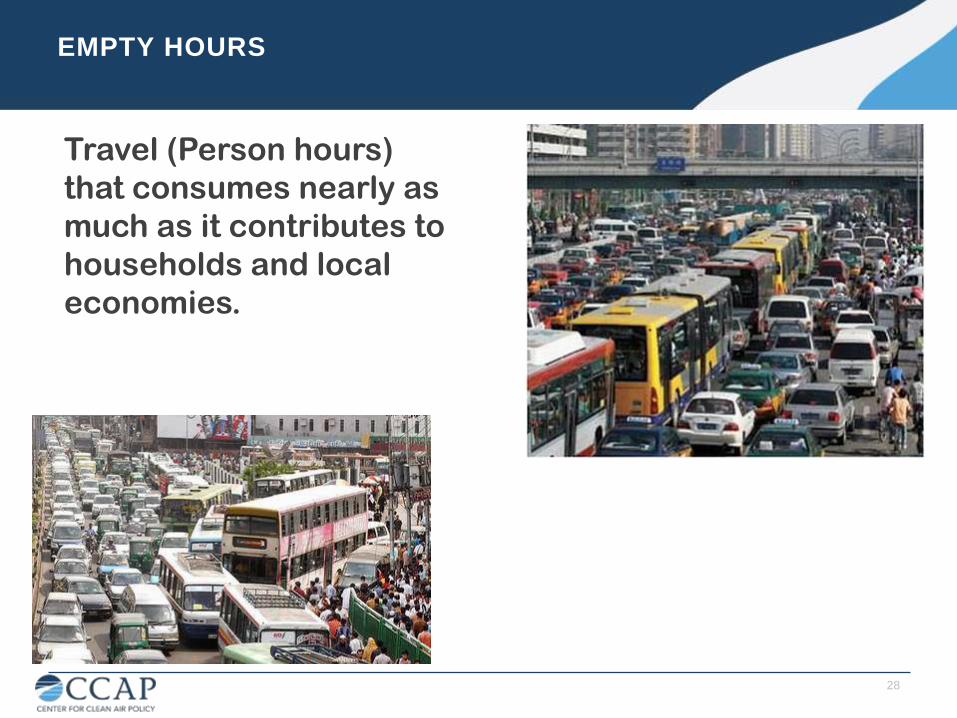
Travel (Person hours)
that consumes nearly as
much as it contributes to
households and local
economies.
EMPTY HOURS
28
Growing Wealthier Matrix
rayogram
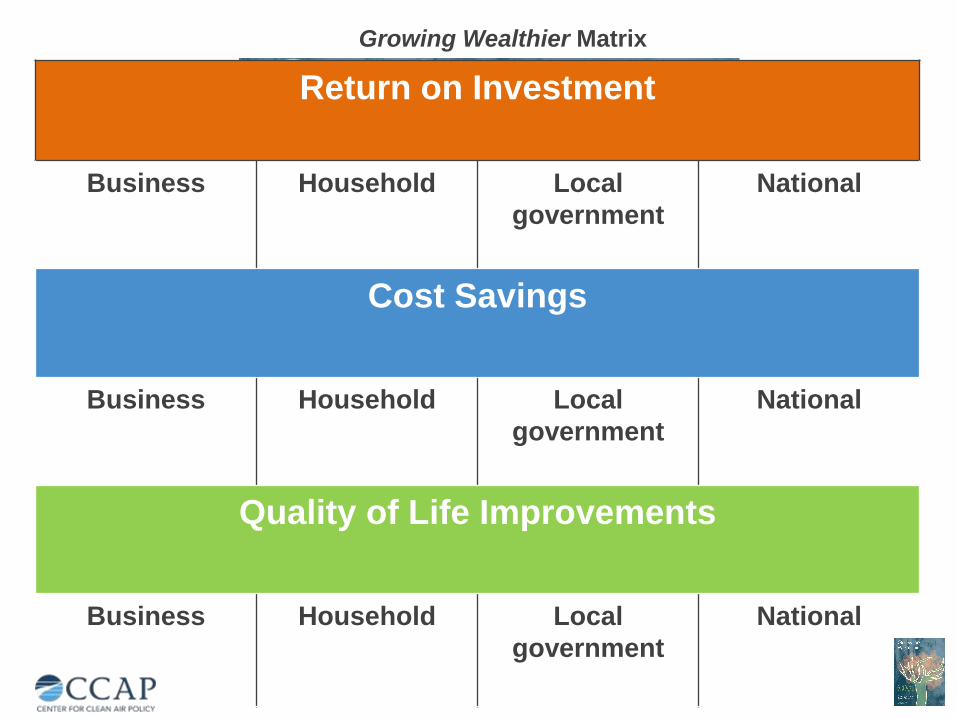
Return on Investment
Business Household Local
government
National
Cost Savings
Business Household Local
government
National
Quality of Life Improvements
Business Household Local
government
National
Growing Wealthier Matrix
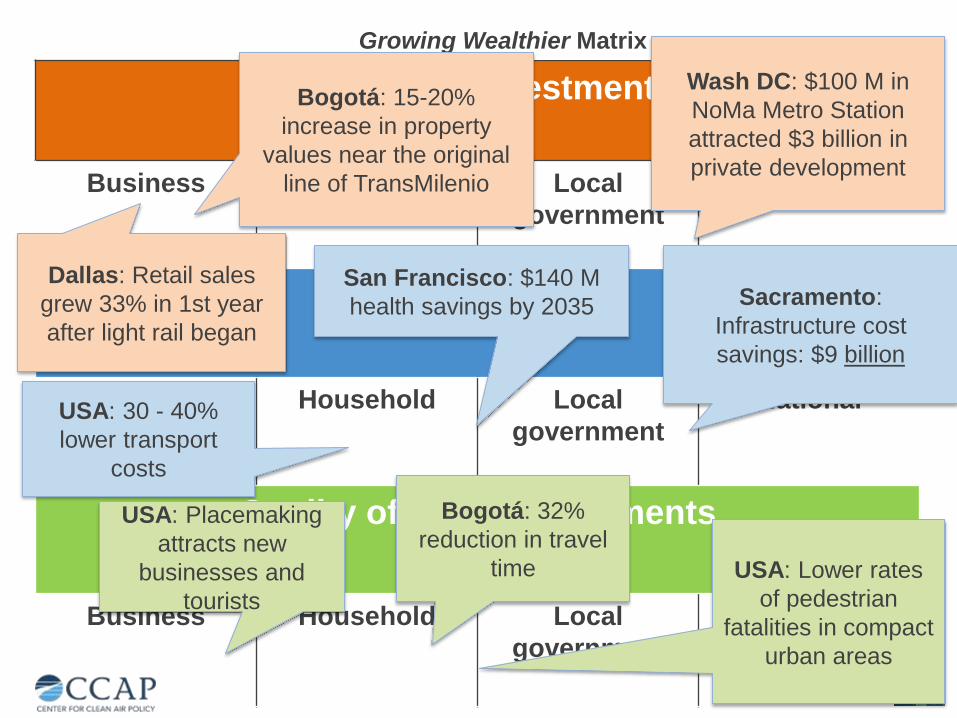
Return on Investment
Business Household Local
government
National
Cost Savings
Business Household Local
government
National
Quality of Life Improvements
Business Household Local
government
National
Growing Wealthier Matrix
Dallas: Retail sales
grew 33% in 1st year
after light rail began
Wash DC: $100 M in
NoMa Metro Station
attracted $3 billion in
private development
Bogotá: 15-20%
increase in property
values near the original
line of TransMilenio
Sacramento:
Infrastructure cost
savings: $9 billion
San Francisco: $140 M
health savings by 2035
USA: 30 - 40%
lower transport
costs
USA: Placemaking
attracts new
businesses and
tourists
USA: Lower rates
of pedestrian
fatalities in compact
urban areas
Bogotá: 32%
reduction in travel
time
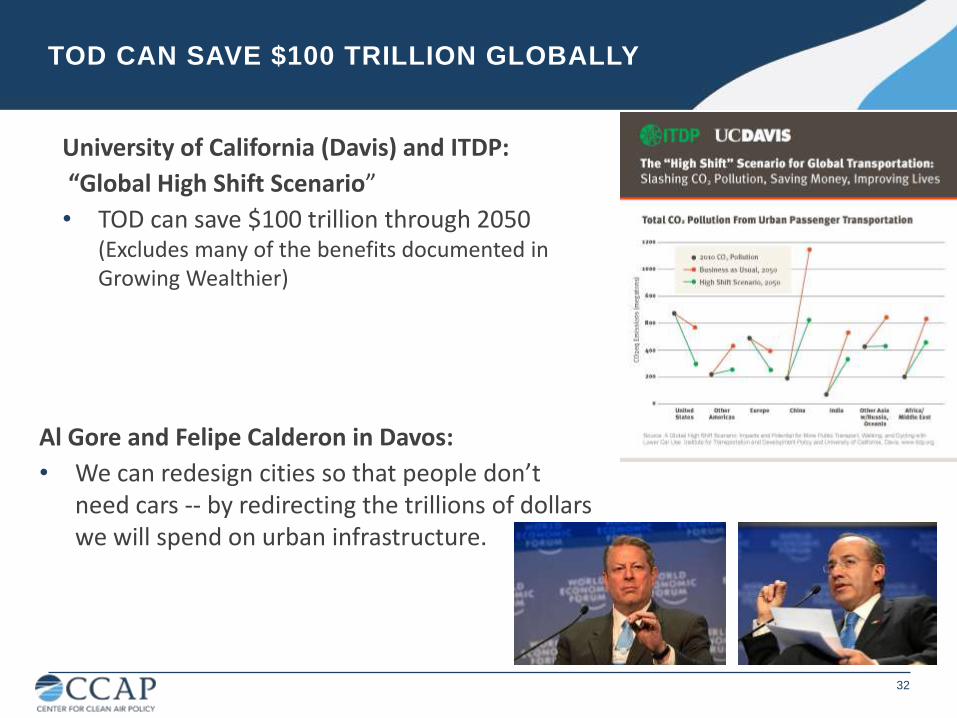
Al Gore and Felipe Calderon in Davos:
• We can redesign cities so that people don’t need cars -- by redirecting the trillions of dollars we will spend on urban infrastructure.
32
TOD CAN SAVE $100 TRILLION GLOBALLY
University of California (Davis) and ITDP:
“Global High Shift Scenario”
• TOD can save $100 trillion through 2050 (Excludes many of the benefits documented in Growing Wealthier)
• What? TOD is higher-density, mixed-use development within walking distance of transit stations.
33
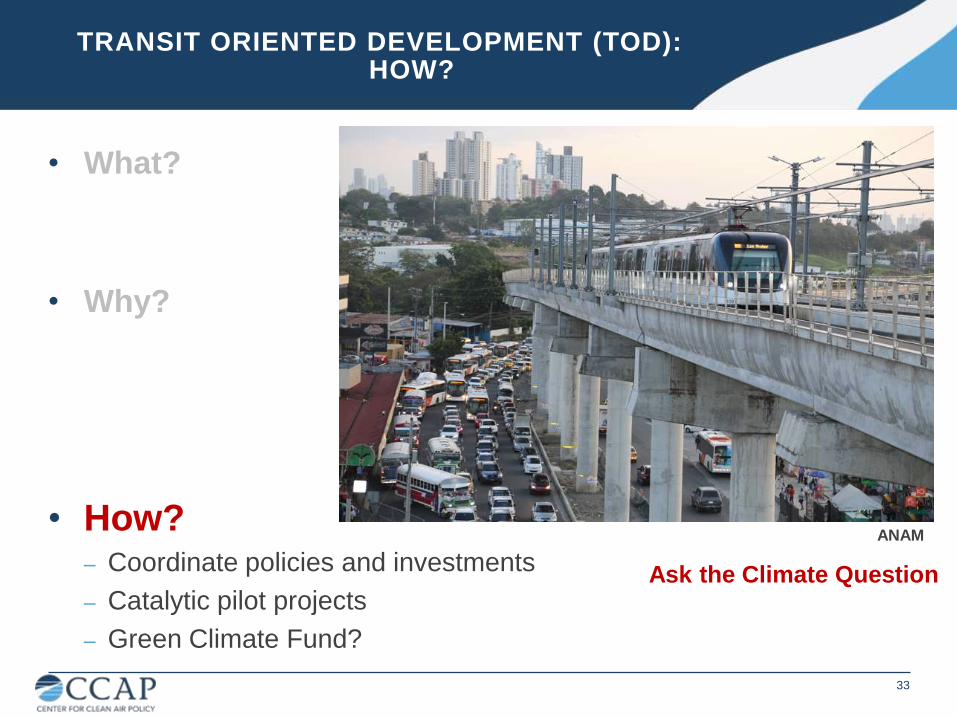
TRANSIT ORIENTED DEVELOPMENT (TOD): HOW?
• Why?
Increase Return on Investment in public
infrastructure and private development
Improve quality of life, social equity, health
Reduce greenhouse gas emissions
Ask the Climate Question
• How?
– Coordinate policies and investments
– Catalytic pilot projects
– Green Climate Fund?
ANAM
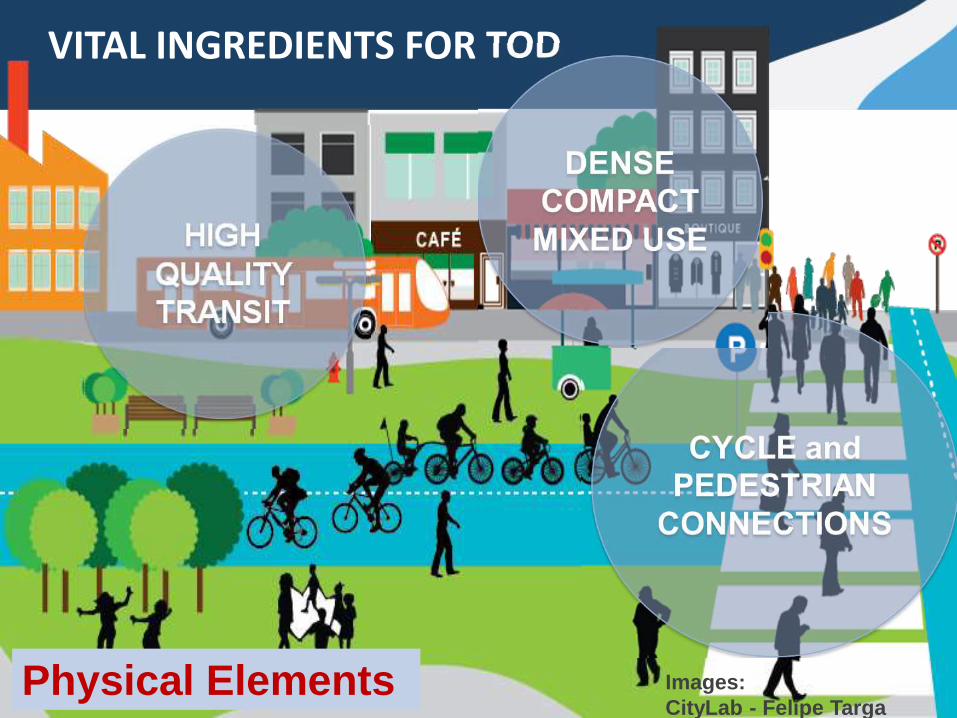
VITAL INGREDIENTS FOR TOD
Physical Elements Images:
CityLab - Felipe Targa
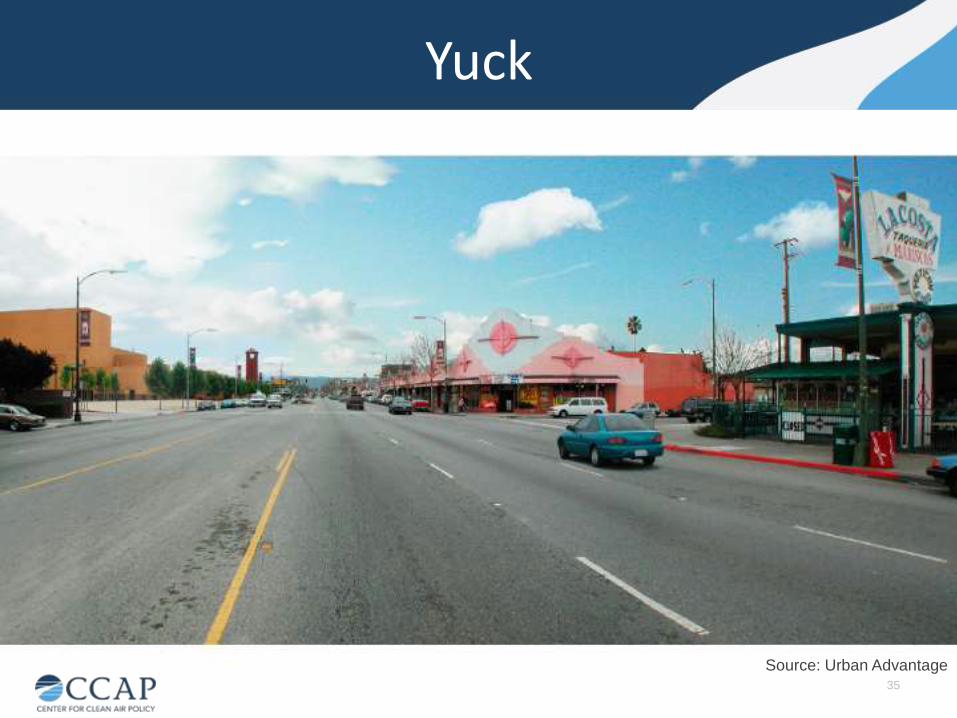
Yuck
35
Source: Urban Advantage
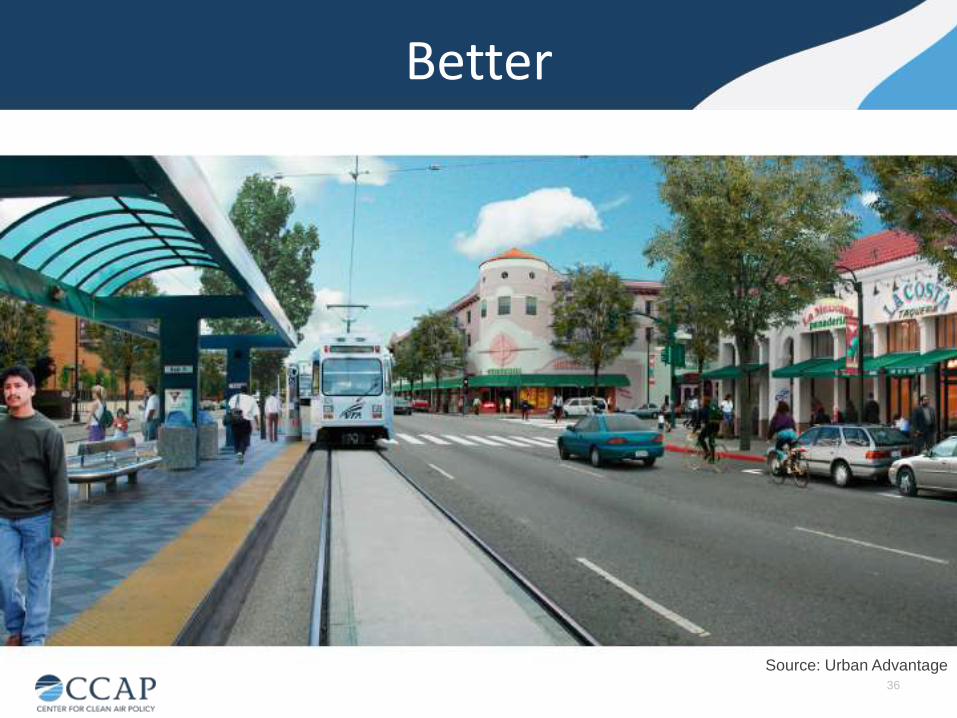
Better
36
Source: Urban Advantage
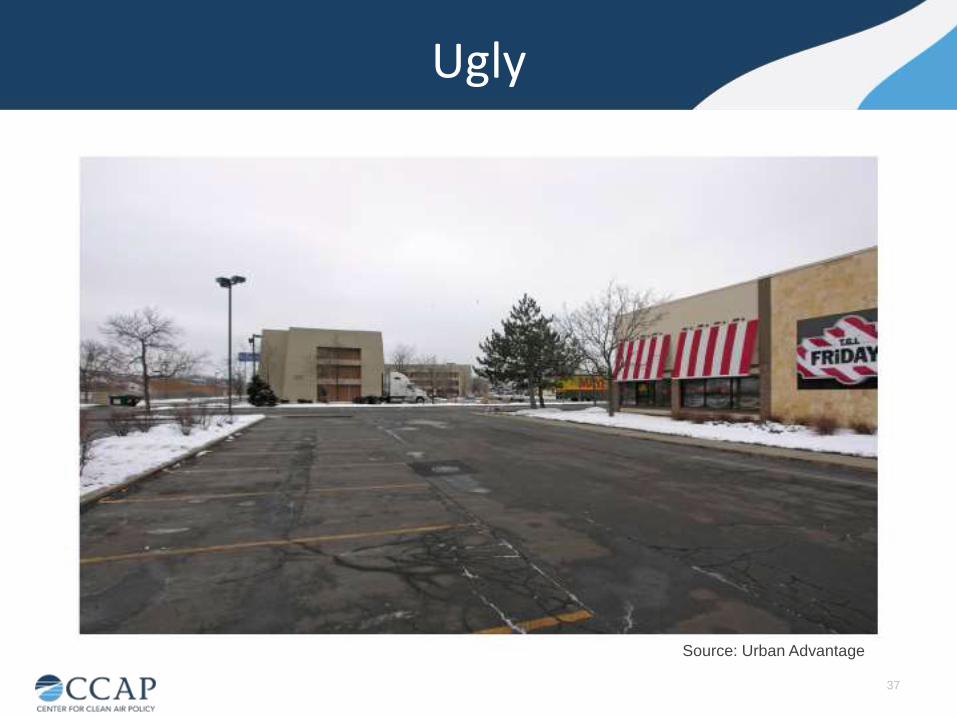
Ugly
37
Source: Urban Advantage
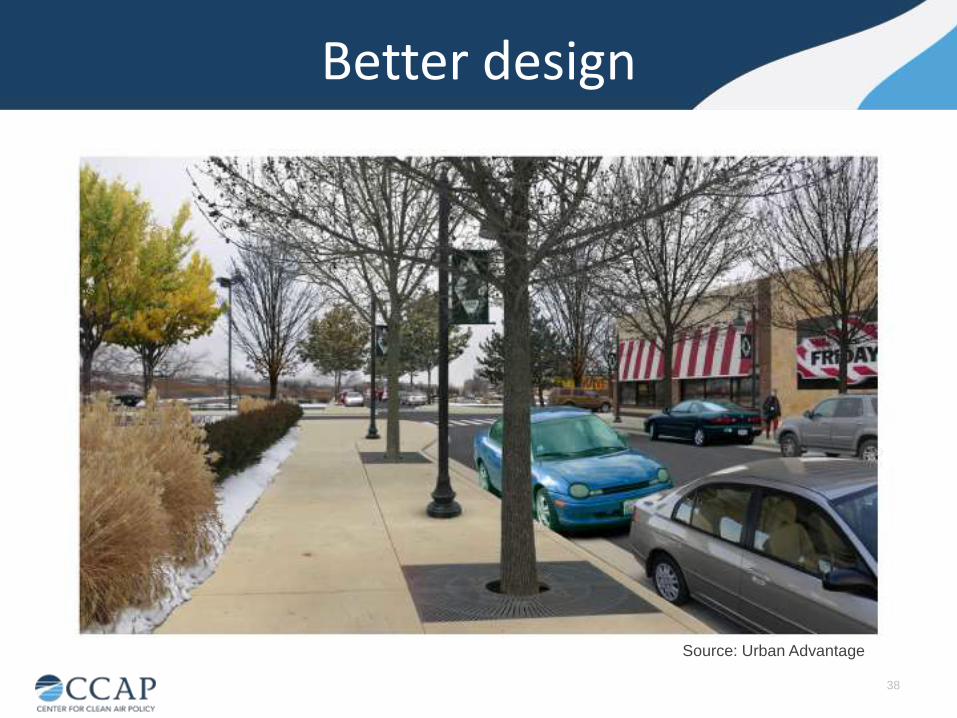
Better design
38
Source: Urban Advantage
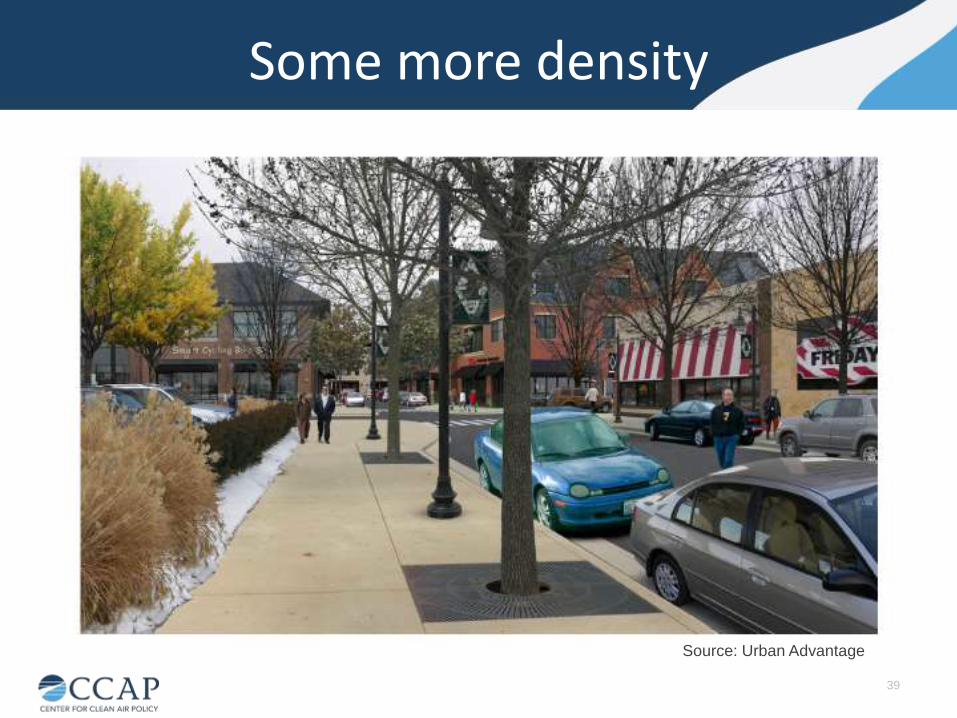
Some more density
39
Source: Urban Advantage
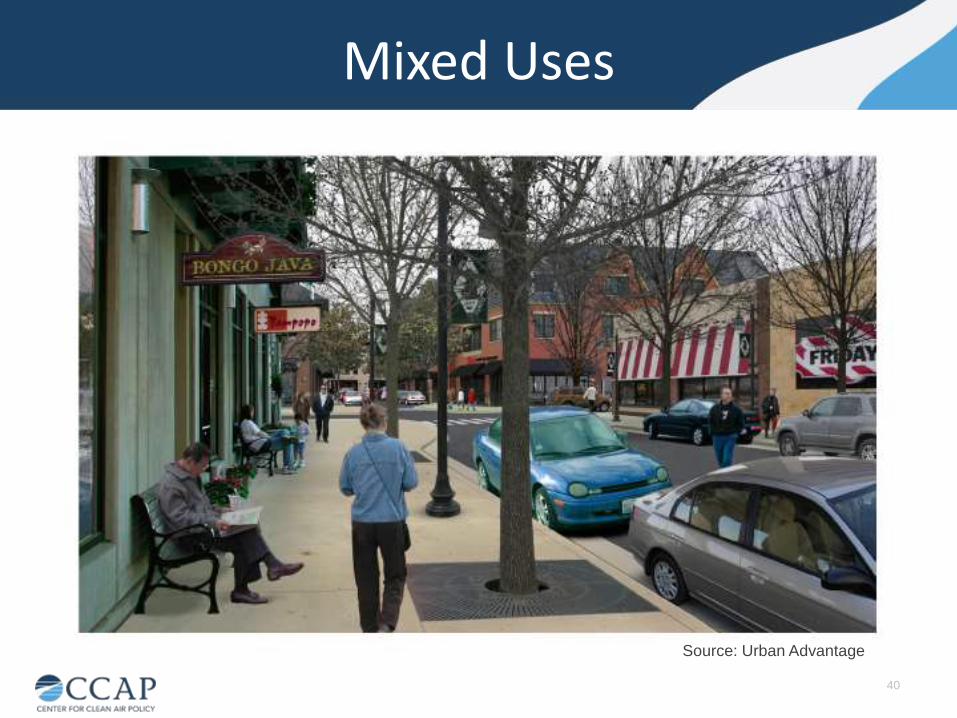
Mixed Uses
40
Source: Urban Advantage
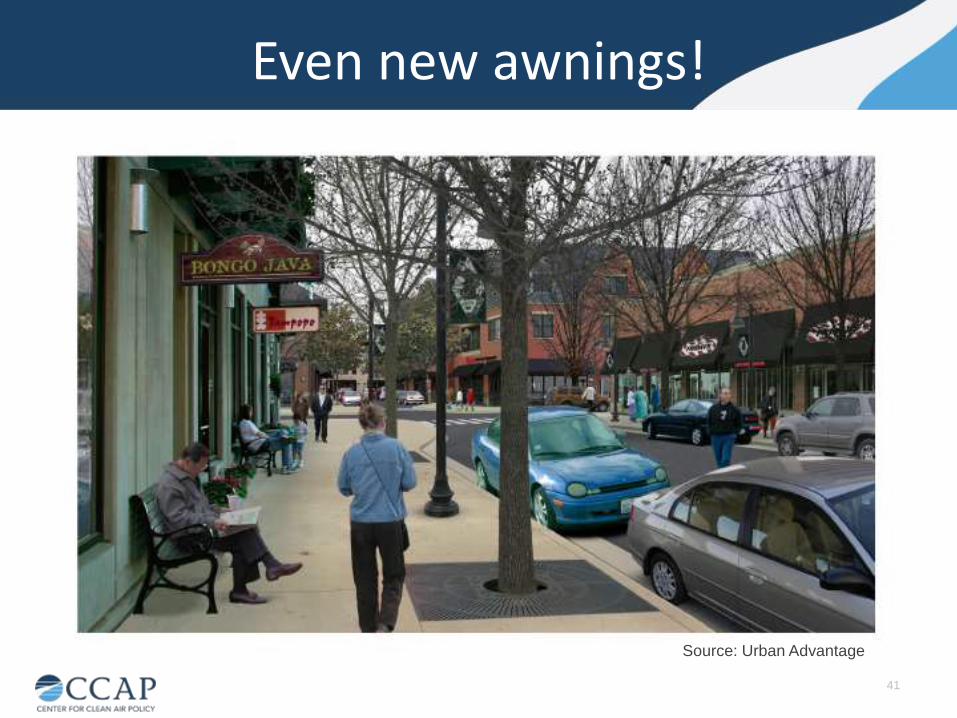
Even new awnings!
41
Source: Urban Advantage
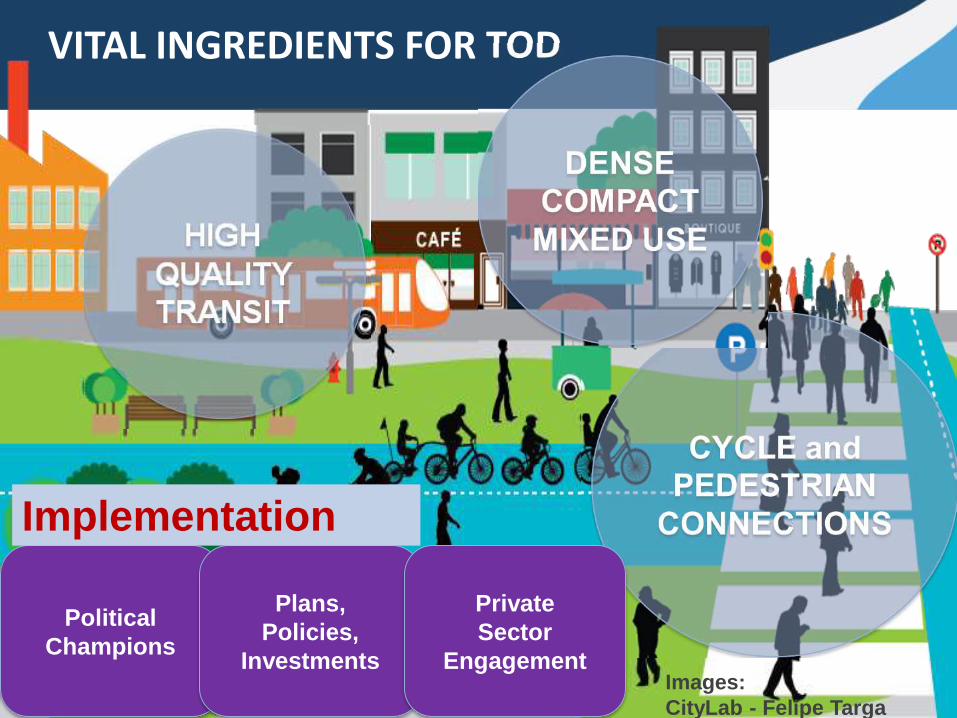
VITAL INGREDIENTS FOR TOD
Political
Champions
Plans,
Policies,
Investments
Private
Sector
Engagement
Implementation
Images:
CityLab - Felipe Targa
43
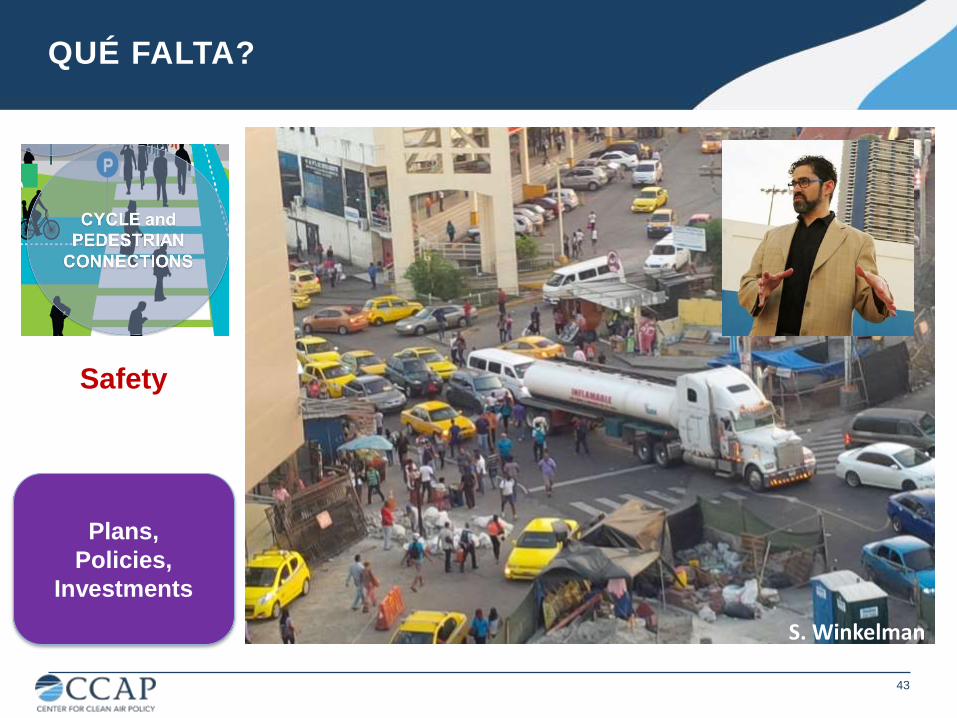
QUÉ FALTA?
Safety
Plans,
Policies,
Investments
S. Winkelman
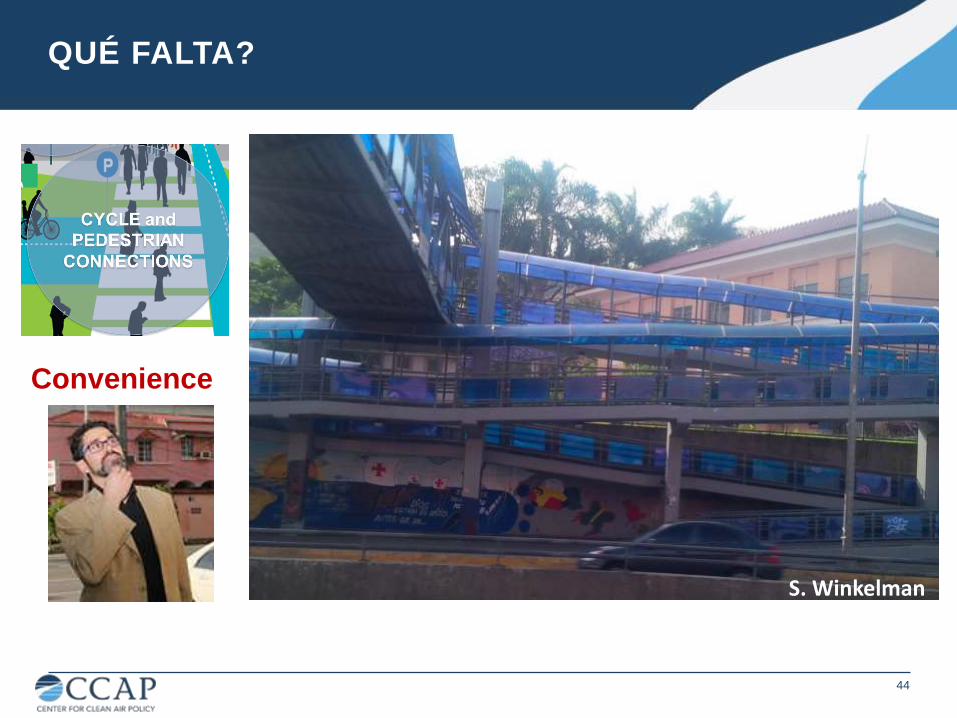
44
Convenience
QUÉ FALTA?
S. Winkelman

45
QUÉ FALTA?
Parking
enforcement
S. Winkelman
46
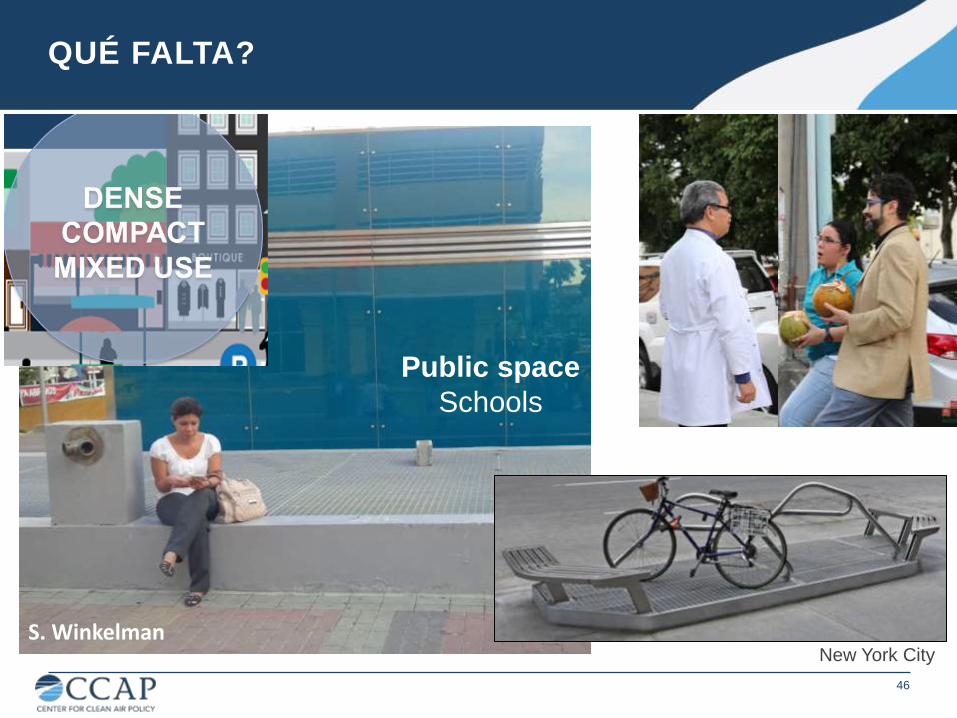
QUÉ FALTA?
New York City
Public space
Schools
S. Winkelman
47
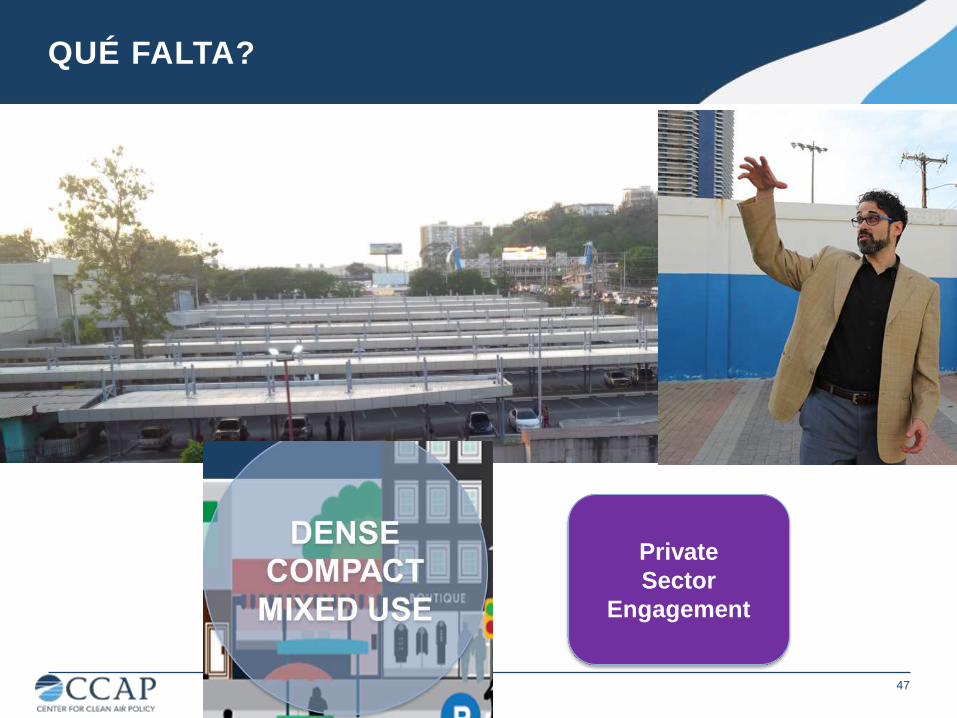
QUÉ FALTA?
Private
Sector
Engagement
S. Winkelman
48
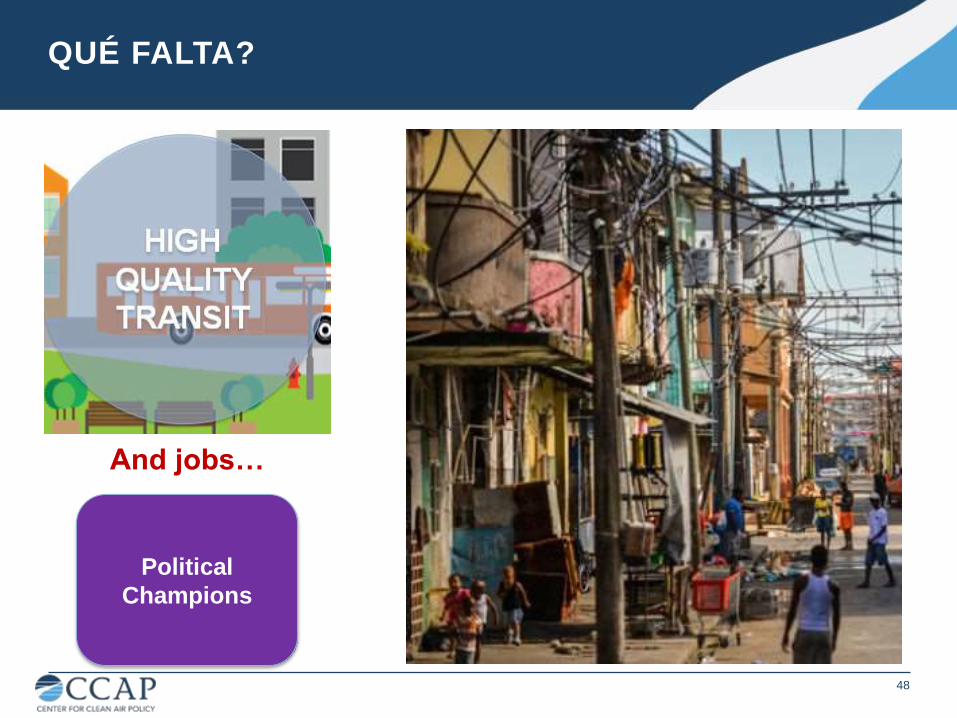
QUÉ FALTA?
Political
Champions
And jobs…
CCAP 49
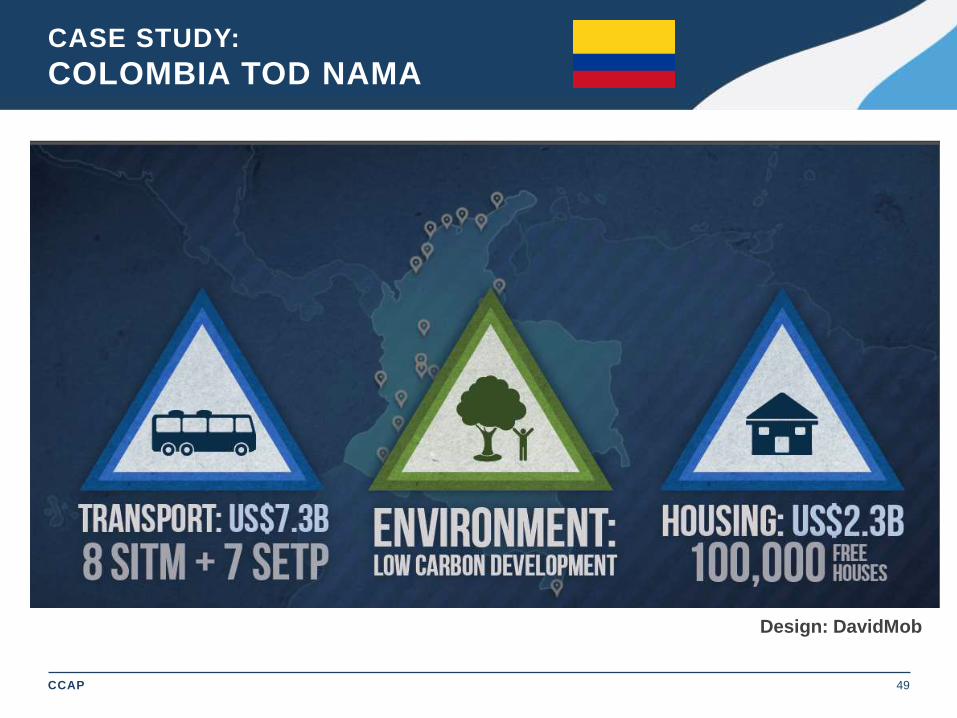
CASE STUDY:
COLOMBIA TOD NAMA
Design: DavidMob
CCAP 50
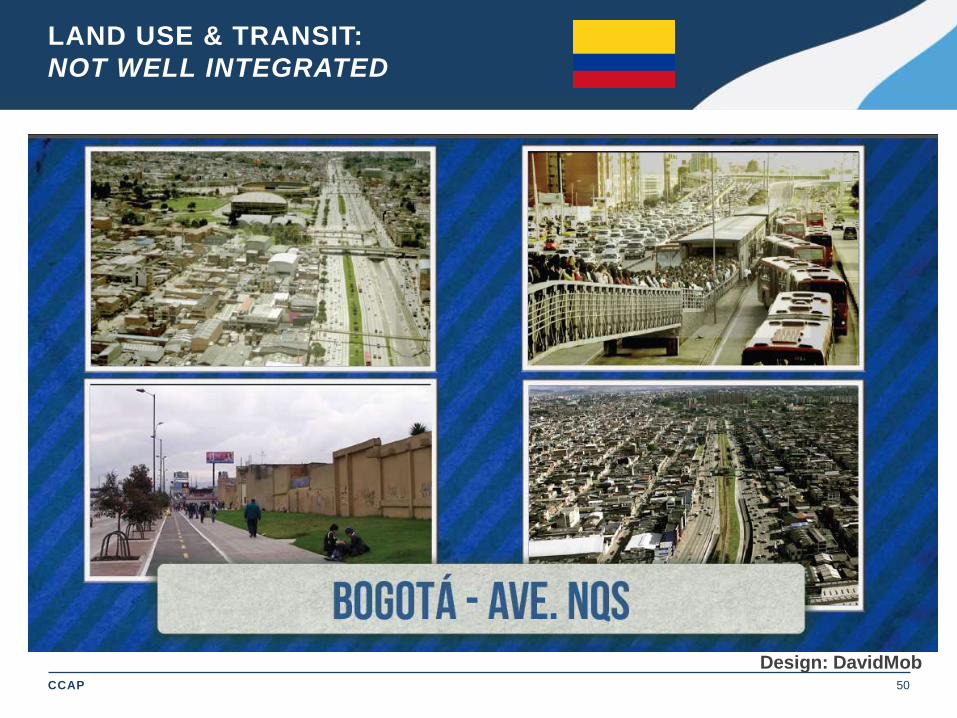
LAND USE & TRANSIT:
NOT WELL INTEGRATED
Design: DavidMob
CCAP 51
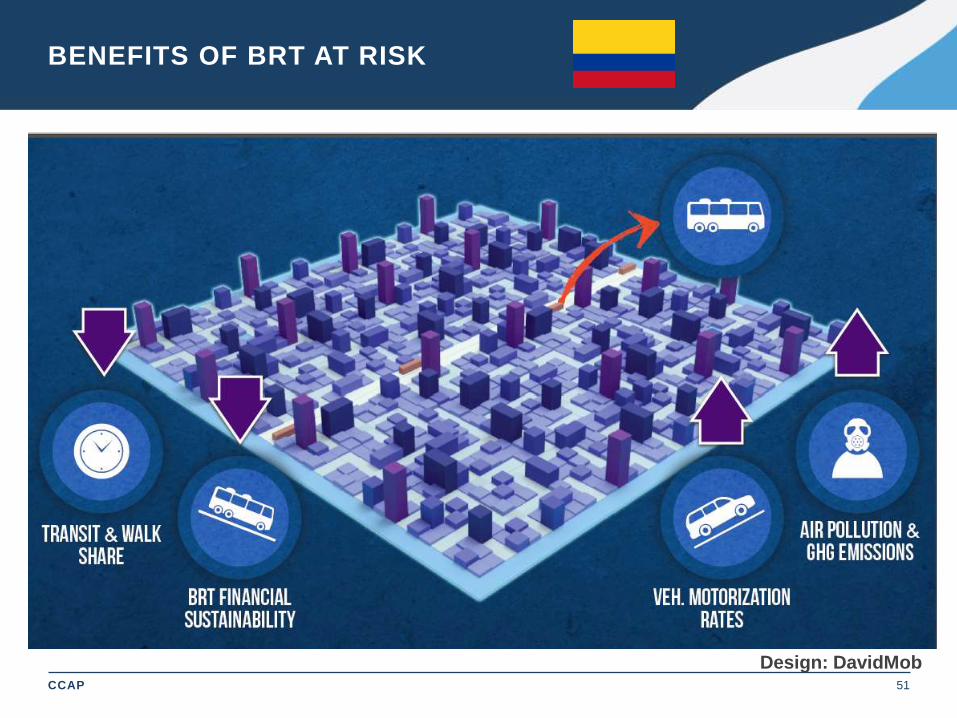
BENEFITS OF BRT AT RISK
Design: DavidMob
CCAP 52
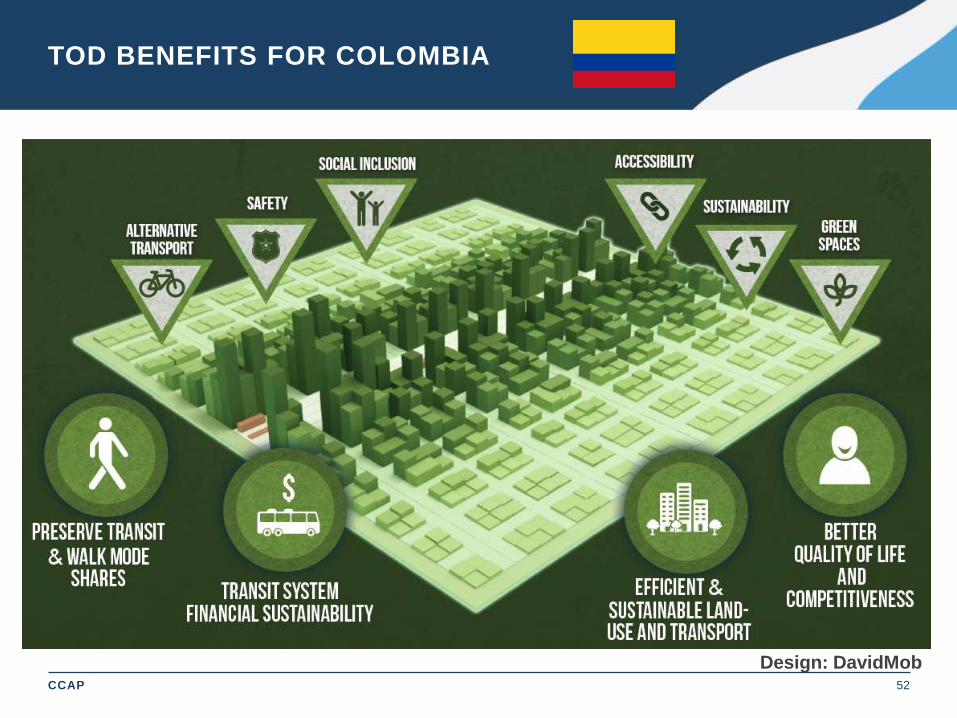
TOD BENEFITS FOR COLOMBIA
Design: DavidMob
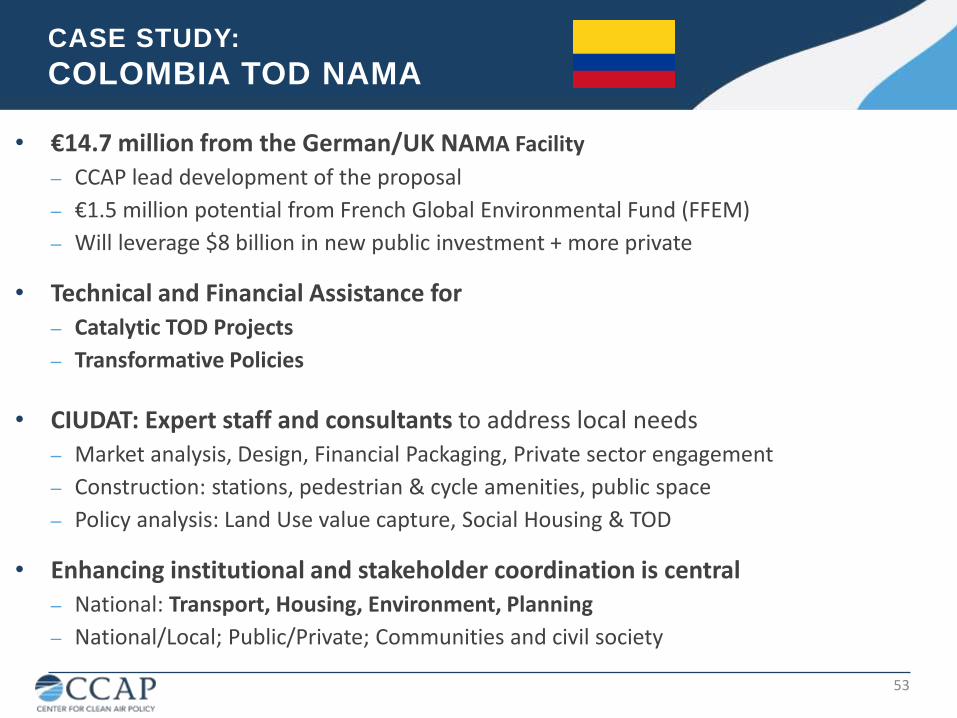
• €14.7 million from the German/UK NAMA Facility
– CCAP lead development of the proposal
– €1.5 million potential from French Global Environmental Fund (FFEM)
– Will leverage $8 billion in new public investment + more private
• Technical and Financial Assistance for
– Catalytic TOD Projects
– Transformative Policies
• CIUDAT: Expert staff and consultants to address local needs
– Market analysis, Design, Financial Packaging, Private sector engagement
– Construction: stations, pedestrian & cycle amenities, public space
– Policy analysis: Land Use value capture, Social Housing & TOD
• Enhancing institutional and stakeholder coordination is central
– National: Transport, Housing, Environment, Planning
– National/Local; Public/Private; Communities and civil society
53
CASE STUDY:
COLOMBIA TOD NAMA
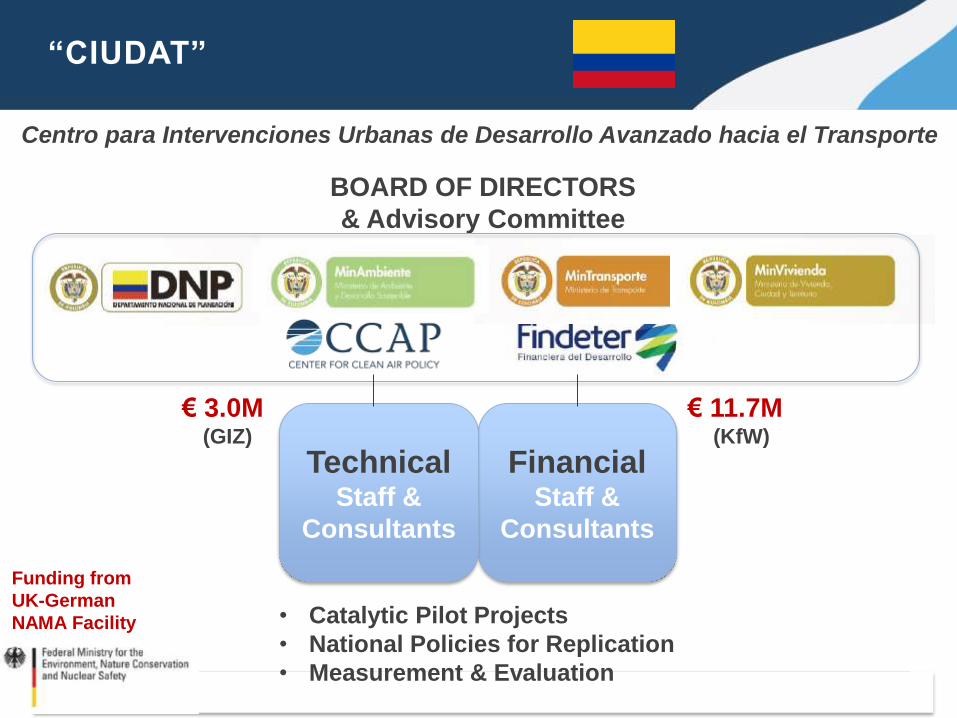
“CIUDAT”
CIUDAT
Centro para Intervenciones
Urbanas de Desarrollo
Avanzado hacia el
Transporte
CIUDAT
Centro para Intervenciones
Urbanas de Desarrollo
Avanzado hacia el
Transporte
CIUDAT
Centro para Intervenciones
Urbanas de Desarrollo
Avanzado hacia el
Transporte
CIUDAT
Centro para Intervenciones
Urbanas de Desarrollo
Avanzado hacia el
Transporte
CIUDAT
Centro para Intervenciones
Urbanas de Desarrollo
Avanzado hacia el
Transporte
CIUDAT
Centro para Intervenciones
Urbanas de Desarrollo
Avanzado hacia el
TransporteCentro para Intervenciones Urbanas de Desarrollo Avanzado hacia el Transporte
BOARD OF DIRECTORS
& Advisory Committee
• Catalytic Pilot Projects
• National Policies for Replication
• Measurement & Evaluation
Financial Staff &
Consultants
Technical Staff &
Consultants
€ 3.0M (GIZ)
€ 11.7M (KfW)
Funding from
UK-German
NAMA Facility
CCAP 55
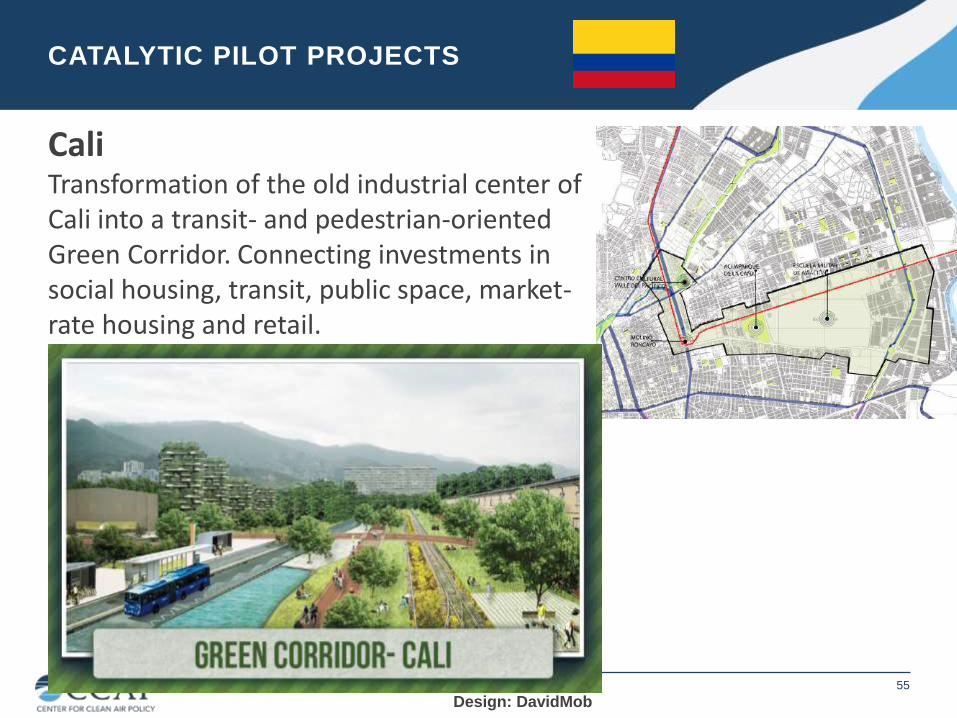
Cali Transformation of the old industrial center of Cali into a transit- and pedestrian-oriented Green Corridor. Connecting investments in social housing, transit, public space, market-rate housing and retail.
CCAP
CATALYTIC PILOT PROJECTS
Design: DavidMob
CCAP 56
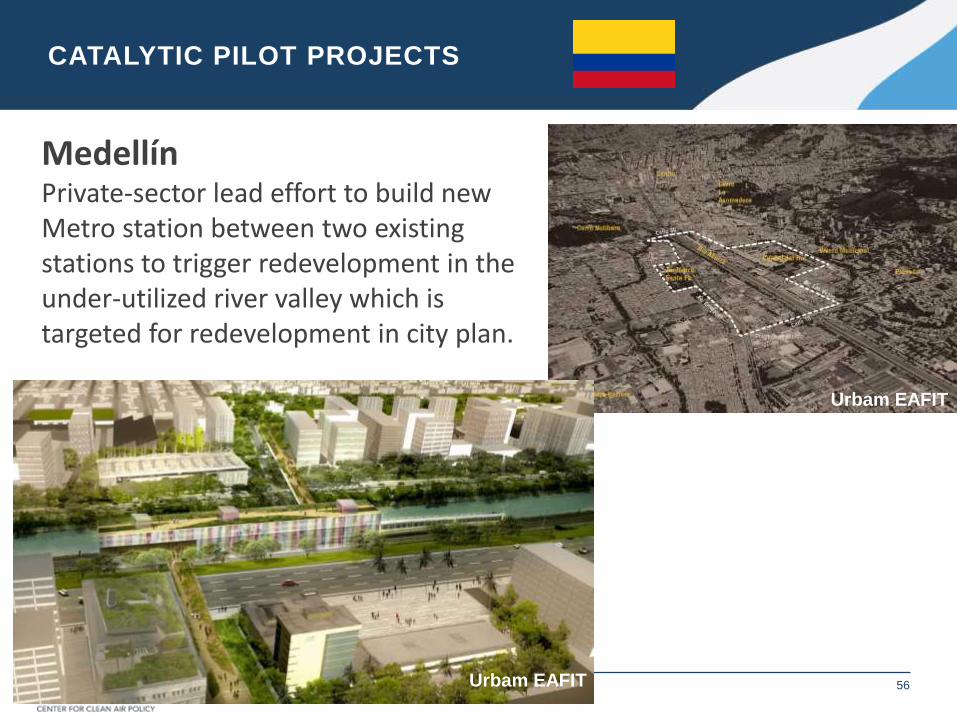
Medellín Private-sector lead effort to build new Metro station between two existing stations to trigger redevelopment in the under-utilized river valley which is targeted for redevelopment in city plan.
CATALYTIC PILOT PROJECTS
Urbam EAFIT
Urbam EAFIT
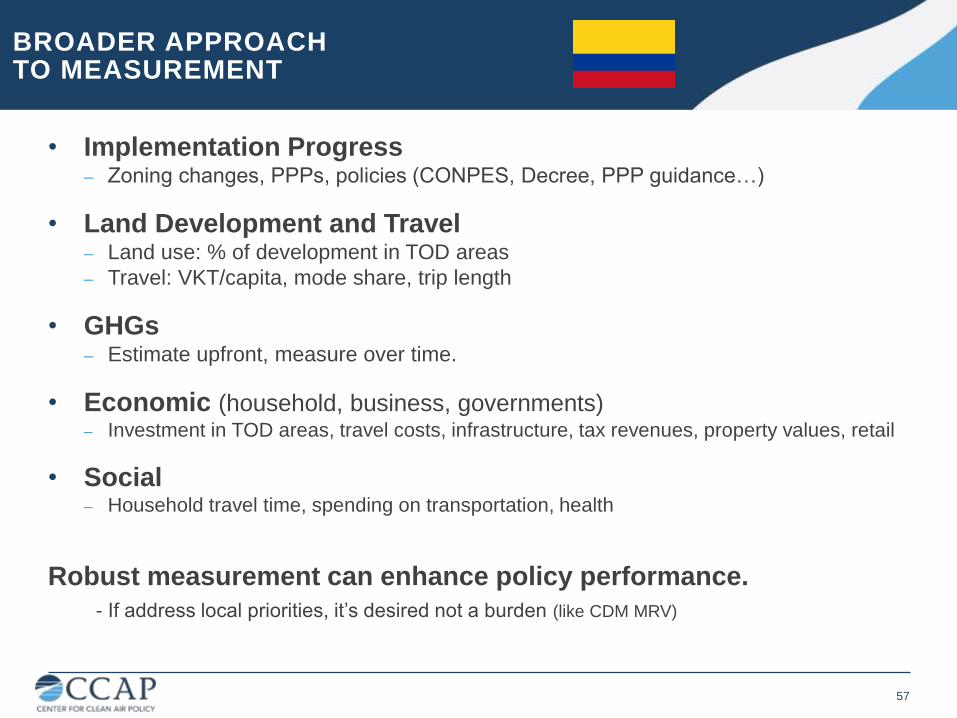
• Implementation Progress – Zoning changes, PPPs, policies (CONPES, Decree, PPP guidance…)
• Land Development and Travel – Land use: % of development in TOD areas
– Travel: VKT/capita, mode share, trip length
• GHGs – Estimate upfront, measure over time.
• Economic (household, business, governments) – Investment in TOD areas, travel costs, infrastructure, tax revenues, property values, retail
• Social – Household travel time, spending on transportation, health
Robust measurement can enhance policy performance.
- If address local priorities, it’s desired not a burden (like CDM MRV)
57
BROADER APPROACH TO MEASUREMENT
58
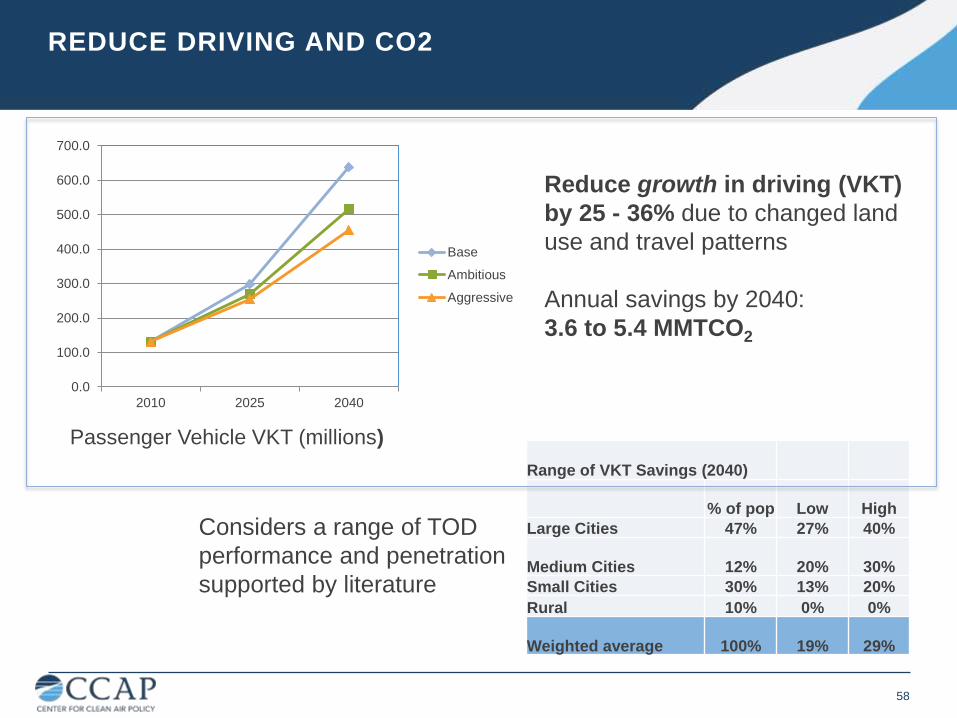
Range of VKT Savings (2040)
% of pop Low High
Large Cities 47% 27% 40%
Medium Cities 12% 20% 30%
Small Cities 30% 13% 20%
Rural 10% 0% 0%
Weighted average 100% 19% 29%
0.0
100.0
200.0
300.0
400.0
500.0
600.0
700.0
2010 2025 2040
Base
Ambitious
Aggressive
Passenger Vehicle VKT (millions)
Reduce growth in driving (VKT)
by 25 - 36% due to changed land
use and travel patterns
Annual savings by 2040:
3.6 to 5.4 MMTCO2
Considers a range of TOD
performance and penetration
supported by literature
REDUCE DRIVING AND CO2
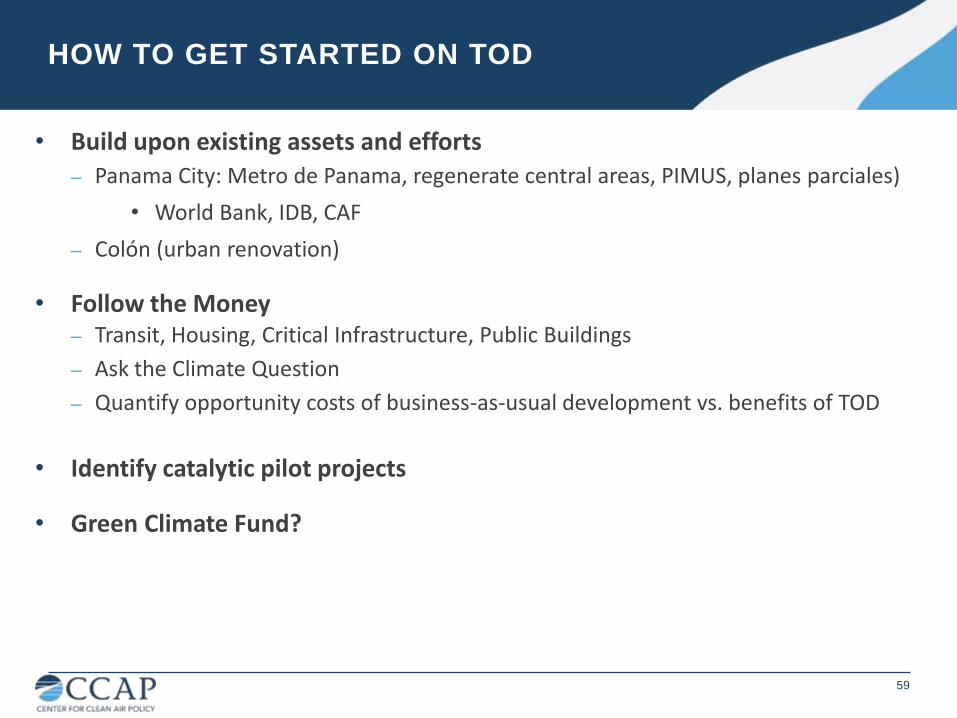
HOW TO GET STARTED ON TOD
59
• Build upon existing assets and efforts
– Panama City: Metro de Panama, regenerate central areas, PIMUS, planes parciales)
• World Bank, IDB, CAF
– Colón (urban renovation)
• Follow the Money – Transit, Housing, Critical Infrastructure, Public Buildings
– Ask the Climate Question
– Quantify opportunity costs of business-as-usual development vs. benefits of TOD
• Identify catalytic pilot projects
• Green Climate Fund?

FOLLOW THE MONEY: ADAPTATION, MITIGATION AND INFRASTRUCTURE
Green Resilience: Adaptation + Mitigation Synergies
Adaptation Mitigation Infrastructure
$10,000,000 $10,000,000 $2,000,000,000
Dune
restoration
Wind turbines &
PhotovoltaicsRoads
$5,000,000 $5,000,000 $1,000,000,000
Green
Infrastructure
Green
Buildings
Water treatement
facilities
$1,000,000 $500,000 $500,000,000
Vulnerability
Assessment
Education &
OutreachTransit system improvements
Inve
stm
en
ts
#1
#2
#3
3x3 Green Resilience Matrix Identifying Climate Adaptation + Mitigation Synergies
WHAT ARE YOUR TOP 3 INVESTMENTS?
Ask the
3x3
Climate
Question
ExamplesExamplesExamples
$10,000,000 $10,000,000 $2,000,000,000
Dune
restoration
Wind turbines &
PhotovoltaicsRoads
$5,000,000 $5,000,000 $1,000,000,000
Green
Infrastructure
Green
Buildings
Water treatement
facilities
$1,000,000 $500,000 $500,000,000
Vulnerability
Assessment
Education &
OutreachTransit system improvements
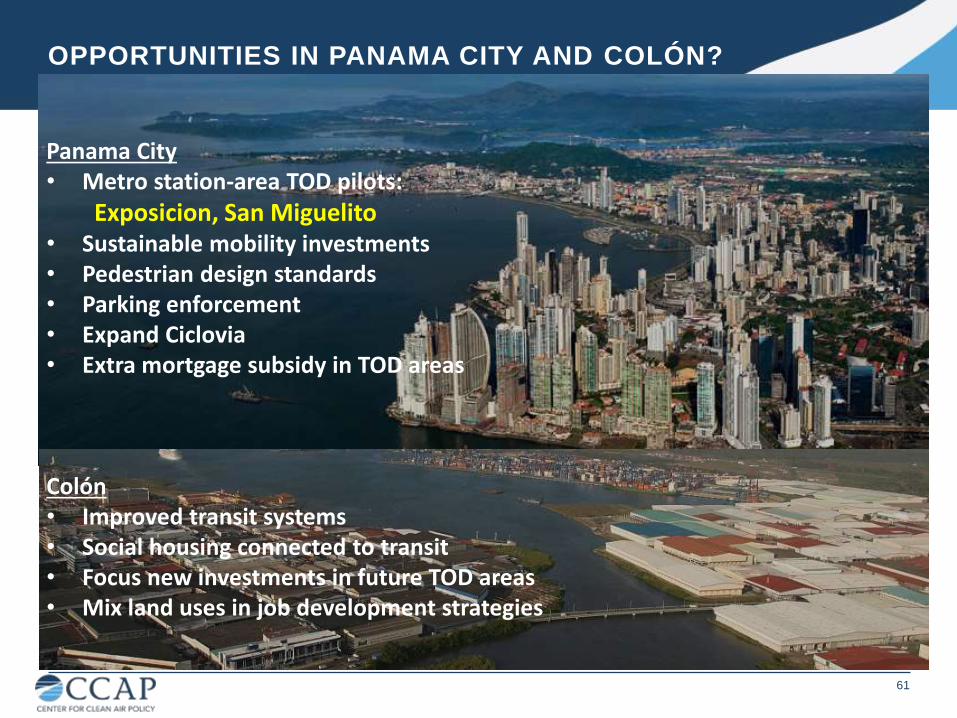
Panama City • Metro station-area TOD pilots:
Exposicion, San Miguelito • Sustainable mobility investments • Pedestrian design standards • Parking enforcement • Expand Ciclovia • Extra mortgage subsidy in TOD areas Colón • Improved transit systems • Social housing connected to transit • Focus new investments in future TOD areas • Mix land uses in job development strategies
61
OPPORTUNITIES IN PANAMA CITY AND COLÓN?
62
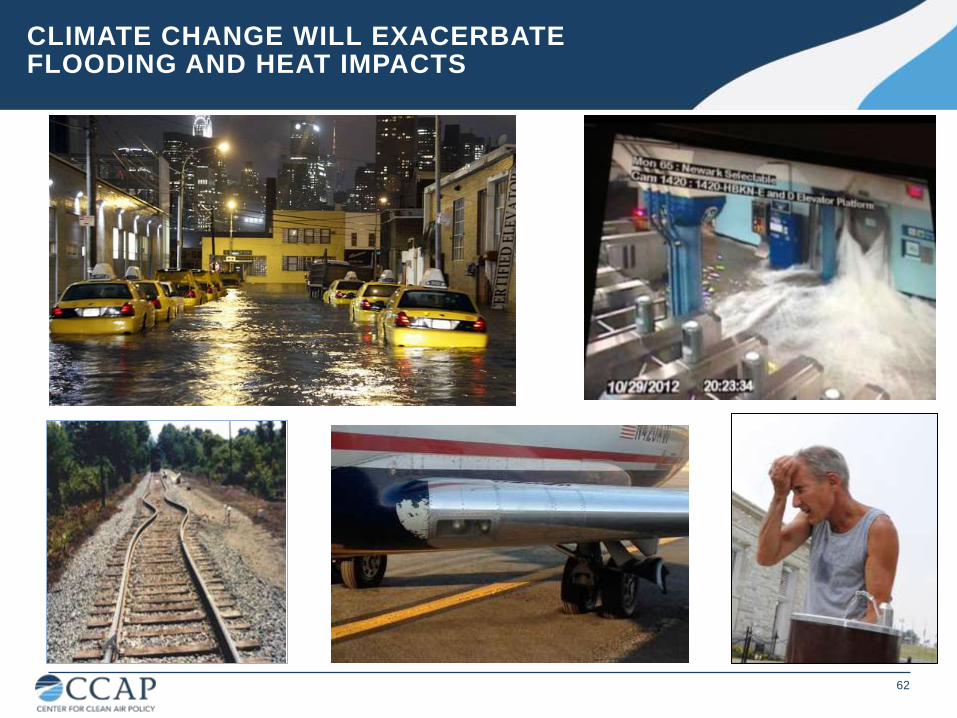
CLIMATE CHANGE WILL EXACERBATE FLOODING AND HEAT IMPACTS
63
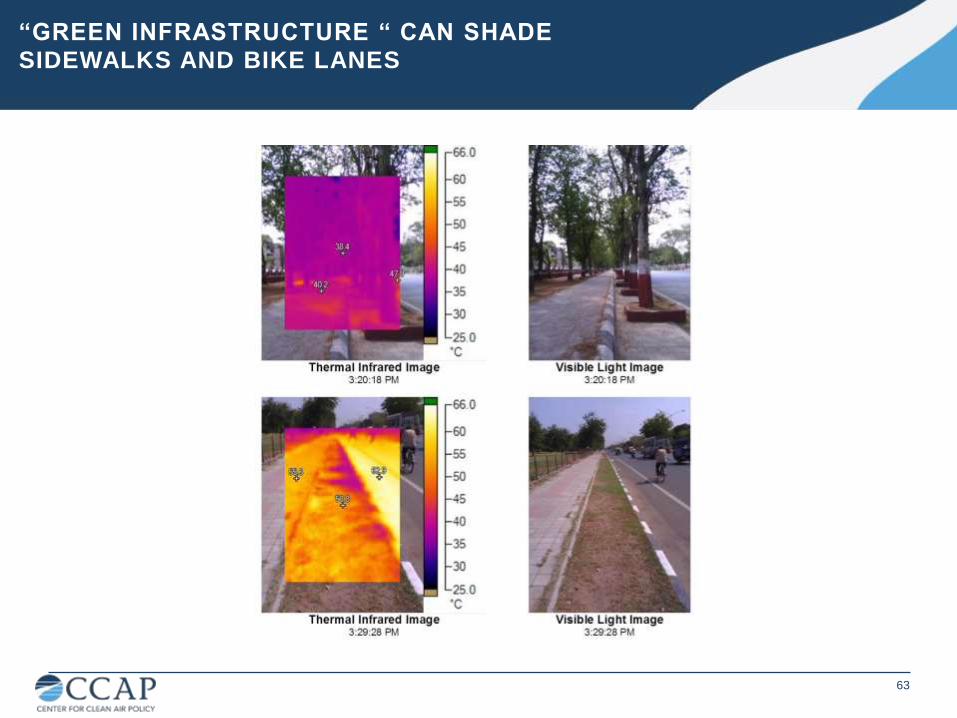
“GREEN INFRASTRUCTURE “ CAN SHADE SIDEWALKS AND BIKE LANES
64
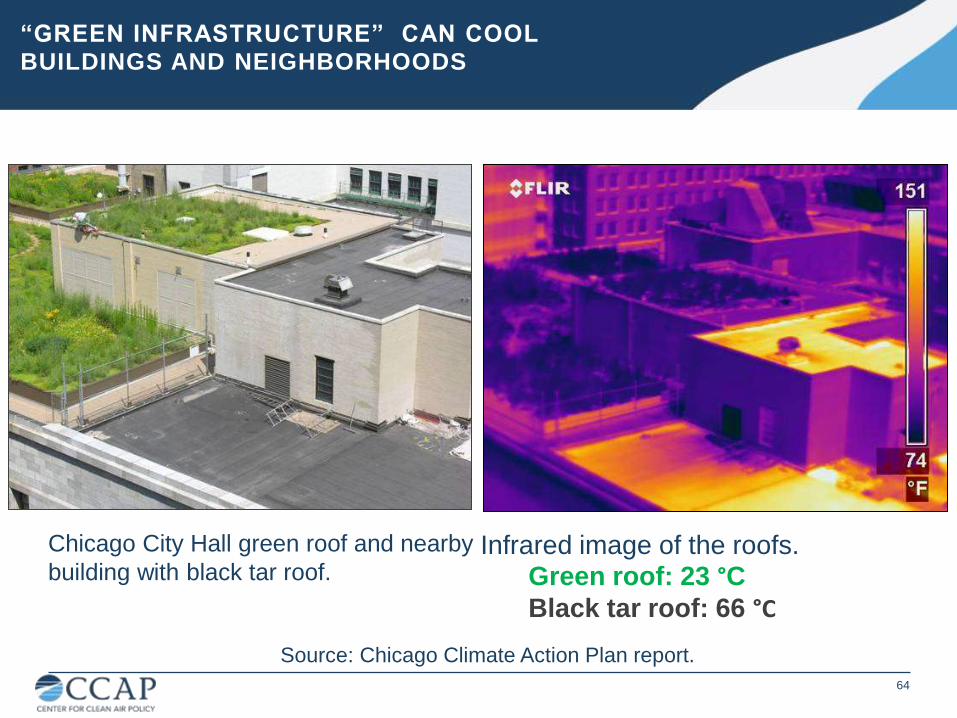
Chicago City Hall green roof and nearby
building with black tar roof. Infrared image of the roofs. Green roof: 23 °C
Black tar roof: 66 °C
“GREEN INFRASTRUCTURE” CAN COOL BUILDINGS AND NEIGHBORHOODS
Source: Chicago Climate Action Plan report.

FLOOD MITIGATION: GREEN INFRASTRUCTURE HAS HIGHER ECONOMIC BENEFITS THAN “GREY”
Houston Philadelphia
Stormwater benefit
from trees: $1.3B
No trees: $0B
50% low impact
development: $2.85B
Normal 30’ tunnel:
$0.12B
65
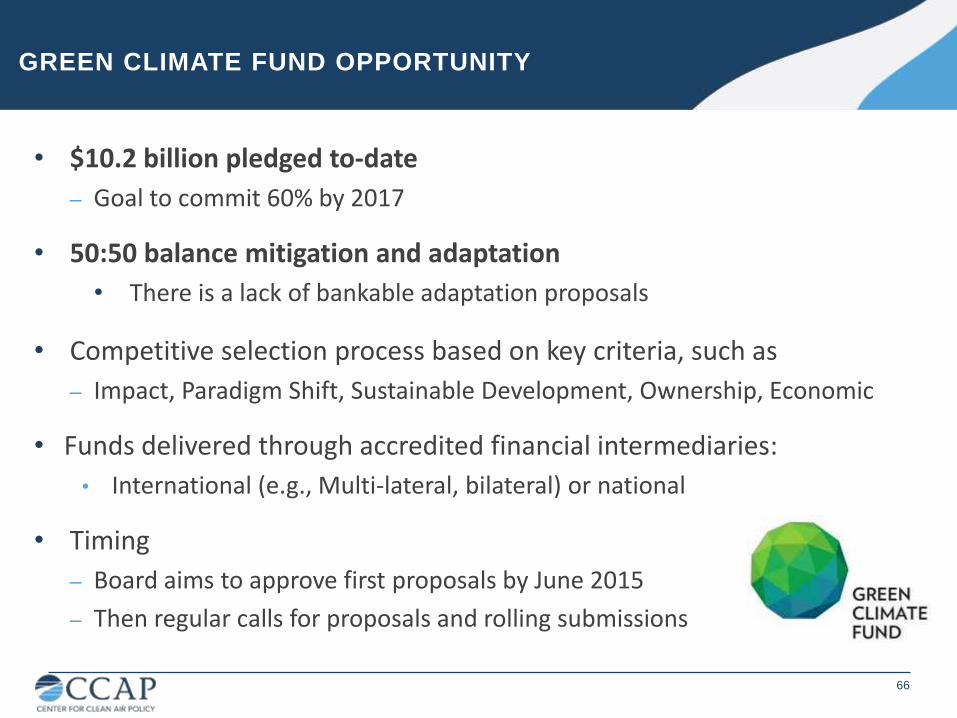
GREEN CLIMATE FUND OPPORTUNITY
• $10.2 billion pledged to-date
– Goal to commit 60% by 2017
• 50:50 balance mitigation and adaptation
• There is a lack of bankable adaptation proposals
• Competitive selection process based on key criteria, such as
– Impact, Paradigm Shift, Sustainable Development, Ownership, Economic
• Funds delivered through accredited financial intermediaries:
• International (e.g., Multi-lateral, bilateral) or national
• Timing
– Board aims to approve first proposals by June 2015
– Then regular calls for proposals and rolling submissions
66
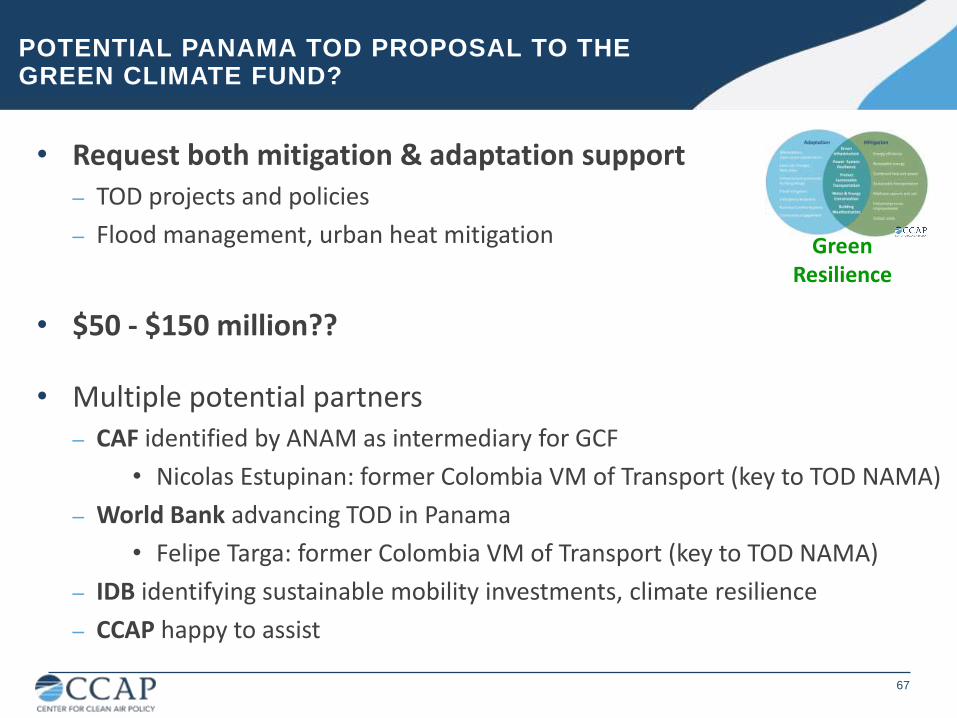
POTENTIAL PANAMA TOD PROPOSAL TO THE GREEN CLIMATE FUND?
• $50 - $150 million??
• Multiple potential partners – CAF identified by ANAM as intermediary for GCF
• Nicolas Estupinan: former Colombia VM of Transport (key to TOD NAMA)
– World Bank advancing TOD in Panama
• Felipe Targa: former Colombia VM of Transport (key to TOD NAMA)
– IDB identifying sustainable mobility investments, climate resilience
– CCAP happy to assist bankable adaptation proposals
Green Resilience
• Request both mitigation & adaptation support – TOD projects and policies
– Flood management, urban heat mitigation
67
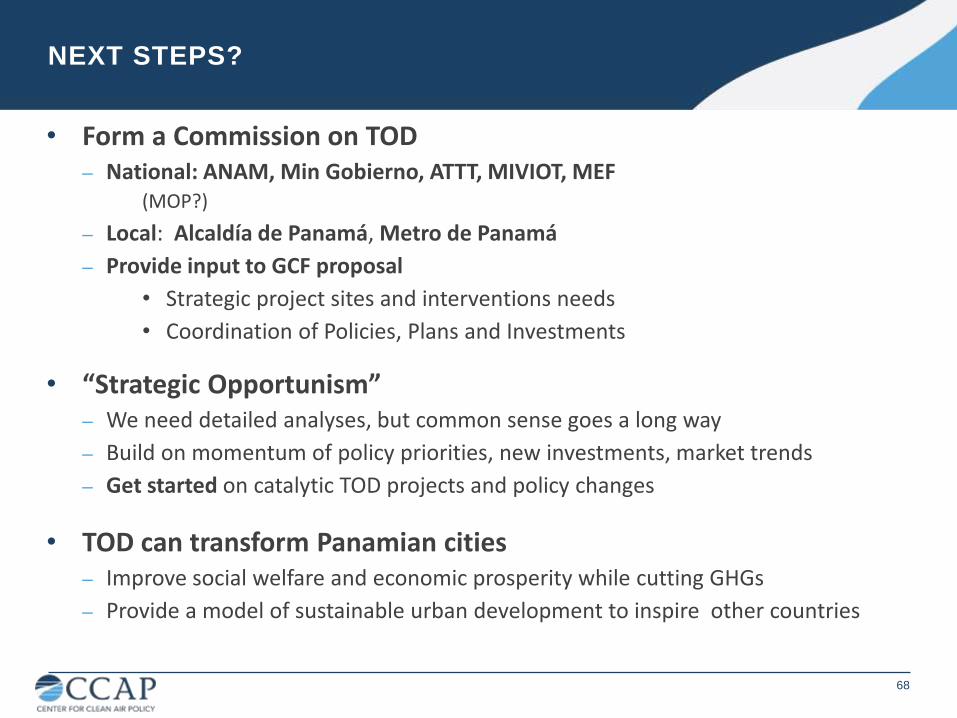
• Form a Commission on TOD – National: ANAM, Min Gobierno, ATTT, MIVIOT, MEF
(MOP?)
– Local: Alcaldía de Panamá, Metro de Panamá
– Provide input to GCF proposal
• Strategic project sites and interventions needs
• Coordination of Policies, Plans and Investments
• “Strategic Opportunism” – We need detailed analyses, but common sense goes a long way
– Build on momentum of policy priorities, new investments, market trends
– Get started on catalytic TOD projects and policy changes
• TOD can transform Panamian cities
– Improve social welfare and economic prosperity while cutting GHGs
– Provide a model of sustainable urban development to inspire other countries
68
NEXT STEPS?
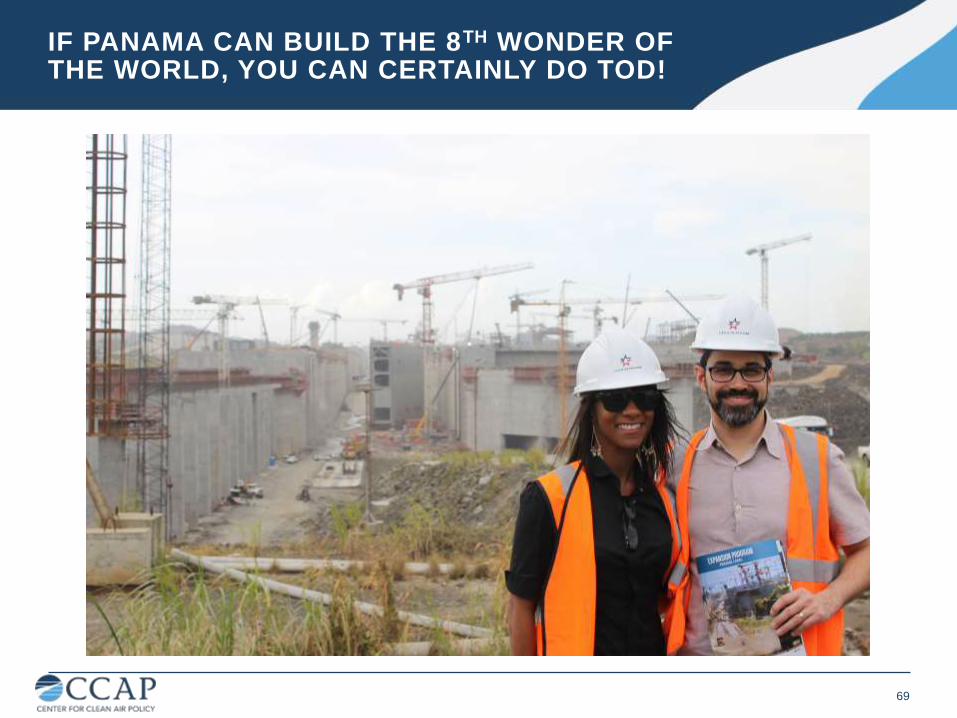
IF PANAMA CAN BUILD THE 8TH WONDER OF THE WORLD, YOU CAN CERTAINLY DO TOD!
69
¡Gracias!
www.ccap.org
Steve Winkelman Director, Transportation and Adaptation Programs
[email protected] @stevewink
Thank you to:
Chuck Kooshian Senior Policy Analyst