Development of Novel Analytical Applications for Single ...
145
Development of Novel Analytical Applications for Single Molecule Fluorescence Spectroscopy by Sean M. Burrows, B. S. A Dissertation In ANALYTICAL CHEMISTRY Submitted to the Graduate Faculty of Texas Tech University in Partial Fulfillment of the Requirements for the Degree of DOCTOR OF PHILOSOPHY Approved Dimitri Pappas, Chairperson Carol L. Korzeniewski Dominick J. Casadonte, Jr. Edward L. Quitevis Fred Hartmeister Dean of the Graduate School August, 2009
Transcript of Development of Novel Analytical Applications for Single ...
Development of Novel Analytical Applications for Single Molecule Fluorescence Spectroscopy
by
Sean M. Burrows, B. S.
A Dissertation
In
ANALYTICAL CHEMISTRY
Submitted to the Graduate Faculty of Texas Tech University in
Partial Fulfillment of the Requirements for
the Degree of
DOCTOR OF PHILOSOPHY
Approved
Dimitri Pappas, Chairperson
Carol L. Korzeniewski
Dominick J. Casadonte, Jr.
Edward L. Quitevis
Fred Hartmeister Dean of the Graduate School
August, 2009

I dedicate my dissertation to my family and friends who have been a constant source of
encouragement throughout my Ph.D. journey.

Copyright 2009, Sean M. Burrows

Texas Tech University, Sean M. Burrows, August 8, 2009
ii
Acknowledgements First and foremost I would like to thank Dimitri Pappas for his constant support and
encouragement. Under Dimitri’s direction I have developed a solid foundation of optics and
spectroscopy. Dimitri provided me with the tools and the knowledge to build a single
molecule detector. He also taught me almost everything I know about electronics. From the
discussions in his office to the demonstrations in our lab I was able to harness my
spectroscopic and scientific skills. Dimitri has been more than an adviser but also a friend
and even more like a big brother. Whether he was assisting me in my personal life or my
scholastic life he always had insightful advise.
I also would like to thank Michael Hampton and Otto Phanstiel. These individuals
were my undergraduate advisors who really believed in me. Had it not been for their
encouragement and constant support I would not have entered into a doctoral program. They
have continued to support me in my graduate career with advice and guidance.
In my first year Jason Dyke, an elder student, graciously assisted me as I acclimated
into the graduate program. I have grown as a scientist along with Kelong Wang, Ke Liu,
Randall Reif and Michelle Martinez. Kelong, Ke and myself are Dimitri’s first graduate
students. It has been a rewarding experience to grow as individuals and scholars alongside
my companions. As one of Dimitri’s first students I have learned what is necessary to start a
successful research group. Randall and Michelle have worked with me on the single
molecule studies. I have enjoyed the in-depth conversations on various topics of
spectroscopy. Finally, I would like to recognize the new students Liu Yan, Tian Yu, and Li

Texas Tech University, Sean M. Burrows, August 8, 2009
iii
Peng. I thoroughly enjoyed befriending them as well as teaching them the skills necessary to
be a successful graduate student.
I would like to thank Carol Korzeniewski, the late Denis Shelly, Edward Quitevis,
Dominick Casadonte and Purnendu “Sandy” Dasgupta. Each of these people has been
instrumental in my development as a scientist. These individuals always had their doors
open for guidance and encouragement. Along with Dimitri, Carol and Dominick have
supported me with letters of recommendation for various fellowships, awards and
postdoctoral pursuits. Finally, I would like to thank Chris Bradley for noticing my talents
and supporting me for the Horn Professors Graduate Achievement Award.
I would like to thank Nina Pruitt, Kathy Jones, Yesenia Sanchez and Whitney Green.
These individuals were extremely helpful with administrative support. I would also like to
thank the Department of Chemistry and Biochemistry for the opportunity to pursue my
doctoral degree. A special thanks is extended to the machine shop, electronic shop and Jim
Hildebrand, the building manager, all whom assisted in some form with the research and my
development as a scientist and a person. Without Duane Hindes we would not have the
machined parts necessary for our single molecule detector. Duane along with Scott Hiemstra
taught me almost everything I know about drafting.
Finally, I would like to thank all my friends and family who have supported me.
Especially my parents JoAnne and William who never gave up on me and were a constant
source of encouragement. My sisters Laurie and Erin have also been incredibly supportive.
This work was sponsored by the Robert A. Welch Foundation and Texas Tech University,
and honored by the Horn Professor’s Graduate Achievement Award and the Society for
Applied Spectroscopy Graduate Student Award.

Texas Tech University, Sean M. Burrows, August 8, 2009
iv
Table of Contents
Acknowledgements .......................................................................... ii Abstract ......................................................................................... viii List of Tables .................................................................................... x
List of Figures ................................................................................. xi Chapter I .......................................................................................... 1
Introduction to Single Molecule Fluorescence Spectroscopy........ 1
1. Single Molecule Detection........................................................................ 1
2. Protein-Protein Interactions.................................................................... 2
3. Complexation of Single Molecules .......................................................... 5
4. Quantification and Assays ....................................................................... 8
5. References................................................................................................11
Chapter II ....................................................................................... 13
Instrumentation ............................................................................. 13
1. Single molecule detection........................................................................13
2. Signal Detection and Processing.............................................................14
3. Reference:................................................................................................16
Chapter III ..................................................................................... 17
Investigation of Photobleaching and Saturation of Single Molecules by Fluorophore Recrossing Events ............................. 17
1. Introduction ............................................................................................17
2. Theory......................................................................................................20
3. Experimental ...........................................................................................24

Texas Tech University, Sean M. Burrows, August 8, 2009
v
3.1. Dye samples ................................................................................................................................24 3.2. Data Analysis ..............................................................................................................................26
4. Results......................................................................................................26
4.1. Single Molecule Fluorescence Bursts. ......................................................................................26 4.2. Fluorescence Burst Interpeak Times. ........................................................................................28 4.3. Single Molecule Fluorescence Burst Peak Height as a Function of Power:..........................29 4.4. Molecule Recrossing as a Function of Power. .........................................................................33
5. Discussion ................................................................................................33
6. Conclusion ...............................................................................................35
7. References: ..............................................................................................37
Chapter IV...................................................................................... 38
Light Tolerance of R-Phycoerythrin and a Tandem Conjugate Observed by Single Molecule Recrossing Events......................... 38
1. Introduction ............................................................................................38
2. Experimental ...........................................................................................42
2.1. Dye Samples. ...............................................................................................................................42 2.2. Instrumental Setup. .....................................................................................................................42
3. Results......................................................................................................44
3.1. Saturation Irradiation. ...............................................................................................................44 3.2. Normalized Recrossing as a Function of Power. .....................................................................47 3.3. Fluorescence Intensity and Normalized Recrossing as a Function of Time...........................49
4. Discussion ................................................................................................51
5. Conclusion ...............................................................................................58
6. Reference:................................................................................................60
Chapter V ....................................................................................... 62
Noise and Error in Single Molecule Fluorescence Anisotropy.... 62
1. Introduction ............................................................................................62
2. Error Considerations ..............................................................................65

Texas Tech University, Sean M. Burrows, August 8, 2009
vi
3. Experimental ...........................................................................................69
3.1. Dye Samples/Instrumental considerations................................................................................69
4. Results......................................................................................................69
4.1. Distributions of Anisotropy in Low and High Viscosity Solutions ..........................................69 4.2. Mixtures of Low and High Anisotropy Systems ........................................................................76
5. Discussion ................................................................................................81
6. Conclusion ...............................................................................................82
7. References................................................................................................84
Chapter VI...................................................................................... 85
Measuring Complexation by Single Molecule Fluorescence Anisotropy ...................................................................................... 85
1. Introduction ............................................................................................85
2. Results and Discussion............................................................................87
3. Conclusion ...............................................................................................91
4. Reference .................................................................................................92
Chapter VII .................................................................................... 93
Comparison of Methods to Classify and Quantify Free and Bound States of Complexes using Single Molecule Fluorescence Anisotropy ...................................................................................... 93
1. Introduction ............................................................................................93
2. Experimental ...........................................................................................97
2.1. Chemicals and reagents .............................................................................................................97 2.2. Signal detection and anisotropy measurements........................................................................97
3. Results....................................................................................................100
3.1. Error in single molecule fluorescence anisotropy and classification of free and bound probe molecules ..........................................................................................................................................100 3.2. Methods to extract and quantify fluorescent bursts from single molecules ..........................103 3.3. Biotin competition with BR110 for Neutravidin .....................................................................111

Texas Tech University, Sean M. Burrows, August 8, 2009
vii
4. Discussion ..............................................................................................113
5. Conclusion .............................................................................................121
6. References..............................................................................................124
Chapter VIII..................................................................................127
Closing remarks and outlook .......................................................127
Bibliography..................................................................................130

Texas Tech University, Sean M. Burrows, August 8, 2009
viii
Abstract
The molecular recrossing of single molecules in a defined probe volume was used to
investigate photobleaching and saturation of single molecules. The normalized recrossing
ratio, Nr/Nt, was defined as the number of molecules that reenter the probe volume (Nr) to
the total number of molecules detected (Nt). Saturation irradiance and photobleaching
effects were determined as a function of irradiance for Calcein, Fluorescein, R-Phycoerythrin
and Streptavidin R-Phycoerythrin-AlexaFluor-647. The light tolerance and the energy
transfer process in phycobiliproteins were studied as a function of excitation irradiation and
irradiation time. Normalized molecular recrossings showed that energy transfer to a tandem
conjugate could reduce the formation of triplet states in R-Phycoerythrin and extend the light
tolerance of certain phycobiliproteins. Measuring normalized recrossing ratios serves as a
method of optimizing experimental conditions for single molecule detection and examining
the light tolerance and energy transfer in single molecular systems.
Single molecule fluorescence anisotropy (SMFA) is described to quantify free and
bound probe molecules from a complexation reaction. Initially the error on SMFA
measurements attributed to photon shot noise and molecular counting error was investigated.
The ability to quantify binding was investigated by formulating a ratio of bound to total
probe molecules sampled (Nb/Nt ratio). We report on a comparison of three methods to
extract fluorescent bursts from single molecules from a ten-minute time trace. The impact on
the Nb/Nt ratio using either anisotropy values alone or anisotropy combined with the
difference in detector counts (∆n) were investigated. The data analysis methods reduced the
systematic error due to scatter. Biotin-Rhodamine 110 (BR110) was used as the labeled
Texas Tech University, Sean M. Burrows, August 8, 2009
ix
probe for these studies. Increasing amounts of the target protein, Neutravidin, were added to
a constant amount of BR110. A competitive reaction between labeled BR110 probe and
unlabeled Biotin was also investigated. The use of SMFA as a tool to probe molecular
complexation will be useful in performing sensitive immunoassays, in drug discovery to
investigate and enhance the binding of drugs to their substrates, and to study other molecular
interactions.

Texas Tech University, Sean M. Burrows, August 8, 2009
x
List of Tables Table 3. 1 Experimentally determined and calculated saturation irradiances. .................................32 Table 5. 1 Single molecule anisotropies of rhodamine110, ACD4AF488, and mixture of
rhodamine110 with anti-CD4 AlexaFluor 488. Bulk anisotropy of the mixture as well. ..........80 Table 7. 1 For the complexation of 300 pM BR110 with 75 pM Neutravidin, Method I, II and III were
compared by evaluating the Nb/Nt ratio for 0 pM and 75 pM Neutravidin, percent misclassification of bound species in the 0 pM Neutravidin case, and the percent bound for 75 pM Neutravidin for the data in Figure 4. Two parameter classification was used to quantify free and Neutravidin bound BR110. ......................................................................................110
Table 7. 2 For the complexation of 300 pM BR110 with 75 pM Neutravidin, Method II and III were compared by evaluating the Nb/Nt ratio for 0 pM and 75 pM Neutravidin, percent misclassification of bound species in the 0 pM Neutravidin case and the percent bound for 75 pM Neutravidin for the data in Figure 4 and Figure 5. Two parameter classification was used to quantify free and Neutravidin bound BR110. ...................................................................120

Texas Tech University, Sean M. Burrows, August 8, 2009
xi
List of Figures Figure 2. 1 Single molecule detection apparatus2. See text for detailed description of the light path.
The optical bandpass filters used will be addressed in each chapter. ......................................15 Figure 3. 1 Rates of molecular transitions involved in fluorescence. kex = excitation rate, kse =
stimulated emission rate, kf = fluorescence rate, knr = nonradiative relaxation rate, kS-T = triplet conversion rate, KT-S = triplet relaxation rate. .....................................................................22
Figure 3. 2 Conceptual diagram of some possible molecular crossing paths through a diffraction-limited focused laser beam. In cases A and C, the molecule will cross through the beam and produce one fluorescence burst (top graph). In case B, the molecule may enter the laser for a second time bin (1 millisecond duration), producing a second burst Δt after the first burst. ......25
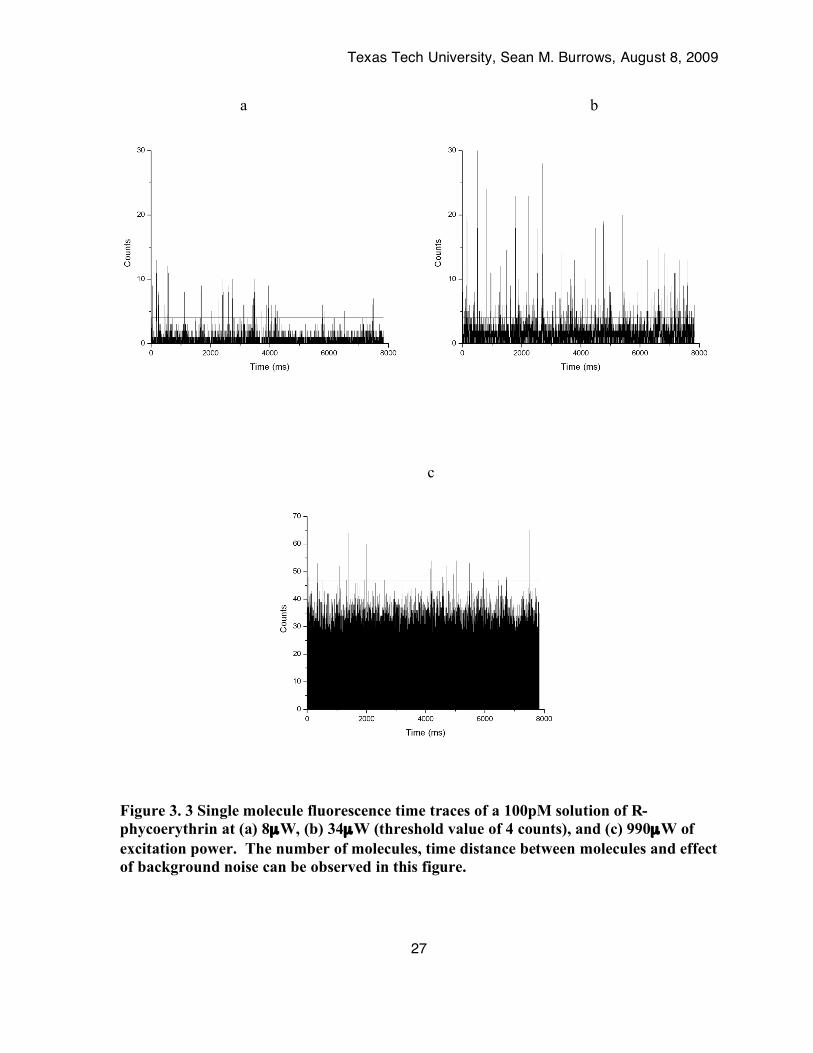
Figure 3. 3 Single molecule fluorescence time traces of a 100pM solution of R-phycoerythrin at (a) 8µW, (b) 34µW (threshold value of 4 counts), and (c) 990µW of excitation power. The number of molecules, time distance between molecules and effect of background noise can be observed in this figure. .................................................................................................................27
Figure 3. 4 Molecular recrossing events for a 100pM solution of R-phycoerythrin. Histograms of the interpeak times at (a) 8µW, (b) 34µW, and (c) 990µW. At low (a) and high (c) powers no molecules are observed to recross in the 2ms time bin. At the moderate power (b) molecule recrossing events are observed. ........................................................................................30
Figure 3. 5 Single molecule fluorescence burst peak height for (a) calcein (b) fluorescein and (c) R-phycoerythrin as a function of excitation power. Photon saturation can be observed as the plateau of signal at high powers........................................................................................31
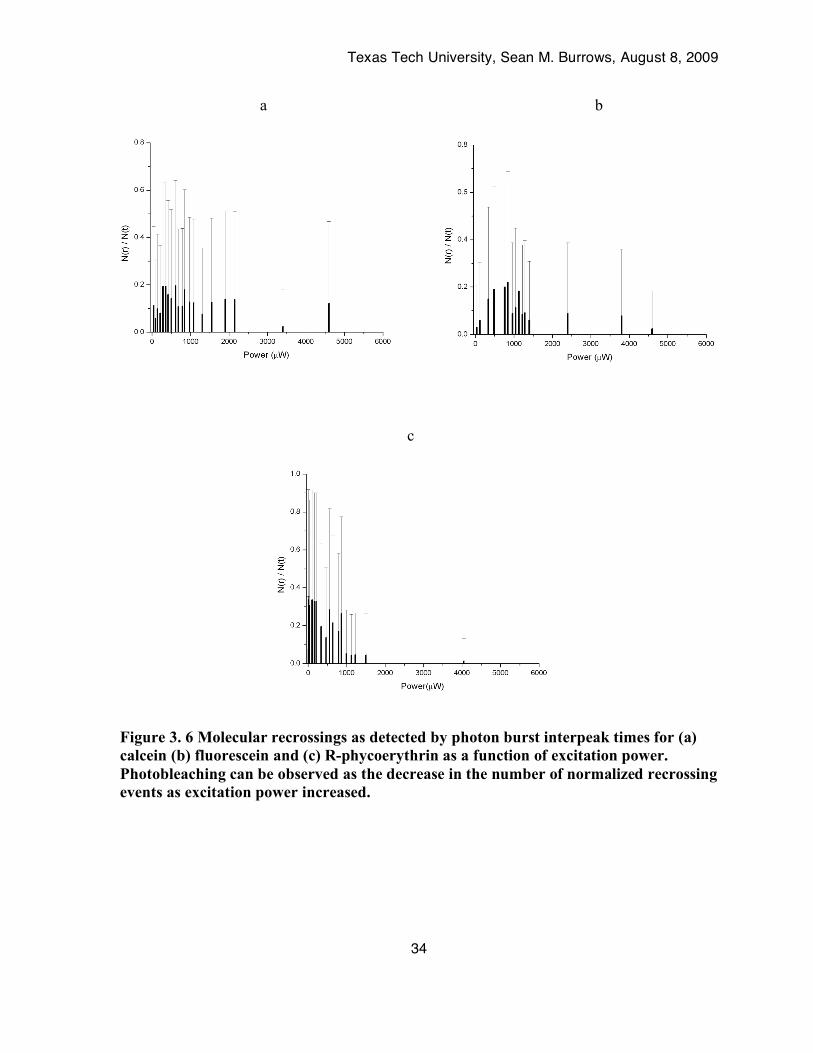
Figure 3. 6 Molecular recrossings as detected by photon burst interpeak times for (a) calcein (b) fluorescein and (c) R-phycoerythrin as a function of excitation power. Photobleaching can be observed as the decrease in the number of normalized recrossing events as excitation power increased. ......................................................................................................................34
Figure 4. 1 Baseline subtracted fluorescence intensity as a function of power. (A) 800 pM R-PE. (B)
825 pM PE-647. The limit of quantification (6σ) was used to extract signal above the baseline.....................................................................................................................................46
Figure 4. 2 Normalized molecular recrossings as a function of power. (A) 800 pM R-PE. (B) 825 pM PE-647. The nonzero normalized recrossing above 1.0 mW demonstrate the ability to observe the minimization of triplet state formation in the tandem conjugate using normalized recrossing events. ..........................................................................................................................48
Figure 4. 3 Number of molecules per second as a function of power. (A) 800 pM R-PE. (B) 825 pM PE-647. The number of detected molecules does not correlate with the number of recrossing events (Nr/Nt). ...............................................................................................................50
Figure 4. 4 Normalized recrossing ratio at 48 µW as a function of time. (A) 800 pM R-PE (B) 825 pM PE-647. ...................................................................................................................52
Figure 4. 5 Single molecule fluorescence burst intensity at 48 µW as a function of time. (A) 800 pM R-PE (B) 825 pM PE-647. While photobleaching is likely occurring, the rate of molecular arrival remains constant over the twenty-minute measurement. ............................................53
Figure 4. 6 Number of molecules per second as a function of time 48 µW. (A) 800 pM R-PE (B) 825 pM PE-647. The decrease in detected molecules for R-PE is attributed to a combination of photobleaching and triplet formation. In PE-647, triplet state formation is minimized, and the fluctuations are likely due to convection. ...........................................................................54

Texas Tech University, Sean M. Burrows, August 8, 2009
xii
Figure 5. 1 The error expected from photon shot noise as a function of detector signal. ..................68 Figure 5. 2 Histogram and Scatter plots of anisotropy for rhodamine 110 in PBS solvent at Ith > 10
(top) and Ith > 25 (bottom). .............................................................................................70 Figure 5. 3 Histogram and Scatter plots of anisotropy for rhodamine 110 in 50:50 PBS/glycerol
solvent. (a) Fluorescence peaks not integrated at Ith > 20 (b) Ith > 35 and (c) fluorescence peaks integrated for Ith > 35. ....................................................................................................71
Figure 5. 4 Anisotropy as a function of number of molecules for minimum and maximum threshold of rhodamine 123 in PBS (top) and 5050 PBS/glycerol mixture (bottom). .................................73
Figure 5. 5 Anisotropy as a function of threshold for rhodamine 123 in 50:50 PBS/glycerol and PBS.....................................................................................................................................74
Figure 5. 6 Rhodamine 110 in PBS and 5050 PBS/glycerol. Standard deviation as a function of threshold value. ..............................................................................................................75
Figure 5. 7 Histogram of anisotropy for a mixture of anti-CD4 AlexaFluor 488 and fluorscein at high and low thresholds. .........................................................................................................77
Figure 5. 8 Average Anisotropies of fluorescein, anti-CD4 AlexaFluor 488, and a mixture of anti-CD4 AlexaFluor 488 with fluorescein. ..............................................................................78
Figure 5. 9 Anisotropy histograms of (a) rhodamine110, (b) anti-CD4 AlexaFluor 488, and (c) mixture of anti-CD4 AlexaFluor 488 with rhodamine110. ...................................................79
Figure 6. 1 Distributions of single molecule probes by fluorescence anisotropy. In the absence of the
target protein, the probe (300 pM biotin-rhodamine 110) shows a low anisotropy (a). When the target protein is added (75 pM Neutravidin), the anisotropy of some of the probes shifts to higher values, and two populations are observed (b). In the presence of a 10x excess of target, most of the probe molecules are complexed (c). When a 10x excess of unlabeled probe is added, the fluorescent-probe complex is disrupted (d). .......................................................................88
Figure 7. 1 Anisotropy of 300 pM Rhodamine 110 in Phosphate Buffered Saline as a function of
parallel counts (n parallel, n||). Fluorescent bursts greater than 28 in the parallel channel and greater than 10 in the perpendicular channel were extracted (extraction Method III), 172 fluorescent bursts from single molecules were obtained. An Anisotropy value outside the anisotropy range -0.1 to 0.1 arbitrary anisotropy units demonstrates the error in anisotropy measurements. The number of molecules increases as the color changes from black to white...................................................................................................................................102
Figure 7. 2 The anisotropy as a function of parallel counts for: (A) 25 pM BR110, (B) 75 pM BR110, (C) 150 pM BR110 and (D) 300 pM BR110. This figure shows the similarity in anisotropy distributions for various concentrations of BR110. The 300 pM BR110 had the lowest Nb/Nt ratio of 0.23 ± 0.04 (just anisotropy gates were used to classify molecules). The number of molecules increases as the color changes from black to white. ...........................................104
Figure 7. 3 Nb/Nt ratio of 300 pM BR110 as a function of Neutravidin concentration. This figure demonstrates the impact on the Nb/Nt ratio for three different methods of extracting fluorescent bursts form single molecules. See text for a detailed description of the figure......................106
Figure 7. 4 Competition of Biotin and BR110 for Neutravidin. Nb/Nt ratio for a solution of 75 pM Neutravidin with 300 pM BR110 as a function of increasing Biotin concentration. Figure 7.4A used Extraction Method II and Figure 7.4B used Extraction Method III to select fluorescent bursts from single molecules. The anisotropy gates and the difference in parallel and perpendicular photon counts, Δn, were used to classify free and bound probe molecules; free: Δn < 20 and -0.1 ≤ r < 0.2; bound: Δn ≥ 20 and 0.2 ≤ r ≤ 0.5. The open triangles depict the Nb/Nt

Texas Tech University, Sean M. Burrows, August 8, 2009
xiii
ratio of 300 pM BR110 with increasing amounts of Biotin; free: Δn < 12 and -0.1 ≤ r < 0.2; bound: Δn ≥ 12 and 0.2 ≤ r ≤ 0.5. ...................................................................................112

Texas Tech University, Sean M. Burrows, August 8, 2009
1
Chapter I
Introduction to Single Molecule Fluorescence Spectroscopy D. Pappas, S. M. Burrows, and R. D. Reif, TrAC, Trends Anal. Chem. 26, 884 (2007).
1. Single Molecule Detection Like any other laser induced luminescence technique, single molecule fluorescence
spectroscopy has been applied in many disciplines. Single molecule detection emerged
during the late 1970s and early 1980s as a quantitative analysis technique. Hirschfeld1, 2 first
demonstrated single molecule detection in 1976 with a fluorescein labeled antibody. While
each antibody had many (∼100) fluorophores, this was the first demonstration of single
molecule detection.
Single molecule detection is a stochastic process dictated by Poisson statistics. For
fluorescence measurements the goal is to efficiently collect fluorescence emission from
single fluorophores while rejecting background signals and noise. Single molecule
spectroscopy can be used to probe complex heterogeneous systems without losing
information in the ensemble average. A single molecule randomly emits photons, and as a
result shot noise limits the time-based detection. Consequently signal is randomly falling on
the detector stochastically. According to Talaga3 single molecule systems include a
molecule, a reporter dye whose fluorescence is coupled to molecular behavior and a local
environment surrounding the molecule and reporter dye. Talaga describes the fluorescence
photon stream as a noisy coded signal from a transient thermally fluctuating molecular state.
Having a laser intensity with a Gaussian profile defining the diffraction limited probe
volume results in a non-uniform excitation and fluorescence intensity4. This variation in
excitation and emission will depend on the trajectory of the molecule through the probe

Texas Tech University, Sean M. Burrows, August 8, 2009
2
volume as well as the number of chromophores on the molecule5. Both Klenerman4 and
Zare5 report that fluorescence time traces of slowly diffusing molecules and molecules with
multiple chromophores generate broad fluorescence bursts, while fast diffusing molecules
and molecules with few chromophores generate weak narrow fluorescence bursts.
2. Protein-Protein Interactions Single molecule detection emerges as a method to study protein-protein interactions
that are difficult to investigate in the ensemble regime. Much can be learned about signal
transduction and conformations of proteins from these studies. While many methods of
single molecule spectroscopy are available for protein-protein interactions, Förster
Resonance Energy Transfer (FRET) and fluorescence anisotropy studies dominate the
methods employed to interpret these interactions.
Jäger and co workers6 exploited protein-protein interactions as a tool for site-specific
labeling of proteins. Site-specific labeling of a recombinant double-cysteine variant of
chymotrypsin inhibitor 2-subtilisin BPN’ (Sbt) -a serine protease-complex was demonstrated
by single molecule fluorescence-aided molecular sorting. A catalytically impaired Sbt
protein, with engineered cysteines, interacts selectively by burying one N-terminal of
chymotrypsin inhibitor 2(CI2) in a binding interface. While one cysteine group was
protected, the other unblocked cysteine group of another N-terminal domain was labeled.
Subsequent removal of protecting protein allowed labeling with a second fluorophore. Since
proteins potentially have many cysteine groups in N-terminal domains multiple fluorophores
could be attached. This could provide insight to what sites experience maximized
interactions with targets via FRET based studies. The labeling process described here in
does not require chromatography methods after labeling.

Texas Tech University, Sean M. Burrows, August 8, 2009
3
Otto et. al. applied single molecule scanning confocal fluorescence microscopy to
study nucleotide excision repair complexes7. They observed enhanced green fluorescent
protein (EGFP)-labeled xeroderma pigmentosum group A (XPA) proteins bind to Cy3.5-
labeled DNA in the presence and absence of replication protein A (RPA). Adding RPA
enhanced the extent of DNA-XPA binding. Unbound DNA diffused freely through an
agarose gel without EGFP-XPA. When EGFP-XPA proteins were immobilized in an
agarose gel the DNA became immobile due to DNA-XPA binding. Since the proteins
studied were part of a complex biological process this method might be considered for
studying simple antigen antibody interactions. More interesting studies would be complex
signaling mechanisms that involve protein-protein interactions such as endoycytosis, memory
development or odorant signaling.
Protein-protein interactions of odorant receptor trafficking in living cells have been
accomplished by Vogel et. al.8 The human odorant receptor (OR) 17-40 was monitored
using a double-labeling strategy. A green fluorescent protein (GFP) tag allowed continuous
visualization of receptor movement. Selective imaging of cell surface receptors was
accomplished by pulse-labeling an acyl carrier protein (ACP) tag. The OR17-40 receptor
diffused from large to small domains of the plasma membrane upon binding of agonist
helional or antagonist 7-amino-4-methyl coumarin-3-acetic acid (AMCA) to cells expressing
ACP-OR17-40. This method also allowed for visualization of receptor movement from
interior of cell to plasma membrane. As well as monitoring OR17-40 diffusion, this method
is applicable to interrogate odorant receptor biogenesis, trafficking and endocytosis. Odorant
receptors belong to a family of membrane helix proteins, making this a potential technique to
probe those systems as well.

Texas Tech University, Sean M. Burrows, August 8, 2009
4
Johnson9 has reviewed Calmodulin (CaM) conformational states and calcium
signaling by single molecule spectroscopy. FRET was used to investigate binding of CaM to
target peptides and subsequent conformational states. FRET distance was used to measure
multiple conformations by changing concentration of urea or calcium, while fluorescence
anisotropy divulged the interactions of tetramethylrhodamine labeled CaM with the plasma-
membrane Ca2+ pump (PMCA).
Lu et. al. investigated two state protein-protein interactions of Calmodulin10. The
target peptide was C28W, a 28 amino acid oligomer. This motif represents the essential
binding sequence domain of Ca-ATPase protein that interacts with CaM. The N-terminals of
each protein were labeled with donor-acceptor fluorophores. As the proteins interacted the
CaM changed conformations bringing fluorophores closer to each other and enhancing FRET
efficiencies. Polarization fluctuation dynamics revealed binding-unbinding motions of N-
terminal domain of CaM in CaM/C28W complexes. Attaching it to a biologically
compatible glass surface restricted rotation of the molecule. This method combines single
molecule FRET and fluorescence polarization measurements to investigate protein-protein
interactions as well as the consequential conformational fluctuations. Provided more bright
biologically inert fluorophores can be developed this method could be applicable to many
complex biological processes.
Lu and coworkers11 have also studied interactions between a Wiskott-Aldrich
Syndrome Protein (WASP) fragment that binds only to the activated intracellular signaling
protein Cdc42 (Cell division cycle 42). Hydrophobic interactions significant to
Cdc42/WASP recognition were assessed by labeling Cdc42 with a novel solvatochromic dye,
indolenine-benzothiophen-3-one-1, 1 dioxide. This method employed a biosensor, WASP,

Texas Tech University, Sean M. Burrows, August 8, 2009
5
that would only bind activated Cdc42 revealing static and dynamic inhomogeneous
conformational fluctuations of the protein complex that involve bound and loosely bound
states. Lu et. al. has developed a spatial and temporal molecular imaging system and
combined it with single molecule experiments and computational approaches to reveal
biomolecular interactions.
In another study12, the Cdc42/CBD protein interaction interface and conformational
fluctuation dynamics were investigated by fluorescence emission images, photon-stamping
time trajectories and auto-correlation function analysis. The single molecule data was used
to generate binding energy landscapes of the Cdc42/CBD complex. Lu has summarized his
work on probing protein conformational dynamics and focused on protein-protein
interactions in cell signaling, gramicidin-dimer ion channels at lipid bilayers, and enzyme-
substrate complex formation13.
3. Complexation of Single Molecules Single Molecule Spectroscopy can probe the binding mechanisms molecules undergo
upon complexation or before complexation, and reveal processes that are obscured in
ensemble measurements. Typically these studies implement FRET as the method of
observation.
Murakoshi and co-workers14 employ single-molecule imaging to reveal Ras
activation in living Cells. In this work FRET was used to observe activation of small G
protein, Ras. Epidermal growth factor (EGF) stimulated release of guanosine diphosphate
(GDP) from yellow fluorescent protein(YFP)-Ras and binding of guanosine triphosphate
(GTP)-BodipyTR. Their method was applied to visualize this activation in living cells on the
single molecule level. FRET efficiencies revealed that upon activation of Ras its diffusion
Texas Tech University, Sean M. Burrows, August 8, 2009
6
was suppressed, suggesting the formation of large Ras-signaling protein complexes on the
cell membrane. This technique used total internal reflection microscopy for FRET
measurements to observe activation of Ras in living cells. With their imaging technique
diffusion and immobilization of Ras molecules to the plasma membrane of a cell was
conceived.
Sako et. al. used total internal reflection fluorescence microscopy (TIRFM) to study
epidermal growth factor receptor (EGFR) signaling on the surface of living cells15. It was
hypothesized that the EGFR dimer formed before binding of second epidermal growth factor
(EGF). To support this claim it was observed that the fluorescence intensity of Cy3-EGF
increased by a factor of two and then decreased in two steps. Single molecule FRET
experiments revealed dimerization of EGFR when EGF binding occurred. Conformational
fluctuation was observed from FRET between Cy3-EGF and Cy5-EGF provided more
evidence of dimer formation. TIRFM imaging emerges as a tool to monitor location,
movement, interaction and biochemical reactions of single molecules.
Kapanidis and co-workers16 used alternating-laser excitation (ALEX) to achieve
fluorescence-aided molecule sorting (FAMS) to simultaneously analyze biomolecular
structure and interactions. ALEX uses two different wavelength pulsed excitation sources
pulsed at a defined alteration time, the time duration the laser was on. Typically several
milliseconds intervals in-between excitation pulses were used to minimize cross talk. The
first laser excited the donor molecule directly and the acceptor molecule indirectly, if the
donor and acceptor were within ~ 10 nm of each other. The second laser excited only the
acceptor molecule. Refer to Kapanidis et. al.16 for a more detailed description of ALEX.
Histograms of emission ratio, E, and stoichiometry ratio, S, allowed sorting of species based

Texas Tech University, Sean M. Burrows, August 8, 2009
7
on the conformation and association status of each species. D-only, A-only and D-A species
can be interrogated for interactions by labeling a macromolecule with a donor fluorophore
(D) and a ligand with an acceptor fluorophore (A). Equilibrium binding and kinetic rate
constants can be measured by counting the number of molecules in free and bound states.
FAMS was used to study sequence–specific interaction of E. coli catabolite activator protein
(CAP) with DNA. The equilibrium binding constant and dissociation kinetics were also
studied. This method exploits FRET type measurements and alternating excitation to
investigate equilibrium binding and kinetic rates of complexation on the single molecule
level. Interrogation of structure, dynamics, stoichiometries, environment and interactions of
diffusing or immobilized molecules can be achieved without implementation of separation
steps.
The electron transfer reaction of an iron based protein at the single molecule level
was studied by Furukawa et. al.17 AlexaFluor 647 was attached to a cytochrome b5 protein
that contained iron. Loss of fluorescence due to oxidation from Fe3+ going to Fe2+ occurred.
When the iron was in the reduced state the Alexa+-HCytb5 became nonfluorescent due to
energy transfer from the dye to the heme within the protein. The single molecule data was
processed and revealed a distribution of rate constants. From Marcus theory this rate
distribution was hypothesized to originate from distance change associated with structural
fluctuation of the protein. This work demonstrates the possibility to investigate electron
transfer of biological systems on the single molecule level.
Bagh et. al. studied a dual fluorophore calcium-ion indicator dye, calcium green 2
(CG-2) by single molecule spectroscopy18. In the absence of Ca2+ the CG-2 is a
nonfluorescent, quenched dimer. As Ca2+ binds to CG-2 the dye changes to a conformation

Texas Tech University, Sean M. Burrows, August 8, 2009
8
that permits fluorescence. As Ca2+ concentrations were increased the number of emissive
molecules with a high intensity increased. It was discovered that as long as rate of energy
transfer was sufficiently greater than the rate of fluorescence, either fluorophore can emit
irrespective of which one was excited. Most of the dual fluorophore labeled molecules were
found to photobleach in a single step. Single molecule measurements of intensity were
plotted as histograms. As calcium concentrations were increased the maximum of the curve
did not change. Considering a single peak from intensity histograms and single step
photobleaching from a majority of the molecules suggests the fluorophores are coupled rather
than independent. To investigate this hypothesis the possibility of dipole-dipole Förster
Resonance Energy Transfer was evaluated. Fluctuations of intensity in the time trace data
revealed multiple conformations of CG-2, coupled or rare uncoupled states. Bagh and
coworkers were able to elucidate conformational changes of a dye without implementing two
color FRET experiments, which would have been impossible.
The enzyme-substrate complex of hairpin ribozyme was investigated by Chu and co-
workers19. They observed four docked states of distinct stabilities and found that each
molecule rarely switches between different docked states. They also found that substrate
cleavage was rate-limited by a combination of conformational transitions and reversible
equilibriums. This work demonstrates the possibilities of single molecule spectroscopy to
probe complicated dynamics of complex formation.
4. Quantification and Assays Since single molecule detection requires trace amounts of fluorophore for detection, it
is a suitable method for quantification and assays of specific constituents in a sample.
Typical modes of analysis use FRET, alternating laser-excitation (ALEX) or fluorescence

Texas Tech University, Sean M. Burrows, August 8, 2009
9
anisotropy. There are reviews on applying single molecule spectroscopy to quantitative
analysis and various types of assays20-21.
Two-color coincidence detection was applied to determine the fraction and
stoichiometry of biomolecular complexes by Orte et. al.22 Evaluation of chance coincidence
events from monomers allowed accurate quantification of the relative number of complexes
and their stoichiometry. The number of chance coincident events is determined by
probabilistic calculations outlined in Orte’s work. The chance coincident events were
subtracted from total coincident events to yield the number of real coincident events. The
fraction of complexes present with different levels of background was studied to establish
sensitivity limits. The method was extended to determine complex stoichiometry with
different levels of background monomers and fluorescent contaminants. The dissociation
constant of a 9-mer duplex DNA was measured to be in the nanomolar regime. Burst rate
from fluorophore-labeled duplex DNA demonstrated a linear dependence on the fraction of
duplex DNA and was independent of monomer concentration. This work shows the
potential of single molecule detection for quantitative analysis of a specific constituent in the
presence of background and other containments.
D’Antoni and coworkers23 developed a rapid quantitative analysis that relies on single
molecule counting. Multicolor confocal microscopy was applied detecting blue, green and
red fluorescence. In this work the number of dual-labeled molecules of interest was
estimated from total number of coincident fluorescent events by correcting for unbound
probes that randomly passed the probe volume. Subpicomolar concentrations of model RNA
target were detected. Using three laser sources four fluorescence colors can be monitored to
allow quantitative analysis on the single molecule level. However, in order for this method

Texas Tech University, Sean M. Burrows, August 8, 2009
10
to provide accurate information specific fluorophores must be devised for the target
molecule.
Measurement of antibody affinity and immunoassays were performed at the single
molecule level by Tetin et. al.24 By observing fractional amounts of free and bound hapten
by fluorescence correlation spectroscopy (FCS), the equilibrium binding constant was
evaluated. These values were determined for antidigoxin antibodies and fluorescein-labeled
digoxigenin. Fluorescence polarization measurements were used in combination with FCS to
perform an immunoassay for vancomycin. The immunoassay requires FCS, which is a
complicated technique; however, the potential for using fluorescence polarization to conduct
an assay was revealed.
Texas Tech University, Sean M. Burrows, August 8, 2009
11
5. References 1. T. Hirschfeld, Appl. Opt. 15, 2965 (1976). 2. T. Hirschfeld, Appl. Opt. 15, 3135 (1976). 3. D. S. Talaga, J. Phys. Chem. A 110, 9743 (2006). 4. M. A. Osborne, S. Balasubramanian, W. S. Furey, and D. Klenerman, J. Phys. Chem B 102, 3160 (1998). 5. S. Nie, D. T. Chiu, and R. N. Zare, Anal. Chem. 67, 2849 (1995). 6. M Jäger, X. Michalet, and S. Weiss, Protein Sci. 14, 2059 (2005). 7. G. M. J. Segers-Nolten, C. Wyman, N. Wijgers, W. Vermeulen, A. T. M. Lenferink, J. H. J. Hoeijmakers, J. Greve, and C. Otto, Nucleic Acids Res. 30, 21, 4720 (2002). 8. V. Jacquier, M. Prummer, J. M. Segura, H. Pick, and H. Vogel, Proc. Natl. Acad. Sci. USA 103, 39, 14325 (2006). 9. C. K. Johnson, Biochemistry 45, 48, 14233 (2006). 10. R. Liu, D. Hu, X. Tan, and H. P. Lu, J. Am. Chem. Soc. 128, 10034 (2006). 11. X. Tan, P. Nalbant, A. Toutchkine, D. Hu, E. R. Vorpagel, K. M. Hahn, and H. P. Lu, J. Phys. Chem. B 108, 737 (2004). 12. J. Wang, Q. Lu, and H. P. Lu, Plos. Comput. Biol. 2, 7, 0842 (2006). 13. H. P. Lu, Acc. Chem. Res. 38, 557 (2005). 14. H. Murakoshi, R. Iino, T. Kobayashi, T. Fujiwara, C. Ohshima, A. Yoshimura, and A. Kusumi, Proc. Natl. Acad. Sci. USA 101, 19, 7317 (2004). 15.Y. Sako, S. Minoguchi, and T. Yanagida, Nat. Cell Biol. 2, 168 (2000). 16. A. N. Kapanidis, N. K. Lee, T. A. Laurence, S. Doose, E. Margeat, S. Weiss, Proc. Natl. Acad. Sci. USA 101, 24, 8936 (2004). 17. Y. Furukawa, T. Ban, D. Hamada, K. Ishimori, Y. Goto, and I. Morishima, J. Am. Chem. Soc. 127, 2098 (2005). 18. S. Bagh, and M.F. Paige, J. Phys. Chem. A 110, 7057 (2006).
Texas Tech University, Sean M. Burrows, August 8, 2009
12
19. Z. Xiaowei, H. Kim, M. J. B. Pereira, H. P. Babcock, N. G. Walter, and S. Chu, Science 296, 5572, 1473 (2002). 20. F. Hong and D.D. Root, Drug Discov. Today 11, 13/14, 640 (2006). 21. H. C. Yeh, S. Y. Chao, Y. P. Ho, and T. H. Wang, Curr. Pharm. Biotechno. 6, 453 (2005). 22. A. Orte, R. Clarke, S. Balasubramanian, and D. Klenerman, Anal. Chem. 78, 7707 (2006). 23. C. M. D’ Antoni, M. Fuchs, J. L. Harris, H. P. Ko, R. E. Meyer, M. E. Nadel, J. D. Randall, J. E. Rooke, and E. A. Nalefski, Anal. Biochem. 352, 97-1009 (2006). 24. S. Y. Tetin, K. M. Swift, and E. D. Matayoshi, Anal. Biochem. 307, 84 (2002).
Texas Tech University, Sean M. Burrows, August 8, 2009
13
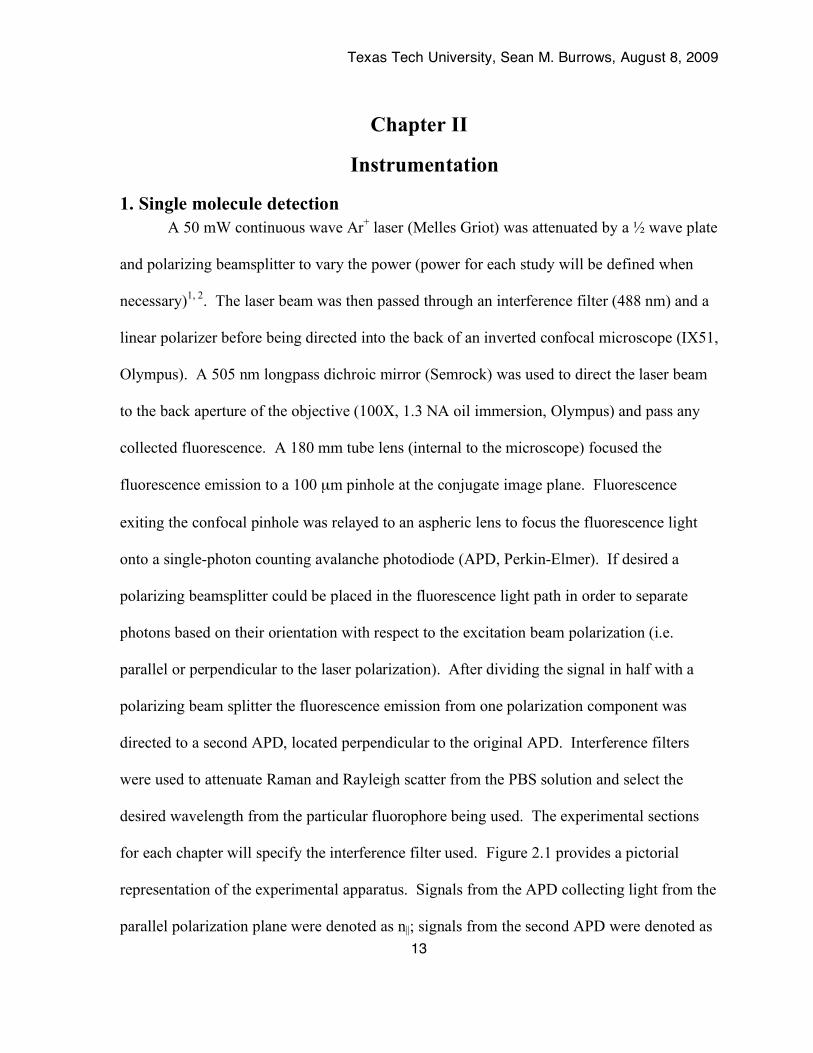
Chapter II
Instrumentation
1. Single molecule detection A 50 mW continuous wave Ar+ laser (Melles Griot) was attenuated by a ½ wave plate
and polarizing beamsplitter to vary the power (power for each study will be defined when
necessary)1, 2. The laser beam was then passed through an interference filter (488 nm) and a
linear polarizer before being directed into the back of an inverted confocal microscope (IX51,
Olympus). A 505 nm longpass dichroic mirror (Semrock) was used to direct the laser beam
to the back aperture of the objective (100X, 1.3 NA oil immersion, Olympus) and pass any
collected fluorescence. A 180 mm tube lens (internal to the microscope) focused the
fluorescence emission to a 100 µm pinhole at the conjugate image plane. Fluorescence
exiting the confocal pinhole was relayed to an aspheric lens to focus the fluorescence light
onto a single-photon counting avalanche photodiode (APD, Perkin-Elmer). If desired a
polarizing beamsplitter could be placed in the fluorescence light path in order to separate
photons based on their orientation with respect to the excitation beam polarization (i.e.
parallel or perpendicular to the laser polarization). After dividing the signal in half with a
polarizing beam splitter the fluorescence emission from one polarization component was
directed to a second APD, located perpendicular to the original APD. Interference filters
were used to attenuate Raman and Rayleigh scatter from the PBS solution and select the
desired wavelength from the particular fluorophore being used. The experimental sections
for each chapter will specify the interference filter used. Figure 2.1 provides a pictorial
representation of the experimental apparatus. Signals from the APD collecting light from the
parallel polarization plane were denoted as n||; signals from the second APD were denoted as

Texas Tech University, Sean M. Burrows, August 8, 2009
14
n⊥; otherwise they are simply denoted as n. The details of how the raw signal was processed
for each study will be provided in the appropriate chapters.
2. Signal Detection and Processing Output pulses from the Avalanche Photodiodes (APDs) (corresponding to detected
photons) were fed to a counting board (Model 6602, National Instruments) operating in
buffered event counting mode that counted pulses in a defined time bin. Bins were produced
in 1 millisecond duration using one of the board's available counters to produce gate pulses at
1 kHz. This allowed us to convert the cumulative counts provided by the board into discrete
time bins. A Labview program (version 8, National Instruments) was written to control
acquisition, data display, and provide tab-delimited data files for post-acquisition processing.
All data were processed using Origin software (OriginLab.).

Texas Tech University, Sean M. Burrows, August 8, 2009
15
Figure 2. 1 Single molecule detection apparatus2. See text for detailed description of the light path. The optical bandpass filters used will be addressed in each chapter.

Texas Tech University, Sean M. Burrows, August 8, 2009
16
3. Reference: 1. S. M. Burrows, R. D. Reif, D. Pappas, "Investigation of Photobleaching and Saturation of Single Molecules by Fluorophore Recrossing Events", Analytica Chimica Acta, 598, 135-142 (2007). 2. S. M. Burrows, D. Pappas, “Comparison of Methods to Classify and Quantify Free and Bound States of Complexes using Single Molecule Fluorescence Anisotropy”, The Analyst, In Press.

Texas Tech University, Sean M. Burrows, August 8, 2009
17
Chapter III
Investigation of Photobleaching and Saturation of Single Molecules by Fluorophore Recrossing Events
S. M. Burrows, R. D. Reif, and D. Pappas, Anal. Chim. Acta, 598, 135 (2007).
1. Introduction When describing the limits on fluorescence signal one must consider photon
saturation as well as photobleaching. Photobleaching limits the total number of excitation
photons a molecule can accept and convert into fluorescent light. There is a maximum rate at
which a molecule can accept photons, beyond which the rate of fluorescence does not
increase. This condition is photon saturation and it limits effective illumination intensity.
A molecule that is excited repeatedly will have a good possibility of being
photobleached. Engh and Farmer1 suggest that the excited state fluorophore may be
oxidized by an external quencher. At this point the fluorophore may not take part in the
excitation fluorescence cycles.
Mechanisms of photobleaching are not well understood and new methods are being
developed to study these mechanisms. Variations in fluorescence measurements are
manifested in the photobleaching and photon saturation of a fluorophore. For this study we
focus our concerns on a method to probe photobleaching. Photobleaching is due mainly to
enhanced reactivity of the excited state fluorophore. Seidal2 reported that optimal conditions
for detection must strike a balance between maximum observation time, maximum photon
number and minimized heterogeneous photobleaching.
There is room for improvement in the photostability of fluorophores for single
molecule detection and fluorescence fluctuation spectroscopy3. Fluorescence emission rate
Texas Tech University, Sean M. Burrows, August 8, 2009
18
per molecule is very important in SMD; Seidel specifies that for single molecule detection,
high signal levels are needed in order to gain necessary information about the molecule, to
reach required image scanning rates and to reach required time resolution. In bulk
spectroscopic measurements, optimization of these parameters can be done by increasing
either the irradiation or concentration of dye. Since increasing dye concentration is not an
option at the single molecule level, the only solution is increasing the power. However, this
is limited by photobleaching and photon saturation.
Another work by Seidel4 and coworkers focuses on photobleaching and outlines
statistics to experimentally determine probability of photobleaching. In this work they
discuss the theory of quantum deficiency of photobleaching for multilevel systems.
Microscopic rate constants for photobleaching reactions were also developed.
In Zare's5 work they describe the laser spot as diffraction limited in breadth and as an
ellipsoid along the optical axis. An electrostatic gradient is established when a laser is
focused to a diffraction-limited spot. When a molecule enters this potential field it is
attracted to the 1/e2 region of the focal volume. From these considerations Zare proposed
that for single molecules in the detection region, a transient double occupancy is possible.
Thus if a molecule diffuses through the focused beam it has the potential to reenter. Zare
used random walk simulations as evidence to support the claim that long and short dark
periods of time traces were caused by boundary recrossing of single molecules and by
intersystem crossing.
The optical trapping force a molecule experiences depends on the trapping efficiency,
refractive index of the suspending medium, and power density. The scattering of light from
the molecule also creates a scattering force that acts to push the molecule in the direction of

Texas Tech University, Sean M. Burrows, August 8, 2009
19
laser propagation. Klenerman6 and coworkers report that the probability of detecting a
molecule at short interpeak times is much greater than predicted by Poisson statistics.
Overestimation of the number of molecules for a given time span manifests itself in the
boundary recrossing behavior of the molecule. They also claim the mass of the fluorophore
plays a role in the number of times a molecule recrosses. As mass increases deviation from
Poisson statistics increases6.
Since single molecule detection requires trace amounts of fluorophore for detection, it
is a suitable method for quantification and assays that would be obscured by ensemble
measurements. Typical modes of analysis use fluorescence intensity, energy transfer,
alternating laser-excitation (ALEX) or fluorescence anisotropy. There are reviews on
applying single molecule spectroscopy to quantitative analysis and various types of assays7-8.
From an analytical standpoint, asymmetric noise or loss of signal due to photobleaching
gives rise to false readings. In order to measure trace amounts of a specific constituent you
must generate a signal from the constituent that can be resolved from the noise.
In this study, single molecular recrossing events were used as a method to probe
photobleaching of individual fluorophores. Calcein, fluorescein and R-phycoerythrin were
studied. A confocal single molecule detector operating in steady state mode provided
observation of single fluorophore molecules. Photobleaching, photon saturation and
saturation intensity will be addressed. This approach is simple and can be used to optimize
excitation irradiance with respect to saturation and photobleaching. The method purposed in
this work hopes to aid in enhancing signal without destroying the analyte.

Texas Tech University, Sean M. Burrows, August 8, 2009
20
2. Theory Photobleaching and photon saturation can be discussed in terms of excitation and
deactivation rates of a fluorescent molecule (Figure 3.1). The fraction of atoms in the excited
state is given by the rates of excitation (kex), fluorescence emission (kf), stimulated emission
(kse) and nonradiative decay (knr):
!
nS1
nS0
"kex
k f + kse + knr, (1)
if intersystem crossing to the triplet state and subsequent deactivation to the ground state are
neglected. The excitation rate (kex) is given by the product of the absorption cross section σ
(cm2) and the photon irradiance Ip (photons/cm2s):
!
kex ="Ip . (2)
This excitation rate is related to the rate of stimulated emission (kse) and is directly
proportional (and often equal to) the stimulated emission rate. At lower irradiances typically
encountered in fluorimeters or other lamp-source instruments, kex is sufficiently low to avoid
significant stimulated emission and the ratio of excited- to ground-state singlet electrons (and
therefore the fluorescence intensity) is linearly dependent on the excitation rate (Equation 1).
However, if the fluorophore is capable of entering a triplet state then Equation 1 will also
depend on the rate of kST. Even if the molecule enters a triplet state, it can go back to the
singlet state and emit the photon; this is known as ‘blinking’. Increasing the power will put
more singlet electrons in the excited state and increases the probability of electrons going
into the triplet state. In the case of single-molecule detection using an intense and tightly
focused laser beam, the excitation rate can increase to the point that the rate of stimulated
emission obscures the rate of fluorescence and nonradiative decay. Under these conditions,

Texas Tech University, Sean M. Burrows, August 8, 2009
21
called photon saturation, the excitation efficiency decreases as nS1 increases to a steady-state
and the fluorescence intensity is no longer dependent on the excitation irradiance, Ip. In
practice, a two-level system involving the ground state (Figure 3.1) cannot have an excited-
to ground-state ratio greater than about 0.5, and as the irradiance increases above the
saturation irradiance the excitation (absorption) efficiency decreases.
The saturation irradiance can be estimated by the excitation rate that matches the
fluorescence rate. This estimation fails if a molecule in the singlet state readily converts to
the triplet state as in the case of R-phycoerythrin. For saturation irradiation, in absence of
triplet state formation, the mean photon arrival time to the sample equals the mean lifetime of
fluorescence. In other words, increasing above this excitation limit does not produce more
excited-state molecules because a molecule already in the excited state has a zero probability
of absorbing another resonant photon2.
In the case of fluorescein and calcein, two of the dyes examined in this study, the
formation of triplet state electrons in the absence of external quenchers is minimal, and the
excitation rate equals the fluorescence rate
!
kex ="Ip = k f =1
# f
, (3)
where τf is the fluorescence lifetime. The saturation power (W) is therefore estimated by
!
Psat = IpAh" =Ah"
#$ f
, (4)
where A is the beam area (cm2), h is Planck's constant, and ν is the laser frequency (s-1).
From Equation 4 it can be seen that molecules with strong absorption (large σ) and long
fluorescence lifetimes will have lower saturation powers.

Texas Tech University, Sean M. Burrows, August 8, 2009
22
Figure 3. 1 Rates of molecular transitions involved in fluorescence. kex = excitation rate, kse = stimulated emission rate, kf = fluorescence rate, knr = nonradiative relaxation rate, kS-T = triplet conversion rate, KT-S = triplet relaxation rate.

Texas Tech University, Sean M. Burrows, August 8, 2009
23
Photobleaching, the destruction of the fluorescent molecule in the excited state, was
studied extensively in flow cytometry application by van den Engh and Farmer1. There is a
certain probability that an excited state molecule will be rendered nonfluorescent by a
photobleaching process. One can therefore infer that the excitation rate should play an
important role in the total photobleaching rate, as the amount of time spent in the excited
state is proportional to the number of times a molecule is excited. Van den Engh and Farmer
postulated and observed that the maximum fluorescent rate would also result in complete
destruction of all of the dye molecules in or attached to a cell. In the case of single molecule
detection, the same inference could be made. However, rapid photobleaching is in general
not desired in single molecule detection, as the molecule in question is rendered
nonfluorescent and no further observation can take place. In free solution, diffusing
molecules that are photobleached would diffuse out of the laser volume and not be detected
again if they re-entered.
In this work a laser beam is focused to a diffraction limited spot on the order of 1 µm
in diameter. Figure 3.2 shows a conceptual diagram of random paths taken by molecules that
traverse the elliptical beam waist. For our applications single molecule detection currently
occurs in free solution. In flow cells or capillary applications it is possible to set up double
beam experiments to determine photobleaching rates9. Zare's group observed that molecules
that enter the boundaries of the laser beam will cross in and out of the beam on a short (sub-
millisecond) time scale5. We instead are looking at complete re-entry of the molecule in the
beam. In order to assure we are looking at a molecule recrossing the beam (and not weaving
in and out of the periphery) we observe our signals on a 1 millisecond time scale, which is
the order of the molecule residence time. In addition, we have chosen concentrations where

Texas Tech University, Sean M. Burrows, August 8, 2009
24
the probability of detecting >1 molecule at a time are low and where the probability of one
molecule entering the probe volume after another has left is also small. If bursts of photons
occur within 1 millisecond of each other, it is possible that the same molecule is lingering in
the probe volume. Since the residence time of a molecule is on the order of a millisecond,
observing photon bursts within 2 milliseconds of each other ensures that the molecule
completely leaves the probe volume and then reenters. Interpeak times longer than 2
milliseconds could arise from another molecule entering the probe volume. We therefore
restrict our observation to molecular fluorescence bursts that occur within 2 milliseconds of
each other. This degree of recrossing has been plotted as a function of power. We have also
looked at the fluorescence burst size as a function of power and used that information to
observe the experimental saturation irradiance of our system for each dye used.
3. Experimental
3.1. Dye samples Fluorescein was purchased from Sigma-Aldrich as solids. Phycoerythrin was
purchased as a stock solution and calcein was purchased in the form of calcein
Acetoxymethyl (AM) ester, both from Molecule Probes. Fluorescein was dissolved in 50
mM phosphate buffer (pH = 12) for all experiments and a working concentration of 28 pM
was used. Phycoerythrin was diluted in pH = 7.4 phosphate buffered saline (PBS,
Invitrogen) and used at a concentration of 100 pM. Calcein-AM, which is nonfluorescent,
was hydrolyzed to produce fluorescent calcein using the following procedure, slightly
modified from the manufacturer's protocols. 50 µL of calcein-AM working solution (1 µM)
was dissolved in 50 µL of Dimethyl siloxane (DMSO) and diluted with an additional 50 µL
of methanol. Sodium hydroxide (2 M, 25 µL) was then added to the solution and incubated

Texas Tech University, Sean M. Burrows, August 8, 2009
25
Figure 3. 2 Conceptual diagram of some possible molecular crossing paths through a diffraction-limited focused laser beam. In cases A and C, the molecule will cross through the beam and produce one fluorescence burst (top graph). In case B, the molecule may enter the laser for a second time bin (1 millisecond duration), producing a second burst Δt after the first burst.
Texas Tech University, Sean M. Burrows, August 8, 2009
26
at room temperature for 1 hour. A stock solution of 80 nM calcein was then prepared using
phosphate buffered saline for measurements. As the extent of hydrolysis of calcein may not
be 100 % complete, the final working solution was approximately 20 pM. All dilutions to
the working concentrations were performed just prior to fluorescence detection.
3.2. Data Analysis In order to distinguish detected molecules from the background, a threshold was
applied to each time trace to identify single molecule fluorescence bursts. Those extracted
peaks and the time at which the peak occurred were then used to determine the interburst
peak times. The time difference between peaks was plotted as a histogram for each
excitation power measured. We chose time differences that were 2 milliseconds (ms) or less
in duration to count as a molecule recrossing and observed the decrease in this recrossing
occurrence as a function of laser power.
4. Results
4.1. Single Molecule Fluorescence Bursts. Figure 3.3 depicts time traces of a 100pM solution of R-phycoerythrin at low,
medium and high powers. While the time traces and interpeak times for R-phycoerythrin
were shown, similar data was acquired for fluorescein and calcein. The analytical signal was
chosen as photon counts above a threshold value,
Ipeak = b +3sb (5)
where, Ipeak is the intensity of a peak, b is the average baseline of the time trace and sb is the
standard deviation of the baseline signal. Peaks that were greater than this threshold were
identified as molecules and extracted for interpeak time determination.
Texas Tech University, Sean M. Burrows, August 8, 2009
27
a b
c
Figure 3. 3 Single molecule fluorescence time traces of a 100pM solution of R-phycoerythrin at (a) 8µW, (b) 34µW (threshold value of 4 counts), and (c) 990µW of excitation power. The number of molecules, time distance between molecules and effect of background noise can be observed in this figure.
Texas Tech University, Sean M. Burrows, August 8, 2009
28
The time traces depict counts per millisecond time bin. The different heights of the peaks
arise from each molecule exhibiting different behavior in the probe volume. Due to slight
variations in quantum efficiencies, dwell times, and other photophysical phenomena between
molecules, some may emit more photons than others.
From these time traces two observations were noteworthy. One was that the signal
from individual molecules and the baseline signal increase with excitation power. The signal
and background relationship also demonstrates the importance of choosing a threshold limit
for selecting molecules. Another observation was that the distance in time between detection
of molecules changes as a function of power. At higher powers there were fewer molecules
observed and those that were observed lie farther apart from each other in time. The time
duration between observing molecules was referred to as the interpeak time in this work. As
stated earlier, molecules with interpeak times of 2ms were chosen to study photobleaching by
observing the number of molecules that recross the laser beam after an initial 1ms dwell time.
We have used this parameter to gauge the onset of photobleaching as the excitation
irradiance is increased.
4.2. Fluorescence Burst Interpeak Times. Figure 3.4 depicts the interpeak times of a 100pM solution of R-Phycoerythrin
at low, medium and high powers. After the photon burst peaks were extracted from the time
traces the differences in time between observing a molecule was taken. A histogram of these
interpeak times was then created. At low powers few photon bursts are detected and
molecular recrossing was rare. At moderate powers there were many detected molecular
recrossing events. Most of the molecules were detected with interpeak times of 50-100ms
while there were very few interpeak times greater than 100ms. At high powers very few
Texas Tech University, Sean M. Burrows, August 8, 2009
29
molecules were detected and few molecules reenter as depicted by low number of molecular
recrossings for interpeak times in the 2 ms time bin. Most of the interpeak times for high
irradiances are in the 50-500ms time range, while the largest interpeak times observed were
on the order of 1-2 seconds.
The number of molecules that recross the laser spot was depicted in the 2ms time bin
of Figure 3.4. For each power the number of detected molecules that reentered the probe
volume along with the total number of molecules detected over a given time span was used to
generate a plot of normalized numbers of peak recrossings as a function of power.
4.3. Single Molecule Fluorescence Burst Peak Height as a Function of Power: Figure 3.5 shows photon saturation of fluorescence of the three dyes. Average
extracted peak heights were background corrected and plotted as a function of power. By
interpolating the data one can experimentally extract the onset of saturation intensity. R-
phycoerythrin, with large absorption cross section, has about twice the fluorescence signal
with respect to the other two fluorophores. As expected, the fluorescence peak height
increases with excitation power until the point of saturation. In single molecule detection,
however, one must carefully balance excitation power, as too high of an irradiance will
destroy the observed molecule. A high power could destroy a molecule before it even enters
the probe volume.
The calculated and experimentally determined irradiances are given in Table 3.1. Irradiance
was calculated by setting kf = kex and using the molar absorptivity of the fluorophore at the
488nm excitation wavelength. An educated assumption of spot size was made by comparing
beads of 1µm size to the laser spot. This method revealed a spot diameter of ∼1µm. The
cross sectional area of our spot size if approximated as a circle is 7.8x10⁻⁹cm2.

Texas Tech University, Sean M. Burrows, August 8, 2009
30
Figure 3. 4 Molecular recrossing events for a 100pM solution of R-phycoerythrin. Histograms of the interpeak times at (a) 8µW, (b) 34µW, and (c) 990µW. At low (a) and high (c) powers no molecules are observed to recross in the 2ms time bin. At the moderate power (b) molecule recrossing events are observed.
a
b
c

Texas Tech University, Sean M. Burrows, August 8, 2009
31
a b
c
Figure 3. 5 Single molecule fluorescence burst peak height for (a) calcein (b) fluorescein and (c) R-phycoerythrin as a function of excitation power. Photon saturation can be observed as the plateau of signal at high powers.

Texas Tech University, Sean M. Burrows, August 8, 2009
32
Table 3. 1 Experimentally determined and calculated saturation irradiances. Fluorophore Estimated
Irradiance(W/cm2) Calculated Irradiance(W/cm2)
Estimated / Calculated
Calcein 1.7x10⁵ 4.0x10⁵ 0.43 R-Phycoerythrin 7.6x10⁴ 1.1x10⁴ 6.9 Fluorescein 2.5x10⁵ 2.6x10⁵ 0.98

Texas Tech University, Sean M. Burrows, August 8, 2009
33
4.4. Molecule Recrossing as a Function of Power. Figure 3.6 shows a plot of normalized recrossing events (recrossing events divided by
total number of detected molecules) as a function of power, from 3µW to 6mW. One would
expect that if photon saturation were the only process at play the number of recrossing events
would plateau like the average extracted peak height; however, this was not observed.
Instead the number of recrossing events reached a maximum and then decreased to nearly
zero at high irradiances. All three fluorophores exhibited this decrease in the number of
recrossing events at high powers.
Counting too many molecules can be corrected for by subtracting the number of
recrossing from the total number of molecules extracted. However, counting too few
molecules due to photobleaching or triplet state formation cannot be corrected for. Counting
too few molecules will impart a substantial error in the measurement. The optimal power can
be observed by a minimum in the total number of molecules divided by number of
recrossings as a function of power. The method described here allows for choosing optimal
power to minimize both photobleaching and double-counting of molecules.
5. Discussion Observing single molecular recrossing events demonstrated the limitations of photon
saturation and photobleaching on fluorescence detection. If photon saturation were the only
process occurring then the number of molecules recrossing at each power should be the same
once the saturation power is reached. However, this is not the case. If molecules do not
recross within a 2-millisecond time scale at high powers then fluorescence is limited by
photobleaching. At high powers either the molecule was photobleached while in the probe
volume or by the time it recrossed it was photobleached. At saturation irradiance there were
Texas Tech University, Sean M. Burrows, August 8, 2009
34
a b
c
Figure 3. 6 Molecular recrossings as detected by photon burst interpeak times for (a) calcein (b) fluorescein and (c) R-phycoerythrin as a function of excitation power. Photobleaching can be observed as the decrease in the number of normalized recrossing events as excitation power increased.

Texas Tech University, Sean M. Burrows, August 8, 2009
35
roughly as many molecules in the excited state as there were in the ground state and the
stimulated emission rate exceeded that of fluorescence rate of emission. The high probability
that a molecule will be in the excited state made photodegradation more likely.
Our current method to calculate saturation irradiance tends to over estimate with
respect to the experimental estimation for calcein. The agreement for fluorescein was
excellent. However, for R-phycoerythrin the calculation severely under estimated the
experimental saturation irradiance. This could be due to the fact that triplet state formation is
possible for phycoerythrin at high excitation irradiance10. R-phycoerythrin undergoes
conversion to the triplet state at high irradiance that affects irradiance by creating another
pathway for electrons to return to the ground state, thereby allowing more photons to be
absorbed before saturation. The molecular recrossing method agreed with this in that at high
excitation powers for R-phycoerythrin virtually no molecular recrossings are evident,
possibly due to the existence of a triplet state. Photodegradation from the triplet state could
also give rise to underestimation of saturation irradiance. If the photon is destroyed in the
triplet state then it cannot convert back to the singlet state, and observation referred to as
‘blinking”, to allow fluorescence emission. While molecular recrossings are still evident for
calcein and fluorescein at higher powers, there are not many of them.
6. Conclusion A method to probe photon saturation and photobleaching of single molecule
fluorescent dyes was described. The phenomenon of molecular recrossing was exploited to
investigate the photobleaching process. At moderate power levels the fluorophores exhibited
a deviation from Poisson statistics due to large number of recrossing events at short interpeak

Texas Tech University, Sean M. Burrows, August 8, 2009
36
times. Photobleaching could be observed at high powers by the decay in the number of
normalized recrossing events.
Photobleaching onset can be deduced from a maximum in the normalized number of
recrossing events. Photon saturation was interpolated from graphs of signal as a function of
power. The data observed is in agreement with expected behavior considering the absorption
cross section of the fluorescent molecules studied. In future work we will probe effects of
quenching molecules on fluorescence process, and will also investigate molecular mass and
solvent viscosity on recrossing frequency. Our approach is simple and requires no additional
hardware or software. The onset of photobleaching, as well as photon saturation, can
therefore be quickly assessed and a single molecule fluorescence experiment can be easily
optimized. Finally, being able to maximize the irradiance exciting the fluorophore without
photobleaching will generate the maximum signal with the lowest error.

Texas Tech University, Sean M. Burrows, August 8, 2009
37
7. References: 1. G. van den Engh and C. Farmer, Cytometry 13, 669 (1992). 2. C. Eggeling, J. Widengren, L. Brand, J. Schaffer, S. Felekyan, and C. A. M. Seidel, J. Phys . Chem A. 110, 2979 (2006). 3. J. Widengren, A. Chmyrov, C. Eggeling, P. A. Löfdahl, and C. A. M. Seidel, J. Phys. Chem. A 111, 429 (2007). 4. C. Eggeling, J. Widengren, R. Rigler, and C. A. M. Seidel, Anal. Chem. 70, 2651 (1998). 5. S. Nie, D. T. Chiu, and R. N. Zare, Anal. Chem. 67, 2849 (1995). 6. M. A. Osborne, S. Balasubramanian, W.S. Furey, and D. Klenerman, J. Phys. Chem B 102, 3160 (1998). 7. F. Hong and D.D. Root, Drug Discov. Today 11, 640 (2006). 8. H. C. Yeh, S. Y. Chao, Y. P. Ho, and T. H. Wang, Curr. Pharm. Biotechno. 6, 453 (2005). 9. R. D. Guenard, L. A. King, B.W. Smith, and J. D. Winefordner, Anal. Chem. 69, 2426 (1997). 10. J. Hofkens, W. Shroeyers, D. Loos, M. Cotlet, F. Köhn, T. Vosch, M. Maus, A. Herrmann, K. Müllen, T. Gensch, and F.C. De Schryver, Spectrochim. Acta Part A 57, 2093 (2001).

Texas Tech University, Sean M. Burrows, August 8, 2009
38
Chapter IV
Light Tolerance of R-Phycoerythrin and a Tandem Conjugate Observed by Single Molecule Recrossing Events
S. M. Burrows, P. Patel, and D. Pappas, Appl. Spectros. 63, 709 (2009).
1. Introduction R-Phycoerythrin (R-PE) belongs to a class of proteins known as phycobiliproteins, a
component of the phyobilisome found in cyanobacteria, red algae and other light harvesting
biological systems. Phycobilisomes are comprised of several phycobiliproteins and
organized in a specific arrangement to collect light over the extended visible spectrum and
transfer that energy to the photosynthetic reaction center. R-PE is typically located at the
periphery of a phycobilisome light harvesting system followed by Phycocyanin and finally
Allophycocyanin at the core. A variety of open-chain linear tetrapyrrole chromophores give
phycobiliproteins their unique light harvesting capabilities.
R-PE is composed of several bilin chromophores that are attached to polypeptide
subunits via thioether linkages to conserved cystein residues1. These polypeptide subunits
are designated as α, β, and a linking γ polypeptide. For R-PE the α subunit is attached to two
phycoerythrobilin (PEB) chromophores. Two PEBs and one phycourobilin (PUB)
chromophore are bound to the β subunit. The γ polypeptide linker consists of three PUBs
and one PEB chromophore. Zhang1 describes the structure of R-PE as a two layered ring
consisting of alternating α and β subunits linked by a γ polypeptide chain. The generally
accepted composition of R-PE is (αβ)6γ. Each αβ monomer consists of five chromophores
and the γ linker has four chromophores giving a total of 34 bilin chromophores on R-
Phycoerythrin. Zhang et. al. describe two groups of PEBs; one group that absorbs around

Texas Tech University, Sean M. Burrows, August 8, 2009
39
530 nm and the other around 560 nm. The phycourobilin absorption maximum is 490 nm.
The energy transfer efficiency among these bilin chromophores approaches 98% and the
quantum yield is around 90%.
There are many postulates as to how the bilin chromophores transfer energy. The
current proposed mechanism involves excitonic coupling among the chomophores. Xie et.
al.2 demonstrated that there are three strong excitonically coupled pairs of bilin
chromophores with weak coupling among the pairs in Allophycocyanin. Other groups
suggested the presence of a Förster Resonance Energy Transfer (FRET) mechanism3-5.
Energy pathways to explain the photophysics of phycobiliproteins include energy hopping,
singlet-singlet annihilation and singlet-triplet annihilation. Several groups have studied these
pathways in-depth1, 2, 4, 6-12. Scheblykin et. al.9 used single molecule polarization
spectroscopy to demonstrate that a polymer molecule emits energy as a multi-chromophoric
ensemble. An extensive investigation of the photophysics of bilin chromophores of
phycoerythrin by Zhang et. al.1 looked at dipole-dipole coupling, torsion angles, population
of molecular energy states and rate constants for those states. Much of the work to elucidate
the photophysics of bilin chromophores is based on energy transfer in bi-chromophoric
systems or other conjugated polymers. The conclusions can then be extended to multi-
chromophoric systems4, 6, 7-9, 13.
There are several reviews available on phycobiliproteins. Zhou14 provides a good
overview of how the types of polypeptides that link the phycobiliprotein monomers together
impact the spectroscopic properties of the entire phycobiliprotein. This overview also
discusses how the different types of linkers play a role in assisting the energy transfer from
the phycobilisome to the photosynthesis reaction center. The origins of phycobiliproteins
Texas Tech University, Sean M. Burrows, August 8, 2009
40
have been reviewed by Marsac15. The crystal structure of various Phycoerythrin proteins,
their amino acid sequence, the placement of chromophores and the number of chromophores
has been reviewed by Huber16. Huber also discusses how the crystal structure and
environment results in differences in the bilin chromophores orientation and thus differences
in spectroscopic properties. Trautman and Xie17 provide a review of single molecule
spectroscopy studies of phycobiliproteins. In this review they discuss how B-Phycoerythrin
acts as a single quantum system rather than a collection of independent chromophores. This
is supported by the fact that the fluorescence photobleaches in a single step rather than a
gradual decrease in fluorescence. Singlet-Singlet annihilation and weak Förster type
coupling among the chromophores were described as mechanisms to explain the
photophysics of phycobiliproteins.
We have recently developed a technique to observe single molecule recrossing
events18. In that work we examined the normalized recrossing ratio and photon saturation
irradiance for three chromophores including R-PE. It was found that when comparing
experimental photon saturation irradiance to the theoretical value, the experimental value was
higher than theory predicted for R-PE. This discrepancy was attributed to the increased
probability of R-PE to enter a triplet state with respect to the other more photostable
chromophores. The triplet state provided an alternate pathway to the ground state thereby
allowing for more excitation/emission cycles before photon saturation. Zare19 and
Klennerman20 have also studied the probability of molecules recrossing the probe volume in
single molecule observations. Several other groups have also used optical trapping to study
single molecules21-24.

Texas Tech University, Sean M. Burrows, August 8, 2009
41
R-PE and other phycobiliproteins have potential as light harvesting molecules for a
variety of applications. However, the formation of triplet state molecules at higher excitation
irradiance limits the upper range of light exposure. The addition of a tandem conjugate
molecule to transfer the energy can potentially extend the light tolerance of R-PE to higher
excitation irradiances, improving its potential as a light harvesting material. To that end, a
tandem conjugate (R-PE coupled to AlexaFluor 647, henceforth referred to as PE-647) was
used as a model system to study the enhanced photophysical properties of R-PE when
coupled to a second fluorophore.
The average baseline subtracted fluorescence intensity, the normalized recrossing
ratio (Nr/Nt) and the number of molecules detected per second as a function of irradiation
power and time were investigated. In this work we compared normalized recrossing events
(Nr/Nt ratio) of R-PE to PE-647, which demonstrated normalized recrossings as a technique
to qualitatively observe energy transfer and quantitatively determine number of molecular
recrossings. Comparing the recrossing ratio for the two fluorophores at various powers
allowed us to show that triplet state formation and photobleaching were minimized when a
tandem conjugate was attached to a phycobiliprotein. The light tolerance achieved in these
light-harvesting systems was investigated by comparing the normalized recrossing ratio and
photon saturation irradiances of the two species. Understanding the light tolerance of these
light-harvesting systems will provide useful information in applying them to small
photovoltaic devices and other light harvesting applications.
Texas Tech University, Sean M. Burrows, August 8, 2009
42
2. Experimental
2.1. Dye Samples. R-Phycoerythrin and Streptavidin R-Phycoerythrin-AlexaFluor-647 were purchased
from Molecular Probes. The working concentrations were prepared as 800 pM, R-PE, and
825 pM, PE-647, by diluting the stock solution, concentration (4 mg/mL R-PE and 1 mg/mL
PE-647), in phosphate buffered saline (pH 7.4, Invitrogen). All samples were prepared on
the day the experiment was performed. Blank solutions consisted of the phosphate buffered
saline.
2.2. Instrumental Setup. A detailed description of the single molecule detection system and data acquisition
can be found elsewhere18, 25; a brief description will be presented here. To minimize Raman
and Rayleigh scattering, interference filters of appropriate wavelength were placed before the
aspheric lens. R-PE fluorescence was detected using a 575 nm interference filter (Omega
Optical). PE-647 was detected using a 676 nm interference filter (Omega Optical). The
absorption maximum of the PE-647 is around 667 nm; however, the logistics of the lab
required the use of a 676 nm filter. From the emission spectra of the PE-647 it can be seen
that there is still sufficient emission at 676 nm and the bandwidth on the filter at full width
half maximum was about 10 nm. All samples were placed on 150 µm coverslips and coupled
the objective via immersion oil. See the Figure 2.1 in the Instrumental Section of Chapter II
for a diagram of the single molecule detection apparatus.
We have previously described normalized recrossing events to study photophysics of
fluorophores18; a brief description will be presented here. Emission from the sample was
acquired every millisecond and processed by a LabView program, developed in-house.

Texas Tech University, Sean M. Burrows, August 8, 2009
43
Equation 1, based on the limit of quantification, was used to define a threshold fluorescence
intensity above which fluorescence signal would be extracted from the time trace.
Ith = b + 6sb (1)
Ith was the threshold fluorescence intensity, b was the average baseline intensity, and sb was
the standard deviation of the baseline intensity. From the time trace the average baseline
intensity was calculated from the signal of 100 consecutive data points corresponding to
baseline intensity. These data points were chosen from the low intensity signal in-between
the more intense fluorescent signals from single molecules. From blank solutions of
phosphate buffered saline we were able to differentiate what constituted “low” intensity with
respect to a fluorescent signal that would be observed in a time trace if analyte were present.
The average signal from phosphate buffered saline blank solutions was lower than the
baseline intensity of time traces containing the analyte (data not shown). For this reason
phosphate buffered saline blank solutions were not used to define the threshold fluorescence
intensity. The threshold fluorescence intensity, Ith, ensured the fluorescence signal was
statistically different from the baseline and represented a single molecule of interest (i.e. R-
PE or PE-647).
To establish the normalized recrossing ratio (Nr/Nt), molecules with fluorescent
signal above Ith were first extracted from the time trace. Then the time difference between
the consecutive molecules, referred to as interpeak times, was calculated. According to
Zare19, molecules typically spend ~ 1 ms in the probe volume using a similar apparatus, thus
molecules with interpeak times of 1 ms were considered as the same molecule dwelling in
the probe volume. To avoid counting such a molecule, we extracted molecules with
interpeak times greater than 1 ms. If the interpeak time was 2 ms, then the probe volume was
Texas Tech University, Sean M. Burrows, August 8, 2009
44
void of analyte for 1 ms before it recrossed. Therefore, molecules with interpeak times of 2
ms were classified as molecules that recross the probe volume. Interpeak times greater than
2 ms are likely new molecules being detected rather than the same molecule recrossing the
probe volume. The number of molecules in the time trace with interpeak times of 2 ms was
determined and defined as Nr. The total number of molecules extracted from the time trace
was defined as Nt. Finally, a normalized recrossing ratio, Nr/Nt, was determined for each
experiment. The number of molecules per second was determined by dividing Nt by the
duration of the time trace used to extract molecules. For R-PE and PE-647 the duration was
60 and 20 seconds, respectively. The longer duration only results in more molecules being
detected. The figures containing average baseline subtracted florescence intensity were
calculated by subtracting the baseline intensity from the fluorescence intensity associated
with a molecule, then averaging the fluorescence signal for all extracted molecules from the
time trace. These data processing steps were performed in Origin.
3. Results
3.1. Saturation Irradiation. To study the light tolerance of phycobiliproteins, the saturation irradiance was
investigated for R-PE and PE-647. The saturation power was interpolated from plots of the
average baseline subtracted fluorescence intensity of single molecule bursts as a function of
power (Figure 4.1), then saturation irradiance was calculated for each phycobiliprotein. The
experimentally determined values for each species were compared to each other.
The diameter of the probe volume was estimated to be 1 µm18, assuming a circular
cross section for the probe volume in the focal plane, a cross sectional area of 7.8 x 10⁻⁹ cm2
was calculated. With the cross sectional area of the probe volume and the saturation power,

Texas Tech University, Sean M. Burrows, August 8, 2009
45
the experimental saturation irradiance was determined. The saturation irradiance for R-PE
was experimentally determined to be 1.7 x 10⁴ W/cm2. Compared to that of PE-647, 4.6 x
104 W/cm2, R-PE had a saturation irradiance that was 2.7 times lower. This demonstrates the
higher irradiances available with PE-647 before saturation and demonstrates tandem
conjugates superior light tolerance. The higher saturation irradiance of PE-647 can also be
attributed to the alternate path to ground state energy of the molecule provided by the tandem
conjugate.
At excitation powers above 800 µW the fluorescence intensity was observed to
increase for R-PE, see Figure 4.1a. However, it was still within the error of the fluorescence
intensity observed from 130 µW to 800 µW. The reason for the increase in fluorescence
intensity could be attributed to Raman scatter, as blank solutions exhibited significant Raman
scatter at the same powers. To remove Raman scatter we baseline subtracted the
fluorescence intensity from fluorescent bursts extracted from the time trace. However,
baseline subtraction may not completely remove the contribution from Raman scatter.
From Figure 4.1b it should also be noted that the fluorescence intensity, at photon
saturation, was lower for PE-647 than for R-PE. At photon saturation the average baseline
subtracted fluorescence intensity for R-PE was around 30 cpms (counts per millisecond)
while the PE-647 was about 20 cpms. The reduced signal intensity may be due to the use of
the 676 ± 10 nm interference filter rather than measuring at 667 nm, the emission maximum
of PE-647. The standard deviation for the R-PE single molecule bursts was about 10 cpms
compared to 4 cpms for PE-647. This reduced standard deviation for PE-647 could be due to
reduced Raman scatter at 676 nm than at 575 nm.
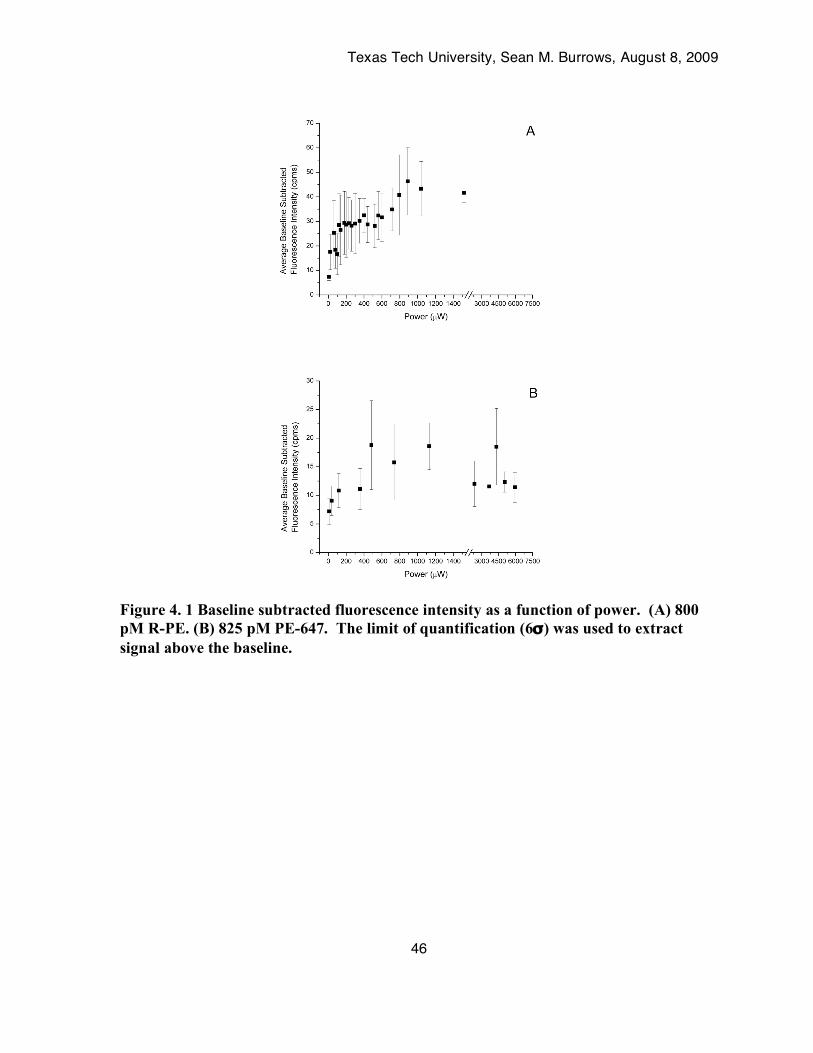
Texas Tech University, Sean M. Burrows, August 8, 2009
46
Figure 4. 1 Baseline subtracted fluorescence intensity as a function of power. (A) 800 pM R-PE. (B) 825 pM PE-647. The limit of quantification (6σ) was used to extract signal above the baseline.

Texas Tech University, Sean M. Burrows, August 8, 2009
47
3.2. Normalized Recrossing as a Function of Power. From the saturation irradiance it was shown that higher irradiances were achieved
with PE-647 than for R-PE. At higher powers, R-PE can be photobleached or enter the
triplet state. To study the light harvesting capabilities of R-PE and PE-647, the normalized
recrossing as a function of power was investigated. From Figure 4.2a, for R-PE, it was
observed that from 1.0 mW to 6.0 mW no recrossings occurred, and the molecules must be in
the triplet state or photobleached. Since the recrossing of a given molecule is related to both
random diffusion and radiation trapping, the number of recrossing events would increase in
the absence of photobleaching or triplet state formation. In previous work18, we showed that
calcein and fluorescein have a higher light tolerance (i.e. less likely to photobleach or enter
the triplet state) than R-PE. In the case of R-PE, the increased irradiance results in triplet
state conversion and therefore fewer recrossings, despite the greater degree of radiation
trapping. However, for PE-647, recrossings above 1.0 mW were observed (Figure 2b).
Shapiro26 suggests that the triplet state is circumvented in tandem conjugates of
phycobiliproteins, and that energy transfers to the tandem conjugate via singlet excited state
bilin chromophores.
The errors in the normalized recrossing ratio arise from the error in the total number
of molecules counted. The error in the Nr/Nt ratio was ~ 0.03 for both species investigated.
For R-PE the Nr/Nt ratio increases from 0.06 ± 0.02 at 7 µW to 0.14 ± 0.03 at 22 µW. Then
as the power is increased further the Nr/Nt ratio decreases to 0.04 ± 0.02 at 230 µW before it
increases again and fluctuates around 0.06 until 1.0 mW when the Nr/Nt ratio was zero.
For PE-647 the Nr/Nt ratio was relatively constant at 0.04 ± 0.03, with in the error of
the measurement (Figure 4.2b). At higher powers the Nr/Nt ratio decreased. From about 1.0

Texas Tech University, Sean M. Burrows, August 8, 2009
48
Figure 4. 2 Normalized molecular recrossings as a function of power. (A) 800 pM R-PE. (B) 825 pM PE-647. The nonzero normalized recrossing above 1.0 mW demonstrate the ability to observe the minimization of triplet state formation in the tandem conjugate using normalized recrossing events.
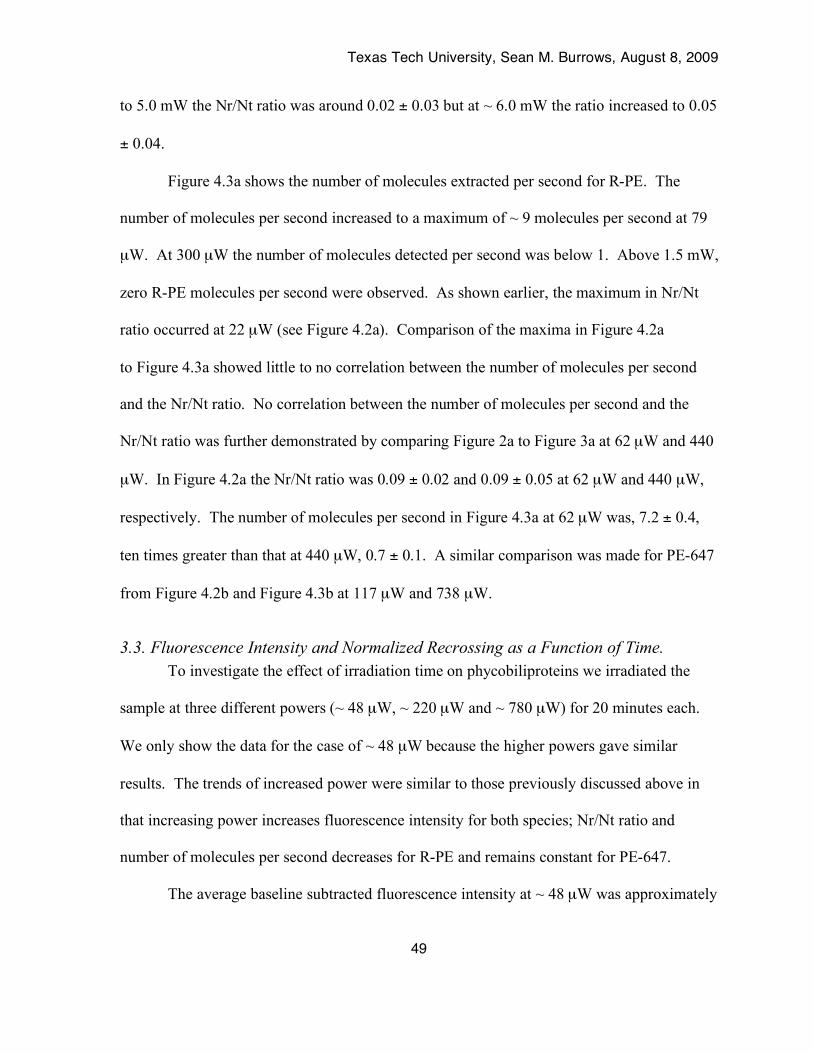
Texas Tech University, Sean M. Burrows, August 8, 2009
49
to 5.0 mW the Nr/Nt ratio was around 0.02 ± 0.03 but at ~ 6.0 mW the ratio increased to 0.05
± 0.04.
Figure 4.3a shows the number of molecules extracted per second for R-PE. The
number of molecules per second increased to a maximum of ~ 9 molecules per second at 79
µW. At 300 µW the number of molecules detected per second was below 1. Above 1.5 mW,
zero R-PE molecules per second were observed. As shown earlier, the maximum in Nr/Nt
ratio occurred at 22 µW (see Figure 4.2a). Comparison of the maxima in Figure 4.2a
to Figure 4.3a showed little to no correlation between the number of molecules per second
and the Nr/Nt ratio. No correlation between the number of molecules per second and the
Nr/Nt ratio was further demonstrated by comparing Figure 2a to Figure 3a at 62 µW and 440
µW. In Figure 4.2a the Nr/Nt ratio was 0.09 ± 0.02 and 0.09 ± 0.05 at 62 µW and 440 µW,
respectively. The number of molecules per second in Figure 4.3a at 62 µW was, 7.2 ± 0.4,
ten times greater than that at 440 µW, 0.7 ± 0.1. A similar comparison was made for PE-647
from Figure 4.2b and Figure 4.3b at 117 µW and 738 µW.
3.3. Fluorescence Intensity and Normalized Recrossing as a Function of Time. To investigate the effect of irradiation time on phycobiliproteins we irradiated the
sample at three different powers (~ 48 µW, ~ 220 µW and ~ 780 µW) for 20 minutes each.
We only show the data for the case of ~ 48 µW because the higher powers gave similar
results. The trends of increased power were similar to those previously discussed above in
that increasing power increases fluorescence intensity for both species; Nr/Nt ratio and
number of molecules per second decreases for R-PE and remains constant for PE-647.
The average baseline subtracted fluorescence intensity at ~ 48 µW was approximately

Texas Tech University, Sean M. Burrows, August 8, 2009
50
Figure 4. 3 Number of molecules per second as a function of power. (A) 800 pM R-PE. (B) 825 pM PE-647. The number of detected molecules does not correlate with the number of recrossing events (Nr/Nt).

Texas Tech University, Sean M. Burrows, August 8, 2009
51
the same for both R-PE and PE-647 as observed from Figure 4.4. The standard deviation of
the average baseline subtracted fluorescence intensity from R-PE was ~ 6 cpms. The lower
standard deviation of the average baseline subtracted fluorescence intensity of PE-647, ~ 3
cpms, suggests less variability in signal and reduced Raman scatter at 676 nm. Secondly, the
average baseline subtracted fluorescence intensity was relatively constant over 20 minutes of
irradiation for both species. This behavior differs from the case of ensemble (many
molecule) measurements, where the signal decreases over time even at these relatively low
excitation powers.
Figure 4.5 demonstrated how irradiation time impacted the normalized recrossing
ratio of each species. At a power of 48 µW the Nr/Nt ratio was 0.13 ± 0.02 and 0.11 ± 0.01
for R-PE and PE-647, respectively. This Nr/Nt ratio remained constant over the entire 20
minutes of irradiation. Investigation of Figure 4.5a showed that the error was small and grew
as time went on for R-PE. From Figure 4.6a it was observed the number molecules per
second for R-PE decreased over time, which explains why the error increases.
In contrast, the error in Figure 4.5b for Nr/Nt ratio of PE-647 was constant because
the number of molecules per second was relatively constant as observed in Figure 4.6b.
There was a decrease in the number of molecules per second of PE-647 from ~ 10 at 1
minute to ~ 6 at 4 minutes. The number of molecules per second increased back up to ~ 8 at
6 minutes and remained at this level for the duration of the experiment.
4. Discussion At powers above 1.5 mW, there were zero R-PE molecules detected. This can be
attributed to the high probability that bilin chomophores will enter the triplet state at high
excitation powers, rendering the molecule non-fluorescent. Another possible reason for the
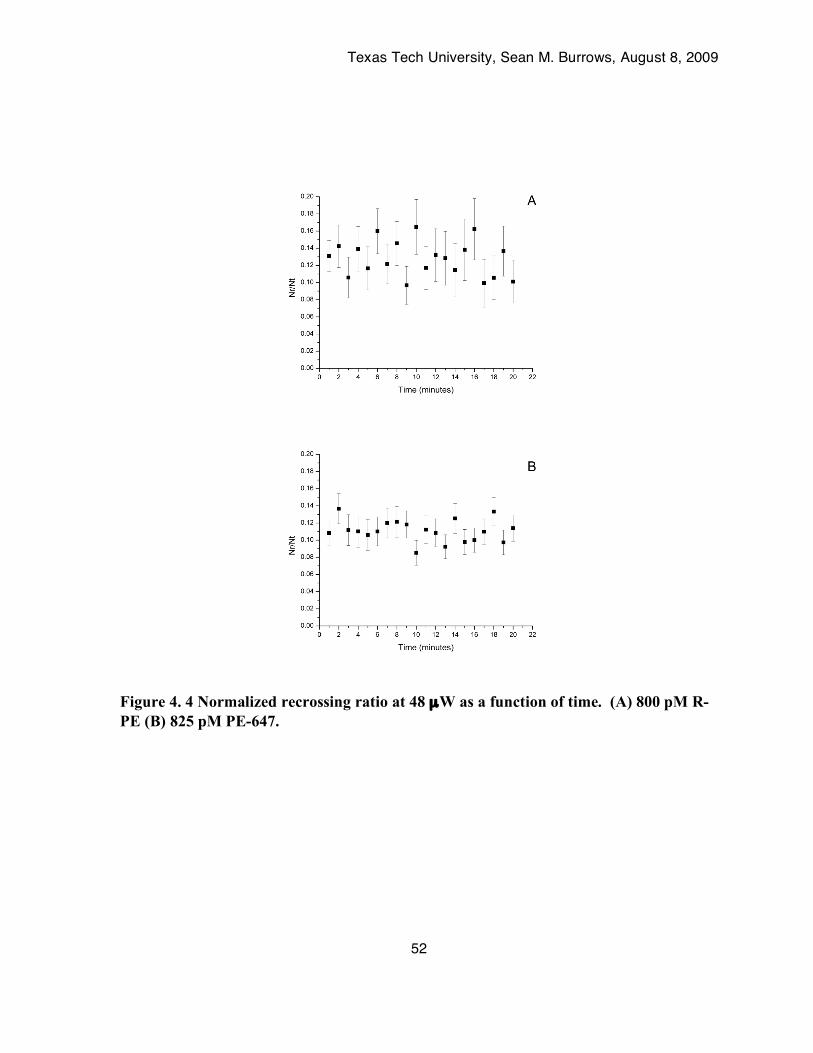
Texas Tech University, Sean M. Burrows, August 8, 2009
52
Figure 4. 4 Normalized recrossing ratio at 48 µW as a function of time. (A) 800 pM R-PE (B) 825 pM PE-647.

Texas Tech University, Sean M. Burrows, August 8, 2009
53
Figure 4. 5 Single molecule fluorescence burst intensity at 48 µW as a function of time. (A) 800 pM R-PE (B) 825 pM PE-647. While photobleaching is likely occurring, the rate of molecular arrival remains constant over the twenty-minute measurement.
Texas Tech University, Sean M. Burrows, August 8, 2009
54
Figure 4. 6 Number of molecules per second as a function of time 48 µW. (A) 800 pM R-PE (B) 825 pM PE-647. The decrease in detected molecules for R-PE is attributed to a combination of photobleaching and triplet formation. In PE-647, triplet state formation is minimized, and the fluctuations are likely due to convection.
Texas Tech University, Sean M. Burrows, August 8, 2009
55
lack of fluorescence at high powers can be attributed to photobleaching. On the other hand,
fluorescence from PE-647 could be observed at similar powers; this suggested that the
molecule was still capable of transferring excitation energy to the tandem conjugate at these
high powers. Thus having a tandem conjugate provides an alternate pathway for energy
transfer, thereby reducing the triplet state formation and the chance of photobleaching.
The observed standard deviations on the average baseline subtracted fluorescence
intensity arise from the large variation in signal from individual molecules. The fluctuation
of fluorescence intensity depends on the trajectory the molecule takes through the probe
volume. The longer a molecule spends in the probe volume, the more excitation and
emission cycles it will undergo in the millisecond observation time. The
fluorescence intensity for R-PE ranges from 10 to 160 cpms (data not shown). PE-647
fluorescence intensity ranged from 10 to 65 cpms (data not shown).
For R-PE it was not until 5.0 mW that the baseline signal from Raman scatter
overwhelmed the fluorescence signal (data not shown), thus we do not suspect the baseline
signal was masking the fluorescent signal at powers from 1.5 mW to 5.0 mW. Rather, the
molecules did not fluoresce at powers from 1.5 mW to 5.0 mW. On the other hand, above
5.0 mW there was a possibility the fluorescence emission could have been overwhelmed by
the Raman scatter, or that fluorescence from out of the focal plane contributed to the baseline
signal. The out of focus region of the laser excitation experiences a lower excitation
irradiance, and is detected less efficiently, but is massive relative to the confocal volume of
detection. The increase in background was present above 5.0 mW in the blank solutions as
well, indicating that Raman scatter of water (detected at 575 nm using 488 nm excitation)
was the major cause of this background increase.
Texas Tech University, Sean M. Burrows, August 8, 2009
56
Since AlexaFluor 647 tandem conjugate becomes excited indirectly, increasing laser
power indirectly increases the number of times the molecule was excited. The energy
transfer from R-PE to AlexaFluor 647 minimizes photobleaching as well as triplet states of
the R-PE because it reduces the time R-PE bilin chromophores spend in an excited state. As
a result (Figure 4.1b), for PE-647, emission was still observed at powers greater than 1.5
mW. Furthermore, PE-647 had a non-zero Nr/Nt ratio at powers greater than 1.0 mW
(Figure 4.2b). If molecules were being photobleached or entered triplet states during the
initial excitation, then recrossing molecules would not have been observed.
The fluctuations observed for the normalized recrossing ratio associated with the R-
PE arise from the triplet state formation. In this work we observed molecules diffusing
through the probe volume. Molecules in the triplet state led to non-radiative decay back to
the ground state and render the molecule available for absorption of another photon. These
triplet states typically last for several microseconds. Our observation time was insensitive to
the fluctuations due to triplet state formation during the molecular transit through the probe
volume. The recrossing; however, was sensitive to photobleaching as well as to molecules
remaining in the triplet state and therefore unable to fluoresce after reentering the probe
volume a second time. The triplet state of R-PE and other phycobiliproteins is long lived
when excited by a high irradiance source26. The PE-647 tandem conjugate does not have as
great a probability of entering the triplet state as R-PE and thus a greater Nr/Nt ratio was
observed at powers greater than 1.0 mW.
Typically on the ensemble level the fluorescence intensity decreases over time as
molecules are photobleached and/or enter triplet states. For single molecule detection of
molecules bound to a support, triplet state and photobleaching can also be observed by a
Texas Tech University, Sean M. Burrows, August 8, 2009
57
decrease in the fluorescence signal. However, a decrease in fluorescence intensity was not
observed in our experiments (see Figure 4.4). While molecules are being photobleached by
the excitation laser, the time span for each experiment was short enough to ensure that the
rate of arrival of molecules in the probe volume was not affected significantly by
photobleaching of the bulk sample.
From Figure 4.6 it was observed that the number of molecules per second decreased
over time for R-PE but remained relatively constant for PE-647. This data supports our
recrossing observations. If molecules are photostable enough to reenter the probe volume
shortly after the initial excitation cycle, then the likelihood of photodestruction is lower than
in the case of R-PE.
Normalized recrossing ratios demonstrate the superior light harvesting capabilities of
the tandem conjugates over R-PE. For R-PE, Figure 2a shows Nr/Nt ratios of zero at 325
µW, 550 µW, 600 µW, 1.0 mW and 1.5 mW. PE-647 had Nr/Nt ratios of zero at 10 µW, 3.7
mW and 4.2 mW (see Figure 2b). The zero Nr/Nt ratio at 10 µW was attributed to
insufficient excitation at such a low power. At the powers R-PE showed a zero Nr/Nt ratio,
the PE-647 showed non-zero Nr/Nt ratios for similar powers. Even when average
fluorescence intensity shows that molecules are fluorescing, the single molecular recrossing
events show that no molecules are recrossing and must be in a triplet state or photobleached
after initial excitation and emission. Observing single molecular recrossing events is
advantageous in that the onset of photodegradation is observed at excitation powers that
cannot be determined with fluorescence intensity alone.
Single molecular recrossing measurements can find use in the investigation of the
light harvesting properties of conjugated fluorophores. Since molecular recrossings indicate

Texas Tech University, Sean M. Burrows, August 8, 2009
58
that a molecule has entered the probe volume and has been excited by the laser, and has
subsequently reentered the probe volume for a second cycle of excitation, the technique is
particularly well suited to photobleaching and triplet state conversion studies. By designing
molecules to minimize triplet states the light harvesting capabilities of phycobiliprotein
conjugates can be improved further. The molecular recrossing method is a useful and simple
method for assessing photostability of these and other fluorophores, and is simpler to
implement than correlation or photon counting histogram techniques. The normalized
recrossing ratio could also be used to qualitatively assess the energy transfer efficiency. The
greater the Nr/Nt ratio for a tandem conjugate the greater the transfer efficiency of the
tandem conjugate.
5. Conclusion From a single molecule standpoint, a simple and inexpensive approach to
qualitatively study light harvesting properties of phycobiliproteins was presented. Errors
from Raman and Raleigh scattering were minimized because the normalized recrossing ratio
was intensity independent. We showed that as the power increases the normalized recrossing
ratio remains constant (0.04) for PE-647 at the excitation powers used. The Nr/Nt ratio of R-
PE decreased and finally went to zero at 1.0 mW and remained at zero up to 6.0 mW, despite
the increased potential for radiation trapping at higher irradiances. The Nr/Nt ratio can be
used to obtain quantitative information about the number of molecules that recross. For
example at powers below 1.0 mW ~ 6 % of R-PE molecules recross, beyond 1.0 mW no
molecules recross. While ~ 4 % of PE-647 molecules recross from ~ 10 µW to 6 mW. We
also demonstrated that there was no correlation between the number of molecules per second
and the Nr/Nt ratio. The power at which the maximum in the Nr/Nt ratio occurred did not
Texas Tech University, Sean M. Burrows, August 8, 2009
59
coincide with the power at which the maximum number of molecules per second occurred.
Since the excitation irradiance affects radiation trapping and increases the likelihood that a
molecule will recross the probe volume, this is expected. This method can be applied to
other light harvesting systems to study the light tolerance as well as qualitatively assessing
the energy transfer of light harvesting systems. Future work will involve digestion of R-PE
and PE-647 to investigate the impact of disrupting the energy transfer mechanism in the
tandem conjugation.
Texas Tech University, Sean M. Burrows, August 8, 2009
60
6. Reference: 1. A. Gaigalas, T. Gallagher, K. D. Cole, T. Singh, L. Wang, and Y. Z. Zhang, Photochem. Photobiol. 82, 635 (2006). 2. L. Ying and X. S. Xie, J. Phys. Chem. B 102, 10399 (1998). 3. K. Sauer and H. Scheer, Biochim. Biophys. Acta 936, 157 (1988). 4. J. Hofkens, M. Cotlet, T. Vosch, P. Tinnefeld, K. D. Weston, C. Ego, A. Grimsdale, K. Müllen, D. Beljonne, J. L. Brédas, S. Jordens, G. Schweitzer, M. Sauer, and F. De Schryver, P. Natl. Acad. Sci. U. S. A. 100, 23, 13146 (2003). 5. T. Gensch, M. Böhmer, and P. F. Aramendía, J. Phys. Chem. A 109, 6652 (2005). 6. P. Tinnefeld, V. Buschmann, K. D. Weston, and M. Sauer, J. Phys. Chem. A 107, 3, 323 (2003). 7. J. Yu, R. Lammi, A. J. Gesquiere, and P. F. Barbara, J. Phys. Chem. B 109, 10025 (2005). 8. J. Hofkens, W. Schroeyers, D. Loos, M. Cotlet, F. Köhn, T. Vosch, M. Maus, A. Herrmann, K. Müllen, T. Gensch, and F. C. De Schryver, Spectrochim. Acta A 57, 2093 (2001). 9. M. Forster, D. Thomsson, P. R. Hania, and I. G. Scheblykin, Phys. Chem. Chem. Phys. 9, 761 (2007). 10. M. Hucke, G. Schweitzer, A. R. Holzwarth, W. Sidler, and H. Zuber, Photochem. Photobiol. 57, 1, 76 (1993). 11. A. B. Doust, K. E. Wilk, P. M. G. Curmi, and G. D. Scholes, J. Photoch. Photobio. A 184, 1 (2006). 12. A. Holzwarth, Physiol. Plantarum 83, 518 (1991). 13. C. Eggeling, J. Widengren, R. Rigler, and C. A. M. Seidel, Anal. Chem. 70, 2651 (1998). 14. L. N. Liu, X. L. Chen, Y. Z. Zhang, and B. C. Zhou, Biochim. Biophys. Acta 1708, 133 (2005). 15. N. T. de Marsac, Photosynth. Res. 76, 197 (2003). 16. R. Ficner, K. Lobeck, G. Schmidt, and R. Huber, J. Mol. Biol. 228, 935 (1992). 17. X. S. Xie and J. K. Trautman, Annu. Rev. Phys. Chem. 49, 441 (1998).

Texas Tech University, Sean M. Burrows, August 8, 2009
61
18. S. M. Burrows, R. D. Reif, and D. Pappas, Anal. Chim. Acta. 598, 135 (2007). 19. S. Nie, D. T. Chiu, and R. N. Zare, Anal. Chem. 67, 2849, (1995). 20. M. A. Osborne, S. Balasubramanian, W. S. Furey, and D. Klenerman, J. Phys. Chem. B 102, 3160 (1998). 21. H. T. Chen, Y. M. Li, R. L. Lou, and Z. Gong, Proceedings of SPIE, the International Society for Optical Engineering, 4923, 98 (2002). 22. M. J. Lang, and S. M. Block, Am. J. Phys. 71, 3, 201 (2003). 23. T. T. Perkins, H. W. Li, R. V. Dalal, J. Gelles, and S. M. Block, Biophys. J. 86, 1640 (2004). 24. C. Deufel and M. D. Wang, Biophys. J. 90, 657 (2006). 25. S. M. Burrows and D. Pappas, Analyst 133, 870 (2008) 26. H. M. Shapiro, Practical Flow Cytometry (John Wiley & Sons, Inc., Hoboken, NJ, 2003), 4th ed., Chap. 7, p. 334.

Texas Tech University, Sean M. Burrows, August 8, 2009
62
Chapter V
Noise and Error in Single Molecule Fluorescence Anisotropy
1. Introduction Single molecule detection is a very sensitive technique that can be greatly affected by
the slightest error. Since single molecule detection is a stochastic process it is inherently
hindered by shot noise. Other sources of error can arise from diffusion of the molecule
through the probe volume, structural heterogeneities, counting error, instrumental error,
flicker, background counts, etc.
Shot noise scales with the square root of the fluorescence intensity. Thus at low
fluorescence counts there is a more pronounced impact from shot noise than at high signal
counts. This in turn will impact the mean and standard deviation of the anisotropy. The
number of molecules counted could also be a source of error on anisotropy, in that counting
fewer or more molecules could lead to error.
Zare et al.1-3 have described photon counting histograms for one photon excitation.
This work is applied to experiments utilizing fluorescence correlation spectroscopy. They
considered two parameters in their work, molecular brightness, ε, and the average number of
particles in the observation volume, N. They proposed that when light intensity is constant
the distribution of photon counts is Poissonian and the fundamental form of noise is shot
noise.
Keller4 and coworkers have put together an overview on statistics of single molecule
detection. They discuss how diffusion, photobleaching, and molecular noise lead to burst
size distribution broadening. Their work described how there is a nonzero probability that

Texas Tech University, Sean M. Burrows, August 8, 2009
63
more than one molecule can traverse the detection volume at the same time. Fluctuations in
the numbers of molecules in the sampling volume were called ‘molecular shot noise’.
Weiss5 has presented work on shot-noise limited single molecule Fluorescence
Resonance Energy Transfer (FRET) histograms. In this work a numerical algorithm to
compute the best-fit shot-noise limited proximity ratio histogram (PRH) was presented. A
proximity ratio expresses FRET efficiency by taking into account leakage to wrong detector,
background, and direct excitation of the acceptor. It was their goal to estimate the shot-noise
contribution to the width of the PRH.
Seidel6 and coworkers have presented work to separate structural heterogeneities
from stochastic variations in FRET distributions. In order to achieve this they established a
probability distribution analysis to analyze the FRET signals to determine the shot-noise
limited signal distribution. These distributions take into account crosstalk, stochastic
variations, and background to allow distinction between shot-noise distributions and
distributions broadened by heterogeneities.
Seidel7 and coworkers have also been able to distinguish between small rapidly
rotating rhodamine 123 and a large sluggishly rotating enhanced yellow fluorescent protein.
In their work a pulsed laser allowed for burst integrated fluorescence lifetime (BIFL). BIFL
simultaneously registers fluorescence intensity, lifetime and anisotropy.
Fluorescence anisotropy is emerging as a tool to be used in combination with single
molecule detection. Measuring anisotropy requires splitting the fluorescence polarization
into the perpendicular and parallel components. However, when using a high numerical
aperture lens the perpendicular and parallel components can mix and effect the measurement.
Chirico8 and coworkers present a method that takes into account this mixing of signals.
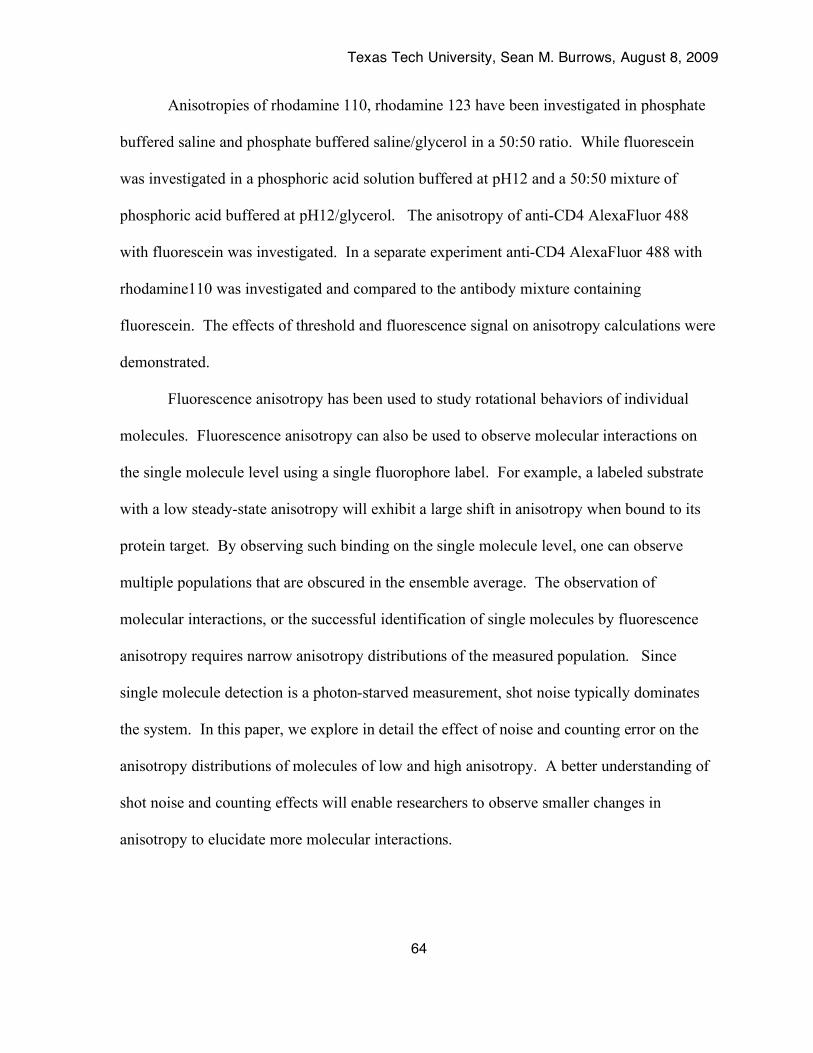
Texas Tech University, Sean M. Burrows, August 8, 2009
64
Anisotropies of rhodamine 110, rhodamine 123 have been investigated in phosphate
buffered saline and phosphate buffered saline/glycerol in a 50:50 ratio. While fluorescein
was investigated in a phosphoric acid solution buffered at pH12 and a 50:50 mixture of
phosphoric acid buffered at pH12/glycerol. The anisotropy of anti-CD4 AlexaFluor 488
with fluorescein was investigated. In a separate experiment anti-CD4 AlexaFluor 488 with
rhodamine110 was investigated and compared to the antibody mixture containing
fluorescein. The effects of threshold and fluorescence signal on anisotropy calculations were
demonstrated.
Fluorescence anisotropy has been used to study rotational behaviors of individual
molecules. Fluorescence anisotropy can also be used to observe molecular interactions on
the single molecule level using a single fluorophore label. For example, a labeled substrate
with a low steady-state anisotropy will exhibit a large shift in anisotropy when bound to its
protein target. By observing such binding on the single molecule level, one can observe
multiple populations that are obscured in the ensemble average. The observation of
molecular interactions, or the successful identification of single molecules by fluorescence
anisotropy requires narrow anisotropy distributions of the measured population. Since
single molecule detection is a photon-starved measurement, shot noise typically dominates
the system. In this paper, we explore in detail the effect of noise and counting error on the
anisotropy distributions of molecules of low and high anisotropy. A better understanding of
shot noise and counting effects will enable researchers to observe smaller changes in
anisotropy to elucidate more molecular interactions.
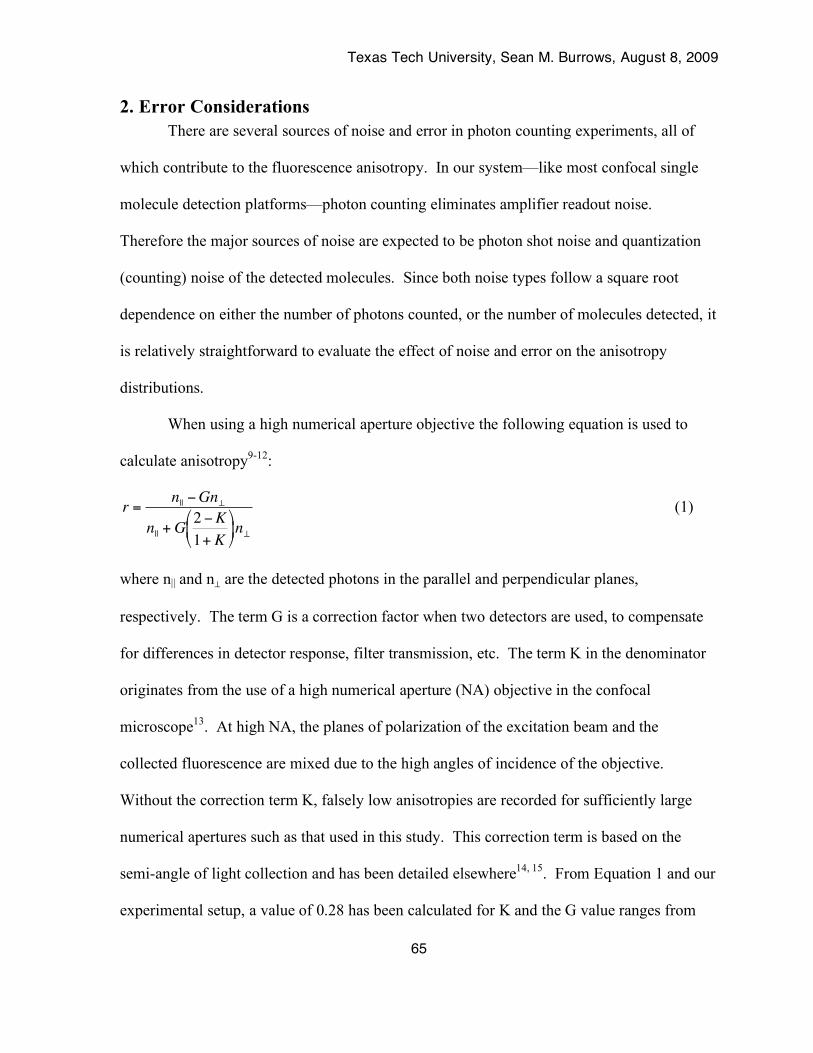
Texas Tech University, Sean M. Burrows, August 8, 2009
65
2. Error Considerations There are several sources of noise and error in photon counting experiments, all of
which contribute to the fluorescence anisotropy. In our system—like most confocal single
molecule detection platforms—photon counting eliminates amplifier readout noise.
Therefore the major sources of noise are expected to be photon shot noise and quantization
(counting) noise of the detected molecules. Since both noise types follow a square root
dependence on either the number of photons counted, or the number of molecules detected, it
is relatively straightforward to evaluate the effect of noise and error on the anisotropy
distributions.
When using a high numerical aperture objective the following equation is used to
calculate anisotropy9-12:
!
r =n||"Gn#
n||+G
2 "K
1+ K
$
% &
'
( ) n#
(1)
where n|| and n⊥ are the detected photons in the parallel and perpendicular planes,
respectively. The term G is a correction factor when two detectors are used, to compensate
for differences in detector response, filter transmission, etc. The term K in the denominator
originates from the use of a high numerical aperture (NA) objective in the confocal
microscope13. At high NA, the planes of polarization of the excitation beam and the
collected fluorescence are mixed due to the high angles of incidence of the objective.
Without the correction term K, falsely low anisotropies are recorded for sufficiently large
numerical apertures such as that used in this study. This correction term is based on the
semi-angle of light collection and has been detailed elsewhere14, 15. From Equation 1 and our
experimental setup, a value of 0.28 has been calculated for K and the G value ranges from

Texas Tech University, Sean M. Burrows, August 8, 2009
66
0.7 to 0.99, as it was calculated each time an experiment was performed. The variation in the
G correction term resulted from changes in alignment and other experimental factors.
The two avalanche photodiodes used to detect the parallel and perpendicular
polarization components are intrinsically linked to each other with respect to anisotropy
measurements. In other words, photon counts from the second detector (n⊥) can only take on
certain physically relevant values for the valid anisotropy range of 0-0.4. Since shot noise
does introduce some error in the measurement, there are some negative values as well as
some values above 0.4, but for this discussion we can limit the values of r to the physical
range of 0-0.4. In this limiting case, the counts from detectors 1 and 2 (n|| and n⊥,
respectively) are linked to each other as follows:
!
n" =n||# rn
||
rGK '+G. (2)
K' in Equation 2 is the combined correction term (2-K)/(1+K) from Equation 1.
There is, of course, some variation in n|| and n⊥, and photon shot noise in each measurement
will create an error in the measured r value for each molecule. Equation 2 limits the
perpendicular signal counts to those that will yield physical anisotropy values. The
distribution of anisotropies for a population of individually detected molecules will have a
standard deviation that is the convolution of the counting error and the errors of the
individual anisotropy values. We will demonstrate later in this paper the affect of both the
photon shot noise and the counting error. The error for an individual anisotropy
measurement due to shot noise can be estimated using the shot noise from each detector for
that given measurement. For this discussion, it is more convenient to relate the error in
anisotropy to the photon shot noise of one detector, since the two APD count values are

Texas Tech University, Sean M. Burrows, August 8, 2009
67
related to each other. The relative noise in each detector adds quadratically to determine the
error in anisotropy. The photon shot noise for each APD is:
!
"n
= nx
, (3)
where nx is the number of detected photons for either channel. Since the total number of
detected photons is split between two detectors, the shot noise in each detector is worse than
the shot noise if the signals were detected by a single APD. Each signal contributes doubly
to the error in anisotropy, and the relative anisotropy error is given by:
!
"r
r=
1
n||
1+G1# r
rK '+1
$
% & '
( )
1#1# r
rK '+1
$
% & '
( )
2+
1+ K '( )2
G1# r
rK '+1
$
% & '
( )
1+ K '1# r
rK '+1
$
% & '
( ) $
% &
'
( )
2
$
%
& & & &
'
(
) ) ) )
(4)
Figure 5.1 shows the error in anisotropy originating from photon shot noise.
Absolute standard deviations are shown, but it is important to note that the relative standard
deviation increases with increasing anisotropy values as well. From the graph it can be seen
that photon shot noise significantly affects the distribution of anisotropy values detected from
single molecules. The counting error for a molecular population is given by the square root
of the number of counts. Therefore, for a mean anisotropy of 0.2, counting 100 molecules
yields a relative error of 0.02; increasing the number of counted molecules to 1000 yields a
relative error of 0.006. Comparing these values to those calculated in Figure 5.1, it is evident
that photon shot noise is expected to be the limiting factor in measuring anisotropy.

Texas Tech University, Sean M. Burrows, August 8, 2009
68
Figure 5. 1 The error expected from photon shot noise as a function of detector signal.

Texas Tech University, Sean M. Burrows, August 8, 2009
69
3. Experimental
3.1. Dye Samples/Instrumental considerations. Mouse anti-human CD4 AlexaFluor 488 (here in referred to as anti-CD4 AlexaFluor
488 was purchased from Becton Dickinson. Fluorescein, Rhodamine 123 and Rhodamine
110 were purchased as solids from Sigma and used in the 30-100 pM solution range.
Phosphate buffer Saline (pH = 7.4), PBS, was used for all dilutions except fluorescein, which
used a phosphate solution buffered at pH 12, and was prepared in the laboratory from stock
acid. For all working dilutions, serial dilutions from the stock were prepared daily before
use. Samples were placed as droplets on microscope cover slips (170 µm) purchased from
VWR. Fluorescence exiting the pinhole is relayed to a polarizing beamsplitter, which
separates photons based on their orientation to the excitation beam's polarization (i.e. parallel
or perpendicular to the laser polarization). A 525 nm interference filter was placed before the
polarizing beamsplitter for Rhodamine 110, Fluorescein and Anti-CD4 AlexaFluor 488 and a
pair of 535 nm interference filters were placed after the polarizing beamsplitter and before
the detectors for Rhodamine 123.
4. Results
4.1. Distributions of Anisotropy in Low and High Viscosity Solutions Scatter plots and Histograms of anisotropy for rhodamine110 in low and high
viscosity solutions have been generated which are shown in Figure 5.2 and Figure 5.3,
respectively. Similar data were obtained for rhodamine 123 and fluorescein. As higher
threshold values, Ith, were chosen the anisotropy distributions narrowed. As a consequence
fewer molecules are also collected and averaged. Comparing full width half maximums of
Figure 5.2 the distribution only improves by approximately 0.1 arbitrary anisotropy units. A

Texas Tech University, Sean M. Burrows, August 8, 2009
70
Figure 5. 2 Histogram and Scatter plots of anisotropy for rhodamine 110 in PBS solvent at Ith > 10 (top) and Ith > 25 (bottom).
Texas Tech University, Sean M. Burrows, August 8, 2009
71
Figure 5. 3 Histogram and Scatter plots of anisotropy for rhodamine 110 in 50:50 PBS/glycerol solvent. (a) Fluorescence peaks not integrated at Ith > 20 (b) Ith > 35 and (c) fluorescence peaks integrated for Ith > 35.
a
b
c

Texas Tech University, Sean M. Burrows, August 8, 2009
72
similar result is obtained for Figure 5.3 with the more viscous solutions. More counts for
each fluorophore were observed in the more viscous solutions because they spent a longer
time diffusing through the probe volume. Figure 5.3b depicts the effects of integrating peaks
with in a 500 data point subset of the Ith > 35 data set. An improvement on anisotropy
distribution was slightly observed with an increase in the 0.25 anisotropy bin.
The influence of number of extracted peaks and threshold intensity on anisotropy was
demonstrated for rhodamine110, rhodamine123 and fluorescein. From Figure 5.4 it can be
seen that the number of molecules used to calculate anisotropy does not impact the mean
anisotropy value obtained for rhodamine 123, within the standard deviation, as depicted in
Figure 5.4. By extracting larger fluorescence peaks, the standard deviation narrows. This
can also be observed by plotting the anisotropy as a function of threshold intensity, see
Figure 5.5.
The standard deviation can be related to the widths of the anisotropy histograms. By
counting more molecules the distribution should not be effected because the standard
deviation remains constant at a given threshold. Thus the number of molecules counted
plays a small role on the anisotropy distribution width.
The standard deviation of anisotropy for rhodamine 110 in low and high viscosity
solutions as a function of threshold value is shown in Figure 5.6. The standard deviation
decreases dramatically at higher and higher thresholds. This demonstrates a decrease in the
error and shot noise of measurements at higher thresholds. This figure also depicts that at
higher anisotropies the standard deviation is also higher. If the low viscosity anisotropies are
extrapolated to the high anisotropy values the standard deviation converges at high threshold
values. At high thresholds again the shot noise is less important and does not impact the

Texas Tech University, Sean M. Burrows, August 8, 2009
73
Figure 5. 4 Anisotropy as a function of number of molecules for minimum and maximum threshold of rhodamine 123 in PBS (top) and 5050 PBS/glycerol mixture (bottom).

Texas Tech University, Sean M. Burrows, August 8, 2009
74
Figure 5. 5 Anisotropy as a function of threshold for rhodamine 123 in 50:50 PBS/glycerol and PBS.

Texas Tech University, Sean M. Burrows, August 8, 2009
75
Figure 5. 6 Rhodamine 110 in PBS and 5050 PBS/glycerol. Standard deviation as a function of threshold value.

Texas Tech University, Sean M. Burrows, August 8, 2009
76
standard deviation as much as it does at low fluorescent count levels. These results agree
well with the trend in our calculations (Figure 5.1).
4.2. Mixtures of Low and High Anisotropy Systems The anti-CD4 AlexaFluor 488 is a large molecule with a slow rotation that showed a
similar dependence on the photon count threshold value as the other fluorophores presented
in this report. It can be seen from Figure 5.7 how the anisotropy distribution from a mixture
of anti-CD4 AlexaFluor 488 and fluorescein is very broad at low threshold but narrows at
higher thresholds. However, since fluorescein has such a weak signal no differentiation of
the two species can be made at these higher thresholds.
Figure 5.8 demonstrates the lack of fluorescein’s signal on calculated anisotropy at
higher threshold values. Since fluorescein does not generate signal at high thresholds, no
photons from fluorescein are detected and thus no differentiation between ACD4AF488 by
itself and a mixture of ACD4AF488 with fluorescein can be realized. This figure also
illustrates that the anisotropy of the mixture at high counts originates from the ACD4AF488
alone.
To observe a separation between low and high anisotropies rhodamine 110 was used
because it gives high signal counts. Figure 5.9 depicts the anisotropy histograms of free
rhodamine 110, anti-CD4 AlexaFluor 488 and a mixture of anti-CD4 AlexaFluor 488 with
rhodamine 110. Using high thresholds we see histograms with full width half maximums
(FWHM) of about 0.2 for the non-mixture. The mixture had a FWHM of about 0.6 owning
to the mixture of anisotropy values from each fluorophore. In this system the rhodamine110
signal was incorporated into the anisotropy measurement unlike the fluorescein signal.
Table 5.1 reveals how the mixture has a different anisotropy value from just
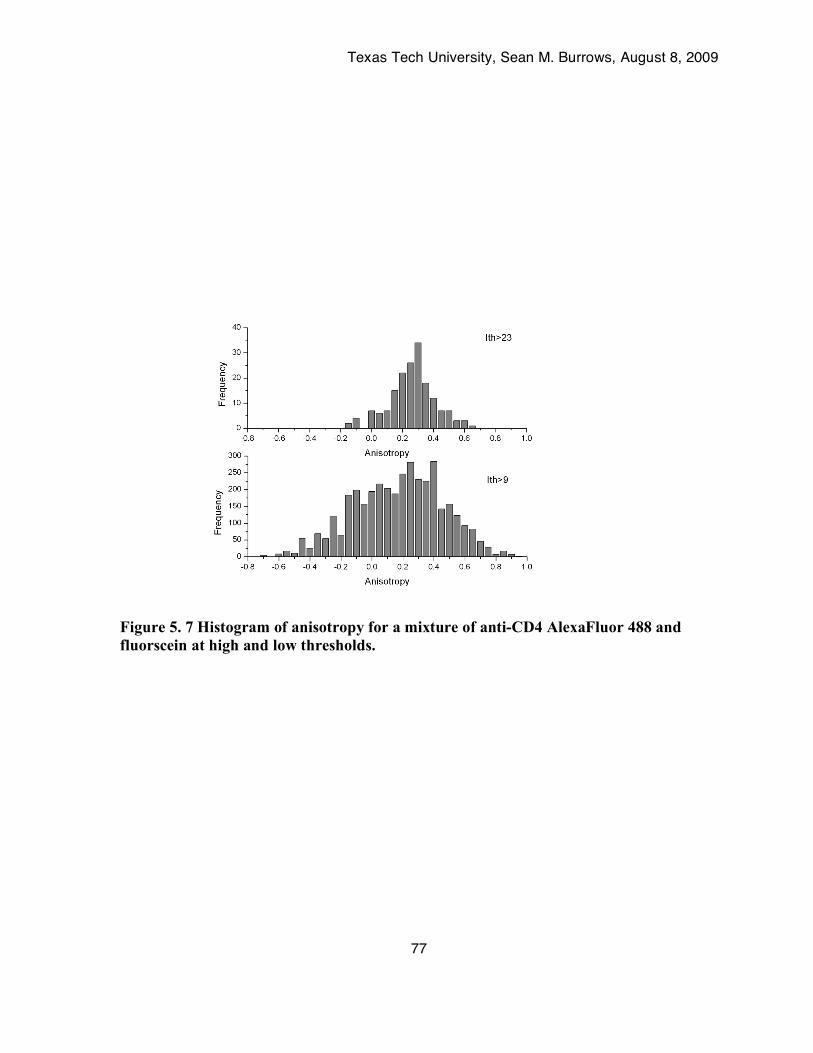
Texas Tech University, Sean M. Burrows, August 8, 2009
77
Figure 5. 7 Histogram of anisotropy for a mixture of anti-CD4 AlexaFluor 488 and fluorscein at high and low thresholds.
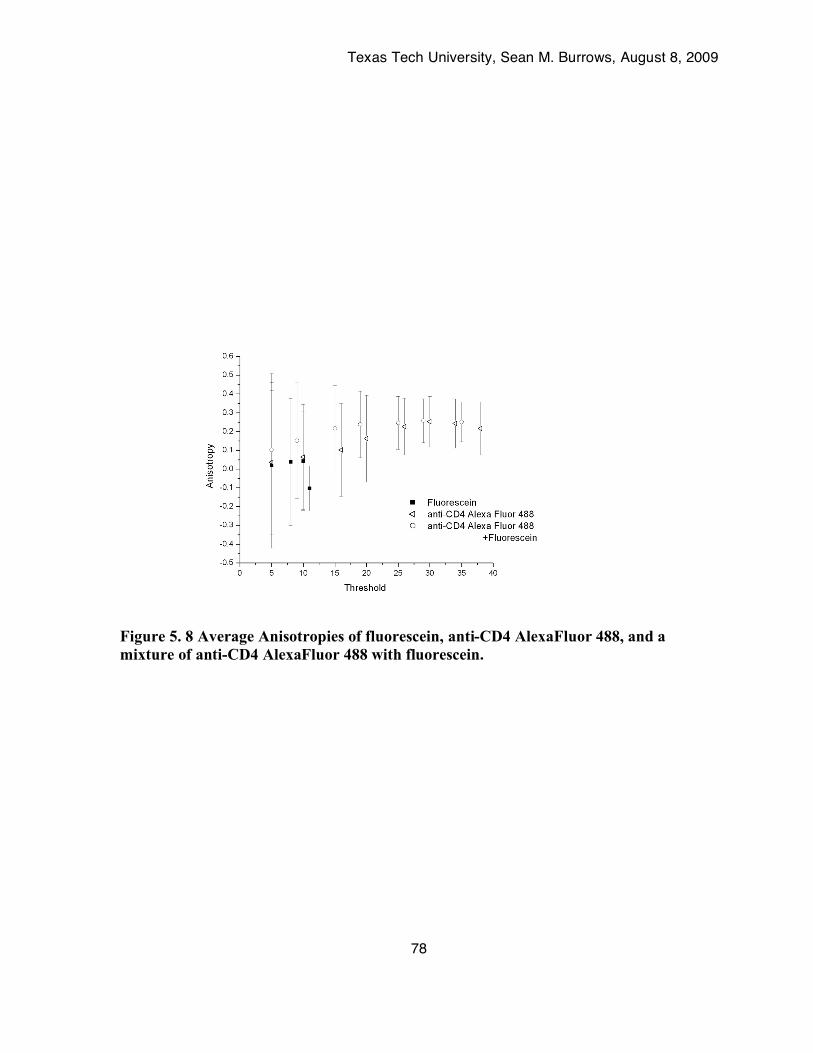
Texas Tech University, Sean M. Burrows, August 8, 2009
78
Figure 5. 8 Average Anisotropies of fluorescein, anti-CD4 AlexaFluor 488, and a mixture of anti-CD4 AlexaFluor 488 with fluorescein.
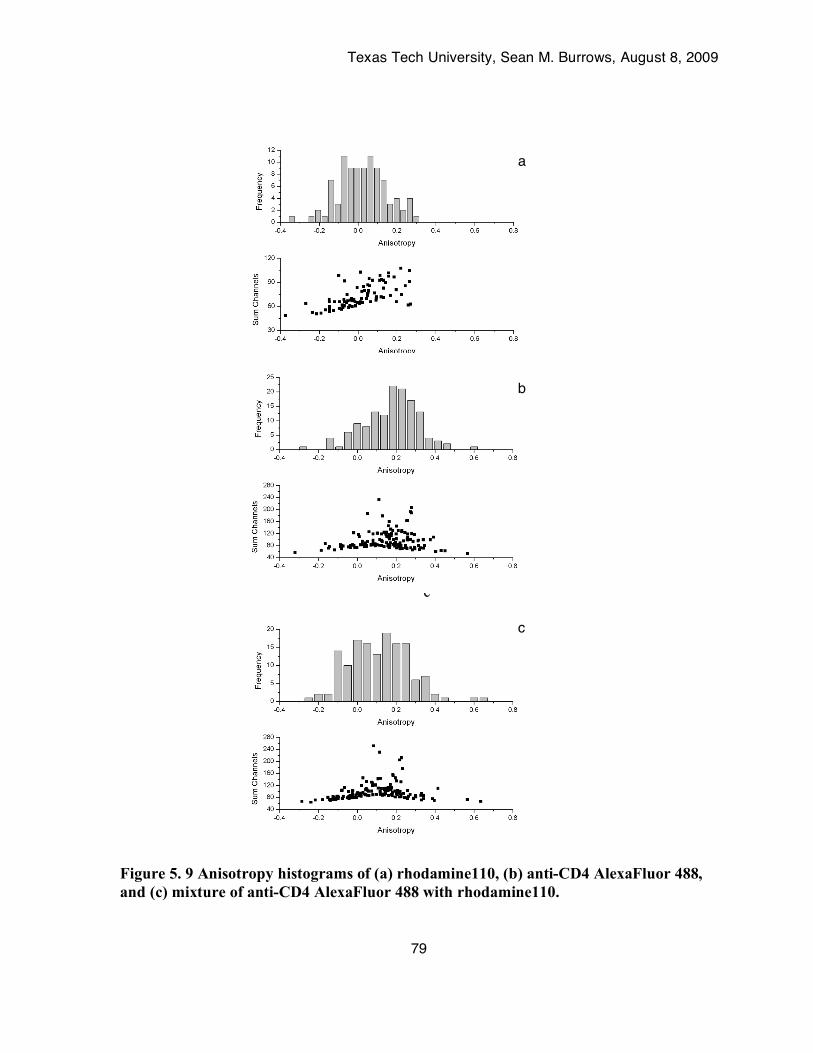
Texas Tech University, Sean M. Burrows, August 8, 2009
79
c
Figure 5. 9 Anisotropy histograms of (a) rhodamine110, (b) anti-CD4 AlexaFluor 488, and (c) mixture of anti-CD4 AlexaFluor 488 with rhodamine110.
a
b
c

Texas Tech University, Sean M. Burrows, August 8, 2009
80
Table 5. 1 Single molecule anisotropies of rhodamine110, ACD4AF488, and mixture of rhodamine110 with anti-CD4 AlexaFluor 488. Bulk anisotropy of the mixture as well.
Solution
Average Anisotropy
Standard Deviation Anisotropy
Threshold Value
20 pM Rhodamine 110
0.01
0.13
35
40 pM AntiCD4 AlexaFluor 488
0.15
0.14
40
40 pM AntiCD4 AlexaFluor 488 and 20 pM Rhodamine 110
0.09
0.16
45
400 pM AntiCD4 AlexaFluor 488 and 100 nM Rhodamine 110
-0.01
0.07
NA

Texas Tech University, Sean M. Burrows, August 8, 2009
81
rhodamine 110 and just ACD4AF488 anisotropy. This table also demonstrates the
advantages of single molecule detection over bulk measurements for anisotropy
measurements of mixtures. The bulk measurement of the mixtures gave an anisotropy of
zero. On the single molecule level, a difference between the anisotropies of rhodamine 110
and ACD4AF488 was observed. The mixture gave an intermediate value for the anisotropy
unlike the bulk measurement of the mixtures anisotropy.
5. Discussion Rhodamine 110 and 123 were used to obtain and observe the impact of photon shot
noise on anisotropy measurements. The high signal from these fluorophores allowed going
to high photon count thresholds and thus reduce the impact of photon shot noise on the
anisotropy distributions. Similar data for fluorescein did not give these results mainly due to
weak signal provided by fluorescein. Since the signal from fluorescein is low the photon
shot noise plays a crucial role impacting the anisotropy measurements. Fluorescein
anisotropy histograms were broad at all threshold values that did not exceed 15 counts and
the standard deviations of anisotropies were also high.
The shape of rhodamine 110 in 50:50 PBS/glycerol histogram was altered by
integrating, however not enough to make a significant difference. Integrating the peaks that
were already extracted with high counts did not affect the distribution much because the
impact of shot noise is lower at higher counts. The molecular counting error did not show
any impact on the anisotropy measurements. Since at high thresholds fewer and fewer
molecules are extracted one might suspect the error in the anisotropy measurement might be
impacted by the number of molecules used to calculate anisotropy. For each fluorophore it
was observed that there was no impact on the measured anisotropy due to counting error.

Texas Tech University, Sean M. Burrows, August 8, 2009
82
Histograms could be improved by counting more molecules thereby increasing the height of
anisotropy bins however this would require longer acquisition time and may not improve the
distribution width to any appreciable extent.
It can be observed from these scatter plots that the anisotropy values converge to a
central value. The shape and position of this convergence depends on the fluorescence
intensity as well as the G value, which corrects for detector response differences. The G
value is used to equate the intensities of the perpendicular and parallel channel. If G were
equal to 1 then when the signals were the same a zero anisotropy would be obtained and the
values would converge to zero for equal signals. If the G value is less than one then the
anisotropy that the values converge to will be shifted to values greater than zero but take on
the same shape as if G were unity.
Finally it is possible to use threshold values to reduce the standard deviation of
anisotropy measurements for anit-CD4 AlexaFluor 488 with two fluorophores, fluorescein
and rhodamine 110. Due to fluoresceins weak signal differentiation between anit-CD4
AlexaFluor 488 and fluorescein anisotropies could not be achieved at high thresholds. In fact
the measured anisotropy of the mixture was the same as just anit-CD4 AlexaFluor 488 by
itself because at high thresholds the signal from the fluorescein did not get incorporated into
the anisotropy measurement. With the intense signal from rhodamine110 an intermediate
anisotropy of the mixture was calculated and different from rhodamine 110 and ACD4AF488
by themselves.
6. Conclusion It has been demonstrated that by choosing large thresholds the error associated with
shot noise can be diminished. Even though fewer molecules are being counted the

Texas Tech University, Sean M. Burrows, August 8, 2009
83
anisotropy measurement is not altered. It was shown that the anisotropy measured was the
same whether ten or a thousand molecules were counted. It was observed that higher
anisotropy measurements had larger standard deviations that converged with lower
anisotropy standard deviations at high count thresholds.
Differentiation of anisotropies of two species in a mixture was achieved for a
rhodamine 110 and anti-CD4 AlexaFluor 488 mixture. The histograms are still rather broad
and not well resolved due to other sources of error besides the diminished shot noise error. It
is important to note also that the bulk anisotropy measurement of the mixture gives a zero
anisotropy while the single molecule anisotropy measurement gives an intermediate value
between the anisotropies of the fluorophores by themselves. Future work will focus on
resolution of high and low anisotropies as well as applications to molecular binding studies.
Texas Tech University, Sean M. Burrows, August 8, 2009
84
7. References 1. T. D. Perroud, B. Huang, and R. N. Zare, Chem. Phys. Chem. 6, 905 (2005). 2. T. D. Perroud, B. Huang, M. I. Wallace, and R. N. Zare, Chem. Phys. Chem. 4, 1121 (2003). 3. B. Huang, T. D. Perroud, and R. N. Zare, Chem. Phys. Chem. 5, 1523 (2004). 4. J. Enderlein, D. L. Robbins, W. P. Ambrose, P. M. Goodwin, and R. A. Keller, Bioimaging 5, 88 (1997). 5. E. Nir, X Michalet, K. M. Hamadani, T. A. Laurence, D. Neuhauser, Y. Kovchegov, and S. Weiss, J. Phys. Chem. B 110, 22103 (2006). 6. M. Antonik, S. Felekyan, A. Gaiduk, and C. A. M. Seidel, J. Phys. Chem. B. 110, 6970 (2006).
7. J. Schaffer, A. Volkmer, C. Eggeling, V. Subramaniam, G. Striker, and C.A.M. Seidel, J. Phys. Chem. A. 103, 331 (1999).
8. M. Collini, L. D’Alfonso, G. Baldini, A. Oldani, L. Cellai, C. Giordano, F. Barone, F. Mazzei, and G. Chirico, Appl. Spectrosc. 58, 160 (2004). 9. J. Schaffer, A. Volkmer, C. Eggeling, V. Subramaniam, G. Striker, and C. A. M. Seidel, J. Phys. Chem. A 103, 331 (1999). 10. J. R. Fried, L. Brand, C. Eggeling, M. Kollner, and C.A.M. Seidel, J. Phys. Chem. A 102, 6601 (1998). 11. J.R. Lakowicz, Principles of Fluorescence Spectroscopy, Kluwer, New York, 1999. 12. T. Ha, T. A. Laurence, D. S. Chemla, and S. Weiss, J. Phys. Chem. 103, 6839 (1999). 13. M. Koshioka, K. Sasaki, and T. Masuhara, Appl. Spectrosc. 49, 224 (1995).
14. J.R. Lakowicz, Principles of Fluorescence Spectroscopy, Kluwer, New York, 1999.
15. T. Ha, T. A. Laurence, D. S. Chemla, and S. Weiss, J. Phys. Chem. 103, 6839 (1999).
Texas Tech University, Sean M. Burrows, August 8, 2009
85
Chapter VI
Measuring Complexation by Single Molecule Fluorescence Anisotropy
S. M. Burrows, and D. Pappas, Analyst, 133, 870 (2008).
1. Introduction Studying molecular complexation on the single molecule level provides a new
approach to explore molecular interactions that are obscured on the bulk (ensemble) level.
Fluorescence anisotropy has been used on the ensemble level to investigate chiral
systems1,2,3,4, protein-protein interactions5,6, immunoassays7 and enantiomeric separations8,9.
Single molecule spectroscopic techniques to probe molecular interactions have been
reviewed recently10,11. Of the various methods used to monitor molecular interactions,
Förster Resonance Energy Transfer (FRET) is a popular tool for studies at the single
molecule level. FRET reveals interesting observations such as multi-molecular states of an
enzyme as a target molecule binds12. However, FRET techniques require that both the target
and probe are each labeled with a different fluorophore, which is not always feasible in
complex systems. Fluorescence anisotropy is demonstrated as a method for elucidating
single-molecule interactions with only a single labeled probe. Unlike ensemble anisotropy
measurements, single molecule fluorescence anisotropy yields mixed populations of both
free and bound probes in solution, each with their own distinctive anisotropy.
Seidal13 et. al. have shown that single molecule detection can be used with a pulsed
laser for burst integrated fluorescence lifetime (BIFL) detection to simultaneously register
fluorescence intensity, lifetime and anisotropy. We employ steady-state anisotropy
measurements to observe molecular complexes. In this approach, small fluorescent probe
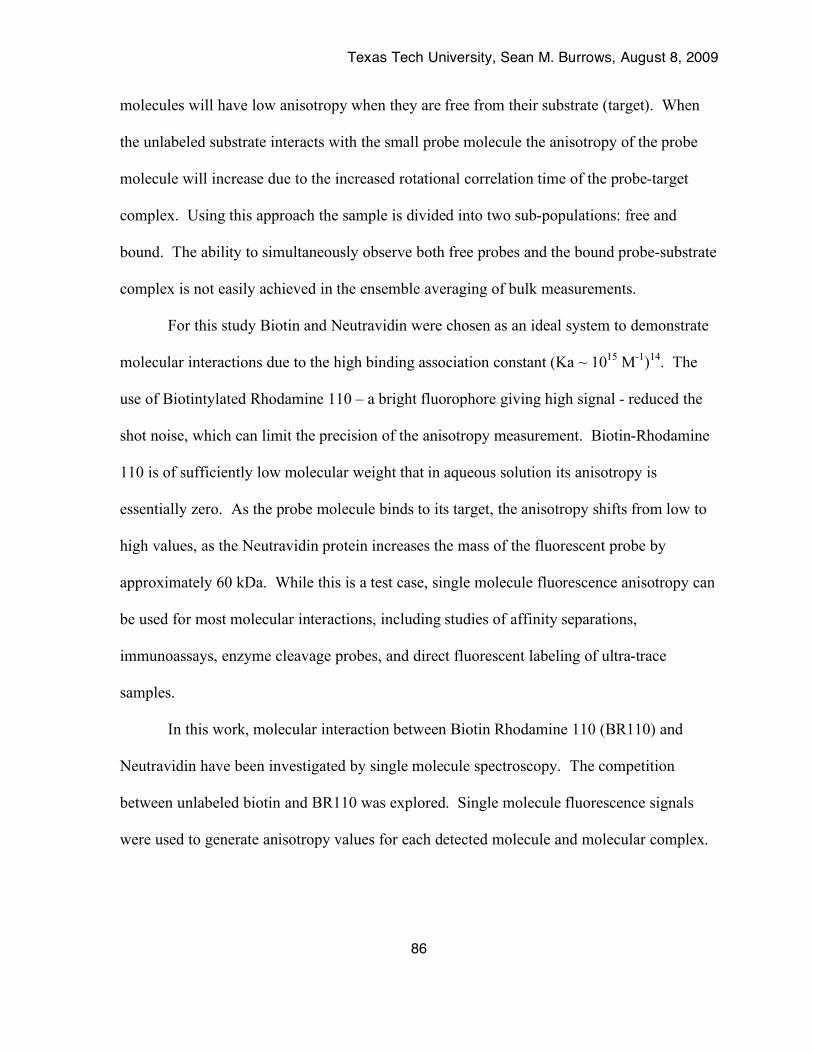
Texas Tech University, Sean M. Burrows, August 8, 2009
86
molecules will have low anisotropy when they are free from their substrate (target). When
the unlabeled substrate interacts with the small probe molecule the anisotropy of the probe
molecule will increase due to the increased rotational correlation time of the probe-target
complex. Using this approach the sample is divided into two sub-populations: free and
bound. The ability to simultaneously observe both free probes and the bound probe-substrate
complex is not easily achieved in the ensemble averaging of bulk measurements.
For this study Biotin and Neutravidin were chosen as an ideal system to demonstrate
molecular interactions due to the high binding association constant (Ka ~ 1015 M-1)14. The
use of Biotintylated Rhodamine 110 – a bright fluorophore giving high signal - reduced the
shot noise, which can limit the precision of the anisotropy measurement. Biotin-Rhodamine
110 is of sufficiently low molecular weight that in aqueous solution its anisotropy is
essentially zero. As the probe molecule binds to its target, the anisotropy shifts from low to
high values, as the Neutravidin protein increases the mass of the fluorescent probe by
approximately 60 kDa. While this is a test case, single molecule fluorescence anisotropy can
be used for most molecular interactions, including studies of affinity separations,
immunoassays, enzyme cleavage probes, and direct fluorescent labeling of ultra-trace
samples.
In this work, molecular interaction between Biotin Rhodamine 110 (BR110) and
Neutravidin have been investigated by single molecule spectroscopy. The competition
between unlabeled biotin and BR110 was explored. Single molecule fluorescence signals
were used to generate anisotropy values for each detected molecule and molecular complex.

Texas Tech University, Sean M. Burrows, August 8, 2009
87
2. Results and Discussion Figure 6.1a depicts the anisotropy histogram of a sample of 300 pM BR110. The
width of the anisotropy histogram is dictated by the photon shot noise of the system. In the
absence of the target protein, the low molecular weight probe is expected to have a near-zero
anisotropy. However, two populations are distinctly observed, with the smaller population of
about 35 molecules near 0.2 anisotropy units. We obtained the number of molecules in this
small population by counting the number of molecules with anisotropy values strictly greater
than 0.1 and less than or equal to 0.4 arbitrary anisotropy units. This second population is
consistent across all anisotropy measurements of BR110 solutions. This second, higher
anisotropy population will be discussed below. To compare against ensemble measurements
we measured the anisotropy of 30 nM biotin rhodamine 110 to be 0.0120 ± 0.035. Our single
molecule anisotropy measurements have a population centered on an anisotropy value of -
0.05. Negative values arise largely from photon shot noise. When Neutravidin is added so
that the final solution is 300 pM BR110 and 75 pM Neutravidin, there is a shift in the
anisotropy distribution, where more high-anisotropy (r = 0.3) molecules are detected (Figure
6.1b). This is evidence that complexation is occurring. What is interesting; however, is that
not all of the BR110 probe is complexed to Neutravidin. These two populations, it should be
noted, would yield an intermediate anisotropy value in ensemble measurements, rather than
two distinct binding states. Ensemble measurements of the 30nM biotin rhodamine 110 and
7.5nM Neutravidin yielded an anisotropy of -0.007±0.029.
When an excess of Neutravidin is added (Figure 6.1c), a greater shift in the
anisotropy histogram is observed. When the solution is adjusted so that 300 pM of BR110
probe is mixed with 3 nM of Neutravidin, approximately 242 probe molecules show a high
Texas Tech University, Sean M. Burrows, August 8, 2009
88
(a) (b)
(c) (d) Figure 6. 1 Distributions of single molecule probes by fluorescence anisotropy. In the absence of the target protein, the probe (300 pM biotin-rhodamine 110) shows a low anisotropy (a). When the target protein is added (75 pM Neutravidin), the anisotropy of some of the probes shifts to higher values, and two populations are observed (b). In the presence of a 10x excess of target, most of the probe molecules are complexed (c). When a 10x excess of unlabeled probe is added, the fluorescent-probe complex is disrupted (d).

Texas Tech University, Sean M. Burrows, August 8, 2009
89
anisotropy, with only about 45 of the probes uncomplexed. An ensemble anisotropy
measurement yields an anisotropy of 0.132 ± 0.032 for a 30 nM biotin rhodamine110 and
300 nM Neutravidin. This is different from the single molecule anisotropy distribution that
is centered around 0.3 and 0.25 anisotropy units, for Figure 6.1b and 6.1c respectively. The
value of 0.25 is consistent with the expected anisotropy value for a 60 kDa protein bound to a
fluorophore with a fluorescence lifetime of 5 ns. Since we were unable to obtain a
fundamental anisotropy for Neutravidin, we resorted to the fundamental anisotropy of
avidin15. Avidin, a 62 kDa protein with a rotational correlation time of 24.2 ns has an
intrinsic anisotropy of 0.278. The rotational correlation time is calculated using the molar
mass, specific volume and hydration of the protein. The rotational correlation time is derived
from the Debye-Stokes-Einstein. The rotational correlation time equation can be re-written
as a function of viscosity, temperature, ideal gas constant, molar mass, specific volume and
hydration of the protein. For most proteins a specific volume of 0.73 ml/g and a hydration of
0.23 g H2O per gram protein can be used to calculate rotational correlation times. There is
only a 2 kDa difference in molecular weight so the expected anisotropy value we calculate
for Avidin should be close to that of Neutravidin. Using the fundamental anisotropy and
rotational correlation time for Avidin we expect a measured anisotropy of 0.23. This value is
similar to the distribution in Figure 6.1c that is centered on about 0.25. However, Figure
6.1b has the anisotropy distribution centered on about 0.3 arbitrary anisotropy units. In this
case the expected anisotropy is less than the observed anisotropy by about 24 %. We can
attribute a part of this difference to the fluorescence threshold count above which to extract
molecules from raw data. Photon counts impact the error associated with the anisotropy
measurement due to photon shot noise. Despite the high binding constant of Neutravidin and
Texas Tech University, Sean M. Burrows, August 8, 2009
90
biotin, it appears that a stoichiometric match (4 Biotin : 1 Neutravidin) did not yield complete
binding of the probe molecules. Single molecule fluorescence anisotropy can therefore be
used to ascertain the nature of an affinity binding event for a variety of analyses. This
method can also be used to observe heterogeneities in the system, such as the apparently
larger anisotropy of Biotinylated Rhodamine 110 probes detected in free BR110 solutions
(Figure 6.1a). In the case of Figure 6.1a there are two populations, one centered on an
anisotropy value around -0.05 and one around 0.2. The error imparted from shot noise for
both cases is around 0.1 arbitrary anisotropy units. This suggests that the populations do
indeed show heterogeneities in the system because the errors from the photon shot noise do
not overlap significantly, and are similar to the widths of the anisotropy distributions.
We have observed that when Neutravidin is added, there are rare events (not shown)
of high anisotropy (r = 0.2-0.4) with intensities that are 10-30 times greater than free BR110
probes. Since the intensity of these single molecule bursts is much higher than what is
theoretically possible for a single fluorophore, the likely cause is that some of the BR110
probe must exist as an aggregate. Another possibility is that the rhodamine 110 molecule,
which has two amine groups for conjugation, may occasionally have two biotin molecules
attached. In this case a single rhodamine 110 molecule could serve as a bridge to attach to
two Neutravidin molecules. In the rarest case (1 out of every 200-1000 detected molecules),
these bridges may form large molecular complexes, which could explain the high anisotropy
peaks of unusual intensity. This phenomenon cannot be fully detailed in this communication
and will be discussed in a future publication.
Single molecule fluorescence anisotropy can also be used to observe competitive
interactions. When an excess of unlabeled biotin (3 nM) is added to the system, the
Texas Tech University, Sean M. Burrows, August 8, 2009
91
anisotropy of the BR110 probe shifts back to near zero (Figure 6.1d). Single molecule
fluorescence anisotropy can therefore be used to observe not only binding events, but also
interactions where an unlabeled probe is released into free solution.
3. Conclusion Fluorescence anisotropy has been demonstrated as a method to observe single
molecular interactions with a single labeled fluorophore. By monitoring the polarization of
the detected fluorescence photons, a probe can be identified as either free or bound to its
target. Fluorophore-labeled Biotin was used as a probe for Neutravidin, and stoichiometric
mixtures of the two showed distinct populations of free and bound species that could not be
discerned in ensemble measurements. Competitive reactions could also be studied; adding
unlabeled probe (Biotin) resulted in the fluorescent probe (BR110) shifting to lower
anisotropy values. Finally, heterogeneities could be observed, as high- and low-anisotropy
species were detected in free Biotin-Rhodamine 110 solutions. We will investigate the
nature of these heterogeneities, and we will further develop this technique for elucidating
molecular interactions, in the future.
Texas Tech University, Sean M. Burrows, August 8, 2009
92
4. Reference 1. F. H. Billiot, M. E. McCarroll, E. J. Billiot, and I. M. Warner, Electrophoresis 25, 753 (2004). 2. I. W. Kimaru, Y. Xu, and M. E. McCarroll, Anal. Chem. 78, 8485 (2006). 3. Y. Xu, and M. E. McCarroll, J. Photochem. Photobiol. A: Chem. 178, 50 (2006). 4. Y. Xu, and M. E. McCarroll, J. Photochem. Photobiol. A: Chem. 187, 139 (2007). 5. T. Hey, G. Lipps, and G. Krauss, Biochemistry 40, 2901 (2001). 6. X. Fang, Z. Cao, T. Beck, and W. Tan, Anal. Chem. 73, 5752 (2001). 7. L. Tao, R. T. Kennedy, Anal. Chem. 68, 3899 (1996). 8. Y. Tanaka, N. Matsubara, and S. Terabe, Electrophoresis 15, 848 (1994). 9. Y. Tanaka, Y. and S. Terabe, Chromatographia 49, 489 (1999). 10. X. Michalet, S. Weiss, and M. Jäger, Chem. Rev. 106, 1785 (2006). 11. D. Pappas, S. M. Burrows, and R. D. Reif, TrAC: Trend. Anal. Chem. 26, 884 (2007). 12. R. Liu, D. Hu, X. Tan, and H. P. Lu, J. Am. Chem. Soc. 128, 10034 (2006). 13. J. Schaffer, A. Volkmer, C. Eggeling, V. Subramaniam, G. Striker, and C.A.M. Seidel, J. Phys. Chem. A 103, 331 (1999). 14. P. Vermette, T. Gengenbach, U. Divisekera, P. A. Kambouris, H. J. Griesser, and L. Meagher, J. Colloid Interf. Sci. 259, 13 (2003). 15. G. Mei, L. Pugliese, N. Rosato, L. Toma, M. Bolognesi, and A. Finazzi-Agro, J. Mol. Biol. 242, 559 (1994).

Texas Tech University, Sean M. Burrows, August 8, 2009
93
Chapter VII
Comparison of Methods to Classify and Quantify Free and Bound States of Complexes using Single Molecule Fluorescence
Anisotropy S. M. Burrows, and D. Pappas, Analyst, In Press.
1. Introduction Single molecule fluorescence anisotropy (SMFA) measurements have emerged as a
tool to study complexation of biomolecules1-7. Many bioanalytical assays occur on the bulk
(ensemble) level8-15. In most cases, these types of measurements are accurate and reflect the
true nature of individual molecular interactions. However, it is often desirable and necessary
to observe single interactions to obtain an accurate picture of a biological or chemical
system. Gaining insight into complex heterogeneous systems such as antigen-antibody,
enzyme-substrate and drug screening would enable more rational design of drugs or other
regulatory molecules. In an effort to better understand heterogeneous systems such as
molecular binding, single molecule fluorescence spectroscopy has emerged as a tool to better
elucidate how biological systems function under natural conditions.
As stated above, many approaches exist that employ ensemble measurements to study
the functionality of biological systems. While valuable, these tools obscure rare and random
events that single molecule spectroscopy can reveal. There are several single-molecule
fluorescence modalities for monitoring bimolecular interactions1, 16-23. Of these different
measurement approaches; SMFA is an attractive platform for monitoring protein-probe
binding. SMFA is particularly suited to small probes and larger targets (e.g. drug-protein
studies) and can simplify the detection scheme by utilizing one fluorophore as opposed to

Texas Tech University, Sean M. Burrows, August 8, 2009
94
employing two fluorophores as in Förster Resonance Energy Transfer (FRET)
measurements24. Lu and coworkers have employed FRET and SMFA on molecules
embedded in solid supports to observe protein-protein/enzyme substrate conformational
dynamics2-4, 25. Seidel5 has implemented probability distribution analysis to discern shot-
noise broadening from heterogeneities of anisotropy measurements. Another single molecule
technique employs alternating laser excitation fluorescence aided molecular sorting (ALEX-
FAMS) to observe and quantify complexation reactions26, 27. ALEX requires optics that
impart alternating pulses from two lasers with distinctly different wavelengths. Refer to
Kapanidis et. al.26 and section three of chapter one, of this text, for a more detailed
description of the ALEX technique. Typically FRET efficiencies are evaluated along with a
stoichiometric parameter S; which is a normalized ratio of fluorescence in the donor channel
to the total fluorescence from donor and acceptor.
Many variants of fluorescence correlation spectroscopy are being employed to
observe molecular interactions as well. A popular approach involves two color coincidence
detection that require pulsed laser excitation to probe complexation of dual labeled DNA
complexes28. This technique can be extended to triple color coincidence analysis of higher
order complexes29. Two color quantum dots30 have been used in-conjunction with
coincidence detection to observe two probes complex to a specific DNA target. Much of the
work that quantifies molecular complexation focuses on DNA complexes and requires
multiple labels as well as elaborate single molecule detection schemes. The work presented
herein focuses on the complexation of protein-probe systems. A single continuous wave
laser was used to monitor protein-probe interactions we circumvent the requirement of
overlapping two Gaussian laser beams to the same spot or using pulsed excitation. Instead of

Texas Tech University, Sean M. Burrows, August 8, 2009
95
using multiple labels, typically encountered for complexation analysis measurements, a
single fluorescent probe was used to interact with its corresponding protein.
SMFA has been used previously for the identification of molecules by multiparameter
single molecule fluorescence measurements6. FRET, anisotropy, burst size, fluorescence
lifetime and autocorrelation functions were used in concert to identify multiple compounds in
a heterogeneous mixture. In a preliminary study, SMFA as a stand-alone technique has been
demonstrated as a method to observe molecular binding and competition, elucidating
heterogeneities that could not be observed on the bulk scale7.
Fluorescence anisotropy is a measure of the amount of fluorescence emitted from a
molecule in the parallel and perpendicular planes of polarization with respect to the plane of
the excitation source electronic vector. The anisotropy is related to the molecular rotational
correlation time, the time it takes the initial anisotropy to decay to 1/e of its original value.
According to the Debye-Stokes-Einstein Equation31, the rotational correlation time is directly
proportional to viscosity and molar mass, while inversely proportional to temperature. Thus
a small molecule—such as a typical fluorescent probe—in aqueous solution at room
temperature will typically have a fluorescence lifetime that is longer than the rotational
correlation time, thereby depolarizing the fluorescence emission. A large molecule in water
at room temperature will have a fluorescence lifetime that is shorter than the rotational
correlation time, thereby polarizing the fluorescence emission resulting in a non-zero
anisotropy. Photon shot noise is the limiting factor in these measurements. Thus
fluorophores with high quantum yields, good photostability, and large absorption cross
sections are needed in order to enhance the signal and reduce the error in SMFA
measurements.

Texas Tech University, Sean M. Burrows, August 8, 2009
96
In this paper, the binding of a fluorescent Biotin probe to Neutravidin was used to
demonstrate the analytical capabilities of steady-state SMFA to quantify complexed and
uncomplexed probe molecules diffusing in solution. Neutravidin is tetravalent and has a
molecular weight of ~ 60 kDa32. Typically Neutravidin is used as a bridge between a surface
and a biotintylated antibody for performing immunoassays33, 34. Neutravidin shows low
nonspecific binding32 and has a high association affinity35 on the order of 1015 M-1.
The work by van der Valk et. al.36 demonstrated the ability to quantify the Biotin-
binding capacity of Streptavidin coated polypropylene PCR plates. Their work demonstrates
the typical use of ensemble fluorescence and absorbance techniques. They determined a
stoichiometric ratio of 4 Biotin molecules to 1 Streptavidin by two different methods. One
method employed the use of biotintylated fluorescein, which required pH 9.3. The other
method utilized biotintylated alkaline phosphatase and absorbance was monitored.
In this work, steady-state SMFA was used as a tool to study Biotin-Neutravidin
complexation. This work focuses on the measurement of steady-state anisotropy rather than
the evaluation of anisotropy decay dynamics. We have previously reported on the
observation of binding of a small probe to a large complexing agent by SMFA7. In the
present study, the Nb/Nt ratios of Biotin Rhodamine 110 (BR110) probe molecules alone, in
the presence of complexing agent, and then in the presence of unlabeled Biotin are described.
Steady-state SMFA investigations result in mixed populations of free and bound probe
molecules with distinct anisotropy values that are not observed in bulk observations. Ratios
of bound probe molecules to the total number of molecules sampled were calculated (Nb/Nt
ratio) by choosing anisotropy values (anisotropy gates) that correspond to free and
Neutravidin bound BR110. The concept of anisotropy gates will be elaborated on in the
Texas Tech University, Sean M. Burrows, August 8, 2009
97
experimental section. The effects on the Nb/Nt ratio when different fluorescent burst
extraction methods and one vs. two parameters to classify free and bond probe molecules
were compared. The effect of using different anisotropy gates in the data analysis procedure
was also investigated. Finally, analytical figures of merit such as the error in anisotropy and
the error in the Nb/Nt ratio are described.
2. Experimental
2.1. Chemicals and reagents Rhodamine 110 was purchased as solids from Sigma and a 5 nM solution was used to
obtain a G-factor that corrected for the difference in detector responses of the instrument (see
below). Sterile Phosphate Buffered Saline (PBS, pH = 7.4) was used for all dilutions. Biotin
Rhodamine 110 (BR110) was purchased from Biotium, Biotin was obtained from Sigma, and
Neutravidin was purchased from Pierce. For complexation experiments, BR110 and
Neutravidin were allowed to incubate for ~ 1 hr at 4 ºC at the desired concentration prior to
analysis. For the competition experiments BR110 and Neutravidin were allowed to
incubated for about an hour, then unlabeled Biotin was introduced to the Neutravidin-BR110
solution and incubated again for ~ 1hr at 4 ºC. All working solutions were prepared daily
before use. Blank solutions of PBS and Neutravidin in PBS were investigated to ensure they
did not give rise to false positive single molecule fluorescence signals. Samples were placed
as droplets on microscope cover slips (0.17 mm, VWR).
2.2. Signal detection and anisotropy measurements Output pulses from the APDs were counted by a high-speed acquisition board (6602,
National Instruments). Signal was recorded with a homemade LabView program.

Texas Tech University, Sean M. Burrows, August 8, 2009
98
Anisotropy from single molecule fluorescence bursts was calculated using the following
formula1, 21-23:
!
r =n||"Gn#
n||+G
2 "K
1+ K
$
% &
'
( ) n#
, (1)
where n|| and n⊥ are the detected photons in the parallel and perpendicular planes,
respectively. The term G is a correction factor when two detectors are used, to compensate
for differences in detector response, filter transmission, etc. The term K in the denominator
originates from the use of a high numerical aperture (NA) objective in the confocal
microscope37. At high NA, the planes of polarization of the excitation beam and the
collected fluorescence are mixed due to the high angles of incidence of the objective.
Without the correction term K, falsely low anisotropies are recorded for sufficiently large
numerical apertures such as that used in this study. This correction term is based on the
semi-angle of light collection and has been detailed elsewhere22, 23. From Equation 1 and our
experimental setup, a value of 0.28 has been calculated for K and the G value ranges from
0.7 to 0.99, as it was calculated each time an experiment was performed. The variation in the
G correction term resulted from changes in alignment and other experimental factors.
If the analyte fluorescence burst, in either channel, satisfied Equation 2
nanalyte = b + 3sb (2)
then it was considered statistically different from the baseline noise and was related to the
signal from a single fluorescent molecule. Here nanalyte is the analyte signal, b is the average
baseline signal, and sb is the standard deviation of the baseline signal.
The limit of detection (3sb) serves as the minimum threshold for fluorescent burst
detection. In this work, a threshold where fluorescent bursts from a single molecule would

Texas Tech University, Sean M. Burrows, August 8, 2009
99
be extracted if either the perpendicular or the parallel channel were strictly greater than the
limit of detection will be referred to as Method I. Extraction Method II selected fluorescent
bursts much greater than the limit of detection (~ 25 - 50 cpms) in either the perpendicular or
the parallel channel, the threshold was increased until approximately 150-200 fluorescent
bursts were obtained from each time trace.
Extraction Method III selected fluorescent bursts greater than the chosen value of n||
in the parallel channel and greater than the expected value of n⊥ in the perpendicular channel,
where n|| > n⊥. The values of n|| and n⊥ were increased until approximately 150-200
fluorescent bursts from single molecules were extracted. The following equation was used to
calculate the expected value of n⊥ from n|| :
n⊥ = (3)
where r is the maximum anisotropy, set to 0.4; k = 1.34 (k = [2-K]/[1+K]) and G, as
described for Equation 1. The threshold photon counts in the parallel and perpendicular
channel always satisfy Equation 2. Setting r = 0.4 in Equation 3 allowed for extraction of
fluorescent bursts that gave anisotropy values between 0.0 and 0.4 arbitrary units. Extraction
Method III was devised to help reduce the error imparted on the anisotropy distribution from
Raman and Rayleigh scatter. For visualization purposes, histograms of anisotropies were
generated to observe the molecular population under investigation. The impact of extraction
Methods I, II, and III on the Nb/Nt ratio for BR110 as a function of Neutravidin
concentration will be described below
Anisotropy gates were used to define the anisotropy value as corresponding to a
molecule that was free from or bound to Neutravidin. Molecules with anisotropy values
corresponding to free or bound species were extracted from a list of anisotropy values and
n||(1 - r) G(1 + kr)

Texas Tech University, Sean M. Burrows, August 8, 2009
100
quantified as Nf, number of free, or Nb, number of bound. A free BR110 molecule should
have an anisotropy around zero; however, anisotropy values observed for BR110 range from
-0.1 to 0.2 for free BR110 (see Results section). The number of free species was quantified
by extracting anisotropy values between -0.1 and 0.2. The expected experimental anisotropy
value for a Neutravidin bound BR110 is around 0.237, but the error from photon shot noise
varies depending on the photon counts used to calculate the anisotropy. For bound BR110,
the anisotropy gate was chosen to range from 0.2 to 0.5 arbitrary anisotropy units, based on
the distribution of anisotropy values observed for Neutravidin-BR110 solutions (data not
shown). An alternate anisotropy gate was investigated to determine the optimum anisotropy
gate to classify free and bound species and will be discussed below.
As described previously, the anisotropy gates were used to classify and quantify
molecules as free or bound. The total number of molecules Nt was the sum of Nf and Nb.
Finally the Nb/Nt ratio would be formulated by dividing the number of bound species, Nb,
by the total number of molecules, Nt. The number of bound and free species will depend on
the number of molecules extracted using the defined anisotropy gates. Extraction Method I
resulted in the largest Nt (15,000-50,000 molecules, typically about 25,000 were observed),
Nt was similar for Method II and III because both methods extracted 150-200 fluorescent
bursts from single molecules.
3. Results
3.1. Error in single molecule fluorescence anisotropy and classification of free and bound probe molecules There are several caveats to performing SMFA measurements on diffusing molecules.
First, the different diffusion coefficients of molecules imparts an error. This is because the

Texas Tech University, Sean M. Burrows, August 8, 2009
101
lighter molecules (free probe) can diffuse faster than the heavier ones (protein-probe
complexes), thus the lighter molecules have a greater probability of traversing the probe
volume more often than the heavier molecules. Secondly, shot noise from the fluorescence
signal is the major source of error in calculating anisotropy. The third source of error comes
from Raman scatter accompanying the fluorescence signal. Figure 7.1 plots the anisotropy
distribution as a function of parallel photon counts, n||, for Rhodamine 110; this form was not
Biotintylated. The number of molecules increases as the intensity changes from black to
white. Non-zero anisotropy values were observed when the distribution should be around
zero.
The anisotropy values in Figure 7.1 were determined by extracting fluorescent bursts
using Method III, n|| > 28 and n⊥ > 10, in total 172 fluorescent bursts from single molecules
where extracted. In Figure 7.1 ~ 57 % of the fluorescent bursts from single molecules exhibit
anisotropy values from -0.1 to 0.1 for Rhodamine 110. Anisotropy values outside the range -
0.1 to 0.1 represent the error associated with SMFA measurements. Since we were
performing steady-state measurements we were unable to determine the contribution of
Raman scatter in the fluorescence signal similar to an approach by Seidel and co-workers1.
Seidel used a pulsed laser that enabled them to determine contributions from Raman scatter.
Since steady-state anisotropy measurements were made, the fluorescence signal was baseline
subtracted in order to attenuate contributions from Raman scatter.
By measuring the brightness and concentration of single molecules Gopich studied
the effect of single vs. multiple molecule observations38. At high concentrations and
molecular brightness the chance of multiple molecules in the probe volume increases. This
was observed by loss of distinct FRET efficiency distributions at high concentrations and

Texas Tech University, Sean M. Burrows, August 8, 2009
102
Figure 7. 1 Anisotropy of 300 pM Rhodamine 110 in Phosphate Buffered Saline as a function of parallel counts (n parallel, n||). Fluorescent bursts greater than 28 in the parallel channel and greater than 10 in the perpendicular channel were extracted (extraction Method III), 172 fluorescent bursts from single molecules were obtained. An Anisotropy value outside the anisotropy range -0.1 to 0.1 arbitrary anisotropy units demonstrates the error in anisotropy measurements. The number of molecules increases as the color changes from black to white.

Texas Tech University, Sean M. Burrows, August 8, 2009
103
molecular brightness. According to Gopich, the signal histograms should change shape as
concentration increases if multiple molecules occupy the probe volume. The optimal
working concentration for BR110 in this work was chosen from examination of 25 pM to
300 pM. Figure 7.2 shows the impact of increasing BR110 concentration on the anisotropy
distribution. It can be seen that in each case the distribution ranges from -0.1 to 0.5, with
approximately half the molecules exhibiting anisotropy values between 0.0 and 0.2
anisotropy units. The peak heights were similar from 75 pM to 300 pM, on the order of 25
cpms to 35 cpms, except as the concentration increases the number of fluorescent bursts from
single molecules detected increases, as would be expected. Multiple occupancies are a
minimal source of error in the present work because the peak heights did not increase as
concentration increased, the anisotropy histograms did not change shape from 25 pM to 300
pM BR110 (see Figure 7.2), and Poisson statistics predicts, for our system, that
concentrations below 1 nM are acceptable for single molecule detection.
We chose to work with 300 pM BR110 because using extraction method III allowed
extraction of approximately 150-200 moleulces with fluorescent burst greater than 25 cpms,
which were subsequently baseline subtracted. The average Nb/Nt ratio from Figure 7.2A to
Figure 7.2D was 0.27 ± 0.04, just the anisotropy was used to classify free and bound BR110
molecules. Another reason for performing experiments at 300 pM BR110 was due to its low
Nb/Nt ratio, 0.23 ± 0.04, with respect to the Nb/Nt ratio obtained for the other BR110
concentrations investigated.
3.2. Methods to extract and quantify fluorescent bursts from single molecules This work compares three methods (Methods I-III) for extracting fluorescent bursts
from single molecules from ten-minute time traces. From each extraction method a

Texas Tech University, Sean M. Burrows, August 8, 2009
104
Figure 7. 2 The anisotropy as a function of parallel counts for: (A) 25 pM BR110, (B) 75 pM BR110, (C) 150 pM BR110 and (D) 300 pM BR110. This figure shows the similarity in anisotropy distributions for various concentrations of BR110. The 300 pM BR110 had the lowest Nb/Nt ratio of 0.23 ± 0.04 (just anisotropy gates were used to classify molecules). The number of molecules increases as the color changes from black to white.
A B
C D

Texas Tech University, Sean M. Burrows, August 8, 2009
105
comparison of one vs. two parameter classification of free and bound probe molecules was
performed. The two parameters investigated were anisotropy gates and the difference
between parallel and perpendicular photon counts, Δn. BR110-Neutravidin should have an
anisotropy value of ~ 0.237. With parallel photon counts ranging from 25 to 50 cpms the
error associated with the anisotropy ranges from ~ 0.13 to ~ 0.08, respectively. The Nb/Nt
ratios obtained using anisotropy gates -0.1 ≤ r < 0.2, free probe, and 0.2 ≤ r ≤ 0.5, bound
probe, were compared to the following anisotropy gates: -0.2 ≤ r < 0.1, free probe, and 0.1 ≤
r ≤ 0.4, bound probe molecules.
Figure 7.3 compares plots of the Nb/Nt ratio as a function of increasing Neutravidin
concentration. One and two parameter classification of free and bound probe molecules as
well as different fluorescent burst extraction methods were compared in Figure 7.3 . In the
one parameter case (Figure 7.3A, 7.3C, and 7.3E) the anisotropy gates -0.1 ≤ r < 0.2, free
probe, and 0.2 ≤ r ≤ 0.5, bound probe were used. In the two-parameter case the anisotropy
gate -0.1 ≤ r < 0.2, free probe, and 0.2 ≤ r ≤ 0.5, bound probe and the difference in the photon
counts in the parallel and perpendicular channel, ∆n, were used to classify molecules as free
or bound (Figure 7.3B, 7.3D, and 7.3F). The ∆n value corresponding to free and bound
probe molecules was determined by comparing histograms of Δn values for 0 pM
Neutravidin-300 pM BR110 to that of a solution containing Neutravidin and 300 pM BR110
(data not shown). The ∆n value can be expressed as a function of n||, r and k with the
following formula:
∆n = (4) (1 + k·r) r·n|| (1 + k)

Texas Tech University, Sean M. Burrows, August 8, 2009
106
Figure 7. 3 Nb/Nt ratio of 300 pM BR110 as a function of Neutravidin concentration. This figure demonstrates the impact on the Nb/Nt ratio for three different methods of extracting fluorescent bursts form single molecules. See text for a detailed description of the figure.
A
C D
B
E F

Texas Tech University, Sean M. Burrows, August 8, 2009
107
If we set the anisotropy value to 0.2 and k to 1.34 in Equation 4 then we obtain Equation 5
where ∆n is a function of n||:
∆n = 0.37⋅n|| (5)
The value of 0.2 was chosen as the cutoff anisotropy value between species defined as free or
bound. This value was chosen because, as described below, the anisotropy value of BR110
bound to Neutravidin should be around 0.25 arbitrary anisotropy units. Due to the error in
anisotropy we chose a cutoff anisotropy value of 0.2 rather than 0.25 arbitrary anisotropy
units.
Figure 7.3 was prepared by combining the Nb/Nt ratios obtained from three different
experiments. Each experiment used a different Δn value because the approximate parallel
photon count for extraction of fluorescent bursts varied from 25 to 40 cpms from experiment
to experiment. The fluctuation in approximate parallel photon count rates resulted from
adjustment of the alignment for optimal performance before each experiment. For each
experiment the Δn value was determined based on differences in histograms from solutions
with and without Neutravidin (data not shown). The ∆n value from Equation 5 matches the
∆n value determined by comparing histograms of ∆n. Choosing a Δn value by comparing
histograms of ∆n values for solutions with and without Neutravidin to classify anisotropy
values as free or bound led to good reproducibility of the Nb/Nt ratio between experiments
with different photon count rates. In Figure 7.3 the Nb/Nt ratio for 0 pM and 1.2 nM
Neutravidin were determined from an averaging of data from the different experiments that
had overlapping data points. The error related to the Nb/Nt ratio for all other Neutravidin
concentrations was determined from the error associated with counting.
Based on the plot of the Nb/Nt ratio in Figure 7.3A and 7.3B, extraction Method I
Texas Tech University, Sean M. Burrows, August 8, 2009
108
does not demonstrate the ability to obtain quantitative results about the extent of binding. In
Figure 7.3C and 7.3D a plateau in the Nb/Nt ratio was observed to originate at 75 pM and 55
pM Neutravidin, respectively, and persisted until 300 pM Neutravidin. The Nb/Nt ratio for
95 pM Neutravidin was obtained in an experiment separate from the 75 pM and 150 pM
Neutravidin. From a reproducibility stand point one would expect that the 95 pM
Neutravidin would have an Nb/Nt ratio that was comparable to the Nb/Nt ratio at 75 pM and
150 pM Neutravidin; however, this was not observed for the one-parameter classification. In
Fig. 4C the Nb/Nt ratio for 75 pM and 150 pM Neutravidin was 0.34 ± 0.06 and 0.35 ± 0.06,
respectively. For the one parameter case (Figure 7.3C) the Nb/Nt ratio at 95 pM Neutravidin
was 0.24 ± 0.05. When the two parameter classification was used the Nb/Nt ratio for 95 pM
Neutravidin was 0.33 ± 0.07, and this was in agreement with the Nb/Nt ratio for 75 pM and
150 pM Neutravidin (see Figure 7.3D). In Fig. 4E and 4F the plateau started at 50 pM
Neutravidin. This time the Nb/Nt ratio for 55 pM and 95 pM Neutravidin in the one
parameter case did not agree with the Nb/Nt ratio for 75 pM and 150 pM Neutravidin (see
Figure 7.3E and 7.3F). When two parameters were used the Nb/Nt ratios appear to be more
reproducible, within the error. The two-parameter classification was chosen to compare
Method I, II and III.
For Figure 7.3D the Nb/Nt ratio reached a plateau of ~ 0.35 at 55 pM Neutravidin and
started to increase at 1.8 nM Neutravidin and reached a value of 0.61 ± 0.09 at 3 nM
Neutravidin. The Nb/Nt ratio for 1.2 nM Neutravidin was determined by averaging the
Nb/Nt ratio from two experiments with overlapping data points. The error in the Nb/Nt ratio
of 1.2 nM Neutravidin was large because the values of Nb/Nt were different and obviously
the reproducibility was poor when using extraction Method II.

Texas Tech University, Sean M. Burrows, August 8, 2009
109
In Figure 7.3F the Nb/Nt ratio increased from 0.25 ± 0.07 (N=3), for 0 pM
Neutravidin, to ~ 0.45 at 50 pM Neutravidin. The Nb/Nt ratio increased to 0.59 ± 0.09 (N=1)
at 75 pM Neutravidin (at this point there is a stoichiometric match between the number of
BR110 probes and the binding sites of Neutravidin). Within the error, an Nb/Nt ratio of ~
0.55 was observed for the concentration range 75 pM to 1.2 nM Neutravidin, until it
increased to 0.59 ± 0.10 at 1.8 nM Neutravidin. When 3.0 nM Neutravidin was added to 300
pM BR110 the Nb/Nt ratio increased further to 0.81 ± 0.10. The reason for this increase may
be due to free BR110 probe molecules in solution since not all the BR110 probe molecules
were complexed by Neutravidin. The BR110 molecules that were uncomplexed for lower
concentrations of Neutravidin became complexed once a ten-fold excess of Neutravidin was
added. The bulk measurements (3 nM BR110 with 30 nM Neutravidin) confirm that not all
BR110 probe molecules complex Neutravidin because the observed anisotropy was ~ 0.13,
which is lower than the expected value of ~ 0.23; the incomplete binding will be discussed in
more detail below.
Table 7.1 compares Method I, II and III using the two parameter classification by
evaluating the Nb/Nt ratio for 75 pM Neutravidin, percent misclassification of bound species
in the 0 pM Neutravidin case and the percent bound species for 75 pM Neutravidin (data
from Figure 7.3B, 7.3D and 7.3F). In Method II for the 75 pM Neutravidin case the Nb/Nt
ratio was 0.32 ± 0.05 (N=1), at the 95% confidence interval this value was statistically
different from the Nb/Nt ratio of 0.15 ± 0.02 (N=3) for 0 pM Neutravidin. For Method III at
the 90 % confidence level the difference in the Nb/Nt ratios for 0 pM and 75 pM Neutravidin
were statistically different. Method II had a 15 ± 2 % misclassification of bound species for
the 0 pM Neutravidin case; according to our calculations 27 ± 5% of the

Texas Tech University, Sean M. Burrows, August 8, 2009
110
Table 7. 1 For the complexation of 300 pM BR110 with 75 pM Neutravidin, Method I, II and III were compared by evaluating the Nb/Nt ratio for 75 pM Neutravidin, percent misclassification of bound species in the 0 pM Neutravidin case, and the percent bound for 75 pM Neutravidin for the data in Figure 4. Two parameter classification was used to quantify free and Neutravidin bound BR110.
Method Nb/Nt
75 pM Neutravidin
(N=1)
% misclassified
(from 0 pM Neutravidin)
(N=3)
% bound
75 pM Neutravidin
I 0.37 ± 0.02 24 ± 13 % 28 ± 5 %
II 0.32 ± 0.05 15 ± 2 % 27 ± 5 %
III 0.59 ± 0.09 25 ± 7 % 44 ± 9 %
Texas Tech University, Sean M. Burrows, August 8, 2009
111
molecules were bound at 75 pM Neutravidin. In Method III at 75 pM Neutravidin 44 ± 9 %
of BR110 molecules were bound to Neutravidin, considering the 25 ± 7 % misclassification.
Even though the percent bound of method III is higher than the percent bound for method II,
they are comparable, within the error. Method II and III were used to investigate the
competition of unlabeled Biotin with BR110.
The impact of changing the anisotropy gate on the observed Nb/Nt ratio for each
extraction method was investigated (data not shown). The alternate anisotropy gate was -0.2
≤ r < 0.1, for free probe, and 0.1 ≤ r ≤ 0.4, for bound probe. The Nb/Nt ratio for 0 pM
Neutravidin was ~ 0.65, this value was substantially worse than the Nb/Nt ratio obtained for
the same solution with the anisotropy gate: -0.1 ≤ r < 0.2, for free probe, and 0.2 ≤ r ≤ 0.5,
bound probe. The difference between the Nb/Nt ratio for solutions with and without
Neutravidin was difficult to observe when the anisotropy gate was -0.2 ≤ r < 0.1, for free
probe, and 0.1 ≤ r ≤ 0.4, for bound probe. Thus the anisotropy gate: -0.1 ≤ r < 0.2, for free
probe, and 0.2 ≤ r ≤ 0.5, for bound probe; was the optimum anisotropy gate for quantifying
free and bound probe molecules.
3.3. Biotin competition with BR110 for Neutravidin Extraction Method II and Method III along with the two-parameter classification was
used to examine the competition between Biotin and BR110. Anisotropy gates: -0.1 ≤ r <
0.2, for free probe, and 0.2 ≤ r ≤ 0.5, for bound probe along with the difference between
parallel and perpendicular photon counts, ∆n, were the best conditions for quantifying free
and bound probe molecules. Figure 7.4 demonstrates the impact on the Nb/Nt ratio as
increasing amounts of unlabeled Biotin were added to a solution containing 75 pM
Neutravidin with 300 pM BR110.

Texas Tech University, Sean M. Burrows, August 8, 2009
112
Figure 7. 4 Competition of Biotin and BR110 for Neutravidin. Nb/Nt ratio for a solution of 75 pM Neutravidin with 300 pM BR110 as a function of increasing Biotin concentration. Figure 7.4A used Extraction Method II and Figure 7.4B used Extraction Method III to select fluorescent bursts from single molecules. The anisotropy gates and the difference in parallel and perpendicular photon counts, Δn, were used to classify free and bound probe molecules; free: Δn < 20 and -0.1 ≤ r < 0.2; bound: Δn ≥ 20 and 0.2 ≤ r ≤ 0.5. The open triangles depict the Nb/Nt ratio of 300 pM BR110 with increasing amounts of Biotin; free: Δn < 12 and -0.1 ≤ r < 0.2; bound: Δn ≥ 12 and 0.2 ≤ r ≤ 0.5.
A
B

Texas Tech University, Sean M. Burrows, August 8, 2009
113
Figure 7.4A demonstrates that extraction Method II is not reproducible, when
compared to Figure 7.3D. The Nb/Nt ratio for 75 pM Neutravidin was 0.32 ± 0.05 in Fig. 4D
and 0.62 ± 0.08 in Figure 7.4A. At 0 pM Neutravidin the Nb/Nt ratio was 0.15 ± 0.02 in
Figure 7.3D and 0.01 ± 0.01 in Figure 7.4A. In Figure 7.4B the Nb/Nt ratio was 0.65 ± 0.07
at 0 pM unlabeled Biotin, 75 pM Neutravidin-300 pM BR110. The Nb/Nt ratio obtained in
Figure 7.4B for 0 pM unlabeled Biotin was equivalent to that in Figure 7.3F, within the error
of the measurement. At 750 pM unlabeled Biotin the Nb/Nt ratio decreased to 0.36 ± 0.06.
The Nb/Nt ratio decreased further to 0.22 ± 0.03 at 1.2 nM unlabeled Biotin.
The Nb/Nt ratio for BR110 in the absence of Biotin and Neutravidin was 0.22 ± 0.04.
For a solution of just 300 pM BR110 the Nb/Nt ratio in Figure 7.4B was equivalent to that in
Figure 7.3F, within the error of the measurement. Figure 7.4B also shows that as Biotin was
added to a solution of just 300 pM BR110 the Nb/Nt ratio did not change and thus Biotin had
no impact on the Nb/Nt ratio of the 300 pM BR110. By averaging all 10 concentrations of
Biotin-BR110 a value of 0.23 ± 0.04 was obtained.
4. Discussion In our previous communication on SMFA we demonstrated qualitatively that by
adding Neutravidin to a solution containing BR110 shifts in anisotropy to values around 0.25
could be observed7. The anisotropy histograms revealed that the solutions of Neutravidin
and BR110 were heterogeneous. Distinct populations of free and bound probe molecules
were identified in the anisotropy histograms. In this work we showed that by classifying
bound molecules with anisotropies greater than 0.2, Nb/Nt ratios increased to a relatively
constant value with increased Neutravidin concentrations.
It was observed from Figure 7.1 and Figure 7.2 that there were non-zero anisotropy

Texas Tech University, Sean M. Burrows, August 8, 2009
114
values for probe molecules that should have near zero anisotropy values. Effects from
molecular diffusion, photon shot noise, and Raman scattering are sources of error in steady-
state SMFA measurements. By carefully extracting fluorescent bursts from the original time
trace and appropriately classifying them as free and bound we minimized the impact of these
noise and error sources on SMFA measurements. As a result, we demonstrated a proof of
concept that the extent of molecular complexation can be quantified by formulating Nb/Nt
ratios from steady-state SMFA measurements.
For ensemble based fluorescence anisotropy measurements the literature suggests that
operating at and above photon saturation irradiance leads to reduced anisotropies39-41. This is
due to a large fraction of the molecules being in the excited state. Powis et. al.40 reported
that the anisotropic character of the excited state distribution is caused by unequal rates of
transfer for molecules with differing orientation. Saturation of more favorable transitions
(oriented parallel to incident field) leads to preferential depletion of ground state. Less
favored transitions ( oriented at an angle to or perpendicular to the incidint field) contribute
with increasing field strength, thereby reducing excited state anisotropy. However, since the
steady-state fluorescence anisotropy of single molecules was examined for this work there
was not a population of excited state molecules in the measurement volume. If the single
molecule is rotating there will be a population of molecular orientational states during the
observation time. A population of molecular orientations will comprise of some molecules
with absorption moments parallel to the excitation vector and some with absorption moments
that are at an angle to the excitation vector. If photon saturation was causing the excitation of
perpendicular transition moments then we would expect to observe negative anisotropy
values (set n|| = 0 in Equation 1). Figures 2 and 3 show empirical evidence of negative

Texas Tech University, Sean M. Burrows, August 8, 2009
115
anisotropy values, thus operating at photon saturation was impacting our anisotropy
measurements. Future experiments will explore the impact of irradiance on the anisotropy
obtained with steady-state SMFA measurements.
The steady-state anisotropy values depend on the relationship between the rotational
correlation time and fluorescence lifetime, the angle between the absorption and emission
transition moments of the fluorophore as well as the orientation of the absorption transition
moment of the fluorophore and the electric vector from the excitation source. The maximum
probability for absorption of excitation radiation occurs when the absorption transition
moment is collinear with the electronic vector of the excitation radiation. If the excitation
electric vector and the absorption transition moment are not collinear then only the collinear
component of the absorption moment will actually absorb radiation, at a reduced probability.
Any amount of rotation between absorption and emission will then add to depolarization
because emission was already going to occur at an angle to the electric vector of the
polarized excitation source. However, the SMFA measurements herein were producing
anomalously large anisotropy values for the free BR110 rather than low anisotropy values.
These depolarization sources could have negatively impact the anisotropy distribution for the
Neutravidin-BR110 samples, since low anisotropies could still be observed in these
solutions. Complexation may lead to quenching of the fluorescence if the fluorescent
molecules knock into the protein. However, the quenching process must be faster than other
photophysical processes such as emission or internal conversion and/or vibronic relaxation.
If the BR110 is not tightly bound to the Neutravidin and has some flexibility then the
anisotropy will be lower than expected.

Texas Tech University, Sean M. Burrows, August 8, 2009
116
One reason the Neutravidin has such a high binding constant is because there is a
reorientation of the binding cleft upon Biotin binding that locks biotin in the binding cleft
and creates additional non-covalent interactions42. With the BR110, the biotin portion of the
probe is tethered to a fluorescent probe, thus the binding cleft may not properly reorient,
thereby reducing the number of interactions between the binding cleft and the biotin moiety
of the BR110. Also the binding pocket of the Neutravidin has several other hydrogen
bonding and van der Waals interactions that give rise to the high binding constant for biotin
and Neutravidin42, 43. Having a fluorophore tethered to the Biotin may further disrupt the
various non-covalent interactions, thereby further diminishing the binding constant.
Disruption of non-covalent interactions could lead to a significant fraction of unbound probe.
Secondly, if the binding is dynamic such that molecules are binding and unbinding, then a
high fraction of unbound species will be observed, especially since single molecules are
being observed.
Two independent groups studied the binding interaction of Avidin with Biotin,
Biotin-fluorescein, and other Biotin analogs.44-47 From theses studies solutions below 40 nM
Avidin were found to have slow kinetics, and solutions below 1 nM were found to have even
slower kinetics with non-stoichiometric binding.44 Gruber44 reported a dissociation constant
of 0.2 nM for a solution for Biotin-fluorescein solutions incubated with 1 nM Avidin.
According to Green46, 47 the structure of Avidin consists of a pair of binding sites on opposite
faces. The distance between two binding sites on the same face was 25 Angstroms, and the
distance between binding sites on opposite faces was 40 Angstroms.46, 47 Gruber describes an
anti-cooperative effect where Biotin attaches to a binding site of Avidin, and the fluorophore
binds to the adjacent binding site on the same face.45 If two fluorophore-Biotins bind on
Texas Tech University, Sean M. Burrows, August 8, 2009
117
opposite faces of the Avidin, then the subsequent binding of the other two fluorophore-
Biotins will be hindered. Neutravidin and Avidin are very similar in structure and have
similar biotin binding properties, as reported by Wilchek.48
There are several factors contributing to the large population of unbound BR110 in
the presence of Neutravidin. First, photon saturation increases the probability of exciting
non-parallel and even perpendicular absorption transition moments, with respect to incident
field polarization, thereby depolarizing the emission. Operating at photon saturation results
in anisotropy values that are lower than expected as well as negative anisotropy values.
Second, the binding kinetics were slow at the concentrations used. Typically concentrations
were around or less than 1 nM Neutravidin. Third, the occupation of binding sites by the
Rhodamine 110 moiety resulted in an anti-cooperative effect where binding of the first two
BR110 impeded binding of the last two BR110. Finally, homo-energy transfer due to the
close proximity of fluorophores further depolarized the emission. The slow kinetics at the
concentrations used in this study was the most likely cause of the large fraction of unbound
species. Future experiments will compare the effect of photon saturation and incubation
concentration on anisotropy and Nb/Nt ratios.
Using extraction Method III to select fluorescence bursts the average Nb/Nt ratio
from 11 different experiments on 300 pM BR110 was also used to compare one-parameter
and two-parameter classification of free and bound probe molecules. When the anisotropy
gate alone was used to classify free and bound BR110 molecules the average Nb/Nt ratio was
0.24 ± 0.11, for 300 pM BR110. The average Nb/Nt ratio was 0.22 ± 0.08 for 300 pM
BR110 when using both anisotropy gates and the difference in parallel and perpendicular
photon counts. For the case of 0 pM Neutravidin, the relative error associated with two

Texas Tech University, Sean M. Burrows, August 8, 2009
118
parameter classification was 36 %, which was lower than that of the one parameter
classification, 46 % relative error. The Nb/Nt ratios for 300 pM BR110 showed that a
misclassification error of 20 % to 25 % is repeatable, for Method III.
Table 7.2 compares Method II and III using two parameter classification by
evaluating the Nb/Nt ratio for 0 pM and 75 pM Neutravidin, the relative error in Nb/Nt for 0
pM and 75 pM Neutravidin, the percent misclassification of bound species in the 0 pM
Neutravidin case and the percent bound for 75 pM Neutravidin for the data in Figures 7.3 and
7.4. For extraction Method II, the Nb/Nt ratio for 0 pM Neutravidin and 75 pM Neutravidin
were statistically different, at the 95 % confidence level. In extraction Method III the Nb/Nt
ratios were statistically different for 0 pM Neutravidin and 75 pM Neutravidin at both the 95
% and 99 % confidence level. Extraction Method II had a relative error in Nb/Nt of 62 %
and 45 % for 0 pM and 75 pM Neutravidin, respectively. The relative error in Nb/Nt for
extraction Method III was 16 % and 7 % for 0 pM and 75 pM Neutravidin, respectively.
Finally, using Method III the percent bound species at 75 pM Neutravidin was about 47 %.
Method III demonstrates better reproducibility and has a lower relative error associated with
the Nb/Nt ratio and percent bound species than Method II. Future work will involve finding
new probes that do not emit near the Raman shifts due to scatter from water, thereby
minimizing effects from Raman scatter on anisotropy calculations. Using brighter
fluorophores will reduce but not remove the impact of photon shot noise on anisotropy
measurements.
Lakowicz49 reported on bulk measurements of anisotropy for a biotintylated
fluorescein; the free probe molecules had an anisotropy of 0.021, which was close to our bulk
anisotropy for BR110, 0.01 ± 0.04 arbitrary anisotropy units. Lakowicz reported an
Texas Tech University, Sean M. Burrows, August 8, 2009
119
anisotropy of 0.194 for biotintylated fluorescein bound to Streptavidin. This value for
anisotropy differs from our bulk measurement of -0.01 ± 0.03 (30 nM BR110 and 7.5 nM
Neutravidin). The difference here could result from the different probe molecules being used
by the different groups, and the possible presence of excess of free probe in our case. Using
a ten-fold excess of Neutravidin to BR110 we did observe an anisotropy of 0.13 ± 0.03,
which was in better agreement with the anisotropy value Lakowicz obtained for a similar
probe-complexing agent solution.
In our previous work on SMFA7 we reported a rotational correlation time of ~ 24 ns
for Neutravidin. Lakowicz has reported22 that the observed rotational correlation times are
typically two-fold greater than the calculated value. Thus the rotational correlation time
should be either 24 ns or 48 ns, this results in an expected anisotropy of 0.23 or 0.25,
respectively.
The reason why the bulk anisotropy for a solution of 3 nM Neutravidin-300 pM
BR110 was ~ 0.13 rather than the expected value of 0.23 was due to the incomplete binding
between BR110 molecules and Neutravidin. According to Figure 7.3F for 3 nM
Neutravidin-300 pM BR110, approximately 80 % of the total molecules were bound.
However, it was determined from the 0 pM Neutravidin-300 pM BR110 solution that 25 %
of the probe molecules were misclassified as bound (see Figure 7.3F). Considering the
misclassification, we calculated that approximately 60 % of the total molecules were actually
bound for the solution containing 3 nM Neutravidin-300 pM BR110. A mixture of free and
bound probe molecules led to the lower than expected anisotropy value of 0.13 for the 3 nM
Neutravidin-300 pM BR110 solution.
Fractions of free and bound probe molecules could be determined from SMFA

Texas Tech University, Sean M. Burrows, August 8, 2009
120
Table 7. 2 For the complexation of 300 pM BR110 with 75 pM Neutravidin, Method II and III were compared by evaluating the Nb/Nt ratio for 75 pM Neutravidin, percent misclassification of bound species in the 0 pM Neutravidin case and the percent bound for 75 pM Neutravidin for the data in Figure 4 and Figure 5. This table also compares the two methods by considering the relative error in the Nb/Nt ratio for 0 pM and 75 pM Neutravidin. Two parameter classification was used to quantify free and Neutravidin bound BR110.
Relative Error in
Nb/Nt
Method Nb/Nt
75 pM
Neutravidin
(N=2)
% misclassified
(from 0 pM
Neutravidin)
(N=4)
% bound for
75 pM
Neutravidin
0 pM 75 pM
I 0.47 ± 0.21 13 ± 8 % 41 ± 22 % 62 % 45 %
II 0.62 ± 0.04 25 ± 4 % 47 ± 4 % 16 % 7 %

Texas Tech University, Sean M. Burrows, August 8, 2009
121
measurements. To make these types of observations on the bulk level the fractions of
fluorescence from free and bound probe molecules would need to be determined. Obtaining
fractional fluorescence intensities complicates the experimental design. The constraints of
our lab prevented comparison of fractional amounts of free and bound probe molecules on
the single molecule level to the bulk (many molecule) level. Future studies will attempt such
measurements.
Finally we demonstrated the ability to perform competition reactions between BR110
and Biotin for Neutravidin. Even though 75 pM Neutravidin should require 300 pM Biotin
to replace BR110 we did not observe a decrease until more than twice that amount was
added. This observation could be attributed to the cooperative nature of Neutravidin50.
Another reason for this could be due to the fact that according to our measurements
approximately 40 % of the BR110 species were complexed by Neutravidin. Thus, it is
possible there are some uncomplexed and partially complexed Neutravidin species in
solution. The Biotin may complex the open binding sites of Neutravidin that did not
complex with BR110 before competing with a previously complexed Neutravidin. However,
once twice the amount of Biotin was added a reduction in the Nb/Nt ratio was observed.
5. Conclusion A proof of concept of for quantification of molecular complexation using SMFA was
demonstrated. Extracting fluorescent bursts greater than n|| and greater than n⊥, where n|| >
n⊥, in both the perpendicular and the parallel channel proved to be the optimum fluorescent
burst extraction process. Using anisotropy gates and the difference in parallel and
perpendicular photon optimized the classification of free and bound species. Using two

Texas Tech University, Sean M. Burrows, August 8, 2009
122
classification parameters improved the error associated with the Nb/Nt ratio and provides a
better separation of the Nb/Nt ratios between low and high values.
There are occasional fluctuations in the Nb/Nt values from experiment to experiment.
The high Nb/Nt ratio of the uncomplexed BR110 results from the high anisotropy typically
observed with BR110 as can be seen in Figure 7.2. There are three possible causes of the
fluctuation in the Nb/Nt ratio: (a) instrumental, the alignment is optimized before each
experiment and that could create fluctuations in signal reaching detector (b) the samples
themselves and (c) inherent photon shot noise and scatter.
FCS is traditionally used to study complexation reactions. In its simplest form FCS is
a one laser, one detector technique that identifies complexes based on diffusion times. While
FCS is a powerful technique, it cannot observe rare events readily. In addition, SMFA can
be used to study the rigidity of a probe held in a binding site. This form of rigidity
measurement will be performed in subsequent studies.
SMFA can find application in performing immunoassays for drug screening. By
quantifying the percentage of bound probe molecules the extent of binding can be
determined. SMFA can aid in designing drugs that exhibit maximum binding. Single
molecule spectroscopy has the added benefit of observing heterogeneities in samples that
ensemble measurements cannot resolve. These heterogeneities can also lead to falsely low
anisotropy values, as was the case with 7.5 nM Neutravidin-30 nM BR110, which resulted in
an anisotropy of -0.01 ± 0.03 arbitrary anisotropy units. SMFA has been shown as a useful
tool to elucidate heterogeneous binding events and for quantification of pM concentrations of
protein-probe complexes. This technique will have applicability in many areas, including

Texas Tech University, Sean M. Burrows, August 8, 2009
123
drug screening, protein function, protein interactions, and sensitive detection by affinity
methods.

Texas Tech University, Sean M. Burrows, August 8, 2009
124
6. References 1. J. Schaffer, A. Volkmer, C. Eggeling, V. Subramaniam, G. Striker, C. A. M. Seidel, J. Phys. Chem. A 103, 331 (1999). 2. R. Lu, D. Hu, X. Tan, H. P. Lu, J. Am. Chem. Soc. 128, 10034 (2006). 3. X. Tan, P. Nalbant, A. Toutchkine, D. Hu, E. R. Vorpagel, K. M. Hahn, H. P. Lu, J. Phys. Chem. B, 108, 737 (2004). 4. H. P. Lu, Acc. Chem. Res. 38, 557 (2005). 5. S. Kalinin, S. Felekyan, M. Antonik, C. A. M. Seidel, J. Phys. Chem. B 111, 10253 (2007). 6. J. Widengren, V. Kudryavtsev, M. Antonik, S. Berger, M. Gerken, C. A. M. Seidel, Anal. Chem. 78, 2039 (2006). 7. S. M. Burrows, D. Pappas, Analyst 133, 870 (2008). 8. B. R. Singh, B. R. Dasgupta, Mol. Cell Biochem. 85, 67 (1989). 9. J. Piehler, G. Schreiber, J. Mol. Biol. 289, 57 (1999). 10. V. Ragoonanan, A. Aksan, Biophys. J. 94, 2212 (2008). 11. P. M. Tessier, J. Jinkoji, Y. C. Cheng, J. L. Prentice, A. M. Lenhoff, J. Am. Chem. Soc. 130, 3106 (2008). 12. J. S. Yuk, J. W. Jung, Y. M. Mm, K. S. Ha, Sensor. Actuat. B-Chem. 129, 113 (2008). 13. Q. Q. Ruan, S. Y. Tetin, Anal. Biochem. 374, 182 (2008). 14. I. Russier-Antoine, J. Huang, E. Benichou, G. Bachelier, C. Jonin, P. F. Brevet, Chem. Phys. Lett. 450, 345 (2008). 15. Y. Sun, S. Cressman, N. Fang, P. R. Cullis, D. D. Y. Chen, Anal. Chem. 80, 3105 (2008). 16. D. Pappas, S. M. Burrows, R. D. Reif, TrAC: Trend. Anal. Chem. 26, 884 (2007). 17. L. Groc, D. Choquet, B. Lounis, L. Cognet, The Biochemist, 5 (2005). 18. F. Hillger, D. Nettels, S. Dorsch, B. Schuler, J. Fluoresc. 17, 759 (2007). 19. R. Liu, D. Hu, X. Tan, H. P. Lu, J. Am. Chem. Soc. 128, 10034 (2006).

Texas Tech University, Sean M. Burrows, August 8, 2009
125
20. T. Ha, J. Glass, T. Enderle, D. S. Chemla, S. Weiss, Phys. Rev. Lett. 80, 2093 (1998). 21. J. R. Fried, L. Brand, C. Eggeling, M. Kollner, C. A. M. Seidel, J. Phys. Chem. A 102, 6601 (1998). 22. J.R. Lakowicz, Principles of Fluorescence Spectroscopy, Kluwer, New York, 1999. 23. T. Ha, T. A. Laurence, D. S. Chemla, S. Weiss, J. Phys. Chem. 103, 6839 (1999). 24. T. H. Wang, Y. Peng, C. Zhang, P. K. Wong, C. M. Ho, J. Am. Chem. Soc. 127, 5354 (2005). 25. J. Wang, Q. Lu, H. P. Lu, PLOS Comput. Biol. 2, 842 (2006). 26. A. N. Kapanidis, N. K. Lee, T. A. Laurence, S. Doose, E. Margeat, S. Weiss, P. Natl. Acad. Sci. USA 101, 8936 (2004). 27. M. Jäger, X. Michalet, S. Weiss, Protein Sci. 14, 2059 (2005). 28. A. Orte, R. Clarke, S. Balasubramanian, D. Klenerman, Anal. Chem. 78, 7707 (2006). 29. K. G. Heinze, M. Jahnz, P. Schwille, Biophys. J. 86, 506 (2004). 30. C. Y. Zhang, L. W. Johnson, Analyst 131, 484 (2006). 31. New Trends in Fluorescence Spectroscopy: Applications to Chemical and Life Sciences, ed. O. Wolfbeis, B. Valeur, J. C. Brochon, Springer, 2001, ch. 17, pp. 343. 32. Molecular Probes Product Information 2002, MP 00887. 33. K. Wang, M. K. Marshall, G. Garza, D. Pappas, Anal. Chem. 80, 2118 (2008). 34. P. Vermette, T. Gengenbach, U. Divisekera, P. A. Kambouris, H. J. Griesser, L. Meagher, J. Colloid Interf. Sci. 259, 13 (2003). 35. www.piercenet.com 36. A. M. van der Valk, D. N. Howbrook, M. C. O’Shaughnessy, D. K. Sarker, S. C. Baker, A. Louwrier, A. W. Lloyd, Biotechnol. Lett. 25, 1325 (2003). 37. M. Koshioka, K. Sasaki, T. Masuhara, Appl. Spectrosc. 49, 224 (1995). 38. I. V. Gopich, J. Phys. Chem. B 112, 6214 (2008).
Texas Tech University, Sean M. Burrows, August 8, 2009
126
39. R. Altkorn, R. N. Zare, Ann. Rev. Phys. Chem. 35, 265 (1984). 40. E. H. Van Kleef, I. Powis, Mol. Phys. 96, 757 (1999). 41. H. Meyer, S. R. Leone, J. Chem. Phys. 105, 5858 (1996). 42. O. Livnah, E. A. Bayer, M. Wilchek, J. L. Sussman, Proc. Natl. Acad. Sci. USA 90, 5076 (1993). 43. A. Chilkoti, P. H. Tan, P. S. Stayton, Proc. Natl. Acad. Sci. USA 92, 1754 (1995). 44. H. J. Gruber, G. Kada, M. Marek, K. Kaiser, Biochim. Biophys. Acta 1381, 203 (1998). 45. G. Kada, H. Falk, H. Gruber, Biochim. Biophys. Acta 1427, 33 (1999). 46. N. M. Green, in Methods in Enzymology, ed. M. Wilchek and E. A. Bayer, Academic Press, INC., San Diego, 1990, vol. 184, ch. 5, pp. 51-67. 47. N. M. Green, in Advances in Protein Chemistry, ed. C. B. Anfinsen, J. T. Edsall and F. M. Richards, Academic Press, INC., New York, 1975, vol. 29, pp. 102-124. 48. Y. Hiller, E. A. Bayer, M. Wilchek, in Methods in Enzymology, ed. M. Wilchek and E. A. Bayer, Academic Press, INC., San Diego, 1990, vol. 184, ch. 6, pp. 70. 49. H. Szmacinski, J. R. Lakowicz, Anal. Chem. 80, 6260 (2008). 50. S. L. Zhao, D. S. Walker, W. M. Reichert, Langmuir 9, 3166 (1993).

Texas Tech University, Sean M. Burrows, August 8, 2009
127
Chapter VIII
Closing remarks and outlook
The development of novel analytical applications for single molecule spectroscopy
has been successfully presented. The first analytical application established was the use of
normalized recrossing ratios to study photophysics of luminophores. The normalized
recrossing ratio method is well suited to quantitatively determine the recrossing error
associated with the system understudy, as well as qualitatively study energy transfer and light
harvesting capabilities of fluorogenic systems. Single molecule fluorescence anisotropy was
applied to qualitatively and quantitatively study molecular complexation.
The normalized recrossing ratio (Nr/Nt) method took advantage of a phenomenon
known as radiative trapping. As laser irradiance and/or molecular weight of the species in
question increases the likely-hood of a molecule recrossing the probe volume is increased as
well. If photon saturation were the only limit to emission from the fluorogenic species than
one would expect the Nr/Nt ratio to remain constant at an irradiance corresponding to the
onset of photon saturation irradiance. Instead, for all the fluorophores investigated it was
found that as the excitation irradiance was increased the Nr/Nt ratio would increase to a
maximum and then decay. This behavior was attributed to photobleaching and, when
applicable, to triplet state formation. By evaluating the photon saturation in conjunction with
the normalized recrossing an optimal excitation irradiance can be deduced such that
molecular recrossing events are minimized and accounted for as well as maximizing
emission intensity.

Texas Tech University, Sean M. Burrows, August 8, 2009
128
The normalized recrossing ratio method was further applied to the investigation of
triplet states and light tolerance of phycobiliproteins. These proteins have remarkable light
harvesting and energy transfer capabilities. However, these capabilities are unstable at high
excitation irradiances. Normalized recrossing ratios were used to study the enhanced light
tolerance of a tandem conjugate linked to the phycobiliprotein.
Future work with the phycobiliproteins will involve linking them to nanoparticles to
study the potential of extending the light tolerance of phycobiliproteins further. This work
will involve using normalized recrossings as well as fluorescence correlation spectroscopy to
study the photophysics of phycobiliprotein-nanoparticle systems. Other studies involving
pycobiliproteins will employ linking various types of phycobiliproteins to each other to
investigate the energy transfer and light tolerance when several different phycobiliproteins
are linked together.
Initially the impact of photon shot noise and molecular counting error on single
molecule fluorescence anisotropy was studied for our single molecule system. The photon
shot noise proved to be the limiting noise source in these measurements. Single molecule
fluorescence anisotropy was then applied to study molecular complexation. Methods to
extract fluorescent burst and classify species based on their anisotropy and using difference
in detector counts were compared. BR110 had a 25 % misclassification of bound species
most likely due to Raman scatter. Taking this error into consideration it was found that when
300 pM BR110 was combined with Neutravidin solutions ranging from 50 pM to 1.8 nM
about 40 % of the BR110 species were bound.

Texas Tech University, Sean M. Burrows, August 8, 2009
129
Future work on single molecule fluorescence anisotropy will be to minimize the
systematic error associated with the control BR110 solutions. This will involve using
brighter fluorophores, suppressing and correcting for Raman scatter.

Texas Tech University, Sean M. Burrows, August 8, 2009
130
Bibliography
Sean Michael Burrows was born to JoAnne and William Burrows of Littleton
Massachusetts on April 17, 1980. He received his Bachelor of Science in Chemistry with a
minor in Mathematics from the University of Central Florida in 2004. He then went on to
pursue his doctoral degree from Texas Tech University under the guidance of Dimitri Pappas
in 2005.