Development of CRP instrument 130315
28
This is the Accepted Version of a paper published in the International Journal of Educational Research: Boon, Helen J., and Lewthwaite, Brian (2015) Development of an instrument to measure a facet of quality teaching: culturally responsive pedagogy. International Journal of Educational Research, 72. pp. 38-58. http://dx.doi.org/10.1016/j.ijer.2015.05.002 © 2015. This manuscript version is made available under the CC-BY-NC-ND 4.0 license http://creativecommons.org/licenses/by-nc-nd/4.0/ ResearchOnline@JCU
Transcript of Development of CRP instrument 130315
This is the Accepted Version of a paper published in the
International Journal of Educational Research:
Boon, Helen J., and Lewthwaite, Brian (2015) Development
of an instrument to measure a facet of quality teaching:
culturally responsive pedagogy. International Journal of
Educational Research, 72. pp. 38-58.
http://dx.doi.org/10.1016/j.ijer.2015.05.002
© 2015. This manuscript version is made available under
the CC-BY-NC-ND 4.0 license
http://creativecommons.org/licenses/by-nc-nd/4.0/
ResearchOnline@JCU

HJ Boon Development of an instrument to measure Culturally Responsive Pedagogy
1
Development of an instrument to measure a facet of quality teaching: culturally responsive pedagogy
Abstract
This paper presents findings of Phase 2 of a larger three phase study examining culturally responsive pedagogies and their influence on Indigenous student outcomes. Characteristics of culturally responsive pedagogies obtained through interviews with Australian Indigenous¹ parents and students generated characteristics and themes which were distilled into survey items. The resulting instrument was applied to practicing teachers for validation.
The survey was piloted on a sample of 141 elementary and secondary teachers from diverse schools. Analyses using Item Response Theory, employing the Rasch model, confirmed that the instrument measured a unidimensional latent trait, culturally responsive pedagogy. Seven subscales, initially qualitatively determined, were statistically confirmed. The instrument proved suitable to measure nuances in pedagogy and to detect significant differences between elementary and secondary teachers.
Key words: Culturally responsive pedagogy, Indigenous, Rasch Analysis, instrument, quality teaching.
1. Introduction
It has been proposed that Indigenous pedagogy, properly analysed and explored on the basis of Indigenous values and philosophies has great potential to lead to positive educational change for all learners (Biermann & Townsend‐Cross 2008; Lewthwaite et al. 2014, Yungaporta & McGinty 2009).Pedagogical practise that has been recognised as being relevant for Indigenous Australians is founded on broad principles of identity and relatedness, and nourished by values of reciprocity, inclusiveness, nurturance and respect (Biermann & Townsend‐Cross 2008). Notions such as defining identity through relatedness to people, place, space, (history, present and future), acknowledgement of unique identities, experiences and perspectives, caring, sharing experience and knowing, patience and respect are fundamental matters often espoused for the pedagogical practices deemed to be in line with Indigenous Australians’ ideologies and values (Biermann & Townsend‐Cross 2008; Yungaporta & McGinty 2009).
These views are congruent with heightened concerns about educational quality internationally and in Australia. Yet although Australia has been deemed to deliver high quality education, recent international evaluations conducted by the Program for International Student Assessment (OECD, 2006; Thomson, De Bortoli, Nicholas, Hillman & Buckley, 2010) suggest that Australia is a low equity‐high quality education performer and provider (McGaw, 2006). That is, there is evidence of inequity in school outcomes with large achievement gaps between Indigenous and non‐Indigenous students. The latest results show Indigenous Australian students are performing on average at a standard equivalent to 2½ years behind non‐Indigenous students. As a result, the Council of Australian Governments (COAG) that is, all state, territorial and national governments in Australia, agreed to a set of educational priorities and reform directions to reduce Indigenous disadvantage (2009). These include a drive to ensure schools and teachers build upon local cultural knowledge and experience of Indigenous students as a foundation for learning, endorsing well established Vygotskian theoretical precepts.
2. Theoretical underpinning
A lack of congruence between the culture of the school and that of the student is well associated with Indigenous students’ limited success in school. For example, low engagement in Indigenous American students in the absence of culturally responsive practices (Castagno & Brayboy, 2008). In New Zealand, low expectations and student alienation are linked to high suspension rates, over‐representation in special education, low educational attainment, and low retention rates for Maori students (Ministry of
HJ Boon Development of an instrument to measure Culturally Responsive Pedagogy
2
Education, 2006).As expressed by Stairs (1995) two decades ago, Indigenous students’ lack of educational success in northern Canadian schools can be attributed to the inability of schools to meet the learning needs of their Indigenous citizens through the experiences and pedagogies offered in classrooms. She asserted that this failure includes not only resource and language materials appropriate for each context, but also, more importantly, the culturally located pedagogy that moves beyond the what of classrooms to the how of classrooms (Lewthwaite et al. 2014). Stairs’ comments resonate with the discourse on effective teaching within North Queensland where this study is located. Many voices have more recently advocated for improved teaching pedagogy to raise educational outcomes for students in general, and Indigenous students in particular (Hattie, 2009; Pearson, 2011; Rowe, 2006; Sarra, 2011). For example, John Hattie’s (2003,2009) meta‐analysis of 800 studies examining the impact of a range of variables on educational achievement, identified teachers and their pedagogy as a major source of variance in students’ achievement. Hattie (2003) recommended that there should be a focus on the specific actions of teachers that influence student learning outcomes, challenging teachers to ‘know thy student’ and reflect upon the consequence of their teaching upon learning. He stressed that teachers must engage in dialogue with their students about their teaching and students’ learning thereby making learning visible (2009). Such propositions embedded in an overarching professionalism also imply a strong ethic of care for one’s students (Boon, 2011), including caring for students as culturally located individuals within the context of positive student–teacher relationships. Gore et al. (2007) argued that it was the approach with which teachers tackled their professional duties that made a difference. An approach based on commitment to their students’ learning, underscored by a commitment to social justice which springs from an internalised value system. They argued that teachers’ values and beliefs determine teacher quality. A professional ethic of care is central to understanding, appreciating and including a student’s cultural background in any pedagogical practice, reflecting culturally responsive pedagogy. Such caring for students as culturally located individuals has implications for teacher pedagogy, that is, how teachers support student learning. Culturally responsive pedagogy was central to Vygotsky’s theory. Vygotsky (1978) stressed the fundamental role of social interaction in the development of cognition, as he believed strongly that community played a central role in the process of "making meaning." As early as the 1930s his theory advocated for the use of cultural tools for the facilitation of learning. These ideas and propositions are intrinsically linked to cultural identity and, as emphasised in Indigenous culture, in collaborative learning wherein the teacher or more knowledgeable other is a facilitator of the learning process. More recently Gay (2010) defined it as teaching ‘to and through [students’] personal and cultural strengths, their intellectual capabilities, and their prior accomplishments’ (p. 26) and as premised on ‘close interactions among ethnic identity, cultural background, and student achievement’ (p. 27). In 2012, the unassumingly released Culturally Responsive Pedagogy (CRP) by the Menzies Institute (Perso, 2012) argued for informed improvement in teacher effectiveness for Indigenous students in Australia. Like Hattie’s work (2009), it compiles a range of effective teaching practices gathered from decades of national study that the author, Thelma Perso, asserts must be considered in making learning more effective for Indigenous students. Critically, many of the identified practices in this document, such as teacher clarity, explicit instruction and provision of feedback to students correspond with the assertions made by Hattie (2009) and Rowe (2006). However, Hattie’s assumption of a uniform application of such practices for all students overlooks the potential power of influence of the context‐ and culture‐bound nature of learners and learning (Perso, 2012; Snook et al., 2009). Despite the often quoted characteristics of CRP and the plethora of untested ‘good ideas’ in the Australian literature (Authors, under review), no systematic and empirically‐based research provides any conclusive indication of ‘what works’ in influencing Indigenous students’ learning (Price & Hughes,
HJ Boon Development of an instrument to measure Culturally Responsive Pedagogy
3
2009). The Menzies Institute (2012) document, recalling Castagno and Brayboy’s (2008) international challenge, calls for governments to support empirically‐based research to verify whether the identified culturally located pedagogy is instrumental to Indigenous students’ achievement. Considering Hattie’s imperative to make learning visible by opening the dialogue between students and teachers, there is a dearth of research that responds to what Australian Indigenous students and their communities are saying about pedagogy which influences their learning. As Rowe (2003, p.22) laments, “there is a growing uneasiness [in Australian education] related to how little is known about teacher quality from Indigenous students’ own perspectives”. Craven, Bodkin‐Andrews and Yeung also stressed: “there is astoundingly little known about what Aboriginal students see as the qualities of effective teachers and the impact this has on educational outcomes” (2007, p. 4). There is a need to validate the application of Hattie’s findings to Aboriginal students; to tease out facets of quality teaching that are salient to Aboriginal students; examine what Indigenous students and their communities consider to be quality pedagogy and how these considerations play out in practice to increase Indigenous students’ outcomes and engagement.
3. The current research: context and research questions
The overall aim of the research project is to develop cultural competence in Australian Catholic Education teachers through fostering understanding of CRP for Indigenous students. We aim to help teachers embrace CRP and then measure the influence of this adjusted pedagogy on student outcomes. Catholic Education in Australia is at a critical stage in its developmental history. Although it is recognised as an educational provider of high quality and high equity education, there is ongoing concern about inequity in educational performance, especially amongst its Indigenous learners. While this concern resonates with concerns about educational performance data across state schools, this is problematic for Catholic Education because of its fundamental mission to seek to overcome the educational disadvantage of Aboriginal and Torres Strait Islander students to achieve equitable education outcomes (Queensland Catholic Education Commission, 2012).
The research described here is part of a project designed to help address this gap in our understanding of quality education from the perspective of Indigenous learners and their communities. We present the outcomes of the second phase of a three phase research initiative, aimed to determine classroom practices that support the learning of Indigenous Australian students. The first phase addressed the question: What do Indigenous students, their carers and community members identify as teaching practices that influence their learning? The second phase, reported here concerns the question:
To what extent do teachers endorse teaching practices that have been identified by Indigenous students and parents as influential in their learning?
We present results of phase two which culminated in the development and initial piloting of a survey instrument for CRP based on what Indigenous parents1 and students believe to be effective pedagogy for Indigenous students. The survey instrument was constructed as a result of a review of the literature, interviews and conversations with school and community members and, importantly, with Australian Aboriginal parents and students. The detailed process involved in extracting the teaching characteristics deemed to be influential in Indigenous student outcomes and culminating in the identification of categories from which survey items were constructed is reported elsewhere (Authors under review). A summary of that process is detailed below.
4. Methods
4.1. Sample and procedure: qualitative phase
1 Although the Australian Research Grant supporting this research is inclusive of Aboriginal and Torres Strait Islander (collectively for this paper referred to as Indigenous) students and community members, this research paper pertains to Aboriginal students and parents only because voluntary participation included only this population).

HJ Boon Development of an instrument to measure Culturally Responsive Pedagogy
4
Individual interviews were conducted with (a) 27 grade 9‐12 students, all self‐identifying as Aboriginal, in four different schools, (b) group interviews with 16 Grade 9‐12 students from four schools, and (c) individual and group interviews with 27 parents and caregivers, some being Indigenous teachers, from all four schools. In addition, a focus group interview was conducted with an Indigenous teacher and teacher administrator responsible for curriculum delivery and appropriate pedagogical practice for indigenous students. In all cases, in line with empirical existential phenomenology (Crotty, 1996), we asked open ended questions that provided opportunity for students’, parents’ and caregivers’ to reflect on, without interruption or prompting, prior formal (school‐based) and informal (family or community‐based) learning experiences. In the semi‐structured interviews, which lasted between one and two hours, we asked individuals to identify:
(a) teaching and learning experiences within informal contexts, at home or in the community, (b) teaching and learning experiences within more formal contexts, at school, and, (c) in these experiences to describe: i. what their teachers (both informal and formal) did to help them learn, ii. what was happening when they were learning best both in informal and informal settings, iii. what they would change about their teachers’ teaching to assist them in their learning, iv. teachers of good consequence and the characteristics of those teachers, both in informal and formal settings and v. if they (or their child) was to get a new teacher, what would they want that teacher to know about them (or their child) and their learning? In each interview, the interviewee decided which of these statements to respond to. In all cases, the interviews were ‘a chat’ (Bishop & Glynn, 1999) based upon the need for collaboration between researchers and participants to construct the final story capturing the fundamental essence of participants’ experiences (Van Manen, 1990). These were documented as a series of vignettes from which themes were identified and used to construct the survey items.
All conversations were audio‐recorded and transcribed. The data collected, once analysed, were shared with the Catholic Education Aboriginal and Torres Strait Islander Advisory Committee and with the teaching and administration staff of the five Catholic Education schools where the study was located. Teachers were invited to respond to students’ comments about teacher behaviours that influenced their learning. These meetings involved the entire elementary‐middle years teaching staff which, typical of Catholic Education settings, were predominantly non‐Indigenous. We verified transcribed sections of the conversations as accurate through our conversations with each other as researchers and with, where possible, students, parents and their teachers. Thematic analysis was conducted by the researchers individually and then collectively. In our analyses we looked for ‘common themes’ in and across all participant interviews.
Table 1 provides descriptions of the qualitative pedagogical characteristics identified as being important for Indigenous learners. All characteristics were consistently mentioned by community members and, we have found, consistently reflected as practices influencing students’ learning in research in northern Canadian settings (Authors 2007, 2009, 2010), in New Zealand (Bishop, 1996, 2003; Bishop, Berryman, Tiakiwai & Richardson,2003) and prior research in the Torres Strait context (Osborne, 1991, 1996, 2001). These characteristics validate the Catholic Education imperative to “provide students with more than just academic instruction. Students from Kindergarten through to Year 12 are educated to develop academically, spiritually, socially, emotionally and physically to become compassionate and contributing members of our world” (Queensland Catholic Education Commission, 2012).
Table 1: Culturally responsive pedagogy (CRP)

HJ Boon Development of an instrument to measure Culturally Responsive Pedagogy
5
Category Description and examples
Teacher ethic of care An ethic of care is the foundation for all teaching practices. Teaching is characterised by respectful, positive and warm interactions with students. Teachers communicate their regard for all dimensions of learning, including social development. Students with individual needs, such as hearing loss, have access to support services.
Teacher cultural values
Valuing students’ cultural identity including showing respect for students’ home language and knowledge, family and community, values and beliefs; cultural knowledge and values, and relatives are welcomed into the classroom and used to scaffold children’s learning.
Literacy teaching Literacy is taught from a foundation of spoken language. Code switching between Aboriginal English and Standard Australian English is explicitly taught. Students are orientated to age‐appropriate texts before reading; then reading strategies and writing are taught and repeatedly modelled in context.
Explicit teaching practices
Expectations of students both in behaviour and achievement, and the direction of future learning are clearly and repeatedly communicated to students. The knowledge and skills needed by students are explained and modelled in a variety of ways; feedback is regularly offered.
Pedagogical expertise
The teacher behaves as a learning facilitator; students are given choices, open ended, experiential, group and outside activities from which to learn. Visual imagery is used to prompt engagement and support learning. Information and skills are chunked and scaffolded, and connected to prior knowledge. Students are provided time to gain mastery of skills. Communication of ideas, especially abstract tasks, occurs orally when students are engaged physically with learning tasks.
Behaviour support; Support for self‐regulation
Students contribute to the setting of classroom expectations, which are clearly and consistently communicated to students. The encouragement of cooperative behaviours, engaging and accessible tasks and use of routine decrease the need to manage student behaviours.
Structural support of culturally effective teaching practices
Schools support teachers’ pursuit of student academic and social outcomes by providing an accessible process by which students and community can be included in school decision making. Schools provide staff time to visit families at home and organise cross‐cultural training from community Elders.
The final category included in the characteristics of culturally responsive pedagogy, “Structural support of culturally effective teaching practices” was concerned with structural school provisions available to teachers to support their culturally responsive practices in the course of their teaching. As it is an important constraint on a teacher’s disposition to be culturally responsive this category considered important and relevant for the purpose of the survey construction.
4.2 Instrument Development In summary, the items pertaining to the qualitative categories categorising CRP were generated as a result of cross‐referencing the theoretical and empirical literature, in‐depth review with experts in the fields of psychology and psychometrics, and educators responsible for the curriculum development for Indigenous students. A team of three professionals in education identified seven categories and generated 83 items for the initial item pool. The constructed CRP instrument was then piloted with a group of 141 Catholic Education teachers for refinement. Specifically, the category characteristics

HJ Boon Development of an instrument to measure Culturally Responsive Pedagogy
6
identified in the qualitative phase were broken down to survey items by the research team with the help of a senior school teacher and administrator responsible for curriculum development and delivery for appropriate pedagogy for Indigenous students in Catholic Education and an Indigenous teacher. This was deemed important in order to ensure that the wording of the items was unambiguous and the intended meaning of the items was retained. Further, the items were at that stage grouped into distinct clusters thought to inform responsive pedagogy and reflective of those categories identified by the parents and students. The categories that were identified for the purpose of the survey instrument were: Pedagogical expertise, Literacy teaching, Explicitness, Ethic of care, Self‐regulation support, Behaviour support and Indigenous Cultural Value. Aside from the 83 items one additional item, an open response question was included to allow respondents to give feedback or add comments about the survey. The items that were included in the survey were constructed in such a way as to honour the views of the Indigenous parents and students interviewed and to represent important aspects of culturally responsive pedagogy (CRP) as informed by the literature. 4.3 Survey administration procedure and sample for the quantitative piloting phase
The survey was made available to teachers teaching in Catholic education schools in part of North Queensland on‐line via Survey Monkey. Respondents were informed that the study had been granted ethical clearance by James Cook University and Catholic Education, Queensland. They were further informed that: “Participation is completely voluntary and confidential. You are free to withdraw at any time for whatever reason by exiting the survey. You are not obliged to answer any questions that you may be uncomfortable with. You will not be identified in any way when the results are published and nothing will connect you to your responses. If you give your name at any point this will be removed before your responses are saved, stored and analysed. All data will be stored in secure files that are password protected (if computer files) or in lockable filing cabinets and accessible only to the researchers. After five years all files will be destroyed”.
No demographic information was sought other than whether the teacher was a secondary or elementary teacher. Specific instructions for answering the survey questions were printed above the first question referring to pedagogy, explaining the response format, namely that: “The statements in this questionnaire deal with the actions or behaviours that might be seen or used in the classroom. Answer the questions based upon the degree you believe these actions or behaviours are used in your classroom. There are 5 possible answers for each behaviour ranging from “almost never” to “almost always”. Please be honest and accurate in your answer.”
The items required teachers to respond in a Likert scale format with the response format being:
Almost never <20% of the time Once in a while: 20‐39% of the time Sometimes: 40‐59% of the time Frequently: 60‐79% of the time Almost always ≥ 80% of the time
The sample of 141 elementary and secondary teachers from Catholic education schools consisted of 80 elementary and 61 secondary school teachers.
5. Rasch Analysis Rasch analyses were deemed most appropriate for this research phase. Although Classical test Theory (CTT) is widely, appropriately and conveniently used in the construction of survey instruments (Zickar and Broadfoot, 2009), its two major limitations, the lack of an explicit ordered continuum of items that represent a unidimensional construct, and the lack of additivity of rating scale data, make it unsuitable for the development of this instrument. The Rasch model provides an alternative scaling methodology

HJ Boon Development of an instrument to measure Culturally Responsive Pedagogy
7
that enables the examination of the hierarchical structure, unidimensionality, additivity of CRP measures and item parameters that are invariant across populations assuming the model fits the data (Zickar and Broadfoot, 2009) which for the purpose of our research is critical. Distances on the scales developed via CTT are interpreted as equal over the full range of the scale. The scale is treated as an interval scale based on ordinal level item scoring whereas the Rasch scale is a statistically proven interval scale (Fox and Jones, 1998). Another advantage of using Rasch analysis the CRP instrument is that it deals with missing data, since the Rasch algorithm compares each observed item score to an expected score, based on the overall scaling model, and uses expected score information when accounting for missing data. This procedure offers a significant advantage when using the questionnaire at an individual level (Fox and Jones, 1998; Wright and Stone, 1979). A large number of other researchers have used the Rasch model to construct instruments that measure latent traits (e.g., Manz et al.2014; Peoples et al. 2014; Lamoureux et al. 2007; Maulana, Helms‐Lorenz and van de Grift ,2015a; Maulana, Helms‐Lorenz and Wim van de Grift, 2015b). A member of the family of item response theory (IRT), the Rasch model (Rasch, 1960) has more stringent assumptions to be met than classical test theory (CTT). The usefulness of IRT models depends on the extent to which these assumptions are met. For the Rasch model, there are three assumptions: (1) unidimensionality. This assumption requires that a set of items must measure one and the same latent skill in a homogenous way. (2) Local stochastic independence. This means that the response to one item may not influence the response to another, except for an influence that can be explained by the latent variable that is the measurement objective of the set of items. (3) Parallelism of the item characteristic curves. This means that each item in the Rasch scale should contribute uniquely to the scale. Items with extremely high or low discrimination power indicate a violation of this assumption (DeMars, 2010). When an instrument satisfies the three assumptions of the Rasch model, the instrument can reliably and validly be used for measuring the latent trait in question, in this case teachers’ endorsement of culturally responsive pedagogy (CPR). The creation of interval‐level data, invariant items and the sample independence features of the Rasch model overcome the fundamental drawbacks of the classical test theory (CTT) analyses as shown by Hambleton (1993) and Boone et al. (2011). For the purposes of this research, this means that a teacher can be placed on the CRP continuum and his/her location will denote a level of endorsement of CRP that can be described by the types and level of items that correspond to their personal score. Further, a teacher might chose to modify their pedagogy in light of their measured CRP score by focusing on specific behaviours represented by items on the CRP survey, thus modifying particular facets of their CRP. At a later stage, which is the final phase of our project, using the responses of elementary/ secondary students, the adapted CRP survey will measure their assessment of how well a classroom adheres to changes in the classroom environment in line with CRP. Cavanagh and Romanoski (2006) suggest that the interval‐level, linear properties of Rasch‐based instruments are particularly suitable for learning environment research in which rating scales are often used to measure different aspects of a student’s learning environment and change within the learning environment. Currently, there is a paucity of literature examining the relationship between modified teaching practices and student outcomes at the elementary level. The superior measurement properties (interval‐scaled, invariant and hierarchical) of the Rasch based instrument will help to accurately measure change in the classroom environment and could subsequently be used to correlate this measure with student outcomes. Additional reasons for using the Rasch model in this study were its ability to handle reliability and validity issues, to refine questionnaires by improving category functioning and by decreasing the number of items while retaining the psychometric properties of the instrument. Of great importance in the validation process of any instrument is its factor structure. Rasch models are appropriate for the investigation of the dimensionality of scales because the Rasch model constructs a one‐dimensional measurement system from ordinal data. However, more than one latent dimension will always

HJ Boon Development of an instrument to measure Culturally Responsive Pedagogy
8
contribute to empirical data. Multidimensionality becomes a real concern when the response patterns indicate the presence of two or more dimensions so disparate that it is no longer clear what latent dimension the Rasch dimension operationalizes. Factor analysis is widely used in psychometrics to investigate the dimensionality of empirical data. Like other statistical analyses, it operates on interval item scores whereas the item responses are ordinal by nature. Thus results of studies using these methods are disputable. Factor analysis “is confused by ordinal variables and highly correlated factors. Rasch analysis excels at constructing linearity out of ordinality and at aiding the identification of the core construct inside a fog of collinearity” (Schumacker & Linacre, 1996, p. 470). Linacre (1998) showed that Rasch analysis followed by Principal Component Analysis (PCA) of standardized residuals is always more effective at both constructing measures and identifying multidimensionality than standard factor analysis of the original response‐level data. A key issue in the identification of a second dimension is the choice of the critical value of the eigenvalue. Researchers have suggested various critical values. Linacre (2014), however, argues convincingly that an eigenvalue on the Rasch standardised residuals of a value of less than 2 indicates that the implied dimension in the data has less than the strength of two items and has little strength in the data. The teachers’ responses to the 83 item pilot survey instrument analysed using Rasch measurement techniques, allowed both teachers’ performance and item difficulties to be measured using the same metric and placed on the same scale. Rasch calibration was used to evaluate the fit of data to the uni‐dimensionality of the Rasch model and for the validation of the CRP survey. As Linacre (2014) notes: “In test construction, the guiding principle is "all items must be about the same thing, but then be as different as possible”. The central idea is that there is a latent variable which we are attempting to measure people on. The empirical definition of the latent variable is the content of the items. Essentially, we should be able to summarize the items into a sentence which matches our intended definition of the latent variable. Latent variables can be very broad, e.g., "psychological state" or "educational achievement", or very narrow, e.g., "degree of paranoia" or "ability to do long division". In other words, all items share something in common, but each item also brings in something that the others don't have” (p. 479). The 83 items were analyzed using the Rating Scale Model, specifying that a set of items share the same rating scale structure (Linacre 2014). Items were calibrated in terms of the degree to which teachers agreed with the items (this corresponds to item difficulty for the survey) and the category/step thresholds were estimated for each item. A high item difficulty means low levels of agreement with the item. The Winsteps Rasch analysis program (version 3.81.0) was used for analyses. From the matrix of raw scores, the model estimating a linear ability for each teacher and a linear difficulty for each item was developed. These were scaled along a unidimensional continuum ranging from minus to plus infinity (Bond and Fox, 2007). Measurement units were expressed in logits, a logarithm of the ratio of ‘pass’ and ‘fail’ probabilities. Zero was the average item difficulty, in keeping with convention, to overcome known limitations of raw scoring an observational, categorical scale. Fit statistics indicated the extent to which data were unidimensional (Smith, Conrad, Chang & Piazza , 2002) – closeness of observed scores to predicted scoring pattern was expressed by (1) outlier‐sensitive fit (outfit: sensitive to unexpected behaviour affecting responses to items far from a teacher’s ability level); and (2) information‐weighted fit (infit: sensitive to unexpected behaviour affecting responses to items matching teacher’s ability). Both fit statistics must approach 1.0, with acceptable values between 0.6 and 1.4 (Bond & Fox, 2007). Point–biserial correlation coefficients were computed for each item, indicating the extent to which teacher’s scores on an item correlated with whole test scores, thus indicating predictable behaviour of items in relation to ability, or in this case, teacher CRP. The item difficulties and step thresholds as well as indicators of the extent to which each item fitted the model were examined.

HJ Boon Development of an instrument to measure Culturally Responsive Pedagogy
9
6. Results
6.1 Validation of survey items
Rasch analysis was used to assess the survey instrument for uni‐dimensionality and person‐item fit. Of the original 83 items 62 items were retained; these form a unidimensional scale presented in Figure 1. All items are shown in Appendix A, grouped under the categories that were qualitatively determined and quantitatively confirmed. The misfitting items were saved and taken back to the focus group participants to be discussed in light of the quantitative results of the survey. The aim of the Rasch analysis was to provide a psychometrically sound measurement of CRP and the items which were estimated to fit the Rasch model perform this function well. The seven subscales which were qualitatively determined to underpin distinct pedagogical aspects of the CRP scale were assessed in further analyses. The fit indices for the 62 items are reported in Table 2. The results in Table 2 indicate that the point biserial correlations ranged from 0.28 to 0.65, indicating that items are well‐related to the underlying construct. Those items with poor Infit statistics were removed for further qualitative scrutiny and analysis except for four items which we deemed to be essential to the pilot CRP despite being slightly mis‐fitting:
v55: ESL strategies are used when teaching students learning English as a second or additional language. v44: Literacy skills are taught and practiced in the context of modelled age appropriate text. v79: Oral language is used to develop literacy competence in (Standard Australian English) SAE. v81: Intervention is provided for those students not achieving the expected attainment for their age cohort.
Table 2 Item measure, misfit statistics and point biserial correlations for 62 retained items ITEM MEASURE INFIT MNSQ OUTFIT
MNSQ Point bis. correlation
V78 V48 V65 V7 V13 V4 V10 V26 V31 V24 V8 V33 V37 V6 V54 V75 V57 V59 V56 V74 V21 V5 V82 V36 V16 V17 V60 V39 V47 V51 V38
‐1.70 ‐.11 ‐1.67 ‐1.58 ‐2.35 ‐.55 .26 ‐1.25 .36 ‐.46 ‐.80 ‐.06 ‐.60 1.90 ‐1.02 ‐.14 ‐.36 2.83 .22 ‐.43 ‐1.27 .77 ‐.78 1.87 1.52 ‐.55 ‐.59 ‐.51 2.75 .45 ‐.27
1.06 1.02 1.03 1.13 1.01 1.31 1.15 1.19 .76 .89 1.40 .76 1.20 1.14 .90 1.21 .69 1.30 1.14 1.03 .82 .99 .76 1.19 .82 .79 .99 1.13 1.36 1.25 1.10
1.11 1.18 .98 1.20 .90 1.33 1.15 1.11 .82 .84 1.36 .78 1.13 1.22 .88 1.16 .73 1.25 1.13 .97 .79 1.03 .78 1.34 .86 .76 .94 1.14 1.35 1.19 1.04
.28 .28 .29 .30 .32 .35 .37 .38 .39 .40 .41 .41 .44 .44 .44 .45 .45 .46 .46 .46 .48 .48 .48 .48 .48 .49 .49 .49 .49 .50 .50

HJ Boon Development of an instrument to measure Culturally Responsive Pedagogy
10
V40 V53 V73 V9 V76 V67 V23 V79 V32 V85 V25 V34 V49 V86 V41 V71 V55 V72 V42 V52 V81 V62 V35 V80 V44 V68 V28 V69 V43 V58 V61 Mean SD
‐.92 1.39 ‐1.08 .82 .96 ‐.21 1.29 .55 .22 ‐.60 .66 ‐.23 .16 .04 .06 .06 1.41 .30 ‐.41 .16 .09 .15 ‐.64 ‐.59 ‐.17 .18 .36 .12 .76 ‐1.06 .27 ‐‐‐‐‐‐‐‐‐ .00 .99
1.00 1.22 .90 .74 .86 .72 .87 1.52 .80 .84 1.18 .63 .58 .91 1.25 .76 1.45 1.08 .91 .91 1.49 1.03 .69 .64 1.45 .65 .97 .61 .87 .69 1.22 ‐‐‐‐‐ 1.00 .24
.94 1.26 .85 .79 .89 .72 .93 1.49 .80 .82 1.19 .64 .62 .84 1.25 .74 1.50 1.07 .83 .91 1.43 .98 .64 .63 1.29 .68 .97 .64 .91 .66 1.13 ‐‐‐‐ .99 .23
.50 .51 .51 .51 .51 .51 .52 .52 .53 .53 .53 .53 .53 .54 .54 .54 .54 .54 .55 .55 .56 .57 .57 .59 .60 .60 .60 .60 .60 .62 .65 ‐‐‐‐‐‐
A person‐case estimate was conducted and it was found that there were three respondents, whose response format suggested respondent bias or that they were simply responding with the highest category across all questions; these persons’ responses were removed from the analyses. The summary statistics for the overall survey are reported in Table 3.
Table 3 Summary model fit, mean measure and separation for CRP
STATISTIC RAW SCORE
Count Measure Model Error
Infit Outfit
Summary of 138 measured persons (non‐extreme) MNSQ ZSTD MNSQ ZSTDMean 229.7 59.4 1.23 .20 1.00 ‐.1 .98 ‐.2 SD 49.3 11.1 .84 .07 .40 1.9 .36 1.7 Maximum 301.0 62.0 4.39 .61 2.58 5.9 2.14 4.6 Minimum 27.0 7.0 ‐.64 .14 .19 ‐3.5 .24 ‐3.7 Real RMSE .22 TRUE SD .81 separation 3.69 person reliability .93Model RMSE
.21 TRUE SD .81 separation 3.96 person reliability .94
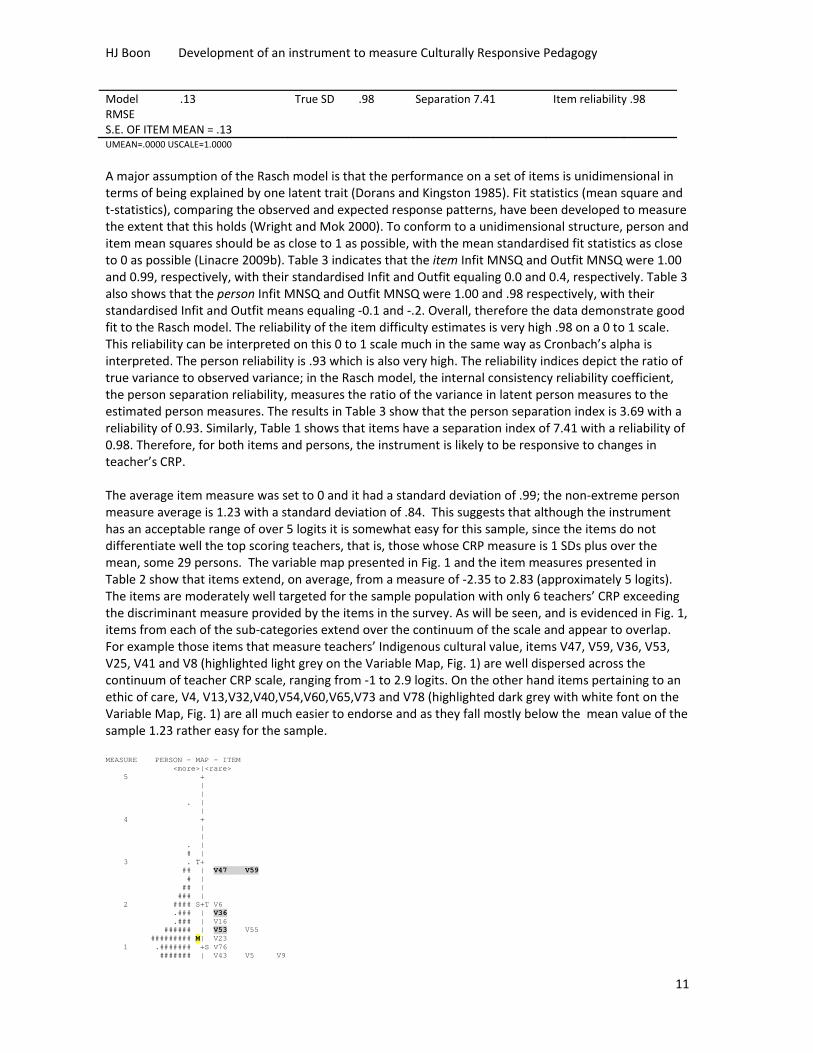
S.E. OF PERSON MEAN = .07 Summary of 62 measured items (non‐extreme) Mean 511.4 132.3 .00 .13 1.00 ‐.1 .99 ‐.2 SD 76.0 2.4 .99 .02 .24 1.8 .23 1.8 Maximum 646.0 138.0 2.83 .19 1.52 3.5 1.50 3.7 Minimum 247.0 131.0 ‐2.35 .09 .58 ‐3.5 .62 ‐3.3 Real RMSE .13 True SD .98 Separation 7.41 Item reliability .98
HJ Boon Development of an instrument to measure Culturally Responsive Pedagogy
11
Model RMSE
.13 True SD .98 Separation 7.41 Item reliability .98
S.E. OF ITEM MEAN = .13 UMEAN=.0000 USCALE=1.0000
A major assumption of the Rasch model is that the performance on a set of items is unidimensional in terms of being explained by one latent trait (Dorans and Kingston 1985). Fit statistics (mean square and t‐statistics), comparing the observed and expected response patterns, have been developed to measure the extent that this holds (Wright and Mok 2000). To conform to a unidimensional structure, person and item mean squares should be as close to 1 as possible, with the mean standardised fit statistics as close to 0 as possible (Linacre 2009b). Table 3 indicates that the item Infit MNSQ and Outfit MNSQ were 1.00 and 0.99, respectively, with their standardised Infit and Outfit equaling 0.0 and 0.4, respectively. Table 3 also shows that the person Infit MNSQ and Outfit MNSQ were 1.00 and .98 respectively, with their standardised Infit and Outfit means equaling ‐0.1 and ‐.2. Overall, therefore the data demonstrate good fit to the Rasch model. The reliability of the item difficulty estimates is very high .98 on a 0 to 1 scale. This reliability can be interpreted on this 0 to 1 scale much in the same way as Cronbach’s alpha is interpreted. The person reliability is .93 which is also very high. The reliability indices depict the ratio of true variance to observed variance; in the Rasch model, the internal consistency reliability coefficient, the person separation reliability, measures the ratio of the variance in latent person measures to the estimated person measures. The results in Table 3 show that the person separation index is 3.69 with a reliability of 0.93. Similarly, Table 1 shows that items have a separation index of 7.41 with a reliability of 0.98. Therefore, for both items and persons, the instrument is likely to be responsive to changes in teacher’s CRP. The average item measure was set to 0 and it had a standard deviation of .99; the non‐extreme person measure average is 1.23 with a standard deviation of .84. This suggests that although the instrument has an acceptable range of over 5 logits it is somewhat easy for this sample, since the items do not differentiate well the top scoring teachers, that is, those whose CRP measure is 1 SDs plus over the mean, some 29 persons. The variable map presented in Fig. 1 and the item measures presented in Table 2 show that items extend, on average, from a measure of ‐2.35 to 2.83 (approximately 5 logits). The items are moderately well targeted for the sample population with only 6 teachers’ CRP exceeding the discriminant measure provided by the items in the survey. As will be seen, and is evidenced in Fig. 1, items from each of the sub‐categories extend over the continuum of the scale and appear to overlap. For example those items that measure teachers’ Indigenous cultural value, items V47, V59, V36, V53, V25, V41 and V8 (highlighted light grey on the Variable Map, Fig. 1) are well dispersed across the continuum of teacher CRP scale, ranging from ‐1 to 2.9 logits. On the other hand items pertaining to an ethic of care, V4, V13,V32,V40,V54,V60,V65,V73 and V78 (highlighted dark grey with white font on the Variable Map, Fig. 1) are all much easier to endorse and as they fall mostly below the mean value of the sample 1.23 rather easy for the sample. MEASURE PERSON - MAP - ITEM <more>|<rare> 5 + | | . | | 4 + | | . | # | 3 . T+ ## | V47 V59 # | ## | ### | 2 #### S+T V6 .### | V36 .### | V16 ###### | V53 V55 ######### M| V23 1 .####### +S V76 ####### | V43 V5 V9

HJ Boon Development of an instrument to measure Culturally Responsive Pedagogy
12
.###### | V25 V79 .## S| V28 V31 V51 V72 #### | V10 V32 V49 V52 V56 V61 V62 V68 V69 0 ### +M V33 V41 V71 V81 V86 # | V34 V38 V44 V48 V67 V75 T| V24 V42 V57 V74 # | V17 V35 V37 V39 V4 V60 V80 V85 | V8 V82 -1 +S V40 V54 V58 V73 | V21 V26 | | V65 V7 V78 | -2 +T | | V13 | | -3 + <less>|<frequent>
Figure 1 Variable map of students and CRP items with lowest and highest response threshold. Note:
Each ‘#’ in the person column is 2 persons: each ‘.’ is 1.
These fit statistics support the construct validity of the instrument and its unidimensional structure. To further confirm the unidimensionality of the CRP a Principal Components Analysis of the standardised residuals was also conducted through Winsteps for the 62 item survey. This analysis showed that the measures accounted for 49.2 % of the variance in the observations; this magnitude of explained variance is reasonable for this type of affective instrument and broadly agrees with other instruments of this type (Linacre 2014; Ludlow et al. 2008). In addition, while the Winsteps’ dimensionality diagnostics indicated that the first contrast’s eigenvalue was equivalent to 4.6 items, since it explained only 3.7 % of the variance in the measures there is no other substantial dimension indicated (Linacre 2014). This is because the variance explained by the items (35.1 %) is 9.5 times greater than the variance accounted for by the first contrast; a variance multiple of greater than four is considered good (Linacre 2014).
The second assumption of local stochastic independence was checked by examining the Standard Errors (S.E.) of each item within each subscale and comparing them to their overall measure. Moreover recalling that over fitting items also show lack of local independence, fit indices were also examined (Bond and Fox, 2007). Stochastic local independence was further investigated by looking at the correlations of standardized residuals (in Winsteps Table 23.99). The usual cut‐off is inter‐item correlations closer to 0 than 0.4. Items with inter‐item correlation greater than 0.7 share more than 50% of their "random" (stochastic) variance and so are far from locally independent. This assumption was generally confirmed (Linacre, 2014) (Appendix B). The third assumption, parallelism of item characteristic curves, was checked in two ways: first graphically by examining the Item Characteristic Curves (ICC) of the items within each construct and second by examining the INFIT Mean Square and OUTFIT Mean Square statistics for each item within each construct. These were between 0.5 – 1. 5, indicating neither too low nor too high, discrimination by respondents (Linacre, 2014).
6.2 Analyses of associations between subscales
Because we were interested in measuring different aspects of CRP as conceptualised through the qualitative phase, we examined the subscales of the CRP in more detail (Indigenous Cultural Value, Self‐regulation Support, Explicitness, Ethic of care, Literacy Teaching, Behaviour Support, Pedagogical Expertise). Statistical results of these analyses are to be found in Appendix B. Because negative measures are more difficult to interpret for non‐technical readers, we rescaled each of the subscales to fit between 0‐100 units with higher numbers indicating a greater probability that the item would be endorsed (for Item ranking) and a greater CRP measure for each teacher (person ability). This is for the convenience of the readers only and does not imply that a person whose score on a subscale is 45 has attained 45% of the subscale measured; it means simply that a person with a score of 45 has greater difficulty endorsing the items on the test than a person whose score is 55.
One of the research questions was specifically concerned with: To what extent do teachers endorse teaching practices that have been identified by Indigenous students and parents as influential in their

HJ Boon Development of an instrument to measure Culturally Responsive Pedagogy
13
learning? A key concern was an examination of the teaching practices that specifically address Indigenous Cultural Values. To that end several analyses were undertaken. Table 4 shows the results of a Pearson’s correlation analysis that was undertaken after the measures of all subscales were rescaled 0‐100, to examine the links between the different aspects of CRP and to see which were most associated with higher levels of Indigenous cultural value.
Table 4 Pearson’s correlations between subscales of CRP (N=138)
1 2 3 4 5 6 7 8
1. ethic of care 1 .656** .514** .673** .554** .583** .567** .776**
2. pedagogical expertise .656** 1 .676** .683** .694** .665** .682** .920**
3. literacy teaching .514** .676** 1 .542** .573** .469** .694** .819**
4. behaviour support .673** .683** .542** 1 .586** .579** .484** .762**
5. explicitness .554** .694** .573** .586** 1 .577** .477** .768**
6. self‐regulation support .583** .665** .469** .579** .577** 1 .443** .715**
7. Indigenous cultural value .567** .682** .694** .484** .477** .443** 1 .807**
8. Total CRP measure .776** .920** .819** .762** .768** .715** .807** 1
**. Correlation is significant at the 0.01 level (2‐tailed).
Results indicated that Indigenous cultural values were highly correlated with pedagogical expertise and literacy teaching, both important underpinning skills characterising quality teaching as indicated by the Phase One outcomes. The total CRP measure was most closely predicted by pedagogical expertise. This is not surprising since the number of items that comprised the subscale pedagogical expertise was 15, compared to an average of 7 items describing each of the other subscales, including the subscales literacy teaching and Indigenous cultural value, the two other biggest predictors of CRP.
6.3 Examination of CRP profiles
It was of interest to us to scrutinise the CRP teaching profiles of some of the participants in the pilot, and examine the differences between those whose CRP measure was the highest (Teachers 3 and 4), compared to those whose measure was the lowest as calculated by Rasch estimates (Figure 2). The observed difference could be interpreted in a range of different ways. One might be that the teachers with a high CRP score are very much more experienced than those with low scores. Or it is possible that the two sets of teachers hold intrinsically different values and goals for teaching, particularly with respect to the value for cultural differences in their students, and self‐regulation support. Teacher 2 in particular, whose low CPR score is consistent across all subscales, might lack teaching self‐efficacy, and as a result might be responding with lower agreement to each item because they have lost their confidence in their teaching ability. Another alternative explanation might be teacher burn‐out; Teacher 2 might have lost all interest in teaching and therefore has responded with low endorsement throughout the survey instrument. To clarify more precisely why these differences exist, it would be useful to either observe these teachers teaching or to interview them individually.

HJ Boon Development of an instrument to measure Culturally Responsive Pedagogy
14
Figure 2 Graphical representations of measures of CRP and 7 subscales for 4 different teachers
In addition it was considered important in the context of CRP to look at the overall patterns of the various subscales in comparison to the CRP measures of the sample. The range and variability of the different subscales compared to the overall CRP measure are graphically shown in Figure 3. Descriptive statistics of the various scales are displayed in Table 5. It is evident from Table 5 and Figure 3 that although the range, S.D. and means of the subscales are not significantly different there is strong variability present within the measures of the subscales comprising each teacher’s CRP.
Table 5 Mean, Standard Deviation, Range, Minimum and Maximum measures of all scales (N=138)
Range Minimum Maximum Mean S. D.
ethic of care 38.46 37.90 76.36 54.10 7.96
pedagogical expertise 42.45 35.48 77.93 53.51 6.50
literacy teaching 46.68 30.73 77.41 53.85 8.43
behaviour support 39.78 38.24 78.02 54.09 7.98
explicitness 41.05 37.38 78.43 53.83 7.62
self-regulation support 40.60 38.27 78.87 53.39 6.24
Indigenous cultural value 39.14 38.81 77.95 53.30 6.84
total CRP 34.10 40.70 74.80 53.33 5.73
20
30
40
50
60
70
80
R
A
S
C
H
M
E
A
S
U
R
E
teacher 1
teacher 2
teacher 3
teacher 4

HJ Boon Development of an instrument to measure Culturally Responsive Pedagogy
15
Figure 3 Mean Rasch measures of CRP by all subscales (N=138).
There are clear variations in the teacher CRP profiles when one examines the means of each subscale plotted against the means of the CRP measures (Figure 3); variability which is concealed when one looks at the overall means (Table 5). The least variable subscale is pedagogical expertise, which is clearly closely aligned to overall CRP. In Figure 3, the mean values of the CRP have been calculated by grouping together individuals’ whose CRP is within a range of 3‐5 points, from a total CRP range of 40.7 to 74.8. Thus a CRP mean of 1 represents the mean of those individuals whose CRP measure was 40.70 to 44.77, a mean of 12 represents those individuals whose CRP measure ranged from 61.3 to 64.9 and so on. It is clear that the subscales deviate considerably from a straight line that might be expected when plotting CRP against each subscale. This deviation is stronger at both ends of the distribution. The subscales that seem to generally fall below the others are self‐regulation support and Indigenous cultural value, with a strong variability being demonstrated in literacy teaching as well. There could be various ways of explaining particular teacher CRP profiles. For example, one might infer that a teacher with a CRP mean of 2 (representing 10 teachers in this sample) is likely to be very supportive of self‐regulation, but have much lower focus on Indigenous cultural value inclusion in their class, a lower literacy teaching focus and fewer strategies characterising pedagogical expertise. Conversely, a teacher with a CRP mean of 12 (representing 7 teachers) might be predicted to have a strong focus on explicit teaching, literacy teaching and to demonstrate a range of strategies that characterise pedagogical expertise, but their focus on self‐regulation support and Indigenous cultural values is likely to be much lower.

HJ Boon Development of an instrument to measure Culturally Responsive Pedagogy
16
Analyses suggest that some of this variability is related to the teaching context of teachers, that is whether they are in secondary or elementary schools. Analyses of variance (ANOVAs) showed that significant differences occurred between elementary and secondary teachers in their overall CRP measure (F(1,136) = 5.89, p <0.05), in their Indigenous cultural value (F(1,136) = 7.18, p <0.005), behaviour support (F(1,136) = 10.12, p <0.005), literacy teaching (F(1,136) = 8.50, p <0.005), and pedagogical expertise (F(1,136) = 4.72, p <0.05). These differences are represented in Figure 4.
Figure 4 Comparison of mean measures of all subscales for Elementary and Secondary teachers.
7. Discussion The purpose of this paper was to report initial findings from the validation and piloting of a survey instrument designed to examine teachers’ endorsement of CRP. Results demonstrate that the instrument is well constructed to measure the intended latent construct, CRP. Analyses of results indicate that there are indeed variations in the way teachers approach their professional duties and the emphasis they place on particular professional aspects of their daily work. This is particularly the case with respect to CRP overall, as there is a large range of CRP measures. It is also the case in relation to Indigenous cultural value, literacy teaching, behaviour support, explicitness and pedagogical expertise. Moreover, as illustrated by results, while any two teachers might have a very similar overall measure for CRP, this measure might be weighted more strongly on the basis of one subscale than another, and thus no two teachers are likely to offer similar levels of qualitative support to students, for example, in demonstrating Indigenous cultural value or promoting self‐regulation. This is not an unexpected situation since teachers have a range of strengths and values with regard to their teaching approach. Additionally, it is possible that the environments teachers are in call for or encourage emphasis on specific subscales. For instance a secondary Information Technology teacher might not emphasise literacy skills in their lessons because their priority is on teaching keyboard and computing skills. What is of concern however, is the situation where a group of students, namely Indigenous students, are taught in a classroom where an appreciation of their cultural identity is not evident in the teacher’s professional repertoire or the hidden curriculum that is presented to the students, a message that is often very clear and easily interpreted by the learner (Boon, 2011).
HJ Boon Development of an instrument to measure Culturally Responsive Pedagogy
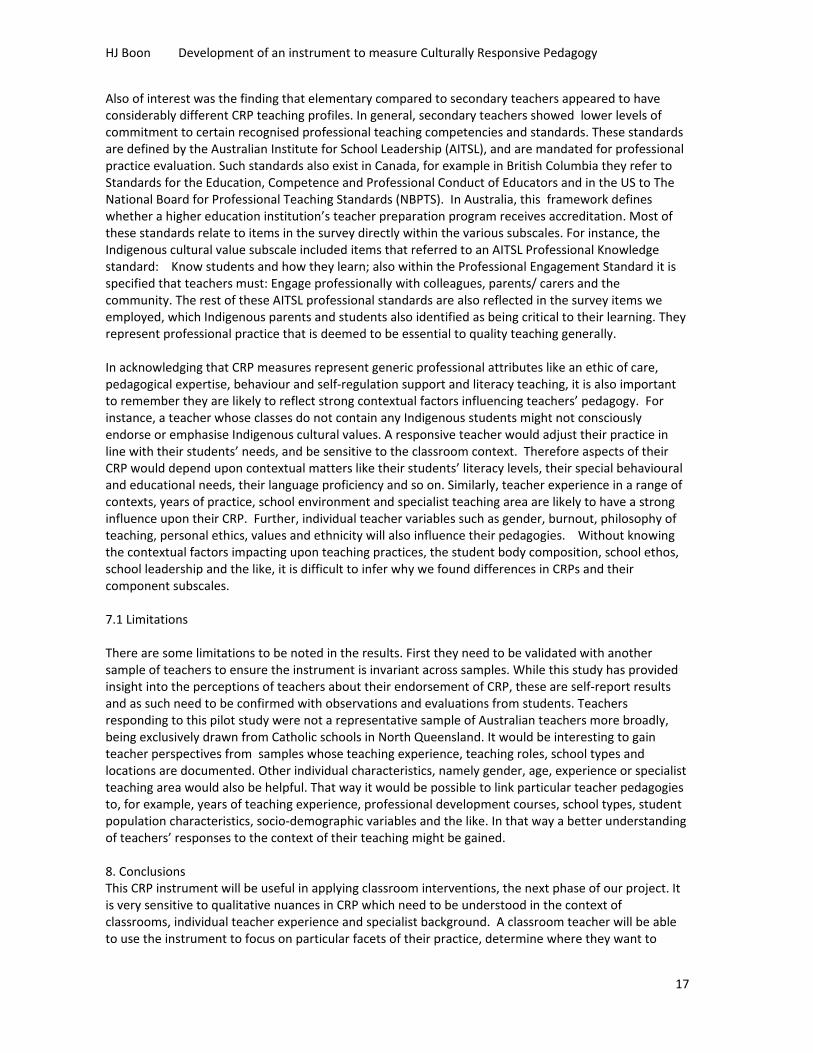
17
Also of interest was the finding that elementary compared to secondary teachers appeared to have considerably different CRP teaching profiles. In general, secondary teachers showed lower levels of commitment to certain recognised professional teaching competencies and standards. These standards are defined by the Australian Institute for School Leadership (AITSL), and are mandated for professional practice evaluation. Such standards also exist in Canada, for example in British Columbia they refer to Standards for the Education, Competence and Professional Conduct of Educators and in the US to The National Board for Professional Teaching Standards (NBPTS). In Australia, this framework defines whether a higher education institution’s teacher preparation program receives accreditation. Most of these standards relate to items in the survey directly within the various subscales. For instance, the Indigenous cultural value subscale included items that referred to an AITSL Professional Knowledge standard: Know students and how they learn; also within the Professional Engagement Standard it is specified that teachers must: Engage professionally with colleagues, parents/ carers and the community. The rest of these AITSL professional standards are also reflected in the survey items we employed, which Indigenous parents and students also identified as being critical to their learning. They represent professional practice that is deemed to be essential to quality teaching generally. In acknowledging that CRP measures represent generic professional attributes like an ethic of care, pedagogical expertise, behaviour and self‐regulation support and literacy teaching, it is also important to remember they are likely to reflect strong contextual factors influencing teachers’ pedagogy. For instance, a teacher whose classes do not contain any Indigenous students might not consciously endorse or emphasise Indigenous cultural values. A responsive teacher would adjust their practice in line with their students’ needs, and be sensitive to the classroom context. Therefore aspects of their CRP would depend upon contextual matters like their students’ literacy levels, their special behavioural and educational needs, their language proficiency and so on. Similarly, teacher experience in a range of contexts, years of practice, school environment and specialist teaching area are likely to have a strong influence upon their CRP. Further, individual teacher variables such as gender, burnout, philosophy of teaching, personal ethics, values and ethnicity will also influence their pedagogies. Without knowing the contextual factors impacting upon teaching practices, the student body composition, school ethos, school leadership and the like, it is difficult to infer why we found differences in CRPs and their component subscales. 7.1 Limitations There are some limitations to be noted in the results. First they need to be validated with another sample of teachers to ensure the instrument is invariant across samples. While this study has provided insight into the perceptions of teachers about their endorsement of CRP, these are self‐report results and as such need to be confirmed with observations and evaluations from students. Teachers responding to this pilot study were not a representative sample of Australian teachers more broadly, being exclusively drawn from Catholic schools in North Queensland. It would be interesting to gain teacher perspectives from samples whose teaching experience, teaching roles, school types and locations are documented. Other individual characteristics, namely gender, age, experience or specialist teaching area would also be helpful. That way it would be possible to link particular teacher pedagogies to, for example, years of teaching experience, professional development courses, school types, student population characteristics, socio‐demographic variables and the like. In that way a better understanding of teachers’ responses to the context of their teaching might be gained. 8. Conclusions This CRP instrument will be useful in applying classroom interventions, the next phase of our project. It is very sensitive to qualitative nuances in CRP which need to be understood in the context of classrooms, individual teacher experience and specialist background. A classroom teacher will be able to use the instrument to focus on particular facets of their practice, determine where they want to

HJ Boon Development of an instrument to measure Culturally Responsive Pedagogy
18
make adjustments, and through self‐assessment and independent observations, measure changes in their CRP. It is the purpose of the next phase of our project to investigate whether and to what extent adjustments in a teacher’s CRP effect changes in their students’ outcomes. The instrument can also be used in diverse school contexts to measure quality pedagogy more generally since the subscales can be applied independently to assess specific aspects of professional practice.
Acknowledgements Data for this project were collected through the assistance of an Australian Research Council Linkage Grant (LP130100420)2013–2016. We would like to acknowledge the teachers and school executive staff at our partner schools who contributed to this research.
Appendix A Retained survey items comprising the CRP scale grouped by sub‐scale
Indigenous Cultural Value V8 : Students specific cultural identities are valued in this classroom V25 : I communicate personally with families V36 : Resources with local Indigenous content are provided V41 : Cultural values are verbally endorsed V47 : Relatives.and.community.Elders.are.invited.to.contribute.to.or.observe.classroom.learning V53 : Contemporary.Aboriginal.and.Torres.Strait.islander.perspectives.are.included.in.all.subject.areas V59 : Local community has input into curriculum content and process Explicitness V62 : Individual.scaffolding.is.provided.to.all.students.so.each.can.perform.required.learning.tasks V57 : I ensure my explanations are succinct V35 : The learning priorities of the classroom are made clear

HJ Boon Development of an instrument to measure Culturally Responsive Pedagogy
19
V10 : Learning objectives are displayed and articulated V17 : I give constructive individual feedback V24 : The.learning.focus.for.lessons.is.orally.communicated.throughout.lessons Self‐regulation Support V67 : Students.are.given.time.to.think.things.through.in.their.own.minds V71 : I use individual student’s strengths to support individual and collective learning V74 : Lessons are paced to allow students time for task completion V76 : Students reflect on their goal achievement V82 : Time.is.given.for.students.to.respond.to.questions.or.during.discussion V28 : Individual goals for student achievement are established V31 : Students.work.together.and.help.others.on.activities.and.problems V16 : Students are given choices about work e.g. modes content timing order of tasks where to work V23 : Students conduct self‐assessments of work completed V39 : I act as a learning facilitator V49 : Students are provided with time to ensure mastery of ideas Ethic of care
V4 : I.ensure.that.students.know.that.their.success.and.value.is.not.determined.only.by.academic.achievement
V13 : I have a warm respectful manner to all students V32 : I.spend.individual.time.with.all.students.in.matters.pertaining.to.their.learning V40 : I communicate high academic expectations for students V54 : I.engage.with.all.students.in.positive.conversation.in.matters.that.display.evidence.of.my.interest.in.the.student V60 : I.explicitly.encourage.learner.development.in.the.broad.sense..not.just.academic.learning V65 : I positively acknowledge all students verbally or non‐verbally outside the classroom
V73 : Learning success is celebrated V78 : I display positive gestures e.g. smiles towards all students Literacy Teaching
V6 : Buddy reading occurs V38 : The.vocabulary.and.language.of.each.curriculum.area.are.explicitly.taught V44 : Literacy.skills.are.taught.and.practiced.in.the.context.of.modelled.age.appropriate.text V55 : ESL strategies are used when teaching students learning English as a second or additional language V61 : Basic literacy skills are regularly revised V72 : I orientate students to the vocabulary background knowledge and features of a text before reading V79 : Oral language is used to develop literacy competence in SAE Behaviour support
V58 : Skills and behaviours are modelled for students V48 : I.address.off.task.behaviour.with.less.intrusive.correction.skills.such.as.non.verbal.cues.and.proximity V43 : Students.are.able.to.contribute.to.the.setting.of.the.behavioural.expectations.for.the.classroom V37 : Routines.provide.students.with.foreknowledge.of.activities.and.expectations V26 : Consequences for student behaviour are made clear V21 : I.communicate.and.follow.through.on.expectations.about.expected.classroom.behaviour V7 : I communicate high behavioural expectations for students Pedagogical Expertise
V85 : Many.examples.are.provided.to.support.students.in their learning V86 : Tasks.carried.out.encourage.student.creativity.and.independent.thinking
V80 : I use multiple strategies to assist students in their learning
V81 : Intervention.is.provided.for.those.students.not.achieving.the.expected.attainment.for.their.age.cohort V75 : Students show their learning in various ways not just written V68 : Learning.and.assessment.are.placed.within.the.broader.contexts.of.what.is.familiar.to.students V69 : Learning.experiences.that.cater.for.a.variety.of.learning.preferences.are.provided V56 : Learning is chunked into short teaching segments V51 : Hands on experiential activities are provided to support learning V52 : I model thinking processes aloud V33 : Multiple methods are used to explain abstract ideas V34 : Students are provided with many opportunities to master skills V5 : Narrative and story are used across the content areas V9 : Open ended learning activities are provided V42 : Visual images are used to support understanding of ideas
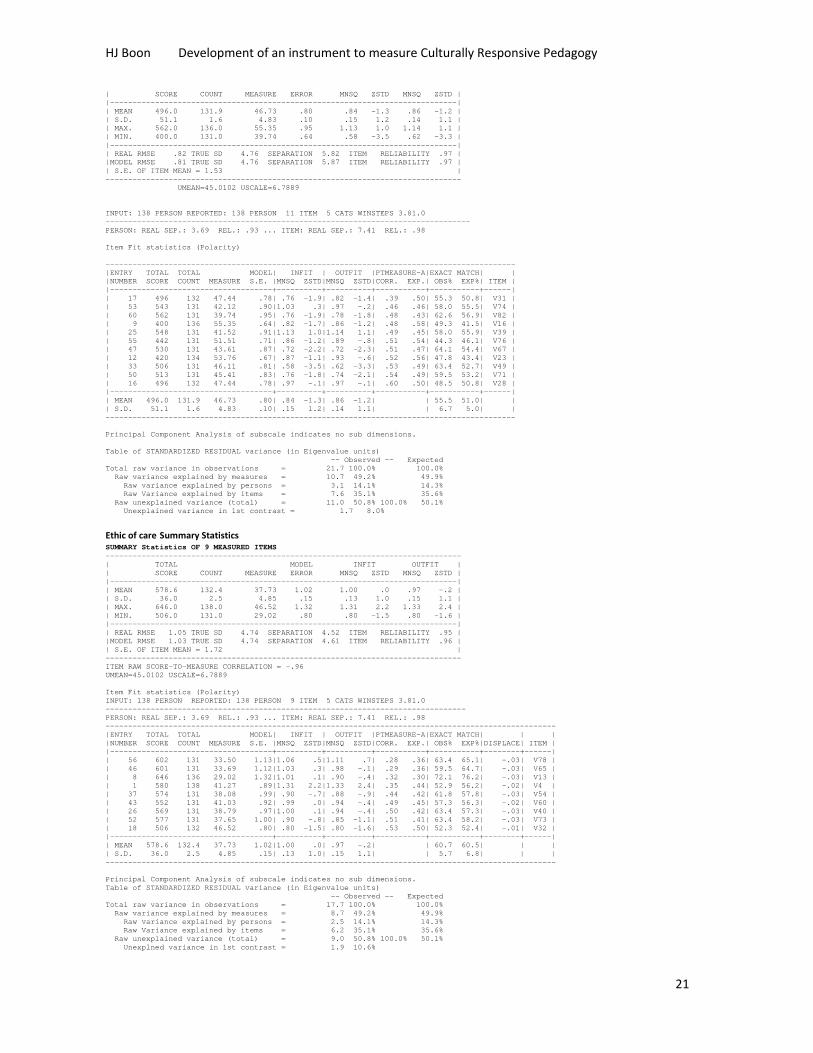
Appendix B Summary Statistics of analyses of 7 subscales of the CRP survey
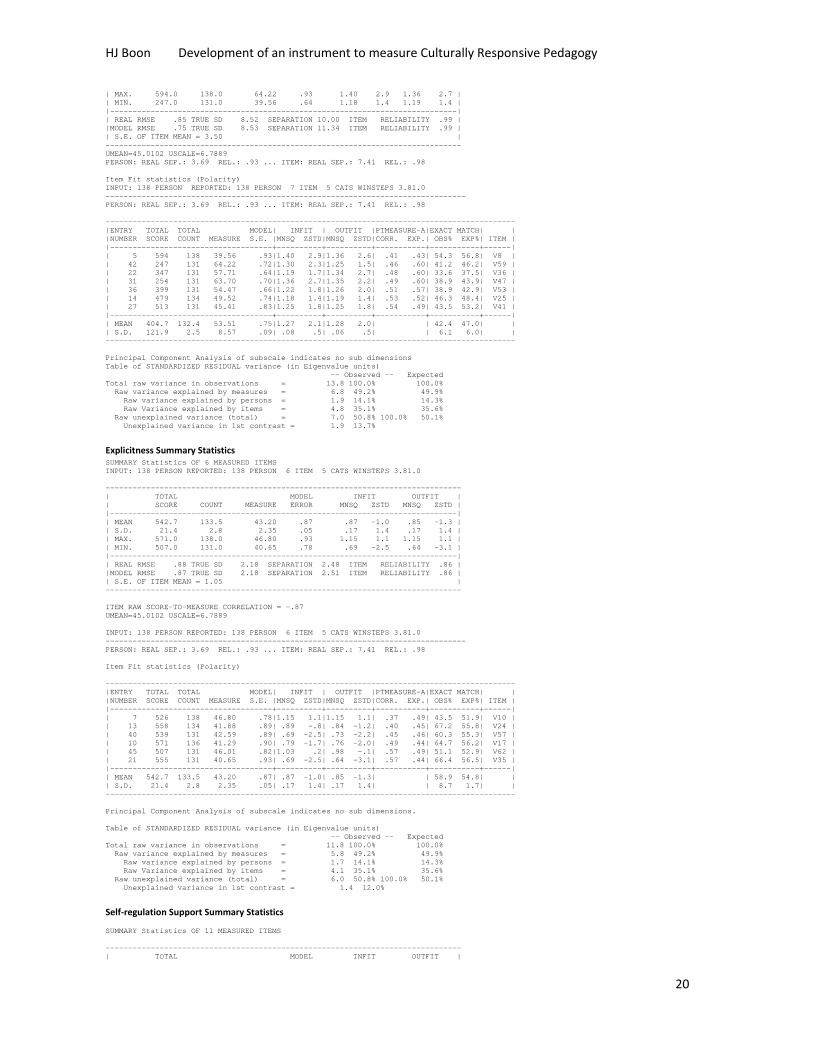
Indigenous Cultural Value Summary Statistics INPUT: 138 PERSON REPORTED: 138 PERSON 7 ITEM 5 CATS WINSTEPS 3.81.0 -------------------------------------------------------------------------------- SUMMARY Statistics OF 7 MEASURED ITEMS ------------------------------------------------------------------------------- | TOTAL MODEL INFIT OUTFIT | | SCORE COUNT MEASURE ERROR MNSQ ZSTD MNSQ ZSTD | |-----------------------------------------------------------------------------| | MEAN 404.7 132.4 53.51 .75 1.27 2.1 1.28 2.0 | | S.D. 121.9 2.5 8.57 .09 .08 .5 .06 .5 |
HJ Boon Development of an instrument to measure Culturally Responsive Pedagogy
20
| MAX. 594.0 138.0 64.22 .93 1.40 2.9 1.36 2.7 | | MIN. 247.0 131.0 39.56 .64 1.18 1.4 1.19 1.4 | |-----------------------------------------------------------------------------| | REAL RMSE .85 TRUE SD 8.52 SEPARATION 10.00 ITEM RELIABILITY .99 | |MODEL RMSE .75 TRUE SD 8.53 SEPARATION 11.34 ITEM RELIABILITY .99 | | S.E. OF ITEM MEAN = 3.50 | ------------------------------------------------------------------------------- UMEAN=45.0102 USCALE=6.7889 PERSON: REAL SEP.: 3.69 REL.: .93 ... ITEM: REAL SEP.: 7.41 REL.: .98 Item Fit statistics (Polarity) INPUT: 138 PERSON REPORTED: 138 PERSON 7 ITEM 5 CATS WINSTEPS 3.81.0 -------------------------------------------------------------------------------- PERSON: REAL SEP.: 3.69 REL.: .93 ... ITEM: REAL SEP.: 7.41 REL.: .98 ------------------------------------------------------------------------------------------- |ENTRY TOTAL TOTAL MODEL| INFIT | OUTFIT |PTMEASURE-A|EXACT MATCH| | |NUMBER SCORE COUNT MEASURE S.E. |MNSQ ZSTD|MNSQ ZSTD|CORR. EXP.| OBS% EXP%| ITEM | |------------------------------------+----------+----------+-----------+-----------+------| | 5 594 138 39.56 .93|1.40 2.9|1.36 2.6| .41 .43| 54.3 56.8| V8 | | 42 247 131 64.22 .72|1.30 2.3|1.25 1.5| .46 .60| 41.2 46.2| V59 | | 22 347 131 57.71 .64|1.19 1.7|1.34 2.7| .48 .60| 33.6 37.5| V36 | | 31 254 131 63.70 .70|1.36 2.7|1.35 2.2| .49 .60| 38.9 43.9| V47 | | 36 399 131 54.47 .66|1.22 1.8|1.26 2.0| .51 .57| 38.9 42.9| V53 | | 14 479 134 49.52 .74|1.18 1.4|1.19 1.4| .53 .52| 46.3 48.4| V25 | | 27 513 131 45.41 .83|1.25 1.8|1.25 1.8| .54 .49| 43.5 53.2| V41 | |------------------------------------+----------+----------+-----------+-----------+------| | MEAN 404.7 132.4 53.51 .75|1.27 2.1|1.28 2.0| | 42.4 47.0| | | S.D. 121.9 2.5 8.57 .09| .08 .5| .06 .5| | 6.1 6.0| | ------------------------------------------------------------------------------------------- Principal Component Analysis of subscale indicates no sub dimensions Table of STANDARDIZED RESIDUAL variance (in Eigenvalue units) -- Observed -- Expected Total raw variance in observations = 13.8 100.0% 100.0% Raw variance explained by measures = 6.8 49.2% 49.9% Raw variance explained by persons = 1.9 14.1% 14.3% Raw Variance explained by items = 4.8 35.1% 35.6% Raw unexplained variance (total) = 7.0 50.8% 100.0% 50.1% Unexplained variance in 1st contrast = 1.9 13.7%
Explicitness Summary Statistics SUMMARY Statistics OF 6 MEASURED ITEMS INPUT: 138 PERSON REPORTED: 138 PERSON 6 ITEM 5 CATS WINSTEPS 3.81.0 ------------------------------------------------------------------------------- | TOTAL MODEL INFIT OUTFIT | | SCORE COUNT MEASURE ERROR MNSQ ZSTD MNSQ ZSTD | |-----------------------------------------------------------------------------| | MEAN 542.7 133.5 43.20 .87 .87 -1.0 .85 -1.3 | | S.D. 21.4 2.8 2.35 .05 .17 1.4 .17 1.4 | | MAX. 571.0 138.0 46.80 .93 1.15 1.1 1.15 1.1 | | MIN. 507.0 131.0 40.65 .78 .69 -2.5 .64 -3.1 | |-----------------------------------------------------------------------------| | REAL RMSE .88 TRUE SD 2.18 SEPARATION 2.48 ITEM RELIABILITY .86 | |MODEL RMSE .87 TRUE SD 2.18 SEPARATION 2.51 ITEM RELIABILITY .86 | | S.E. OF ITEM MEAN = 1.05 | ------------------------------------------------------------------------------- ITEM RAW SCORE-TO-MEASURE CORRELATION = -.87 UMEAN=45.0102 USCALE=6.7889 INPUT: 138 PERSON REPORTED: 138 PERSON 6 ITEM 5 CATS WINSTEPS 3.81.0 -------------------------------------------------------------------------------- PERSON: REAL SEP.: 3.69 REL.: .93 ... ITEM: REAL SEP.: 7.41 REL.: .98 Item Fit statistics (Polarity) ------------------------------------------------------------------------------------------- |ENTRY TOTAL TOTAL MODEL| INFIT | OUTFIT |PTMEASURE-A|EXACT MATCH| | |NUMBER SCORE COUNT MEASURE S.E. |MNSQ ZSTD|MNSQ ZSTD|CORR. EXP.| OBS% EXP%| ITEM | |------------------------------------+----------+----------+-----------+-----------+------| | 7 526 138 46.80 .78|1.15 1.1|1.15 1.1| .37 .49| 43.5 51.9| V10 | | 13 558 134 41.88 .89| .89 -.8| .84 -1.2| .40 .45| 67.2 55.8| V24 | | 40 539 131 42.59 .89| .69 -2.5| .73 -2.2| .45 .46| 60.3 55.3| V57 | | 10 571 136 41.29 .90| .79 -1.7| .76 -2.0| .49 .44| 64.7 56.2| V17 | | 45 507 131 46.01 .82|1.03 .2| .98 -.1| .57 .49| 51.1 52.9| V62 | | 21 555 131 40.65 .93| .69 -2.5| .64 -3.1| .57 .44| 66.4 56.5| V35 | |------------------------------------+----------+----------+-----------+-----------+------| | MEAN 542.7 133.5 43.20 .87| .87 -1.0| .85 -1.3| | 58.9 54.8| | | S.D. 21.4 2.8 2.35 .05| .17 1.4| .17 1.4| | 8.7 1.7| | ------------------------------------------------------------------------------------------- Principal Component Analysis of subscale indicates no sub dimensions. Table of STANDARDIZED RESIDUAL variance (in Eigenvalue units) -- Observed -- Expected Total raw variance in observations = 11.8 100.0% 100.0% Raw variance explained by measures = 5.8 49.2% 49.9% Raw variance explained by persons = 1.7 14.1% 14.3% Raw Variance explained by items = 4.1 35.1% 35.6% Raw unexplained variance (total) = 6.0 50.8% 100.0% 50.1% Unexplained variance in 1st contrast = 1.4 12.0%
Self‐regulation Support Summary Statistics SUMMARY Statistics OF 11 MEASURED ITEMS ------------------------------------------------------------------------------- | TOTAL MODEL INFIT OUTFIT |
HJ Boon Development of an instrument to measure Culturally Responsive Pedagogy
21
| SCORE COUNT MEASURE ERROR MNSQ ZSTD MNSQ ZSTD | |-----------------------------------------------------------------------------| | MEAN 496.0 131.9 46.73 .80 .84 -1.3 .86 -1.2 | | S.D. 51.1 1.6 4.83 .10 .15 1.2 .14 1.1 | | MAX. 562.0 136.0 55.35 .95 1.13 1.0 1.14 1.1 | | MIN. 400.0 131.0 39.74 .64 .58 -3.5 .62 -3.3 | |-----------------------------------------------------------------------------| | REAL RMSE .82 TRUE SD 4.76 SEPARATION 5.82 ITEM RELIABILITY .97 | |MODEL RMSE .81 TRUE SD 4.76 SEPARATION 5.87 ITEM RELIABILITY .97 | | S.E. OF ITEM MEAN = 1.53 | ------------------------------------------------------------------------------- UMEAN=45.0102 USCALE=6.7889 INPUT: 138 PERSON REPORTED: 138 PERSON 11 ITEM 5 CATS WINSTEPS 3.81.0 --------------------------------------------------------------------------------- PERSON: REAL SEP.: 3.69 REL.: .93 ... ITEM: REAL SEP.: 7.41 REL.: .98 Item Fit statistics (Polarity) ------------------------------------------------------------------------------------------- |ENTRY TOTAL TOTAL MODEL| INFIT | OUTFIT |PTMEASURE-A|EXACT MATCH| | |NUMBER SCORE COUNT MEASURE S.E. |MNSQ ZSTD|MNSQ ZSTD|CORR. EXP.| OBS% EXP%| ITEM | |------------------------------------+----------+----------+-----------+-----------+------| | 17 496 132 47.44 .78| .76 -1.9| .82 -1.4| .39 .50| 55.3 50.8| V31 | | 53 543 131 42.12 .90|1.03 .3| .97 -.2| .46 .46| 58.0 55.5| V74 | | 60 562 131 39.74 .95| .76 -1.9| .78 -1.8| .48 .43| 62.6 56.9| V82 | | 9 400 136 55.35 .64| .82 -1.7| .86 -1.2| .48 .58| 49.3 41.5| V16 | | 25 548 131 41.52 .91|1.13 1.0|1.14 1.1| .49 .45| 58.0 55.9| V39 | | 55 442 131 51.51 .71| .86 -1.2| .89 -.8| .51 .54| 44.3 46.1| V76 | | 47 530 131 43.61 .87| .72 -2.2| .72 -2.3| .51 .47| 64.1 54.4| V67 | | 12 420 134 53.76 .67| .87 -1.1| .93 -.6| .52 .56| 47.8 43.4| V23 | | 33 506 131 46.11 .81| .58 -3.5| .62 -3.3| .53 .49| 63.4 52.7| V49 | | 50 513 131 45.41 .83| .76 -1.8| .74 -2.1| .54 .49| 59.5 53.2| V71 | | 16 496 132 47.44 .78| .97 -.1| .97 -.1| .60 .50| 48.5 50.8| V28 | |------------------------------------+----------+----------+-----------+-----------+------| | MEAN 496.0 131.9 46.73 .80| .84 -1.3| .86 -1.2| | 55.5 51.0| | | S.D. 51.1 1.6 4.83 .10| .15 1.2| .14 1.1| | 6.7 5.0| | ------------------------------------------------------------------------------------------- Principal Component Analysis of subscale indicates no sub dimensions. Table of STANDARDIZED RESIDUAL variance (in Eigenvalue units) -- Observed -- Expected Total raw variance in observations = 21.7 100.0% 100.0% Raw variance explained by measures = 10.7 49.2% 49.9% Raw variance explained by persons = 3.1 14.1% 14.3% Raw Variance explained by items = 7.6 35.1% 35.6% Raw unexplained variance (total) = 11.0 50.8% 100.0% 50.1% Unexplained variance in 1st contrast = 1.7 8.0%
Ethic of care Summary Statistics SUMMARY Statistics OF 9 MEASURED ITEMS ------------------------------------------------------------------------------- | TOTAL MODEL INFIT OUTFIT | | SCORE COUNT MEASURE ERROR MNSQ ZSTD MNSQ ZSTD | |-----------------------------------------------------------------------------| | MEAN 578.6 132.4 37.73 1.02 1.00 .0 .97 -.2 | | S.D. 36.0 2.5 4.85 .15 .13 1.0 .15 1.1 | | MAX. 646.0 138.0 46.52 1.32 1.31 2.2 1.33 2.4 | | MIN. 506.0 131.0 29.02 .80 .80 -1.5 .80 -1.6 | |-----------------------------------------------------------------------------| | REAL RMSE 1.05 TRUE SD 4.74 SEPARATION 4.52 ITEM RELIABILITY .95 | |MODEL RMSE 1.03 TRUE SD 4.74 SEPARATION 4.61 ITEM RELIABILITY .96 | | S.E. OF ITEM MEAN = 1.72 | ------------------------------------------------------------------------------- ITEM RAW SCORE-TO-MEASURE CORRELATION = -.96 UMEAN=45.0102 USCALE=6.7889 Item Fit statistics (Polarity) INPUT: 138 PERSON REPORTED: 138 PERSON 9 ITEM 5 CATS WINSTEPS 3.81.0 -------------------------------------------------------------------------------- PERSON: REAL SEP.: 3.69 REL.: .93 ... ITEM: REAL SEP.: 7.41 REL.: .98 ---------------------------------------------------------------------------------------------------- |ENTRY TOTAL TOTAL MODEL| INFIT | OUTFIT |PTMEASURE-A|EXACT MATCH| | | |NUMBER SCORE COUNT MEASURE S.E. |MNSQ ZSTD|MNSQ ZSTD|CORR. EXP.| OBS% EXP%|DISPLACE| ITEM | |------------------------------------+----------+----------+-----------+-----------+--------+------| | 56 602 131 33.50 1.13|1.06 .5|1.11 .7| .28 .36| 63.4 65.1| -.03| V78 | | 46 601 131 33.69 1.12|1.03 .3| .98 -.1| .29 .36| 59.5 64.7| -.03| V65 | | 8 646 136 29.02 1.32|1.01 .1| .90 -.4| .32 .30| 72.1 76.2| -.03| V13 | | 1 580 138 41.27 .89|1.31 2.2|1.33 2.4| .35 .44| 52.9 56.2| -.02| V4 | | 37 574 131 38.08 .99| .90 -.7| .88 -.9| .44 .42| 61.8 57.8| -.03| V54 | | 43 552 131 41.03 .92| .99 .0| .94 -.4| .49 .45| 57.3 56.3| -.02| V60 | | 26 569 131 38.79 .97|1.00 .1| .94 -.4| .50 .42| 63.4 57.3| -.03| V40 | | 52 577 131 37.65 1.00| .90 -.8| .85 -1.1| .51 .41| 63.4 58.2| -.03| V73 | | 18 506 132 46.52 .80| .80 -1.5| .80 -1.6| .53 .50| 52.3 52.4| -.01| V32 | |------------------------------------+----------+----------+-----------+-----------+--------+------| | MEAN 578.6 132.4 37.73 1.02|1.00 .0| .97 -.2| | 60.7 60.5| | | | S.D. 36.0 2.5 4.85 .15| .13 1.0| .15 1.1| | 5.7 6.8| | | ---------------------------------------------------------------------------------------------------- Principal Component Analysis of subscale indicates no sub dimensions. Table of STANDARDIZED RESIDUAL variance (in Eigenvalue units) -- Observed -- Expected Total raw variance in observations = 17.7 100.0% 100.0% Raw variance explained by measures = 8.7 49.2% 49.9% Raw variance explained by persons = 2.5 14.1% 14.3% Raw Variance explained by items = 6.2 35.1% 35.6% Raw unexplained variance (total) = 9.0 50.8% 100.0% 50.1% Unexplned variance in 1st contrast = 1.9 10.6%

HJ Boon Development of an instrument to measure Culturally Responsive Pedagogy
22
Literacy Teaching Summary Statistics SUMMARY Statistics OF 7 MEASURED ITEMS ------------------------------------------------------------------------------- | TOTAL MODEL INFIT OUTFIT | | SCORE COUNT MEASURE ERROR MNSQ ZSTD MNSQ ZSTD | |-----------------------------------------------------------------------------| | MEAN 470.4 132.0 48.88 .77 1.28 2.0 1.25 1.8 | | S.D. 60.6 2.4 5.07 .09 .17 1.1 .18 1.2 | | MAX. 534.0 138.0 57.92 .88 1.52 3.5 1.50 3.7 | | MIN. 363.0 131.0 43.17 .63 1.08 .6 1.04 .4 | |-----------------------------------------------------------------------------| | REAL RMSE .87 TRUE SD 4.99 SEPARATION 5.72 ITEM RELIABILITY .97 | |MODEL RMSE .77 TRUE SD 5.01 SEPARATION 6.48 ITEM RELIABILITY .98 | | S.E. OF ITEM MEAN = 2.07 | ------------------------------------------------------------------------------- UMEAN=45.0102 USCALE=6.7889 INPUT: 138 PERSON 62 ITEM REPORTED: 138 PERSON 7 ITEM 5 CATS WINSTEPS 3.81.0 -------------------------------------------------------------------------------- PERSON: REAL SEP.: 3.69 REL.: .93 ... ITEM: REAL SEP.: 7.41 REL.: .98 Item Fit statistics (Polarity) ------------------------------------------------------------------------------------------- |ENTRY TOTAL TOTAL MODEL| INFIT | OUTFIT |PTMEASURE-A|EXACT MATCH| | |NUMBER SCORE COUNT MEASURE S.E. |MNSQ ZSTD|MNSQ ZSTD|CORR. EXP.| OBS% EXP%| ITEM | |------------------------------------+----------+----------+-----------+-----------+------| | 3 363 138 57.92 .63|1.14 1.3|1.22 1.8| .44 .59| 39.1 37.3| V6 | | 24 534 131 43.17 .88|1.10 .7|1.04 .4| .50 .47| 58.0 54.8| V38 | | 57 477 131 48.75 .76|1.52 3.4|1.49 3.3| .52 .52| 39.7 49.4| V79 | | 38 397 131 54.60 .66|1.45 3.5|1.50 3.7| .54 .57| 35.1 43.2| V55 | | 51 496 131 47.06 .79|1.08 .6|1.07 .5| .54 .50| 55.0 51.4| V72 | | 30 528 131 43.83 .86|1.45 2.9|1.29 2.0| .60 .47| 44.3 54.2| V44 | | 44 498 131 46.87 .80|1.22 1.6|1.13 1.0| .65 .50| 48.1 51.6| V61 | |------------------------------------+----------+----------+-----------+-----------+------| | MEAN 470.4 132.0 48.88 .77|1.28 2.0|1.25 1.8| | 45.6 48.8| | | S.D. 60.6 2.4 5.07 .09| .17 1.1| .18 1.2| | 7.9 5.9| | ------------------------------------------------------------------------------------------- Principal Component Analysis of subscale indicates no sub dimensions. Table of STANDARDIZED RESIDUAL variance (in Eigenvalue units) -- Observed -- Expected Total raw variance in observations = 13.8 100.0% 100.0% Raw variance explained by measures = 6.8 49.2% 49.9% Raw variance explained by persons = 1.9 14.1% 14.3% Raw Variance explained by items = 4.8 35.1% 35.6% Raw unexplained variance (total) = 7.0 50.8% 100.0% 50.1% Unexplained variance in 1st contrast = 1.9 13.5%
Behaviour Support Summary Statistics INPUT: 138 PERSON REPORTED: 7 ITEM 5 CATS WINSTEPS 3.81.0 -------------------------------------------------------------------------------- SUMMARY Statistics OF 7 MEASURED ITEM ------------------------------------------------------------------------------- | TOTAL MODEL INFIT OUTFIT | | SCORE COUNT MEASURE ERROR MNSQ ZSTD MNSQ ZSTD | |-----------------------------------------------------------------------------| | MEAN 561.6 132.6 40.05 .95 .99 -.1 1.00 -.1 | | S.D. 51.9 2.4 5.13 .11 .18 1.5 .20 1.5 | | MAX. 630.0 138.0 50.14 1.08 1.20 1.4 1.20 1.3 | | MIN. 460.0 131.0 34.30 .73 .69 -2.6 .66 -2.8 | |-----------------------------------------------------------------------------| | REAL RMSE .99 TRUE SD 5.03 SEPARATION 5.06 ITEM RELIABILITY .96 | |MODEL RMSE .95 TRUE SD 5.04 SEPARATION 5.28 ITEM RELIABILITY .97 | | S.E. OF ITEM MEAN = 2.09 | ------------------------------------------------------------------------------- UMEAN=45.0102 USCALE=6.7889 Item Fit statistics (Polarity) -------------------------------------------------------------------------------- PERSON: REAL SEP.: 3.69 REL.: .93 ... ITEM: REAL SEP.: 7.41 REL.: .98 ------------------------------------------------------------------------------------------- |ENTRY TOTAL TOTAL MODEL| INFIT | OUTFIT |PTMEASURE-A|EXACT MATCH| | |NUMBER SCORE COUNT MEASURE S.E. |MNSQ ZSTD|MNSQ ZSTD|CORR. EXP.| OBS% EXP%| ITEM | |------------------------------------+----------+----------+-----------+-----------+------| | 32 524 131 44.27 .85|1.02 .2|1.18 1.3| .28 .48| 50.4 53.8| V48 | | 4 630 138 34.30 1.08|1.13 1.0|1.20 1.3| .30 .37| 63.0 63.5| V7 | | 15 589 132 36.54 1.03|1.19 1.4|1.11 .8| .38 .40| 60.6 59.4| V26 | | 23 553 131 40.90 .92|1.20 1.4|1.13 1.0| .44 .44| 57.3 56.4| V37 | | 11 599 134 36.39 1.03| .82 -1.4| .79 -1.5| .48 .39| 69.4 59.7| V21 | | 29 460 131 50.14 .73| .87 -1.0| .91 -.7| .60 .53| 48.1 47.9| V43 | | 41 576 131 37.79 1.00| .69 -2.6| .66 -2.8| .62 .41| 72.5 58.2| V58 | |------------------------------------+----------+----------+-----------+-----------+------| | MEAN 561.6 132.6 40.05 .95| .99 -.1|1.00 -.1| | 60.2 57.0| | | S.D. 51.9 2.4 5.13 .11| .18 1.5| .20 1.5| | 8.4 4.6| | ------------------------------------------------------------------------------------------- Principal Component Analysis of subscale indicates no sub dimensions. Table of STANDARDIZED RESIDUAL variance (in Eigenvalue units) -- Observed -- Expected Total raw variance in observations = 13.8 100.0% 100.0% Raw variance explained by measures = 6.8 49.2% 49.9% Raw variance explained by persons = 1.9 14.1% 14.3% Raw Variance explained by items = 4.8 35.1% 35.6%
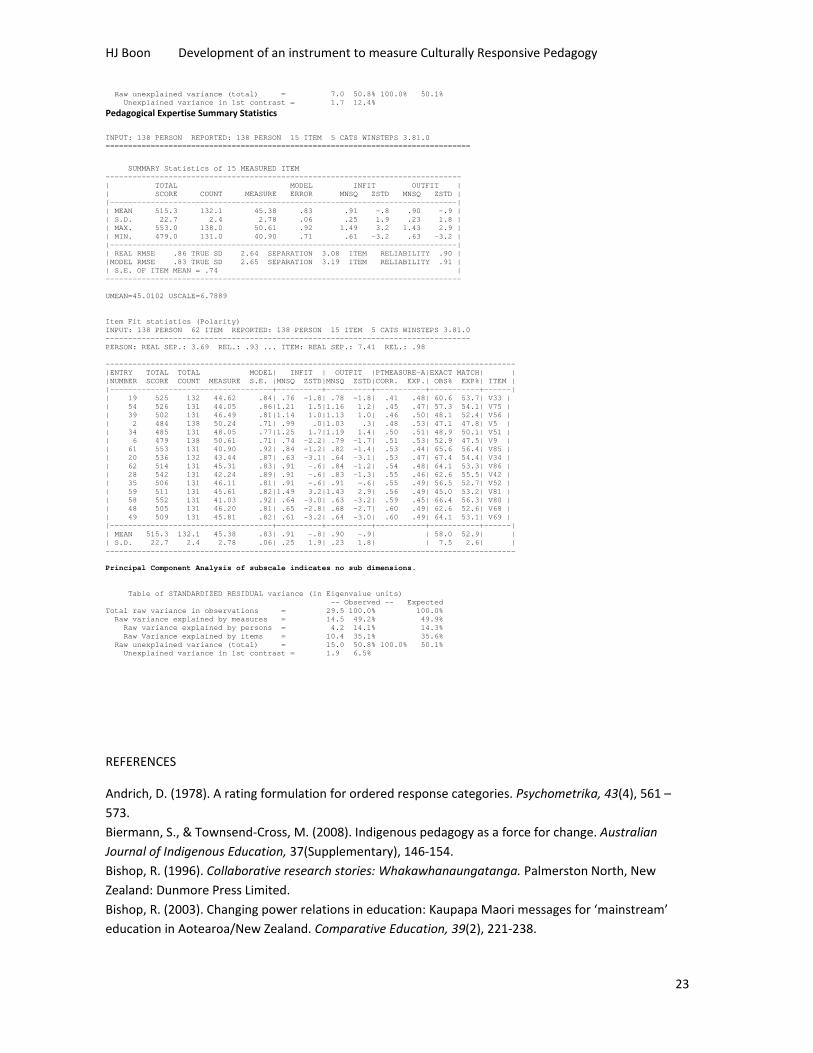
HJ Boon Development of an instrument to measure Culturally Responsive Pedagogy
23
Raw unexplained variance (total) = 7.0 50.8% 100.0% 50.1% Unexplained variance in 1st contrast = 1.7 12.4%
Pedagogical Expertise Summary Statistics
INPUT: 138 PERSON REPORTED: 138 PERSON 15 ITEM 5 CATS WINSTEPS 3.81.0 ---------------------------------------------------------------------------------
SUMMARY Statistics of 15 MEASURED ITEM ------------------------------------------------------------------------------- | TOTAL MODEL INFIT OUTFIT | | SCORE COUNT MEASURE ERROR MNSQ ZSTD MNSQ ZSTD | |-----------------------------------------------------------------------------| | MEAN 515.3 132.1 45.38 .83 .91 -.8 .90 -.9 | | S.D. 22.7 2.4 2.78 .06 .25 1.9 .23 1.8 | | MAX. 553.0 138.0 50.61 .92 1.49 3.2 1.43 2.9 | | MIN. 479.0 131.0 40.90 .71 .61 -3.2 .63 -3.2 | |-----------------------------------------------------------------------------| | REAL RMSE .86 TRUE SD 2.64 SEPARATION 3.08 ITEM RELIABILITY .90 | |MODEL RMSE .83 TRUE SD 2.65 SEPARATION 3.19 ITEM RELIABILITY .91 | | S.E. OF ITEM MEAN = .74 | ------------------------------------------------------------------------------- UMEAN=45.0102 USCALE=6.7889 Item Fit statistics (Polarity) INPUT: 138 PERSON 62 ITEM REPORTED: 138 PERSON 15 ITEM 5 CATS WINSTEPS 3.81.0 --------------------------------------------------------------------------------- PERSON: REAL SEP.: 3.69 REL.: .93 ... ITEM: REAL SEP.: 7.41 REL.: .98 ------------------------------------------------------------------------------------------- |ENTRY TOTAL TOTAL MODEL| INFIT | OUTFIT |PTMEASURE-A|EXACT MATCH| | |NUMBER SCORE COUNT MEASURE S.E. |MNSQ ZSTD|MNSQ ZSTD|CORR. EXP.| OBS% EXP%| ITEM | |------------------------------------+----------+----------+-----------+-----------+------| | 19 525 132 44.62 .84| .76 -1.8| .78 -1.8| .41 .48| 60.6 53.7| V33 | | 54 526 131 44.05 .86|1.21 1.5|1.16 1.2| .45 .47| 57.3 54.1| V75 | | 39 502 131 46.49 .81|1.14 1.0|1.13 1.0| .46 .50| 48.1 52.4| V56 | | 2 484 138 50.24 .71| .99 .0|1.03 .3| .48 .53| 47.1 47.8| V5 | | 34 485 131 48.05 .77|1.25 1.7|1.19 1.4| .50 .51| 48.9 50.1| V51 | | 6 479 138 50.61 .71| .74 -2.2| .79 -1.7| .51 .53| 52.9 47.5| V9 | | 61 553 131 40.90 .92| .84 -1.2| .82 -1.4| .53 .44| 65.6 56.4| V85 | | 20 536 132 43.44 .87| .63 -3.1| .64 -3.1| .53 .47| 67.4 54.4| V34 | | 62 514 131 45.31 .83| .91 -.6| .84 -1.2| .54 .48| 64.1 53.3| V86 | | 28 542 131 42.24 .89| .91 -.6| .83 -1.3| .55 .46| 62.6 55.5| V42 | | 35 506 131 46.11 .81| .91 -.6| .91 -.6| .55 .49| 56.5 52.7| V52 | | 59 511 131 45.61 .82|1.49 3.2|1.43 2.9| .56 .49| 45.0 53.2| V81 | | 58 552 131 41.03 .92| .64 -3.0| .63 -3.2| .59 .45| 66.4 56.3| V80 | | 48 505 131 46.20 .81| .65 -2.8| .68 -2.7| .60 .49| 62.6 52.6| V68 | | 49 509 131 45.81 .82| .61 -3.2| .64 -3.0| .60 .49| 64.1 53.1| V69 | |------------------------------------+----------+----------+-----------+-----------+------| | MEAN 515.3 132.1 45.38 .83| .91 -.8| .90 -.9| | 58.0 52.9| | | S.D. 22.7 2.4 2.78 .06| .25 1.9| .23 1.8| | 7.5 2.6| | ------------------------------------------------------------------------------------------- Principal Component Analysis of subscale indicates no sub dimensions. Table of STANDARDIZED RESIDUAL variance (in Eigenvalue units) -- Observed -- Expected Total raw variance in observations = 29.5 100.0% 100.0% Raw variance explained by measures = 14.5 49.2% 49.9% Raw variance explained by persons = 4.2 14.1% 14.3% Raw Variance explained by items = 10.4 35.1% 35.6% Raw unexplained variance (total) = 15.0 50.8% 100.0% 50.1% Unexplained variance in 1st contrast = 1.9 6.5%
REFERENCES
Andrich, D. (1978). A rating formulation for ordered response categories. Psychometrika, 43(4), 561 –
573.
Biermann, S., & Townsend‐Cross, M. (2008). Indigenous pedagogy as a force for change. Australian
Journal of Indigenous Education, 37(Supplementary), 146‐154.
Bishop, R. (1996). Collaborative research stories: Whakawhanaungatanga. Palmerston North, New
Zealand: Dunmore Press Limited.
Bishop, R. (2003). Changing power relations in education: Kaupapa Maori messages for ‘mainstream’
education in Aotearoa/New Zealand. Comparative Education, 39(2), 221‐238.
HJ Boon Development of an instrument to measure Culturally Responsive Pedagogy
24
Bishop, R., Berryman, M., Tiakiwai, S., & Richardson, C. (2003). Te Kötahitanga: The experiences of year
9 and 10 Māori students in mainstream classrooms (Report to the Ministry of Education). Hamilton,
New Zealand: Ministry of Education.
Bond, T.G. & Fox, C.M. (2007). Applying the Rasch Model: Fundamental Measurement in the Human
Sciences, 2nd edn. Mahwah, NJ: Lawrence Erlbaum Associates.
Boon, H. J. (2011) Raising the bar: ethics education for quality teachers. Australian Journal of Teacher
Education, 36 (7), 76‐93.
Boone, W. J., Townsend, J. S., & Staver, J. (2011). Using Rasch theory to guide the practice of survey development and survey data analysis in science education and to inform science reform efforts: An exemplar utilizing STEBI self‐efficacy data. Science Education, 95, 258–280. Castagno, A.E., & Brayboy, B.M.J. (2008). Culturally responsive schooling for Indigenous youth: A review
of the literature. Review of Educational Research, 78, 941–993.
Cavanagh, R. F., & Romanoski, J. T. (2006). Rating scale instruments and measurement. Learning Environments Research, 9, 273–289. Craven, R., Bodkin‐Andrews, G., & Yeung, A. (2007). A Model for Success for Aboriginal Students. Paper
presented at the Australian Association for Research in Education, Freemantle.
http://www.aare.edu.au/07pap/cra07433.pdf
Crotty, M. J. (1998). The foundations of social research: meaning and perspective in the research
process. Sydney: Sage.
de Jong‐Gierveld, J., & Kamphuls, F. (1985). The development of a Rasch‐type loneliness scale. Applied
psychological measurement, 9(3), 289‐299.
DeMars, C. (2010). Items response theory: Understanding statistics measurement. New York, NY. Oxford
University Press.
Dorans, N. J., & Kingston, N. M. (1985). The effects of violations of unidimensionality on the estimation
of item and ability parameters and on item response theory equating of the GRE verbal scale. Journal of
Educational Measurement, 22, 249–262.
Fox , C. M., & Jones, J.A. (1998). Uses of Rasch modelling in counselling psychology research. Journal of
counselling psychology, 45 (1), 30‐45.
Gay, G. (2010). Culturally responsive teaching (2nd ed.). New York: Teachers College Press.
Gore, J., Ladwig, J., Griffiths, T., & Amosa, W. (2007).Data‐driven guidelines for high quality teacher
education. AARE 2007 Conference: Research Impacts: Proving or improving? Fremantle WA.
Hattie, J. (2003, October). Teachers make a difference: What is the research evidence? Paper presented
at the Australian Council for Educational Research Annual Conference on Building Teacher Quality,
Melbourne. http://www.acer.edu.au/documents/RC2003_Hattie_TeachersMakeADifference.pdf
Hambleton, R. K. (1993). Comparison of classical test theory and item response theory and their
applications to test development. Educational Measurement: Issues and Practice, 12(3), 38–47.
Hattie, J. (2009). Visible learning: A synthesis of over 800 meta‐analyses relating to achievement.
London, UK: Routledge.
Lamoureux, E. L., Pallant, J. F., Pesudovs, K., Rees, G., Hassell, J. B., & Keeffe, J. E. (2007). The impact of
vision impairment questionnaire: an assessment of its domain structure using confirmatory factor
analysis and Rasch analysis. Investigative Ophthalmology & Visual Science, 48(3), 1001‐1006.
Lewthwaite, B.E. & Fisher, D.L. (2005). The development and validation of a primary science curriculum
delivery evaluation questionnaire. International Journal of Science Education, 27(5), 593‐606.
Lewthwaite, B.E. & Fisher, D.L. (2004). The application of a primary science curriculum evaluation
questionnaire. Research in Science Education, 34(1), 55‐70.
HJ Boon Development of an instrument to measure Culturally Responsive Pedagogy
25
Lewthwaite, B.E. (2007). From school in community to a community‐based school: The journey of an Aboriginal principal. Canadian Journal of Educational Administration and Policy, 64, 1‐23. Lewthwaite, B., McMillan, B. Renaud, R. Hainnu, R., & McDonald, C. (2010). Combining the views of “Both Worlds”: Science education in Nunavut piqusiit tamainik katisugit. Canadian Journal of Educational Administration and Policy, 98, 1‐71. Lewthwaite, B. E., & McMillan, B. (2007). Combining the views of both worlds: Perceived constraints and
contributors to achieving aspirations for science education in Qikiqtani. Canadian Journal of Science,
Mathematics and Technology Education, 7(4), 355‐376.
Lewthwaite, B. E., & McMillan, B. (2010). "She can bother me, and that's because she cares": What Inuit
students say about teaching and their learning”. Canadian Journal of Education, 33(1), 140‐175.
Lewthwaite, B.E., Owen, T., Doiron, A., Renaud, R. and McMillan, B. (2014). Culturally responsive teaching in Yukon First Nations settings: what does it look like and what is its influence? Canadian Journal of Educational Administration and Policy, 155, 1‐34. Lewthwaite, B. E., & Renaud, R. (2009). Pilimmaksarniq: Working together for the common good in
Science curriculum development and delivery in Nunavut. Canadian Journal of Science, Mathematics
and Technology Education, 9(3), 154‐172.
Linacre, J. M. (1998). Detecting multidimensionality: Which residual data‐type works best? Journal of
Outcome Measurement, 2(3), 3266‐283.
Linacre, J. M. (2009b). A user’s guide to Winsteps Rasch‐model computer programs (Program manual
3.68.0). Chicago: Winsteps.
Linacre, J.M. (2014). Winsteps® (Version 3.81.0) [Computer Software]. Beaverton, Oregon:
Winsteps.com. Retrieved January 1, 2014. Available from http://www.winsteps.com/
Luce, R. D.,&Tukey, J.W. (1964). Simultaneous conjoint measurement:Anewtype of fundamental measurement. Journal of Mathematical Psychology, 1(1), 1 – 27. http://www.unisa.edu.au/hawkecentre/events/2006events/BarryMcGaw_presentation_Aug06.pdf
Ludlow, L. H., Enterline, S. E., & Cochran‐Smith, M. (2008). Learning to teach for Social‐Justice‐Beliefs
Scale: An application of Rasch measurement principles. Measurement and Evaluation in Counseling
and Development, 40, 194–214.
Maulana, R., Helms‐Lorenz, M., & van de Grift, W. (2015a). Pupils’ perceptions of teaching behaviour:
Evaluation of an instrument and importance for academic motivation in Indonesian secondary
education. International Journal of Educational Research, 69, 98‐112.
Maulana, R., Helms‐Lorenz, M. & van de Grift, W. (2015b). Development and evaluation of a
questionnaire measuring pre‐service teachers’ teaching behaviour: a Rasch modelling approach, School
Effectiveness and School Improvement: An International Journal of Research, Policy and Practice, 26,(2),
169‐194, DOI: 10.1080/09243453.2014.939198.
Manz, P. H., Gernhart, A. L., Bracaliello, C. B., Pressimone, V. J., & Eisenberg, R. A. (2014). Preliminary
Development of the Parent Involvement in Early Learning Scale for Low‐Income Families Enrolled in a
Child‐Development‐Focused Home Visiting Program. Journal of Early Intervention, 36(3), 171‐191.
Masters, G. N. (1982). A Rasch model for partial credit scoring. Psychometrika, 47(2), 149 – 174.
Masters, G. N. (2005). Continuity and growth: Key considerations in educational improvement and
accountability. E. Melbourne, Victoria, Australia: Centre for Strategic Education.
McGaw, B. (2006). Achieving Quality and Equity Education. Lecture to Melbourne Education Research
Institute.
Ministry of Education. (2006). Nga haeata matauranga: Annual report on Maori education.
Wellington: Ministry of Education.

HJ Boon Development of an instrument to measure Culturally Responsive Pedagogy
26
Organization for Economic Cooperation and Development (OECD) (2006). Assessing Scientific, Reading,
and Mathematical Literacy: A Framework for PISA 2006. Paris: OECD.
Osborne, A. B. (1991). Towards an ethnology of cultural responsive pedagogy in small‐scale remote
communities: Native American and Torres Strait Islander. International Journal of Qualitative Studies in
Education, 4(1), pp. 1‐17.
Osborne, A. B. (1996). Practice into theory into practice: Culturally relevant pedagogy for students we
have marginalized and normalized. Anthropology and Education Quarterly, 27(3), pp. 285‐314.
Osborne, A. B. (2001). Teaching diversity and democracy. Altona, Vic.: Common Ground.
Pearson, N. (2011). Fledgling school for indigenous students mustn't be allowed to fail.
http://www.theaustralian.com.au/national‐affairs/fledgling‐school‐for‐indigenous‐students‐mustnt‐be‐
allowed‐to‐fail/story‐fn59niix‐1226082364863.
Peoples, S. M., O’Dwyer, L. M., Wang, Y., Brown, J. J., & Rosca, C. V. (2014). Development and
application of the Elementary School Science Classroom Environment Scale (ESSCES): measuring student
perceptions of constructivism within the science classroom. Learning Environments Research, 17(1), 49‐
73.
Perso, T. (2012). Cultural responsiveness and school education with particular focus on Australia’s First
Peoples: A review and synthesis of the literature. Darwin, NT: The Menzies Institute.
Queensland Catholic Education Commission (2012). Aboriginal and Torres Strait Islander Education:
http://www.qcec.catholic.edu.au/upload/publicsite/qcec/policyandpositions/Aboriginal%20and%20Tor
res%20Strait%20Islander%20education.pdf.
Rasch, G. (1960). Probabilistic models for some intelligence and attainment tests. Copenhagen, Denmark: Danmarks Paedagogiske Institut. Rowe, K. (2006). Effective teaching practices for students with and without learning difficulties:
Constructivism as a legitimate theory of learning and of teaching?"
http://research.acer.edu.au/learning_processes/10
Sarra, C. (2011). Strong and smart – Towards a pedagogy for emancipation: Education for First Peoples.
New York: Routledge.
Schumacker, R. E., & Linacre, J. M. (1996). Factor analysis and Rasch. Rasch Measurement Transactions,
9(4), 4470. Retrieved from http://rasch.org/rmt/rmt94k.htm
Smith, E.V., Conrad KM, Chang K, Piazza J. (2002). An introduction to Rasch measurement for scale
development and person assessment. J Nurs Meas, 10, 189–206.
Snook, I; O’Neill, J.; Clark, J.; O’Neill, A.., & Openshaw, R. (2009). Invisible Learnings?: A Commentary on
John Hattie's Book ‐ 'Visible Learning: A Synthesis of Over 800 Meta‐analyses Relating to Achievement'.
New Zealand Journal of Educational Studies, 44(1), 93‐106.
Stairs, A. (1995). Learning processes and teaching roles in Native education: Cultural base and cultural
brokerage. In M. Battiste & J. Barman (Eds.), First Nations education in Canada: The circle unfolds.
Vancouver, BC: University of British Columbia Press.
Thomson, S., De Bortoli, L., Nicholas, M., Hillman, K. & Buckley, S. (2010) PISA In brief: highlights from
the full Australian report: challenges for Australian education: results from PISA 2009: the PISA 2009
assessment of students' reading, mathematical and scientific literacy.
http://research.acer.edu.au/ozpisa/8
Van Manen, M. (2007). Phenomenology of practice. Phenomenology & Practice, 1, (1), 11‐30.
Vygotsky, L. S. (1978). Mind in society: The development of higher psychological processes. Cambridge,
MA: Harvard University Press.
Wilson, M. (2005). Constructing measures: An item response modeling approach. Mahwah, NJ: Erlbaum.

HJ Boon Development of an instrument to measure Culturally Responsive Pedagogy
27
Wright, B. D. (1968, February). Sample‐free test calibration and person measurement. Paper presented
at the National Seminar on Adult Education Research, Chicago, IL.
Wright, B. D. (1984). Despair and hope for educational measurement. Contemporary Education Review,
3(1),281 – 288.
Wright, B. D., & Mok, M. (2000). Rasch models overview. Journal of Applied Measurement, 1, 83–106.
Wright, B. D., & Stone, M. H. (1979). Best test design. Chicago: Mesa Press.
Wright, B. D., & Stone, M. H. (2004). Making measures. Chicago: Phaneron Press.Science
Yunkaporta, T. & McGinty, S. (2009). Reclaiming Aboriginal knowledge at the cultural interface. The
Australian Educational Researcher, 36(2), 55‐72.
Zickar, M.J., & Broadfoot, A.A. (2009). The Partial Revival of a Dead Horse? Comparing Classical Test
Theory and Item Response Theory. In C.E. Lance & R.J. Vandenberg (Eds.) Statistical and Methodological
Myths and Urban Legends: Doctrine, Verity and Fable in the Organizational and Social Sciences. (pages
37‐59).