
Biosurfactant production by fungi as a sustainable alternative
Upload
truongtuongCategory
view
215download
0
1
Development of an in situ biosurfactant production technology for enhanced oil recovery
Final Report
DE-FC26-04NT15522
Report Start Date: October 1, 2004 Report End Date: January 31, 2007
M. J. McInerney, R.M. Knapp, Kathleen Duncan, D. R. Simpson, N. Youssef, N. Ravi, M. J. Folmsbee, T. Fincher, S. Maudgalya, Jim Davis, and Sandra Weiland
Principal Investigator: Michael J. McInerney University of Oklahoma
Department of Botany and Microbiology 770 Van Vleet Oval
Norman, OK 73019-0245 Phone: 405-325-6050 Fax: 405-325-7619
Email: [email protected]
2
Disclaimer
This report was prepared as an account of work sponsored by an agency of the
United States Government. Neither the United States Government nor any agency
thereof, nor any of their employees, makes any warranty, express or implied, or assumes
any legal liability or responsibility for the accuracy, completeness, or usefulness of any
information, apparatus, product or process disclosed, or represents that its use would not
infringe privately owned rights. Reference herein to any specific commercial product,
process, or service by trade name, trademark, manufacturer, or otherwise does not
necessarily constitute or imply its endorsement, recommendation, or favoring by the
United States Government or any agency thereof. The views and opinions of authors
expressed herein do not necessarily state or reflect those of the United States Government
or any agency thereof.
3
TABLE OF CONTENTS I. Executive Summary ....................................................................................................5
2. Introduction................................................................................................................8 Factors affecting oil recovery...................................................................................................... 10 Biosurfactants................................................................................................................................ 10 Selective stimulation of in situ biosurfactant production....................................................... 13 Project Objectives ......................................................................................................................... 14 Scope of Work ............................................................................................................................... 14
3. Detection and stimulation of biosurfactant activity in oil field brines ......................16 Abstract .......................................................................................................................................... 16 Overview......................................................................................................................................... 16 Materials and Methods ................................................................................................................ 18 Results............................................................................................................................................. 25 Discussion and Conclusions......................................................................................................... 56
4. Molecular methodologies to detect and characterize biosurfactant producers and their use to determine the prevalence of biosurfactant producers in oil reservoirs.......59
Abstract .......................................................................................................................................... 59 Introduction................................................................................................................................... 59 Materials and Methods ................................................................................................................ 60 Results............................................................................................................................................. 65 Discussion....................................................................................................................................... 82
5. Characterization of Bacillus licheniformis strain RS-1 and related strains for suitability in MEOR bioaugmentation in diverse oil formations ..................................85
Abstract .......................................................................................................................................... 85 Introduction................................................................................................................................... 85 Materials and Methods ................................................................................................................ 85 Results............................................................................................................................................. 88 Discussion....................................................................................................................................... 96
6. Microbial Stimulation Treatment of High Water-Cut Wells in the Viola Formation, Pontotoc County, OK....................................................................................................98
Abstract .......................................................................................................................................... 98 Introduction................................................................................................................................... 98 Methodology .................................................................................................................................. 99 Results........................................................................................................................................... 102 Economic analysis ....................................................................................................................... 106

4
Conclusion.................................................................................................................................... 106 References ..................................................................................................................108 Appendices..................................................................................................................119

5
I. Executive Summary The long-term economic potential for enhanced oil recovery (EOR) is large with more than 300 billion barrels of oil remaining in domestic reservoirs after conventional technologies reach their economic limit. Actual EOR production in the United States has never been very large, less than 10% of the total U. S. production even though a number of economic incentives have been used to stimulate the development and application of EOR processes. The U.S. DOE Reservoir Data Base contains more than 600 reservoirs with over 12 billion barrels of unrecoverable oil that are potential targets for microbially enhanced oil recovery (MEOR). If MEOR could be successfully applied to reduce the residual oil saturation by 10% in a quarter of these reservoirs, more than 300 million barrels of oil could be added to the U.S. oil reserve. This would stimulate oil production from domestic reservoirs and reduce our nation’s dependence on foreign imports. Laboratory studies have shown that detergent-like molecules called biosurfactants, which are produced by microorganisms, are very effective in mobilizing entrapped oil from model test systems. The biosurfactants are effective at very low concentrations. Given the promising laboratory results, it is important to determine the efficacy of using biosurfactants in actual field applications. The goal of this project is to move biosurfactant-mediated oil recovery from laboratory investigations to actual field applications. In order to meet this goal, several important questions must be answered. First, it is critical to know whether biosurfactant-producing microbes are present in oil formations. If they are present, then it will be important to know whether a nutrient regime can be devised to stimulate their growth and activity in the reservoir. If biosurfactant producers are not present, then a suitable strain must be obtained that can be injected into oil reservoirs. We were successful in answering all three questions. The specific objectives of the project were (1) to determine the prevalence of biosurfactant producers in oil reservoirs, and (2) to develop a nutrient regime that would stimulate biosurfactant production in the oil reservoir. The prevalence of biosurfactant producers in three carbonate and four sandstone oil-bearing formations in Oklahoma was determined by cultivation-dependent and cultivation-independent approaches. Wells that had production from the formation of interest without inter-mingling of fluids with other formations were selected for analysis. Brine analysis showed that the formations had salinities ranging from 3.2% to 15.6% and calcium concentrations ranging from 1.6 to 13.4 g/l. Sulfate levels were low in all of the brines except in brines from two wells. The sulfide levels were low in all brines sampled. Viable microorganisms were not detected in brine samples collected from any of the formations by agar plating methods whether or not the brine was heat-treated to stimulate germination of Bacillus spores. Liquid counting procedures conducted either in the presence or absence of oxygen using medium that matched the salinity of the formation only detected low numbers of heterotrophic bacteria (less that 10, 000 per milliliter). These findings are consistent with those of others investigators that detect only low numbers of microorganisms when traditional cultivation approaches are used. None of the enumeration approaches detected biosurfactant-producing microorganisms. However, when conditions were established to enrich for salt tolerant, heterotrophic microorganisms, biosurfactant activity was detected in these enrichments from all of the

6
formations. These data suggest that biosurfactant producers were present in the produced fluids from the reservoir, but were either not very numerous or not very active. We developed several tools to detect biosurfactant-producing microorganisms in produced fluids from oil reservoirs without the need for cultivation. We developed primer DNA sequences to amplify and detect genes required for biosurfactant production by polymerase chain reaction (PCR). The genes targeted were those involved in the synthesis of lipopeptide and rhamnolipid biosurfactants, both of which have been shown to generate low interfacial tensions between oil and aqueous phases needed to recover substantial quantities of entrapped oil. The degenerative primers were highly effective at distinguishing known biosurfactant-producing strains form non-producing strains. The degenerative primers for the lipopeptide biosurfactants were able to detect the presence of two lipopeptide-producing strains in produced fluids from an oil reservoir that was inoculated with these two strains. This is the first time that the efficacy of using an inoculum for MEOR has been conclusively demonstrated. With the above methods, we were able to show conclusively that it is possible to inoculate an oil reservoir with the microorganisms needed for a microbial oil recovery process and to retrieve the same strains from the oil reservoir. The PCR approaches described above were used to survey produced fluids from seven oil formations that differed in lithology and salinity. Genes for lipopeptide biosynthesis were detected in six of the seven formations. This finding was corroborated by the concomitant detection of members of the Bacillus subtilis-Bacillus licheniformis group, a group known to contain many biosurfactant producers, by gyrA gene amplification and sequencing. 16S rRNA gene sequence analysis also detected members of this group in formations that had chloride concentrations greater than 10%. We did not detect microorganisms that produce rhamnolipids in any of the formations either by cultivation-dependent or cultivation-independent methods. Both culture-independent and culture-dependent approaches support the conclusion that biosurfactant-producing microorganisms, probably related to the Bacillus subtilis-Bacillus licheniformis, are present in many oil formations, even in reservoirs with very high salinities. We systematically tested a number of nutrient components and various combinations of these nutrients in produced fluids from seven different oil formations to determine the formulation that best stimulated biosurfactant production and whether bioaugmentation (e.g., the use of an inoculum) was beneficial. Glucose and/or molasses, proteose peptone, and nitrate were the critical nutrient components needed for aerobic biosurfactant production. Anaerobic conditions are probably more reflective of the actual environmental conditions that exist in the reservoir. The information obtained with the aerobic nutrient screening allowed us to narrow the number of nutrients to be tested to glucose, molasses, nitrate and a mixture of trace metals. The highest oil-spreading activities were observed when glucose and/or molasses were present and that nitrate and the trace metals mixture stimulated biosurfactant activity. We found that the addition of glucose, nitrate and trace metals stimulated in situ biosurfactant production by Bacillus licheniformis RS-1 and Bacillus subtilis subsp. spizizenii strain NRRLB-23049 in a carbonate formation. Our work also shows that this simple nutrient formulation is

7
effective in stimulating anaerobic biosurfactant formation by B. licheniformis RS-1 in several brines that vary in salinity. Maximum biosurfactant production was observed when brines were supplemented with nutrients and B. licheniformis strain RS-1. Indigenous biosurfactant activity was detected in many cases, but was always much lower than that observed when an inoculum was used. These data argue that effective in situ biosurfactant production requires bioaugmentation. The nutrient combination that gave maximal biosurfactant production by B. licheniformis strain RS-1 was a mixture of trace metals, nitrate and either glucose or molasses. We found that B. licheniformis strain RS-1 was a robust strain in respective to its properties useful for MEOR. It grew and produced a biosurfactant in the absence of oxygen. Strain RS-1 was able to grow aerobically in medium with 15% NaCl added and biosurfactant production occurred in medium with up to 10% NaCl added. It also grew over a wide range of pH values from 2 to 10. B. licheniformis strain RS- produces an biosurfactant anaerobically that generates ultra-low interfacial tensions needed for significant oil recovery and grows over a wide range of salt and temperature regimes found in many mid-Continent oil reservoirs. These properties make it an ideal strain for use in MEOR. We injected a glucose-nitrate-mineral nutrient mixture and two biosurfactant-producing, Bacillus strains into two wells to correlate in-situ metabolism and growth with oil recovery. Two wells producing from the same Viola formation were each inoculated with 500 bbl of tank battery brine mixed with nutrients (glucose, sodium nitrate and trace metals) as well as Bacillus licheniformis RS-1 and Bacillus subtilis subsp. subtilis spizizenii NRRL B-23049. Analysis of production water indicated in-situ metabolism of the nutrients, growth of the injected strains and other heterotrophic fermenting bacteria, and the production of bacterial products including the biosurfactant. Both wells had a peak lipopeptide biosurfactant concentration of 20 and 28 mg/L, respectively, and an average carbon balance of glucose used and metabolic products and cells made of 91%. The increase in biosurfactant, acids, alcohols and carbon dioxide during the first 5 days after commencement of production corresponded directly with increasing oil recovery. Furthermore, wellhead measurements of total produced water, the water/oil ratio (WOR) and the percent oil cut as well as separation tank battery production data indicated that a corresponding net increase of at least 183 bbl in oil recovery occurred in during the first 100 days of sampling.
8
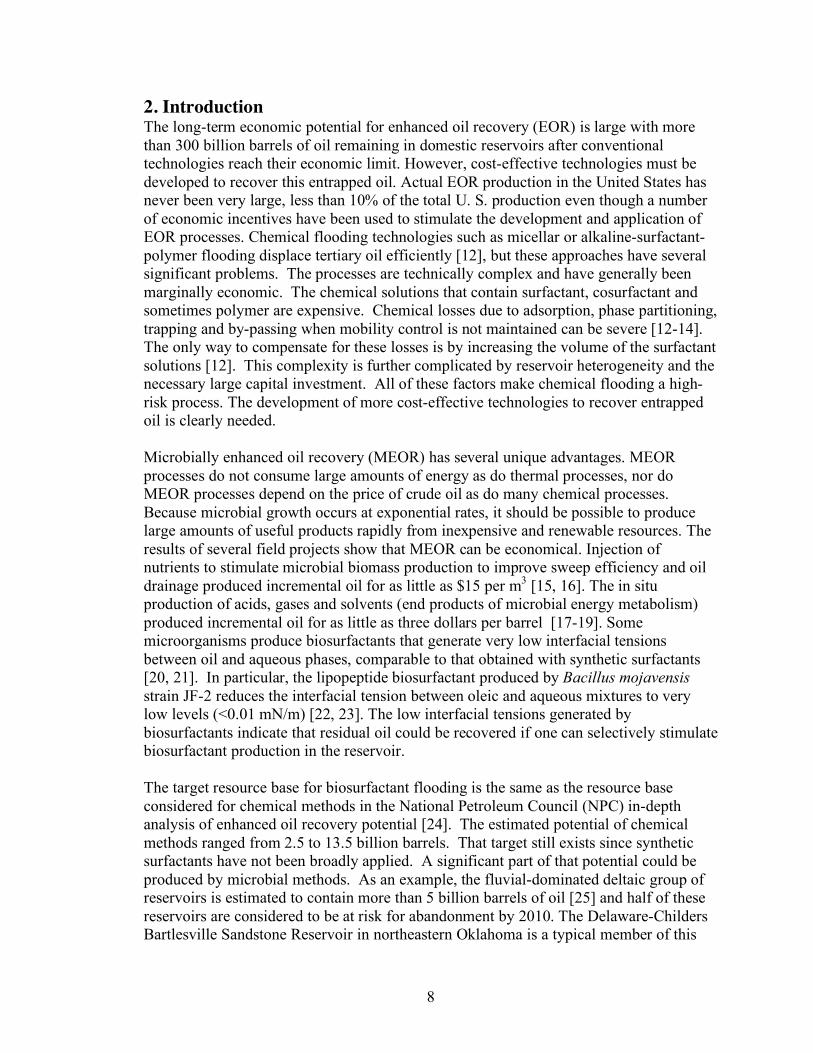
2. Introduction The long-term economic potential for enhanced oil recovery (EOR) is large with more than 300 billion barrels of oil remaining in domestic reservoirs after conventional technologies reach their economic limit. However, cost-effective technologies must be developed to recover this entrapped oil. Actual EOR production in the United States has never been very large, less than 10% of the total U. S. production even though a number of economic incentives have been used to stimulate the development and application of EOR processes. Chemical flooding technologies such as micellar or alkaline-surfactant-polymer flooding displace tertiary oil efficiently [12], but these approaches have several significant problems. The processes are technically complex and have generally been marginally economic. The chemical solutions that contain surfactant, cosurfactant and sometimes polymer are expensive. Chemical losses due to adsorption, phase partitioning, trapping and by-passing when mobility control is not maintained can be severe [12-14]. The only way to compensate for these losses is by increasing the volume of the surfactant solutions [12]. This complexity is further complicated by reservoir heterogeneity and the necessary large capital investment. All of these factors make chemical flooding a high-risk process. The development of more cost-effective technologies to recover entrapped oil is clearly needed. Microbially enhanced oil recovery (MEOR) has several unique advantages. MEOR processes do not consume large amounts of energy as do thermal processes, nor do MEOR processes depend on the price of crude oil as do many chemical processes. Because microbial growth occurs at exponential rates, it should be possible to produce large amounts of useful products rapidly from inexpensive and renewable resources. The results of several field projects show that MEOR can be economical. Injection of nutrients to stimulate microbial biomass production to improve sweep efficiency and oil drainage produced incremental oil for as little as $15 per m3 [15, 16]. The in situ production of acids, gases and solvents (end products of microbial energy metabolism) produced incremental oil for as little as three dollars per barrel [17-19]. Some microorganisms produce biosurfactants that generate very low interfacial tensions between oil and aqueous phases, comparable to that obtained with synthetic surfactants [20, 21]. In particular, the lipopeptide biosurfactant produced by Bacillus mojavensis strain JF-2 reduces the interfacial tension between oleic and aqueous mixtures to very low levels (<0.01 mN/m) [22, 23]. The low interfacial tensions generated by biosurfactants indicate that residual oil could be recovered if one can selectively stimulate biosurfactant production in the reservoir. The target resource base for biosurfactant flooding is the same as the resource base considered for chemical methods in the National Petroleum Council (NPC) in-depth analysis of enhanced oil recovery potential [24]. The estimated potential of chemical methods ranged from 2.5 to 13.5 billion barrels. That target still exists since synthetic surfactants have not been broadly applied. A significant part of that potential could be produced by microbial methods. As an example, the fluvial-dominated deltaic group of reservoirs is estimated to contain more than 5 billion barrels of oil [25] and half of these reservoirs are considered to be at risk for abandonment by 2010. The Delaware-Childers Bartlesville Sandstone Reservoir in northeastern Oklahoma is a typical member of this

9
group and initially contained about 120 million stock tank barrels of oil. The reservoir has been extensively gas and water flooded since its discovery in 1908. Currently, it is at close to residual oil saturation (estimated at 25%) [26]. Further reducing the oil saturation to 15% by microbial surfactants could yield 12 million barrels (2 million meters3). Bryant [27] screened the U.S. DOE Reservoir Data Base for candidate MEOR reservoirs that originally contained more than 20 million barrels of oil. She found more than 600 reservoirs containing over 12 billion barrels of oil in 10 major producing states. If MEOR could be successfully applied to reduce residual oil saturation by 10% in a quarter of these reservoirs more than 300 million barrels of oil could be added to the U.S. reserve base. To be successful, a microbial surfactant flooding processes must address the problems associated with chemical flooding technologies. In contrast to synthetic surfactants, the use of biosurfactant offers no long-term risk to the environment since biosurfactants and the materials from which they are made are readily degraded [28-31]. The microbial processes used in field pilots have not been technically complex. The nutrients have been uncomplicated and inexpensive. It is not known if adsorption or trapping losses are significant, but since the surfactants are produced in situ they are not expected to move far to reach the oil-water interface to mobilize the oil. Clearly, more work is needed to quantify the interactions between biosurfactants and the rock matrix at the pore scale. In laboratory tests, microbial cells and products other than the surfactant appear to serve as mobility control agents so that little bypassing has been observed [15, 32, 33]. This would help deal with reservoir heterogeneity. Finally, capital requirements for pilot studies have been modest. Only slight modifications to normal water flood injection equipment to mix the nutrients with the injection water have been needed. The most successful MEOR process by Brown and his coworkers (2000) resulted in oil recovery for as little as $15 per m3. With such a promising outlook for biosurfactant flooding, one must ask the question why the technology has not been implemented more extensively. The results of several laboratory studies show that residual oil recoveries by biosurfactant-producing microorganisms are low and inconsistent [34-39]. There are several potential reasons for this including the inconsistent production of the biosurfactant, loss of biosurfactant activity with extended incubation, and nutrient limitations that delay the growth of the requisite microorganisms. The inconsistent performance of MEOR has led to criticisms whether sufficient quantities of microbial products can be produced in oil reservoirs at rates sufficient to result in economic oil recovery [40]. In our previous DOE project (DE-FC26-02NT1531), we addressed many of these concerns. We have obtained a number of microbial strains that have high biosurfactant activity that is not lost after extended incubation [41]. We have identified the nutrients needed to support luxurious anaerobic growth of biosurfactant-producing bacteria, i. e., deoxyribonucleotides often found in commercially available meat digests [42]. Finally, we have found that substantial mobilization of residual oil occurs at low biosurfactant concentrations (20 to 50 mg/l) if a polymer and 2,3-butanediol, a product of the biosurfactant-producing bacteria, are present [43].
10
Thus, we feel that we have answered a number of the criticisms that have been leveled at MEOR processes. However, additional information is needed to move biosurfactant-mediated oil recovery from laboratory-based studies to actual field applications. First, we must know if oil fields contain biosurfactant-producing microorganisms or whether these cells must be injected. Cell injection adds increased cost, which a company would want to avoid if possible. Secondly, we must know what nutrients to inject to stimulate and maintain in situ biosurfactant production. This is a much more difficult challenge than other MEOR processes faced since we are trying to produce a metabolite that is not a direct result of the energy metabolism of the cell as are acids, gases, solvents or the microbial cell itself. Our preliminary data indicates that a mixture of glucose, proteose peptone (a commercially available meat digest) and 27 mM nitrate selectively stimulates the growth of biosurfactant-producing bacteria in groundwater samples [44]. We need to demonstrate that this approach is effective in the presence of microbes indigenous to oil reservoirs and that it will also lead to in situ biosurfactant production.
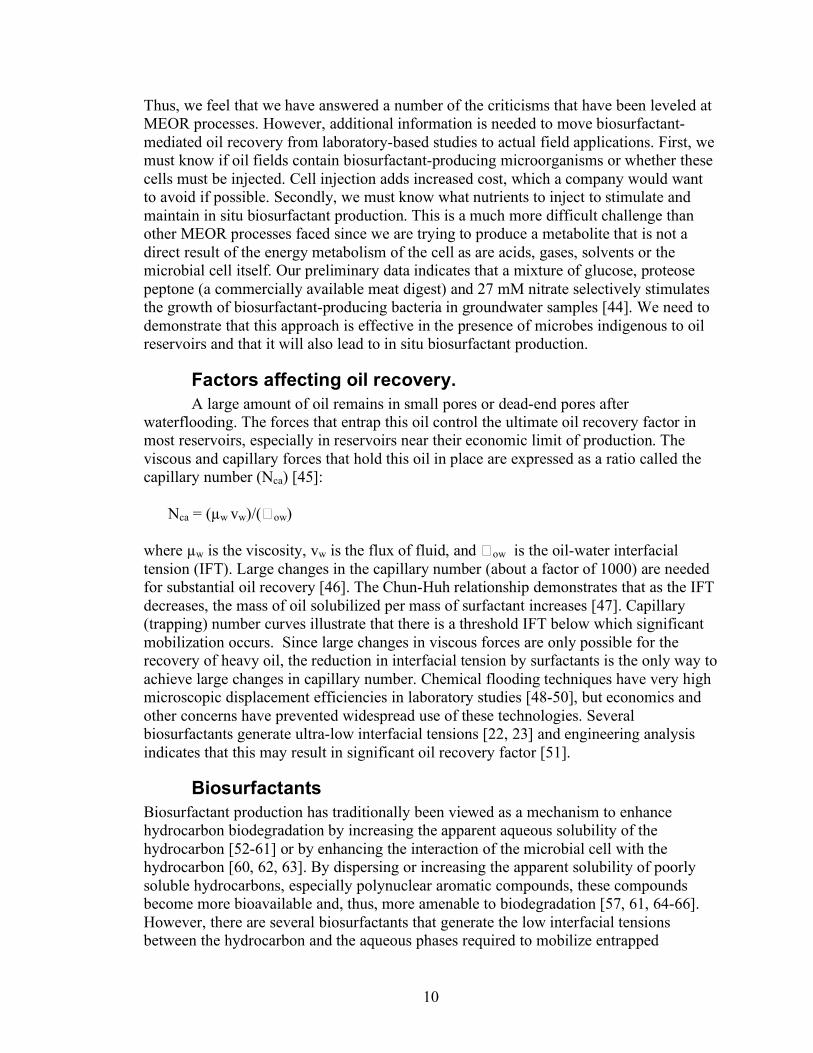
Factors affecting oil recovery. A large amount of oil remains in small pores or dead-end pores after waterflooding. The forces that entrap this oil control the ultimate oil recovery factor in most reservoirs, especially in reservoirs near their economic limit of production. The viscous and capillary forces that hold this oil in place are expressed as a ratio called the capillary number (Nca) [45]: Nca = (µw vw)/(� ow) where µw is the viscosity, vw is the flux of fluid, and � ow is the oil-water interfacial tension (IFT). Large changes in the capillary number (about a factor of 1000) are needed for substantial oil recovery [46]. The Chun-Huh relationship demonstrates that as the IFT decreases, the mass of oil solubilized per mass of surfactant increases [47]. Capillary (trapping) number curves illustrate that there is a threshold IFT below which significant mobilization occurs. Since large changes in viscous forces are only possible for the recovery of heavy oil, the reduction in interfacial tension by surfactants is the only way to achieve large changes in capillary number. Chemical flooding techniques have very high microscopic displacement efficiencies in laboratory studies [48-50], but economics and other concerns have prevented widespread use of these technologies. Several biosurfactants generate ultra-low interfacial tensions [22, 23] and engineering analysis indicates that this may result in significant oil recovery factor [51].
Biosurfactants Biosurfactant production has traditionally been viewed as a mechanism to enhance hydrocarbon biodegradation by increasing the apparent aqueous solubility of the hydrocarbon [52-61] or by enhancing the interaction of the microbial cell with the hydrocarbon [60, 62, 63]. By dispersing or increasing the apparent solubility of poorly soluble hydrocarbons, especially polynuclear aromatic compounds, these compounds become more bioavailable and, thus, more amenable to biodegradation [57, 61, 64-66]. However, there are several biosurfactants that generate the low interfacial tensions between the hydrocarbon and the aqueous phases required to mobilize entrapped

11
hydrocarbon [21, 67-69]. In particular, the lipopeptide biosurfactant produced by Bacillus species [21, 34, 36, 38, 39, 70, 71] and the rhamnolipid produced by various Pseudomonas species [59] reduce the interfacial tension between the hydrocarbon and aqueous phases to very low levels (<0.01 mN/m) [22, 67, 69]. In addition, the critical micelle concentrations are low (20-50 mg/l), indicating that the biosurfactants are
effective at very low concentrations [67]. Figure 2.1 shows the structures of lipopeptide and rhamnolipid biosurfactants. Often, microorganisms produce a series of these compounds that differ in the length and branching of the fatty acid side chains. However, there may also be differences in the number of sugars or amino acids as well as the type of amino acids present in these molecules. How these variations in structure affect the interfacial activity of the compounds is not well understood, but slight Figure 2.1. Biosurfactant structures [72]. A. The lipopeptide biosurfactants made by Bacillus licheniformis and, B. The rhamnolipids made by Pseudomonas species.
variations in structure do affect activity [73]. Since mixtures of synthetic surfactants are known to be more effective than pure surfactants in mobilizing complex hydrocarbons such as crude oil [47], biosurfactants have a natural advantage. The use of biosurfactants to mobilize residual hydrocarbon has met with mixed results. From 20 to 90% of hydrocarbons present in contaminated soils or oil shale cuttings were removed in the presence of biosurfactants [56, 74]. The rhamnolipid biosurfactant produced by certain strains of Pseudomonas was 20 times more effective in solubilizing hexadecane than some synthetic surfactants [55] and mobilized up to 75% of the residual hexadecane from sand-packed columns [75, 76]. However, the number of pore volumes required (40 to 70) was large. Residual oil is recovered when a biosurfactant-producing bacterium and the nutrients needed to support growth are introduced into sandstone cores [38, 77, 78], but residual hydrocarbon recoveries were often low (5 to 20%) and required multiple pore volumes of recovery fluid. We found that the lipopeptide biosurfactant produced by B. mojavensis strain JF-2 mobilized large amounts of residual hydrocarbon from sand-packed columns (Figure 2.2) [43] at concentrations about 10 to 100-fold lower than typically used for synthetic surfactant-enhanced recovery process [79-82]. Approximately 82% of the residual hydrocarbon in sand-packed columns was recovered when less than one pore volume of culture fluid containing about 900 mg/l of the biosurfactant was injected into the column.
(H2C)8HC
R
O
H2C C L-Glu
O
L-Leu D-leu
L-Val
L-Ile D-Leu L-Asp
R= H3CHC
CH3
H3CHC
H2C
CH3
H3CH2C
H2C
H3CH2C
HC
CH3
O
CH3
OH OH
OH OHC
(CH2)6
H2C
CH3
R
O
CH3
OHO
OH OHC
(CH2)6
H2C
CH3
R
O
CH3
HO OH
OH
COOHC O
OHC
H2C
(CH2)6
CH3
COOH
RL1 and RL2
RL3 and RL4
RL1 and RL3, R= RL2 and RL4, R=
A
B
12
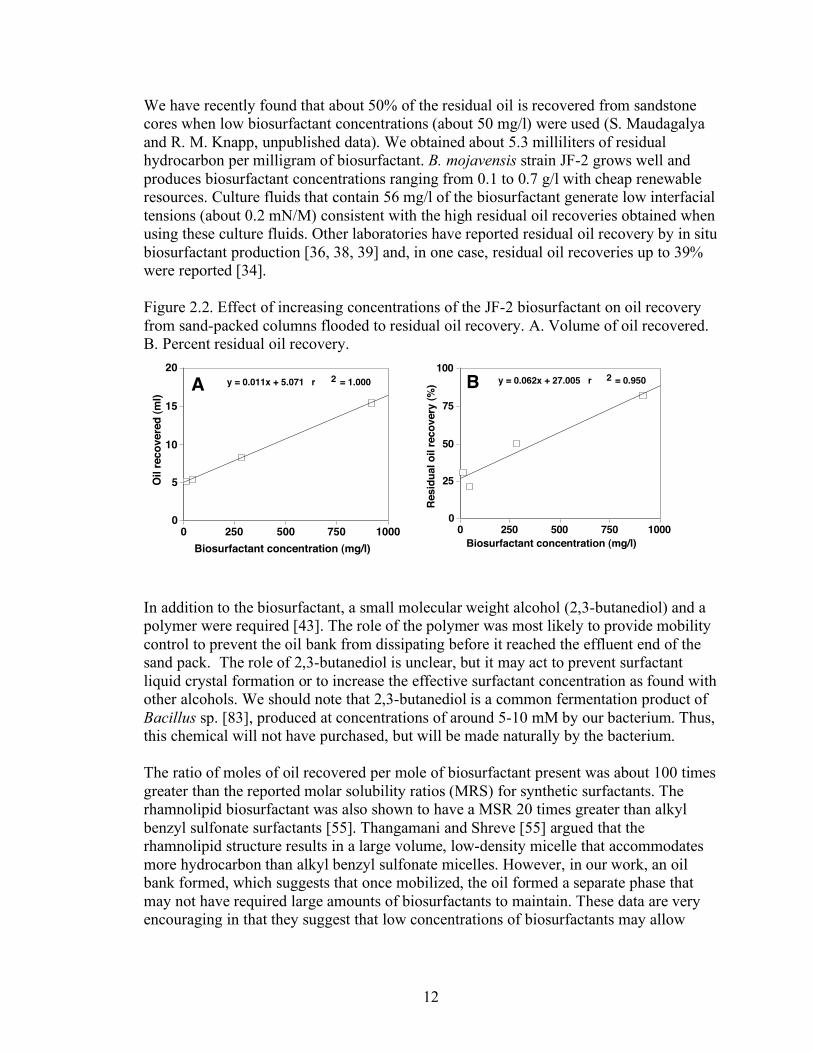
We have recently found that about 50% of the residual oil is recovered from sandstone cores when low biosurfactant concentrations (about 50 mg/l) were used (S. Maudagalya and R. M. Knapp, unpublished data). We obtained about 5.3 milliliters of residual hydrocarbon per milligram of biosurfactant. B. mojavensis strain JF-2 grows well and produces biosurfactant concentrations ranging from 0.1 to 0.7 g/l with cheap renewable resources. Culture fluids that contain 56 mg/l of the biosurfactant generate low interfacial tensions (about 0.2 mN/M) consistent with the high residual oil recoveries obtained when using these culture fluids. Other laboratories have reported residual oil recovery by in situ biosurfactant production [36, 38, 39] and, in one case, residual oil recoveries up to 39% were reported [34]. Figure 2.2. Effect of increasing concentrations of the JF-2 biosurfactant on oil recovery from sand-packed columns flooded to residual oil recovery. A. Volume of oil recovered. B. Percent residual oil recovery.
In addition to the biosurfactant, a small molecular weight alcohol (2,3-butanediol) and a polymer were required [43]. The role of the polymer was most likely to provide mobility control to prevent the oil bank from dissipating before it reached the effluent end of the sand pack. The role of 2,3-butanediol is unclear, but it may act to prevent surfactant liquid crystal formation or to increase the effective surfactant concentration as found with other alcohols. We should note that 2,3-butanediol is a common fermentation product of Bacillus sp. [83], produced at concentrations of around 5-10 mM by our bacterium. Thus, this chemical will not have purchased, but will be made naturally by the bacterium. The ratio of moles of oil recovered per mole of biosurfactant present was about 100 times greater than the reported molar solubility ratios (MRS) for synthetic surfactants. The rhamnolipid biosurfactant was also shown to have a MSR 20 times greater than alkyl benzyl sulfonate surfactants [55]. Thangamani and Shreve [55] argued that the rhamnolipid structure results in a large volume, low-density micelle that accommodates more hydrocarbon than alkyl benzyl sulfonate micelles. However, in our work, an oil bank formed, which suggests that once mobilized, the oil formed a separate phase that may not have required large amounts of biosurfactants to maintain. These data are very encouraging in that they suggest that low concentrations of biosurfactants may allow
0
5
10
15
20
Oil r
eco
vere
d (
ml)
0 250 500 750 1000
Biosurfactant concentration (mg/l)
y = 0.011x + 5.071 r 2 = 1.000A
0
25
50
75
100
Resid
ual o
il r
eco
very
(%
)
0 250 500 750 1000
Biosurfactant concentration (mg/l)
y = 0.062x + 27.005 r 2 = 0.950B

13
supersolubilization or mobilization of hydrocarbon contaminants at much lower concentrations than observed with synthetic surfactants.
Selective stimulation of in situ biosurfactant production. Our laboratory studies clearly show that biosurfactants mobilize significant amounts of residual oil at biosurfactant concentrations made naturally by the cell (e. g., around 30 to 50 mg/l). The next major hurdle to overcome is to develop an approach to produce biosurfactants in the oil reservoir. Many individuals and companies naively think that all one has to do is inject cells and nutrients and the appropriate activity will occur. However, this approach ignores the microbial ecology of the oil reservoir. All oil reservoirs that have been studied contain diverse and active microbial communities [84-89]. Thus, the nutrients could be used by any number of different microorganisms and there is no guarantee that the injected bacterium will be able to compete with indigenous organisms. While it is known that oil reservoirs contain active and diverse microbial communities, we do not know whether biosurfactant-producing bacteria commonly occur in oil reservoirs. If they do, then we only need to develop a nutrient package and injection protocol to selectively stimulate them. Even if one can stimulate the growth of biosurfactant-producing bacteria, there is no guarantee that the biosurfactant will be made since this compound is not directly linked to the energy metabolism of the cell. Thus, we must first understand what triggers biosurfactant production in natural communities. Our hypothesis is that biosurfactant-producing bacteria are common in oil reservoirs. We based this hypothesis on several lines of evidence. Bacillus species and phylogenetically related bacteria are commonly detected in oil production fluids [90, 91] and 85% of the 160 strains of different Bacillus species that we surveyed produced biosurfactants [41]. Thus, it is likely that oil reservoirs will contain biosurfactant producers. In addition, many of the biosurfactant-producing strains that have been used in MEOR have been isolated from oil field production fluids [34, 36, 92-94]. Lastly, biosurfactant-producing bacteria have been detected in a number of undisturbed and contaminated soils indicating that such organisms are widely distributed in nature [95]. We tested this hypothesis by determining the prevalence of biosurfactant-producing bacteria in produced brines and surfaces from production wells from a number of different oil reservoirs that vary in lithology and brine chemistry. Certain strains of Bacillus subtilis, B. mojavensis, and B. licheniformis produce as the cyclic lipopeptides biosurfactants such as surfactin and lichenysin [96]. These biosurfactants share a common mode of assembly through the action of peptide synthetases and a thioesterase [97]. The genetics and control of surfactin production have been extensively studied in B. subtilis [98, 99] and genes homologous to the peptide synthetases and thioesterase have been described from B. licheniformis [97]. A gene probe and set of primers based on the sequence of the peptide synthetase srfA of B. subtilis developed in the McInerney lab detected the presence of srfA in B. mojavensis strain JF-2 (McInerney et al., 2001) and 21 additional strains of B. subtilis subspecies subtilis, B. subtilis subspecies spizizenii, and B. mojavensis isolated from three deserts on two different continents (unpublished data, Youssef 2003). The correspondence between detection of srfA by polymerase chain reaction (PCR) and the ability of the strain to produce surface-active compounds was 90%. Therefore, this gene can be used to

14
determine the prevalence of biosurfactant-producing bacteria from various reservoirs with a high degree of confidence. PCR was used because of its greater accuracy and sensitivity compared to other techniques (Gruntzig, et al. 2001; Harms, et al., 2003). Because of the large difference in gene sequence between licA and srfA-A (Konz et al. 1999), we had to design another set of primers to detect the homologous licA sequence in B. licheniformis strains. Similar to the situation for Bacillus, the rhlR gene was used to detect an essential gene for rhamnolipid production in Pseudomonas aeruginosa and related species. These molecular approaches will allow us to detect biosurfactant producers in brine and surface samples even if we have difficulty in culturing these organisms. Whether biosurfactant-producing bacteria are present or not in the formation, the next step will be to selectively stimulate their growth and activity. We hypothesize that we can selectively stimulate the growth of these organisms by the types and concentrations of nutrients that are injected into the formation. During our previous DOE funded project, we found that the addition of glucose, 27 mM nitrate and Proteose peptone (a commercially available meat digest) to groundwater inoculated with our biosurfactant producer (Bacillus mojavensis strain JF-2) selectively stimulated its growth and metabolism. The presence of 2,3-butanediol was detected when Proteose peptone was added and a very high percentage of the viable microbial population was biosurfactant-producing bacteria when 27 mM nitrate was used. We need to replicate this experiment to ensure that this approach will be effective in oil reservoirs and that this approach will also lead to in situ biosurfactant production.
Project Objectives The ultimate goal of the project was to move biosurfactant-mediated oil recovery from laboratory investigations to actual field applications. In order to achieve this objective, it was first necessary to determine if oil reservoirs contain biosurfactant-producing microorganisms. If biosurfactant producers are not present, then inoculation f the oil reservoirs biosurfactant-producing microorganisms would be necessary. Secondly, it is also necessary to know the types of nutrients needed to stimulate biosurfactant production in the reservoir. The specific objective of this project were: (1) to determine the prevalence of biosurfactant producers in oil reservoirs and thus determine the need for cell injection, and (2) to test the efficacy of nutritional supplements to stimulate growth and biosurfactant production in oil reservoir brines.
Scope of Work The prevalence of indigenous bacteria that produce rhamnolipid or lipopeptide biosurfactants was determined by cultivation-dependent and cultivation-independent methods. We developed polymerase chain reaction (PCR) methods to detected genes involved in the production of lipopeptide and rhamnolipid biosurfactants in DNA extracted from production fluids obtained from reservoirs with different salinities. We also surveyed these brines for the presence of biosurfactant producers by using a number of different cultivation approaches. We systematically tested different nutrients to

15
determine the optimal formulation that stimulates biosurfactant production in these brines. Our work shows that biosurfactant producers are prevalent but the bioaugmentation (e.g., the addition of an inoculum) may be the recommended strategy to stimulate biosurfactant production in oil reservoirs.

16
3. Detection and stimulation of biosurfactant activity in oil field brines
Abstract The stimulation of biosurfactant production in situ may be an effective method to recover crude oil that remains entrapped in oil reservoirs as current recovery methods reach their economic limit. Knowledge of the prevalence of biosurfactant producers in oil reservoirs is needed to determine whether stimulation of indigenous microorganisms is possible or whether inoculation will be required. The prevalence of biosurfactant producers in two carbonate and four sandstone oil-bearing formations in Oklahoma was determined by cultivation-dependent methods. Wells that had production from the formation of interest without inter-mingling of fluids with other formations were selected for analysis. Brine analysis showed that the formations had salinities ranging from 3.2% to 15.6% and calcium concentrations ranging from 1.6 to 13.4 g/l. Sulfate levels were low in all of the brines except in brines from two wells. The sulfide levels were low in all brines sampled. Viable microorganisms were not detected in brine samples collected from any of the formations by agar plating methods whether or not the brine was heat-treated to stimulate germination of Bacillus spores. Aerobic and anaerobic most probable number analyses using Plate count broth (PCB) with or without 5% NaCl showed growth in low numbers (23 and 240 cells/ml) only in two of the formation fluids. Low numbers of heterotrophic microorganisms (ranging from 10 to 104 cells/ml) were detected with Peptone-Yeast Extract-Tryptone-Glucose (PYTG) and one-tenth-strength PYTG media with and without 10% NaCl, but no biosurfactant activity was detected. Biosurfactant activity was detected in enrichment cultures of all brines, but was much less than that observed when the enrichments were augmented with a known biosurfactant producer. Molecular functional gene analysis showed the presence of surfactin or lichenysin (srfA/licA) and gyrase (gyrA) genes (indicating the presence of microorganisms related to Bacillus subtilis and/or Bacillus licheniformis) in only one enrichment culture. The rhlR gene (rhamnolipid gene regulator) was not detected in any of the enrichments. Nutrient amendment stimulated indigenous biosurfactant activity in all formation fluids. Maximum biosurfactant production was observed when brines were supplemented with nutrients and a known biosurfactant producer (in this case B. licheniformis strain RS-1). The nutrient combination that gave maximal biosurfactant production by B. licheniformis strain RS-1 was a mixture of trace metals, nitrate and either glucose or molasses. These results suggest that biosurfactant producers related to the Bacillus subtilis-Bacillus licheniformis are present but not numerous in the produced fluids from different oil reservoirs. Nevertheless, effective in situ biosurfactant production occurred when the brines were augmented with a known biosurfactant producer (B. licheniformis strain RS-1) and nutrients (glucose, nitrate, and metals).
Overview Bacillus, Clostridium and Pseudomonas species have often been used in the MEOR process because of their ability to form spores (Bacillus and Clostridium), surfactants, gases, alcohols, solvents and sometimes polymers (22, 32, 41). Spores have the ability to withstand reservoir conditions and at the same time germinate and produce active microorganisms to produce the products that can be used for MEOR activities. The other products discussed earlier have significant use in the MEOR process. Kianipey et al. (69)

17
investigated the mechanisms of oil displacement by three different microorganisms (Bacillus sp., Pseudomonas sp. and Clostridium sp.) and found that Bacillus licheniformis strain JF-2, decreased surface tensions, increased the wettability and sweep efficiency of recovery fluids in unconsolidated sand-packed flow cells. The production of biosurfactants in addition to gas production, and the change in wettability by the strain JF-2 was believed to contribute to the reduction in the residual oil saturation. Pseudomonas aeruginosa was less effective for oil recovery because this bacterium had negligible gas production and no significant increase in the wettability of the sand matrix was observed. Clostridium acetobutylicum produced significant amounts of CO2, which reacted with the brine forming carbonic acid, which could increase the wettability of the system. From these results, it is apparent Bacillus species have the most potential in reducing residual oil saturation. Biosurfactant production by Bacillus species haven been used in innumerable cases for improving oil recovery due to its properties of reducing interfacial and surface tensions between oil and water phases. However other properties of the bacteria such as biomass formation have also been utilized in the MEOR process. Several researchers have used Bacillus species to improve sweep efficiency (2, 7). Zekri et al. (70) showed that microbial flooding with Bacillus species isolated from UAE hot water streams decreased the residual oil saturation to around 11% and also post microbial flooding the permeability dropped from 19 md to 2.4 md in six different limestone cores. Jenneman et al. (71) and Raiders et al. (72) showed that the in situ growth of Bacillus species markedly reduced permeability (almost by 100%) while Pseudomonas species caused change in the permeability of Berea sandstone cores. Given the importance of biosurfactant production for oil recovery, it is important to know whether biosurfactant-producing bacteria are present in oil reservoirs. Bacillus species and Pseudomonas species have been isolated from a range of different environments. Bodour et al. (43), found that 11 out of 16 isolates from undisturbed and contaminated soils belonged to the Bacillus genus. These isolates also had surface tension activity of as low as 33.1mN/m. Four of the isolates were Pseudomonas species, two of which were positive for the presence of the one of the genes involved in rhamnolipid production (rhlB). Bacillus licheniformis strain BAS50 and Bacillus strain JF-2 were both isolated from oil reservoirs in Germany (7, 49) and Carter County, Oklahoma, (6, 50), respectively. Both produced biosurfactants that substantially lower the interfacial tension between water and crude oil under conditions that exist in the petroleum reservoir (6, 49, 50). Almeida et al. (13) have found strains of the genera Bacillus, Pseudomonas and Micrococcus species in an oil reservoir from the Recôncavo basin of Bahia, Brazil. Several Bacillus species and phylogenetically-related bacteria were found in production fluids from oil reservoirs in Russia (51, 52). While the above anecdotal observations suggest that Bacillus species potentially useful for oil recovery are present in oil reservoirs, clearly a more comprehensive study is needed that directly assesses the presence of biosurfactant producers in different petroleum reservoirs. For in situ microbial processes such as biosurfactant production is to be successful, we must first determine whether stimulation of indigenous biosurfactant-producing microorganisms is possible or whether such microorganisms will have to be introduced.

18
Here, I use a cultivation-dependent approach to determine the presence of biosurfactant-producing Bacillus species in the oil reservoirs with varying salinity and lithologies. Biosurfactant-producing species were detected in only a few formations and only after enrichment indicating that their numbers are low when they are present. So, a nutrient mixture that would stimulate maximum biosurfactant production by a strain of Bacillus licheniformis that could serve as an inoculum was determined.
Materials and Methods
Sampling sites
Brine samples were collected from six different Oklahoma geological formations from the Pennsylvanian age. The Hunton and Wewoka formations are carbonate formations while the Earlsboro, Gilcrease, Skinner flood and Hart formations are sandstone formations (Table 3.1). However, intermingling of limestone with sandstone occurs in the Gilcrease formation. Wells from these formations are considered marginal since the daily oil production was about 10 barrels or less per day. The Earlsboro and Skinner flood reservoirs were water flooded with Wilcox formation water and Layton sand formation water, respectively. The other formations were not water flooded. The injection wells for the Earlsboro formation were treated with biocides while the production wells were treated with anti-corrosion fluids (supplier’s product number 1630). The injection wells are about 1 km away from the production wells so the biocide treatment was not expected to impact the microbiological analyses. The Gilcrease and Skinner flood wells were also treated with anti-corrosion fluids. All of the anti-corrosion fluids mentioned above are not listed as biocides and are not expected to impact the microbiological analyses. Brine samples were collected from production wells that produced fluids from the specified and not from neighboring formations. None of the production wells were treated with biocides and each production well was running for 3-7 days prior to sampling. Ideally, two production wells from each formation were sampled for each formation. This was not possible for Wewoka, Gilcrease, and Hart formations because only one well produced enough brine for sampling or the other wells produced fluids from multiple formations.
Sample Collection
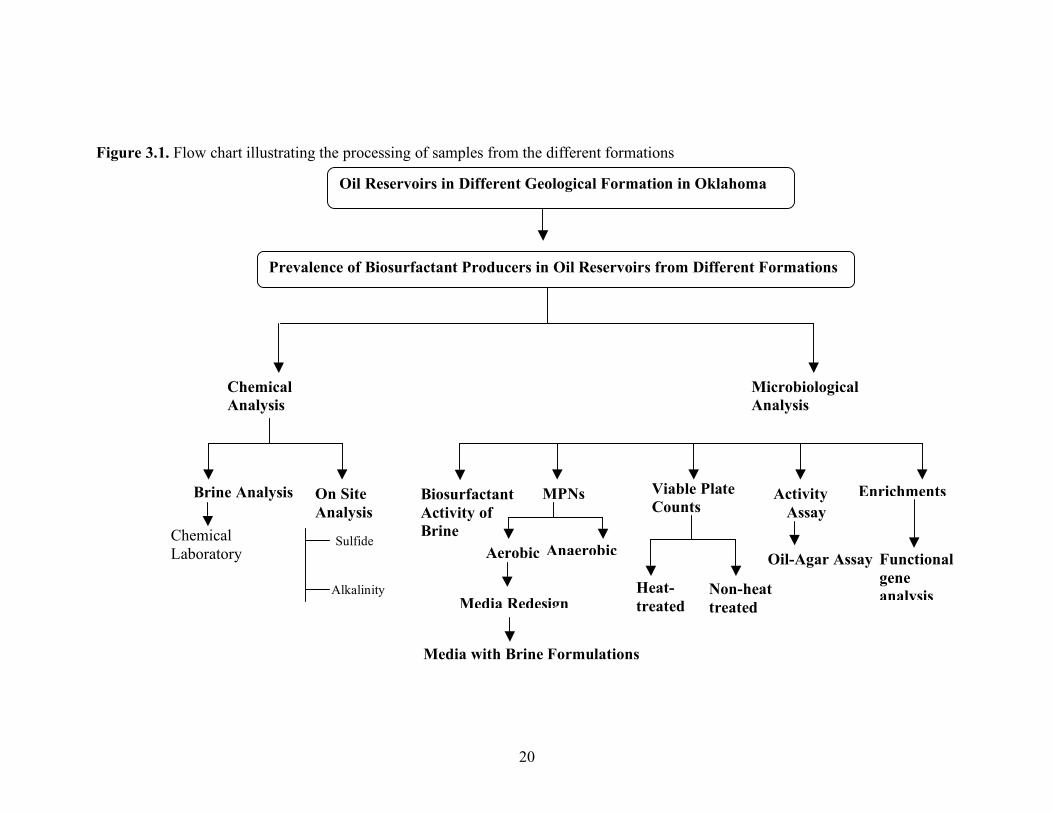
The samples were collected in each of two sterile, 1.5-liter Biobags (Nalgene) and 2-liter separatory flasks for each well. The brine was allowed to overflow to flush out the entrapped air and to reduce the amount of crude oil in the container. The biobags were capped and the flasks were closed with rubber stoppers and immediately stored on ice during transit back to the laboratory. The samples were then stored at 4oC until analyzed. The samples were processed for chemical, microbial and molecular analyses as illustrated in Figure 3.1.

19
Table 3.1. Characteristics of the oil reservoirs sampled.
Formation
County Comment Lithology
Well name
Legal Description Total depth(m)
Avg. oil production (Barrels /day)
Hunton
Pontotoc County
Not water flooded
Carbonate
ROB11
SE.NE SW19-5N-5E 646.2-694.9
ROB2 S:19, T:5N, R:5E 728.2 10.5
Wewoka Pontotoc County
Not water flooded
Carbonate
ROB14 S:19, T:5N, R:5E 818.4 10.5
Earlsboro
Seminole County
Naturally flooded with Wilcox formation water. Injection wells, but not production wells were treated with biocide. Anti-corrosion treated.
Sandstone
ERL1
S:13, T:9N, R:5E n/a
1.2
ERL5
S:18, T:9 N, R:6E n/a
0.5
Gilcrease Seminole County
Not water flooded. Anti-corrosion treated.
Sandstone Limestone
GIL1 S:6, T:11N, R:7E n/a n/a
Skinner flood
Logan County
Naturally flooded with Layton sand formation water. Production wells treated with anti-corrosion.
Sandstone TUBER 1 SE:NW:SEC. 36-16N-3W n/a ~5
DAVIS1 NE:SE:SEC. 36-16N-3W n/a ~5 Hart (Deese)
McClain County
Sandstone HEWIIT 4-32
NW NE SEC. 32-5N-3W n/a
20
Figure 3.1. Flow chart illustrating the processing of samples from the different formations
Prevalence of Biosurfactant Producers in Oil Reservoirs from Different Formations
Oil Reservoirs in Different Geological Formation in Oklahoma
Chemical Analysis
Microbiological Analysis
Brine Analysis On Site Analysis
Sulfide
Alkalinity
Chemical Laboratory
Enrichments Biosurfactant Activity of Brine
MPNs Viable Plate Counts
Activity Assay
Oil-Agar Assay
Heat- treated
Non-heat treated
Anaerobic Aerobic
Media Redesign
Media with Brine Formulations
Functional gene analysis

21
Chemical Analysis:
Chemical analysis of the aqueous portion of the sample (brine) was done by the Environmental Resource Technologies, LLC, Ada, Oklahoma. The analyses of sulfide, CO2 and dissolved oxygen measurements were carried out on site by using the Hach and Chemetrics methods (HACH Chemical Company, Loveland, Colorado). The rest of the tests and analyses were done off-site by using EPA certified methodologies. To avoid any sulfide loss, 10µl and 100 µl of the brine samples were fixed with DMPD (N,N- dimethyl- p- phenylenediamine sulfate) reagent (per liter, Zn (CH3COO)2•2H2O, 1g; DMPD•HCl, 1g; and concentrated H2SO4, 50 ml) on the site. Before reading the absorbance, 0.1 ml of a ferric chloride reagent (per liter, FeCl3•6H2O, 250g) was added to each fixed brine sample to develop the color. The absorbance was measured at 660 nm after 10 min. The concentration of sulfide was calculated from a sulfide standard curve ranging from 0 to 50 mg/L of sulfide (53). To remove particulates in brine, 5 ml of a brine sample was filtered by using a 0.45-µm filter. The alkalinity test was performed by the two-dye titration method by using the HACH kit (HACH Chemical Company. Loveland, Colorado). The filtrate was poured into the HACH titration bottle. The first indicator (phenolphthalein) did not change the color of the brine so the titration was done with concentrated H2SO4 after the addition of the second indicator, bromocresol green, until the sample turned pink. The end point was when the color did not change with further H2SO4 addition. The tube and the titration bottle were washed thoroughly with distilled water and the water was discarded.
Biosurfactant activity assay
Oil spreading assay as described by Youssef et al. (10) was used to determine the presence of surface-active compounds in each brine sample. In a large Petri dish (25cm in diameter), 50 ml of distilled water was added followed by the addition of 20 µl of crude oil. Next, triplicate 10 µl samples of un-filtered brine were carefully added onto the oil surface. The diameter of clear zone was measured in triplicate for each sample. An overnight culture of Bacillus licheniformis strain RS-1 was used as a positive control for biosurfactant activity. B. licheniformis strain RS1 produces a lipopeptide biosurfactant and was isolated from an oil field, (D. R. Simpson, unpublished data).
Enumeration Methods
The three-tube most probable number technique was used to enumerate heterotrophic organisms in the production fluids from the different formations. The procedure was modified to use 96-well plates where three wells filled with medium were used at each dilution, which ranged from 10-1 to 10-8. Duplicate MPN series were done for each brine sample. The MPN numerations were performed with the following media: Plate Count Broth (PCB), (Difco, Inc.); PCB with 5% NaCl; Peptone-Yeast Extract-Glucose-Tryptone (PYTG) medium as described by Balkwill et al. (8); and one-tenth strength PYTG. To select for halotolerant, Bacillus-like biosurfactant producers, Medium E (a
22
medium with sucrose, yeast extract, and nitrate) (6) and Medium E without the addition of 5% NaCl were also used for the MPN enumerations. The analysis of the chemical composition of the brines from the Earlsboro and Gilcrease showed that CaCO3 and NaCl were the major components of the brine (Table 4). For these two formations, MPN enumerations were also conducted with the one-tenth PYTG medium that was supplemented with CaCO3 and NaCl that corresponded to the concentration present in each formation. These MPN series were serially ten-fold diluted to 10-6. For the Skinner flood and Hart formations, the MPN analyses were also done with one-tenth strength PYTG medium that was supplemented with NaCl to match the chloride concentration of the brine. The temperature of the brine samples ranged from 20o C to 24o C. Assuming that some heat was lost as the fluids were produced from the formation, it is likely that the reservoir temperatures were still within the mesophilic range for microbial growth. For this reason, each MPN series was incubated at 370C for 11 days. The highest dilutions that were positive for growth were tested for biosurfactant production by the oil-spreading assay as described earlier. Bacillus licheniformis strain RS-1 was used as a positive control for all of the above MPN enumerations. All of the above MPN enumerations were done aerobically. In addition, MPN enumerations with PCB and Medium E were also done anaerobically. Anaerobic enumerations were achieved by using the modified 3 tube MPN method with 96 well plates. The medium used was PCB, PCB with 5% NaCl, Medium E, and Medium E with 5% NaCl. Each MPN series was done in duplicates. The medium was dispensed in the 96-well plate in an anaerobic chamber and the production fluids from each well were serially diluted from 10-1 to 10-8. The plates were then placed in an airtight container, which was then removed from the anaerobic chamber and incubated at 37o C for 5 days. Anaerobic overnight culture of B. licheniformis strain RS-1 culture grown in PCB was used as a positive control for all the anaerobic enumerations. Enumerations were also done with the MOPS minimal medium described by Palmer et al. (57) to enumerate Pseudomonas-like biosurfactant producers in the production fluids from Skinner flood and Hart formations. Pseudomonas aeruginosa ATCC strain 10145 was used as the positive control for enumerations with the MOPS minimal medium. The 96-well plates were incubated aerobically at 37o C for 11 days. The dilutions that were positive for growth were tested for biosurfactant production by the oil-spreading assay as described earlier. Viable agar plate counts were done with Plate Count Agar (PCA) (Difco, Inc.) with and without 5% NaCl and with one-half strength PCA with and without 5% NaCl. An aliquot of each brine was serially, ten-fold diluted in phosphate buffer (per liter, K2HPO4, 13.9 g; KH2PO4 2.7 g; pH of 7.2) and 100 µl of each dilution from 10-1 to 10-4 was plated onto triplicate agar plates of the above media. B. licheniformis strain RS-1 was used a positive control and was streaked onto an agar plate of each medium. Agar plates that were streaked with sterile phosphate buffer served as the negative control. To select for Bacillus-like, biosurfactant producers, one milliliter of each brine sample was incubated at 850C for 20 min to kill vegetative cells and to germinate any spores that
23
may be present in the brine. The heat-treated brine was then serially diluted and inoculated onto the agar medium described above. To screen for biosurfactant producers, an oil overlay medium was prepared as described by Morikawa et al. (54), except that Luria-Burtani (LB) agar was used. The plates were then inoculated with diluted brine or heat-treated brine as described above. After the agar solidified approximately 35 µl of sterile crude oil was spread over each LB agar plate. All agar plates were incubated at 37o C for at least 48 hr.
Enrichments
Since MPN analyses did not detect biosurfactant producers, enrichments were established by adding 10 ml of brine from to each of two bottles containing 20 ml of either full-strength Plate Count Broth (PCB), one-half strength PCB, or one-tenth strength PCB. A second series of enrichments with duplicate bottles for each of the above media was prepared and each bottle was inoculated with 500 µl of an overnight culture of B. licheniformis strain RS-1 to test for any inhibitory substances that may be present in the brine. Each enrichment was incubated aerobically at 370
C for 11 days with shaking at 90 rpm. The oil-spreading assay as described by Youssef et al. (10) was used to determine biosurfactant activity. After 11 days of incubation, each enrichment was centrifuged (7000 rpm; 20 min; 4oC) and the pellet was re-suspended in TE buffer and stored at -20o
C until used for DNA extraction and analysis.
Molecular approaches
DNA was extracted from the enrichment cultures by the conventional Phenol-Chloroform-Iso Amyl alcohol method (55). Taq polymerase chain reaction (PCR) was done by using a thermocycler with the DNA extracted from the enrichment cultures. The universal eubacterial 16S ribosomal DNA gene primers, forward 27 F (5’ AGA GTT TGA TCM TGG) and reverse 1492R (5’ TAC CTT GTT ACG ACT T) were used to identify the presence of bacterial DNA. The srfA/licA primers, sfrA/licA F (5’ CAA AAK CGC AKC ATA CCA CKT TGA G) and srfA/licA R (5’ TCA TAR AGC GGC AYA TAT TGA TGC) were used to amplify the surfactin- and lichenysin-like genes that may be present. These primers were developed by Dr. D. Randall Simpson (personal communication). The gyrA primers, gyrA F (5’ CAG TCA GGA AAT GCG TAC GTC CTT) and gyrA R (5’ CAA GGT AAT GCT CCA GGC ATT GCT), designed by Roberts et al. (65) were used to amplify a portion of the gyrase gene to indicate the presence of Bacillus subtilis and related species. The rhlR primers, rhlR F (5’ CTG CGC TCC WCG GAA ATG GTG) and rhlR R (5’ TCT GGA TGW YCT TGW GGT GGA AGT TC), were used to detect the potential to make rhamnolipids found in Pseudomonas species. The rhlR primers were designed by D. R. Simpson (personal communication). For the 16S rDNA PCR amplification, the reaction mixture consisted of 5µl of 10X buffer; 5µl of 5M Betaine; 4µl of 25mM MgCl2; 1µl of 10mM dNTPs; 1.2 µl each of 5pmol/µl of 16S forward and reverse primer, 0.24 µl of Platinum Taq polymerase
24
(Invitrogen), 3 µl of 5ng/µl (15ng) of template DNA. The reaction was made up to 50µl reaction by the addition of 29.36µl of deionized water. The thermocycler was programmed for an initial denaturation for 5min at 94oC, 30 cycles of 1min at 94oC for denaturation, 2min at 42oC for annealing, 2min at 72oC for extension followed by a 6 min at 72oC for a final extension. A 1465bp amplicon was expected at the end of the PCR reaction. The reaction mixture for the srfA/licA PCR consisted of 5µl of 10X buffer, 2.5µl of 25mM MgCl2, 1µl of 10mM dNTPs, 1µl each of 5pmol/µl of srfA/licA forward and reverse primers, 0.5µl of DMSO, 0.25 µl of Platinum Taq Polymerase (Invitrogen) and 3 µl of 5ng/µl (15ng) of template DNA. The reaction was made up to a 50µl reaction by the addition of 35.75µl of deionized water. The thermocycler was programmed for an initial denaturation for 5min at 95oC, 10 cycles of 35seconds at 94oC for denaturation, 35secondsmin at 55oC to a touchdown to 50oC for annealing, 45seconds at 72oC for extension. An additional 23 cycles was programmed at 95oC for denaturation, 35seconds at 50oC for annealing, 45seconds at 72oC for extension followed by 6 min at 72 oC for a final extension. A 273bp amplicon was expected at the end of the PCR reaction. A reaction mixture that was used for the srfA/licA PCR was used for the rhlR PCR except for the different primers. The thermocycler was programmed for an initial denaturation for 5min at 95oC, 10 cycles of 40seconds at 95oC for denaturation, 40seconds at 57.3oC to a one-degree touchdown to 52.3oC each for 40seconds for annealing, 45seconds at 72oC for extension. An additional 23 cycles was programmed at 95oC for denaturation, 40seconds at 52.3oC for annealing, 45seconds at 72oC for extension followed by 7 min at 72oC for a final extension. A 300bp amplicon was expected at the end of the PCR reaction. The reaction mixture for the gyrA PCR consisted of 2.5µl of 10X buffer, 2µl of 25mM MgCl2; 2µl of 10mM dNTPs; 0.5µl each of 5pmol/µl of gyrA forward and reverse primers, 0.125 µl of Platinum Taq polymerase (Invitrogen) and 2 µl of 5ng/µl (10ng) of template DNA. The reaction was made up to 25µl by the addition of 15.375µl of deionized water. The thermocycler was programmed for an initial denaturation for 4min at 94oC, 35 cycles of 1 min at 94oC for denaturation, 1min at 48oC for annealing, 1min 30seconds at 72oC for extension followed by a 10min cycle at 72oC for a final extension. A 1024b amplicon was expected at the end of the PCR reaction. To check for non-specific amplification, B. licheniformis strain RS-1 DNA was used as a positive control for all the PCR reactions except for rhlR PCR where Pseudomonas aeruginosa ATCC 10145 DNA was used. For all the PCR reactions deionized water was used as a negative control for all the reactions. Gel electrophoresis was performed on all the PCR end products to visualize the banding patterns. A 1% Agarose (Promega) gel was used for the electrophoresis process. A 1Kb Ladder was also used as a marker to identify the appropriate size of the band achieved.
Nutrient treatments
A series of nutrient components were tested to determine the optimal nutritional formulation needed to maximize the production of biosurfactant activity in the brine. The final concentration of each nutrient was: molasses (1%)(v/v); glucose (10g/L); proteose
25
peptone (10g/L); glycerol (10ml/L); NaCl (20g/L); NaNO3 (1g/L); and K2HPO4 (1g/L). Combinations of each of the nutrients were also tested separately by deleting one or two components at a time. Single-component and two-component additions were also tested. The treatments where NaCl, NaNO3 and K2HPO4 were the only nutrients present in the medium were not done, as there was no carbon source present. Each treatment was done in triplicate in 24-well plates in which brine from the formation was used to bring the final volume of each well to 2 ml. An identical set of nutrient treatments prepared in brine was inoculated with 200 µl of an overnight culture of B. licheniformis strain RS-1. As a positive control, each nutrient treatment was also prepared with sterile distilled water and inoculated with 200 µl of an overnight culture of B. licheniformis strain RS-1. For the Skinner flood formation, a reduced nutrient treatment regime was used where only molasses, glucose, and NaNO3 were tested. Biosurfactant activity was measured by the oil-spreading assay after 3, 5, and 7 days of incubation. Another series of nutrient treatments was conducted as described above except that oxygen was excluded. The final concentration of the nutrients tested was: molasses (1%) (v/v); glucose (10g/L); NaNO3 (1g/L); and Wolins’ metals solution (25ml/L) (56). Combinations of each of the nutrients were also tested separately by deleting one or two components at a time. Single-component and two-component additions were also tested. Each nutrient treatment was done in triplicate in Balch tubes and brine from the formation was used to bring the final volume to 5 ml. The headspace of the serum tubes was replaced with N2 gas and was sealed with a rubber stopper after the addition of the nutrient components. An identical set of nutrient treatments was inoculated with 250 µl of an overnight culture of B. licheniformis strain RS-1 grown anaerobically in PCB. As a positive control, each nutrient treatment was also prepared with sterile deionized water and inoculated with 250 µl of an overnight culture of B. licheniformis strain RS-1 grown anaerobically in PCB. The uninoculated nutrients prepared in sterile deionized water served as the negative control. Anaerobic nutrient treatments were tested with the brines obtained from Hunton, Wewoka, and Earlsboro formations only. Biosurfactant activity was measured by the oil-spreading assay after 3, 5, 7 and 14 days of incubation.
Results
Chemical assays
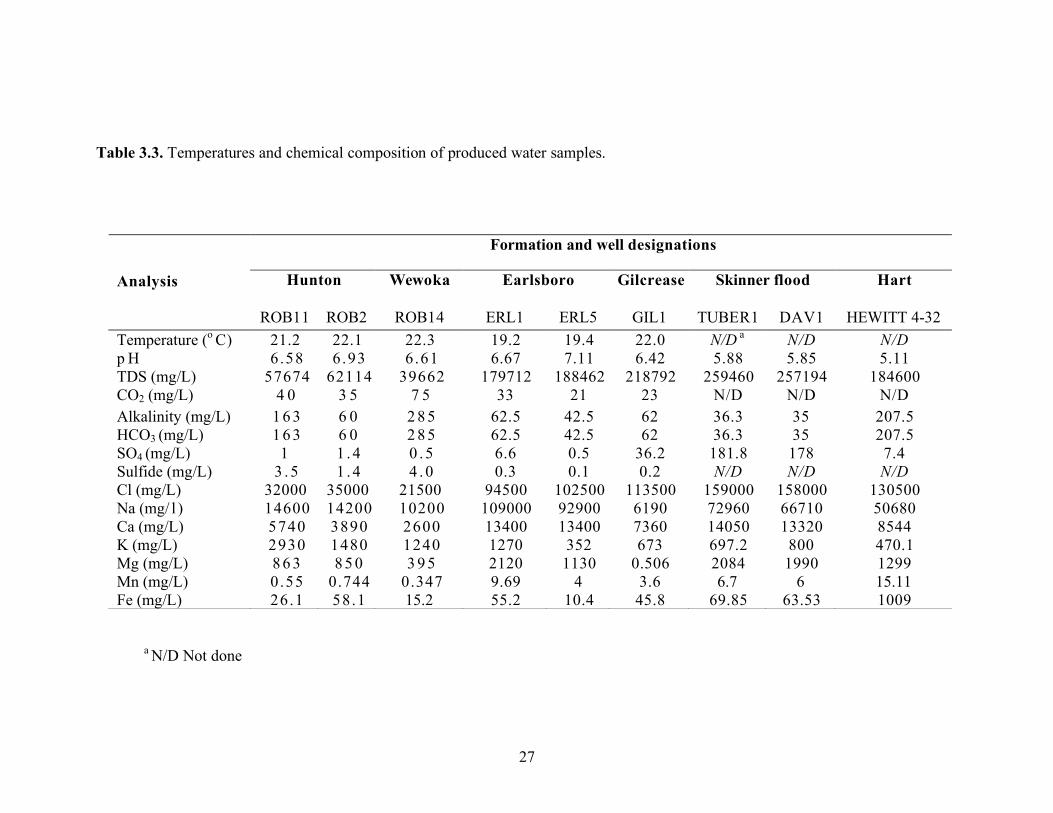
In situ microbial processes require an understanding of the reservoir factors that control microbial growth (66). The composition and ionic strength of the aqueous phase controls both the physiological types of microorganisms present as well as their growth and activity. Table 3.3 summarizes the chemical composition of the produced brines from six Oklahoma formations. The dominant cations were sodium, calcium, potassium and magnesium with chloride being the dominant anion. The presence of these components along with magnesium and iron indicate that the brines contain the major inorganic nutrients required for microbial growth. In addition, the most commonly used microbial sulfur sources, sulfate and sulfide, were present in all of the brines. Many microorganisms require CO2, bicarbonate, or carbonate for growth. The alkalinity values indicate that carbonate ions were present in all of the sampled brines. As expected, the
26
brines obtained from the carbonate formations (Wewoka and Hunton formations) had higher alkalinity values than those from sandstone formations, except the brine from the Hart formation also had high levels of alkalinity. Assuming that chloride is the major ion that contributes to the salinity, the salinity of the sampled reservoir fluids ranged from 2.1% to 15.6%. Total dissolved solids of the brines ranged from about 39,700 to 259,500 mg/L. The wide range of salinity and total dissolved solids indicates that ionic strength will be an important factor that governs microbial growth and activity in Oklahoma reservoirs. It may be difficult to obtain a single biosurfactant producer that can function over this wide range of salinity so treatments may have to be tailored to match specific reservoir conditions. Sulfate and sulfide were also analyzed to determine the potential for sulfate reduction, which often leads to souring and corrosion. Sulfate levels were low (less than 10 mg/L) in all but two of the brines. The brines from the Gilcrease and Skinner flood formations had sulfate concentrations ranging from 36.2 to about 180 mg/L, respectively. Sulfide concentrations were low (less that 4.0 mg/L) in all of the sampled brines, even in the brines that contained higher sulfate concentrations. These data indicate that the potential for sulfate reduction is low in all formations except the Skinner flood and Gilcrease formations where the high levels of sulfate may lead to an increase in sulfide production during nutrient treatments. To determine if the sulfide concentration and alkalinity changed as a result of sample storage, analyses for these two brine components were also done on site immediately after sample collection. The on-site, sulfide concentrations (Table 3.4) agreed well with those obtained during laboratory analysis. Both protocols indicate low levels of sulfide were present in all of the brines that were analyzed. Alkalinity was measured on site with a HACH test kit (HACH chemical company), which is not as precise as the titration method used in the laboratory. However, there was good agreement between the on-site and in laboratory alkalinity data for four of the eight brine samples (Tables 3.3 and 3.4). For the other four brine samples, the laboratory analyses were lower by a factor of about 2 to 3 fold, indicating that the bicarbonate equilibrium had changed with sample storage.
27
Table 3.3. Temperatures and chemical composition of produced water samples.
a N/D Not done
Formation and well designations
Hunton
Wewoka Earlsboro Gilcrease Skinner flood Hart
Analysis
ROB11 ROB2 ROB14 ERL1 ERL5 GIL1 TUBER1 DAV1 HEWITT 4-32
Temperature (o
C) 21.2 22.1 22.3 19.2 19.4 22.0 N/D a N/D N/D
p H 6.58 6.93 6.61 6.67 7.11 6.42 5.88 5.85 5.11
TDS (mg/L) 57674 62114 39662 179712 188462 218792 259460 257194 184600
CO2 (mg/L) 4 0 3 5 7 5 33 21 23 N/D N/D N/D
Alkalinity (mg/L) 1 6 3 6 0 2 8 5 62.5 42.5 62 36.3 35 207.5
HCO3 (mg/L) 1 6 3 6 0 2 8 5 62.5 42.5 62 36.3 35 207.5
SO4 (mg/L) 1 1 . 4 0 . 5 6.6 0.5 36.2 181.8 178 7.4
Sulfide (mg/L) 3 . 5 1 . 4 4 . 0 0.3 0.1 0.2 N/D N/D N/D
Cl (mg/L) 32000 35000 21500 94500 102500 113500 159000 158000 130500
Na (mg/ l ) 14600 14200 10200 109000 92900 6190 72960 66710 50680
Ca (mg/L) 5740 3890 2600 13400 13400 7360 14050 13320 8544
K (mg/L) 2930 1480 1240 1270 352 673 697.2 800 470.1
Mg (mg/L) 8 6 3 8 5 0 3 9 5 2120 1130 0.506 2084 1990 1299
Mn (mg/L) 0.55 0.744 0.347 9.69 4 3.6 6.7 6
15.11
Fe (mg/L) 26.1 58.1 15.2 55.2 10.4 45.8 69.85 63.53 1009

28
Table 3.4. The concentrations of sulfide and alkalinity of reservoir fluids measured by on-site analyses. Formation Well Names Sulfide
Concentration (mg/L)
CO32-
(mg/L)
Hunton ROB 11 2.5 180 ROB 2 0.7 120 Wewoka ROB 14 2.4 300 Earlsboro ERL1 0 120 ERL5 0 120 Gilcrease GIL1 0 140 Skinner flood TUBER1 0.1 60 DAVIS1 0.1 40 Hart HEWITT 4-32 N/D a N/D
a N/D Not done
Presence of surface-active molecules in brine
To test for the presence of surfactant-like molecules, the oil-spreading assay described by Youssef et al. (10) was done with the production fluids from the different formations. Table 3.5 summarizes the results obtained from the oil-spreading assay. Earlsboro and Gilcrease formation fluids showed the presence of surface-active molecules due to the ability of the brine to clear the oil film on water. However, the brine from these formations had oil mixed with the brine and the hydrocarbon may have contributed to the oil spreading activity. Little or negligible oil-spreading activity was observed in brines from the other wells. As a comparison, a 24-hour culture fluid of a known biosurfactant producing bacterium, B. licheniformis strain RS-1 had an oil-spreading activity of 2.6 cm. Table 3.5. Presence of surface-active materials in produced fluids from different formations.
Formation
Well Names
Diameter of clearing (cm)a
Hunton ROB11 BDLb ROB2 BDL Wewoka ROB14 BDL Earlsboro ERL1 0.3±0.28 ERL5 0.5 ±0
Gilcrease GIL1 0.6 ±0.01 Skinner flood TUBER1 BDL
DAV1 BDL
Hart HEWITT 4-32 0.3±0.14

29
a The positive control used was culture fluid of Bacillus licheniformis strain RS-1, which showed 2.6 cm of oil spreading. b BDL Below detection limit. Oil spreading activity less than 0.2 cm was considered below detection limit.
Enumerations
Most probable number (MPN) enumerations were performed to estimate the numbers of heterotrophic organisms in the formation fluids. The Plate count broth (PCB) medium was used because other researchers were able to enumerate aerobic and anaerobic heterotrophic organisms from oil field brines with this medium (62). Medium E is known to support the growth of biosurfactant-producing bacteria in the genus Bacillus (56, 71). The results of the MPN are summarized in Table 3.6. Heterotrophic bacteria were not detected with either aerobic or anaerobic media in any of the brine samples except those obtained from the Skinner flood and Hart formations. Oil spreading assay done with distilled water gave a clearing of 0.1 to 0.2 cm. Clearing less than 0.2 cm was considered below detection limit. No growth was observed at any dilution when Medium E with and without 5% NaCl was used. The highest cell number observed was about 102 cells/ml in brine from the DAVIS 1 well (Skinner flood formation) with PCB without salt under aerobic conditions. The brines from the TUBERVILLE 1 (Skinner flood formation) and HEWIIT 4-32 (Hart formation) wells had low levels of aerobic heterotrophic growth (23 cells/ml). No oil-spreading activity was observed in any of the medium wells that were positive for growth. Balkwill et al. (8) and Musselwhite et al. (67) used one-tenth strength PYTG medium to enumerate microorganisms in aquifer sediments and found concentrations as high as 107
cells per gram. The MPN analysis of reservoir fluids was modified to use PYTG and one-tenth strength PYTG medium. With these media, heterotrophic bacteria were detected in all of the reservoir brine samples (Table 3.7). Microbial numbers were low, less than 100 cells/mL in most brine samples. The maximum number of cells detected was about 104 cells/ml in brine from the Robertson 11 well (Hunton formation). Of the five brine samples where the number of heterotrophs exceeded 100 cell/mL, four were from the low salinity reservoirs (<4% NaCl) (Hunton and Wewoka) and one was from a high salinity reservoir (>10% NaCl). It did not appear that the concentration of organic compounds (full strength versus one-tenth strength medium formulations) affected the enumeration microorganisms from the reservoir brines. The one-tenth PYTG medium used for enumerations studies for the brines obtained from the Earlsboro and Gilcrease formations, was supplemented with 10% NaCl and the respective CaCO3 concentration (1.3% for the Earlsboro formation and 0.5% for Gilcrease formation) to match the brine composition. Similar MPN values were obtained with supplemented or unsupplemented media (see Table 3.8). No oil-spreading activity was observed in the wells that were positive for growth.
30
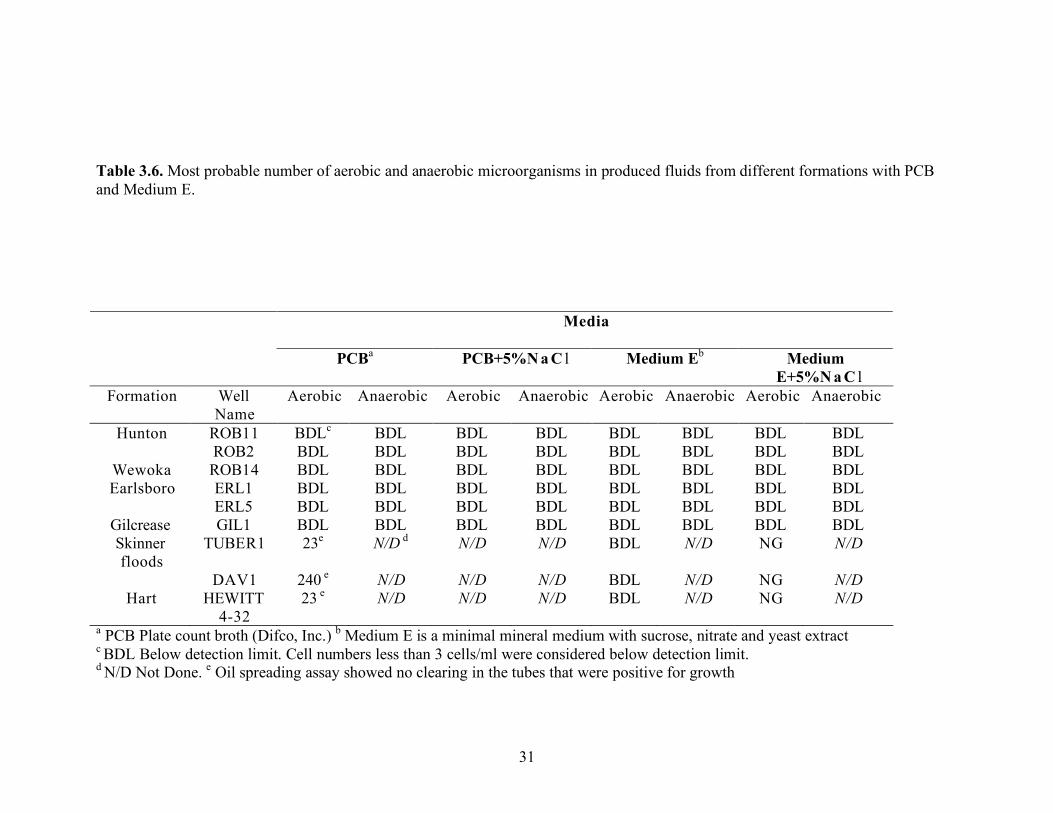
Interestingly, when B. licheniformis strain RS-1 was used as the positive control, the cells counts were 2.4 x 10⁵ and 2.4x10⁴ with one-tenth strength PYTG supplemented with 10% NaCl and one-tenth strength PYTG supplemented with 10% NaCl and CaCO3 concentration, respectively. These data indicate that B. licheniformis may be able to grow over a wide range of salinities. Enumerations using one-tenth strength PYTG supplemented with NaCl to match the salinity of the brine were also done with samples from Skinner flood and Hart formations. Again, there was little difference in cell counts (23 to 43 cells/mL) regardless of whether the ionic strength of the medium reflected that of the brine (Table 3.9). Biosurfactant production measured by the oil-spreading assay in the wells that were positive for growth showed no detectable activity. B. licheniformis showed growth in medium with salt concentrations as high as 15%. Standard plate counts using a variety of different media were also done to enumerate microorganisms in the brines. The brine samples were also heat-treated to germinate spores that may be present in the formation waters. The media with 5% NaCl was also used to select for halotolerant biosurfactant bacilli. However, none of these approaches was effective in enumerating microorganisms (Table 3.10). The oil agar (54) also did not detect the presence of any culturable microorganisms. This medium was used to help screen for the presence of biosurfactant producers, which would form a clearing in the oil layer around the colony. MPN enumerations were also done with the MOPS minimal medium described by Palmer et al. (57) to detect the presence of Pseudomonas-like microorganisms in the produced fluids from Skinner flood and Hart formations. Low numbers of microorganisms were detected with this medium, 23 and 2.4 x 10² cells/ml for the Skinner flood and Hart formation brines, respectively (Table 3.11). Each dilution well that was positive for growth was checked for biosurfactant activity with the oil-spreading assay but no oil-spreading activity was detected.
31
Table 3.6. Most probable number of aerobic and anaerobic microorganisms in produced fluids from different formations with PCB and Medium E.
a PCB Plate count broth (Difco, Inc.) b Medium E is a minimal mineral medium with sucrose, nitrate and yeast extract c BDL Below detection limit. Cell numbers less than 3 cells/ml were considered below detection limit. d N/D Not Done. e Oil spreading assay showed no clearing in the tubes that were positive for growth
Media
PCBa PCB+5%N a C l Medium E
b Medium
E+5%N a C l
Formation Well
Name
Aerobic Anaerobic Aerobic Anaerobic Aerobic Anaerobic Aerobic Anaerobic
Hunton ROB11 BDLc BDL BDL BDL BDL BDL BDL BDL
ROB2 BDL BDL BDL BDL BDL BDL BDL BDL
Wewoka ROB14 BDL BDL BDL BDL BDL BDL BDL BDL
Earlsboro ERL1 BDL BDL BDL BDL BDL BDL BDL BDL
ERL5 BDL BDL BDL BDL BDL BDL BDL BDL
Gilcrease GIL1 BDL BDL BDL BDL BDL BDL BDL BDL
Skinner
floods
TUBER1 23e N/D
d N/D N/D BDL N/D NG N/D
DAV1 240 e N/D N/D N/D BDL N/D NG N/D
Hart HEWITT
4-32
23 e N/D N/D N/D BDL N/D NG N/D
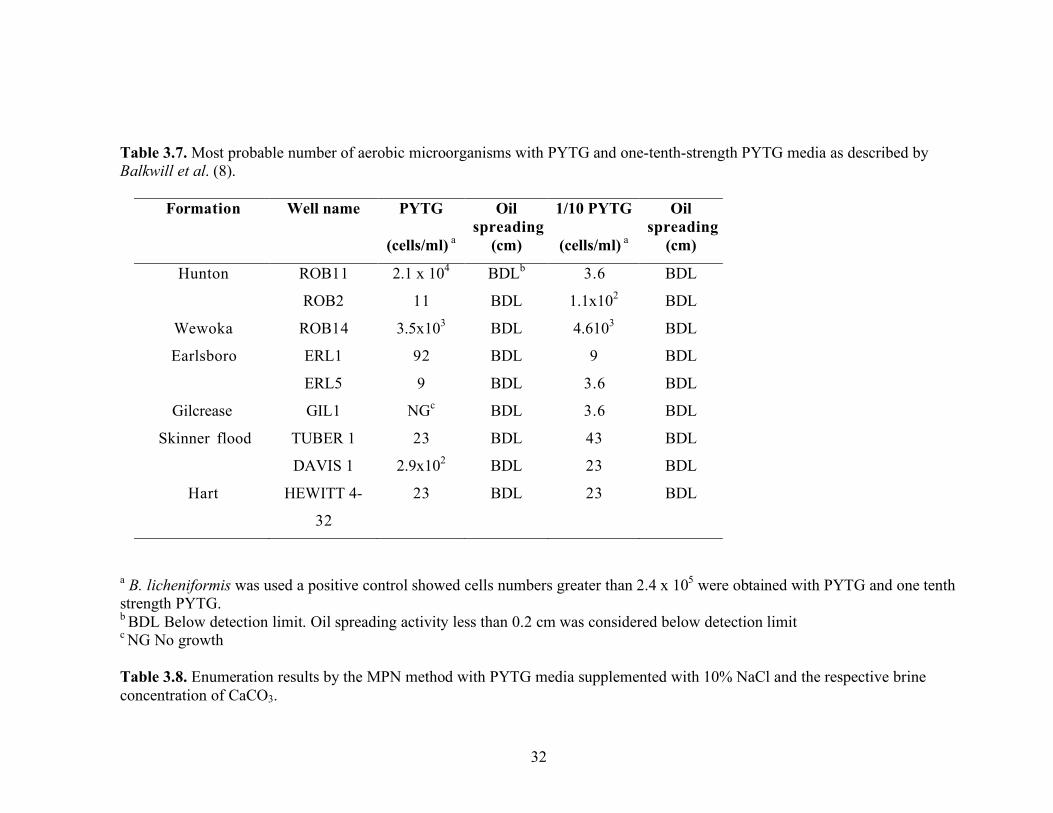
32
Table 3.7. Most probable number of aerobic microorganisms with PYTG and one-tenth-strength PYTG media as described by Balkwill et al. (8).
a B. licheniformis was used a positive control showed cells numbers greater than 2.4 x 10⁵ were obtained with PYTG and one tenth strength PYTG. b BDL Below detection limit. Oil spreading activity less than 0.2 cm was considered below detection limit c NG No growth Table 3.8. Enumeration results by the MPN method with PYTG media supplemented with 10% NaCl and the respective brine concentration of CaCO3.
Formation Well name PYTG
Oil
spreading
1/10 PYTG
Oil
spreading
(cells/ml) a (cm) (cells/ml)
a (cm)
Hunton ROB11 2.1 x 10⁴ BDL
b 3.6 BDL
ROB2 11 BDL 1.1x10² BDL
Wewoka ROB14 3.5x10³ BDL 4.610
3 BDL
Earlsboro ERL1 92 BDL 9 BDL
ERL5 9 BDL 3.6 BDL
Gilcrease GIL1 NGc BDL 3.6 BDL
Skinner flood TUBER 1 23 BDL 43 BDL
DAVIS 1 2.9x10² BDL 23 BDL
Hart HEWITT 4-
32
23 BDL 23 BDL
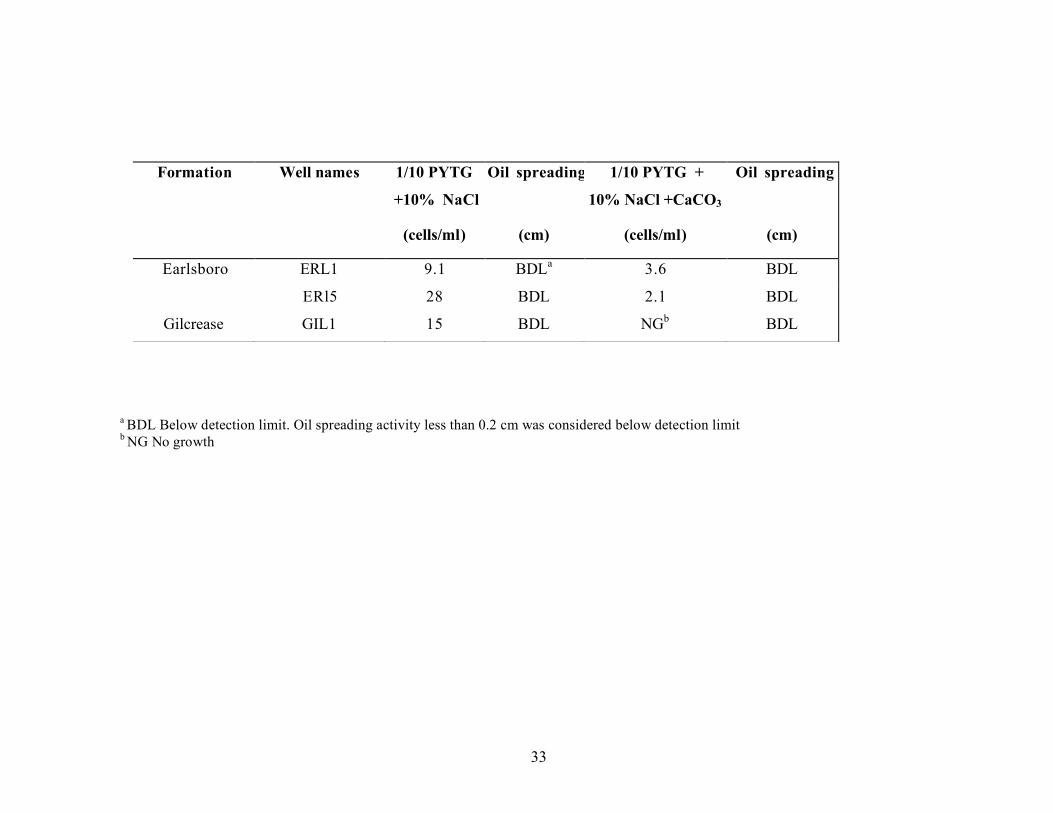
33
a BDL Below detection limit. Oil spreading activity less than 0.2 cm was considered below detection limit b NG No growth
Formation Well names 1/10 PYTG
+10% NaCl
Oil spreading 1/10 PYTG +
10% NaCl +CaCO3
Oil spreading
(cells/ml) (cm) (cells/ml) (cm)
Earlsboro ERL1 9.1 BDLa 3.6 BDL
ERl5 28 BDL 2.1 BDL
Gilcrease GIL1 15 BDL NGb BDL
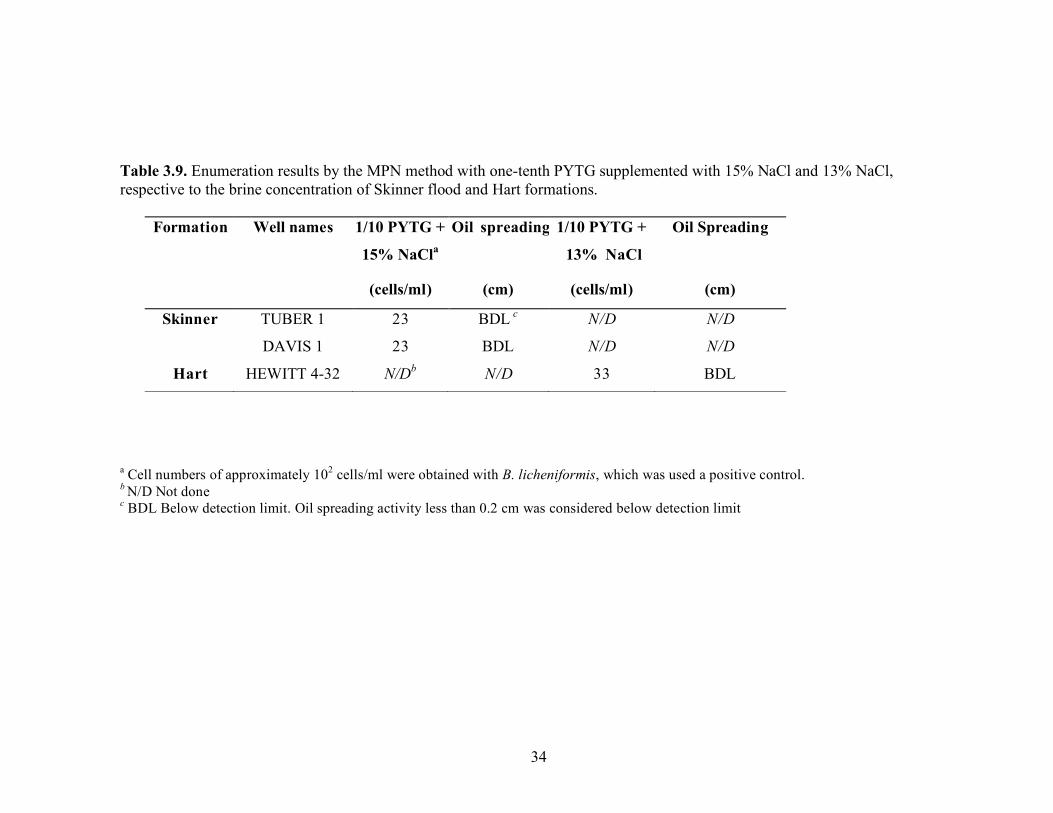
34
Table 3.9. Enumeration results by the MPN method with one-tenth PYTG supplemented with 15% NaCl and 13% NaCl, respective to the brine concentration of Skinner flood and Hart formations.
a Cell numbers of approximately 102 cells/ml were obtained with B. licheniformis, which was used a positive control. b N/D Not done c BDL Below detection limit. Oil spreading activity less than 0.2 cm was considered below detection limit
Formation Well names
1/10 PYTG +
15% NaCla
Oil spreading 1/10 PYTG +
13% NaCl
Oil Spreading
(cells/ml) (cm) (cells/ml) (cm)
Skinner TUBER 1 23 BDL c N/D N/D
DAVIS 1 23 BDL N/D N/D
Hart HEWITT 4-32 N/Db N/D 33 BDL

35
Table 3.10. Attempts to enumerate microorganisms by using viable plate count approaches. For each medium, the brine with and without heat treatment was used.
a PCA Plate count agar (Difco Inc.) b ½ PCA Half strength Plate count agar c BDL Below detection limit. Plate counts less than 20 cells per plate were considered below detection limit
Media
PCAa PCA+5%NaCl PCA b PCA+5%NaCl
Formation Well Name Heat-treated
Not-Heat treated
Heat-treated
Not-Heat treated
Heat-treated
Not-Heat treated
Heat-treated
Not-Heat treated
Hunton ROB11 BDLc BDL BDL BDL BDL BDL BDL BDL ROB2 BDL BDL BDL BDL BDL BDL BDL BDL
Wewoka ROB14 BDL BDL BDL BDL BDL BDL BDL BDL Earlsboro ERL1 BDL BDL BDL BDL BDL BDL BDL BDL
ERL5 BDL BDL BDL BDL BDL BDL BDL BDL Gilcrease GIL1 BDL BDL BDL BDL BDL BDL BDL BDL Skinner flood
TUBER1 BDL BDL BDL BDL BDL BDL BDL BDL
DAV1 BDL BDL BDL BDL BDL BDL BDL BDL Hart HEWITT 4-32 BDL BDL BDL BDL BDL BDL BDL BDL

36
Table 3.11. MPN enumeration results with MOPS minimal medium described by Palmer et al. (57) to detect Pseudomonas-like microorganisms.
a P. aeruginosa ATCC strain 10145 was used a positive control and cells numbers greater than 2.4 x 10⁵ cells/ml were obtained b BDL Below detection limit. Oil spreading activity less than 0.2 cm was considered below detection limit
Enrichments
Enrichments to enhance aerobic biosurfactant activity were done using PCB (Plate count broth), one-half strength PCB and one-tenth strength PCB. Growth was observed in all of the above media, suggesting the presence of active microorganisms, but in low numbers. All of brines except the brine from the Skinner flood formation contained indigenous biosurfactant-producing microorganisms as indicated by the presence of oil-spreading activity in at least one of the media not inoculated with B. licheniformis (Table 3.12). Enrichments with the Earlsboro (ERL1) well brine with PCB medium had the highest indigenous oil spreading activity (1.1 cm). However low indigenous biosurfactant activity was stimulated in the enrichments from other formation fluids with the PCB, one half-strength or one tenth-strength PCB medium except in the Skinner flood formation fluids. The addition of a known lipopeptide biosurfactant producer B. licheniformis increased biosurfactant activity in brine enrichments from the Hunton and Gilcrease formations. B. licheniformis was apparently able to produce its biosurfactant in Skinner flood formation brine since indigenous oil-spreading activity was not detected (Table 3.12). These data show that many brines contain indigenous biosurfactant-producing microorganisms whose activity can be stimulated by the nutrients present in PCB (glucose, yeast extract and tryptone). Apparently, their numbers are too low to be detected by standard enumeration procedures. Bioaugmentation with a known biosurfactant producer (e.g., Bacillus licheniformis) was most effective in brines with low salinities (<5% NaCl).
Formation Well names MOPS Minimal media a
(cells/ml)
Oil Spreading (cm)
TUBER 1 2.4 x 10² BDL
b Skinner
flood DAVIS 1 2.4 x 10
2 BDL
Hart HEWITT 4-32 23 BDL

37
Table 3.12. Enrichments to enhance biosurfactant activity in produced fluid samples from the different formations.
a PCB Plate Count Broth (Difco.); 10ml of brine was added to 20ml of PCB. b ½ PCB one-half strength PCB c 1/10 one-tenth strength PCB d BDL Below detection limit. Oil spreading activity less than 0.2 cm was considered below detection limit e Brine from ROB11, ROB2 and ROB 14 were mixed when inoculum was added to the enrichment f Brine from ERL1 and ERL5 were mixed when inoculum was added to the enrichment
Oil Spreading (cm) of enrichment cultures of produced fluids
Formation
Well
PCBa + Brine
PCB + Brine+
Inoculum
PCB b + Brine
PCB + Brine+
Inoculum
1/10 PCBc + Brine
1/10 PCB + Brine+
Inoculum Hunton ROB11 BDL d BDL BDL
ROB2
0.3 ±0.1 BDL BDL
Wewoka ROB14 BDL
0.8±0.2e
0.3 ±0.1
1.0±0e
BDL
0.7 ±0e
Earlsboro ERL1 1.1±0.2 0.4±0.1 BDL
ERL5 BDL
0.5±0.2f 0.3 ±0
0.3±0f BDL
0.3 ±0f
Gilcrease GIL1 0.4 ±0.0 0.6 ±0.1 0.5 ±0 0.9 ±0.17 BDL BDL
Skinner flood TUBER1+DAV1 BDL 0.3±0.1 BDL 0.6±0.15 BDL BDL Hart HEWITT 4-32 0.4±0.1 BDL BDL BDL 0.3±0.2 BDL
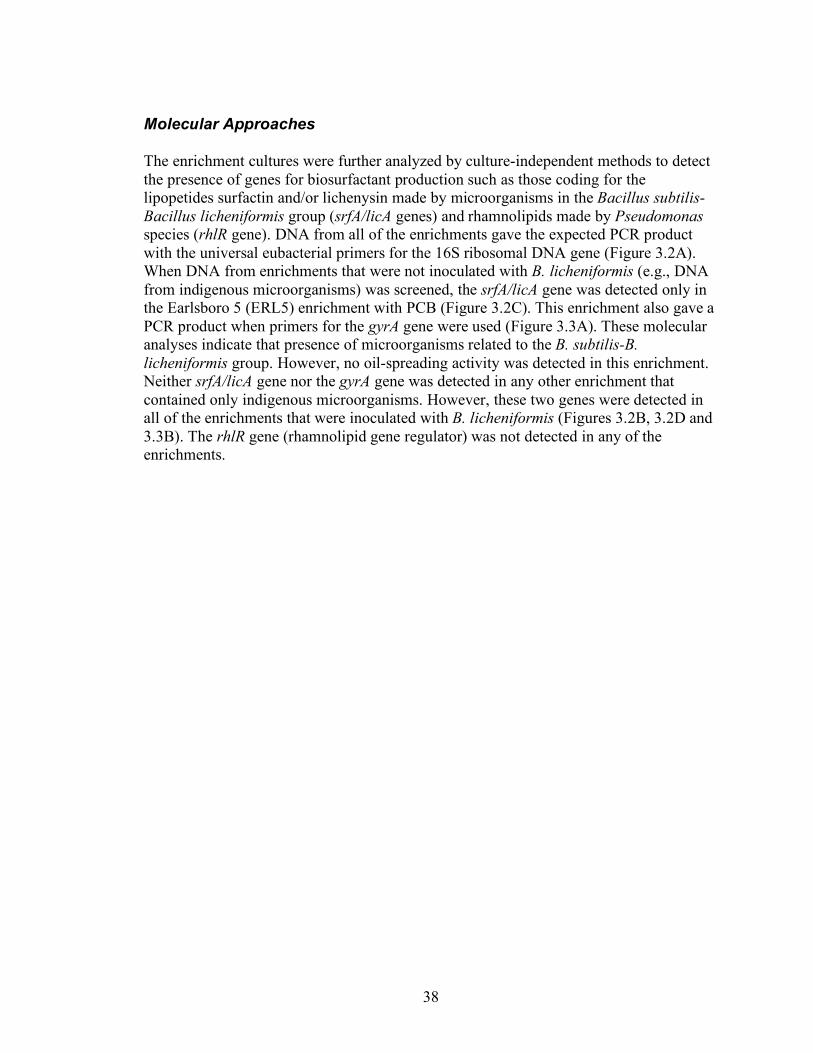
38
Molecular Approaches
The enrichment cultures were further analyzed by culture-independent methods to detect the presence of genes for biosurfactant production such as those coding for the lipopetides surfactin and/or lichenysin made by microorganisms in the Bacillus subtilis-Bacillus licheniformis group (srfA/licA genes) and rhamnolipids made by Pseudomonas species (rhlR gene). DNA from all of the enrichments gave the expected PCR product with the universal eubacterial primers for the 16S ribosomal DNA gene (Figure 3.2A). When DNA from enrichments that were not inoculated with B. licheniformis (e.g., DNA from indigenous microorganisms) was screened, the srfA/licA gene was detected only in the Earlsboro 5 (ERL5) enrichment with PCB (Figure 3.2C). This enrichment also gave a PCR product when primers for the gyrA gene were used (Figure 3.3A). These molecular analyses indicate that presence of microorganisms related to the B. subtilis-B. licheniformis group. However, no oil-spreading activity was detected in this enrichment. Neither srfA/licA gene nor the gyrA gene was detected in any other enrichment that contained only indigenous microorganisms. However, these two genes were detected in all of the enrichments that were inoculated with B. licheniformis (Figures 3.2B, 3.2D and 3.3B). The rhlR gene (rhamnolipid gene regulator) was not detected in any of the enrichments.
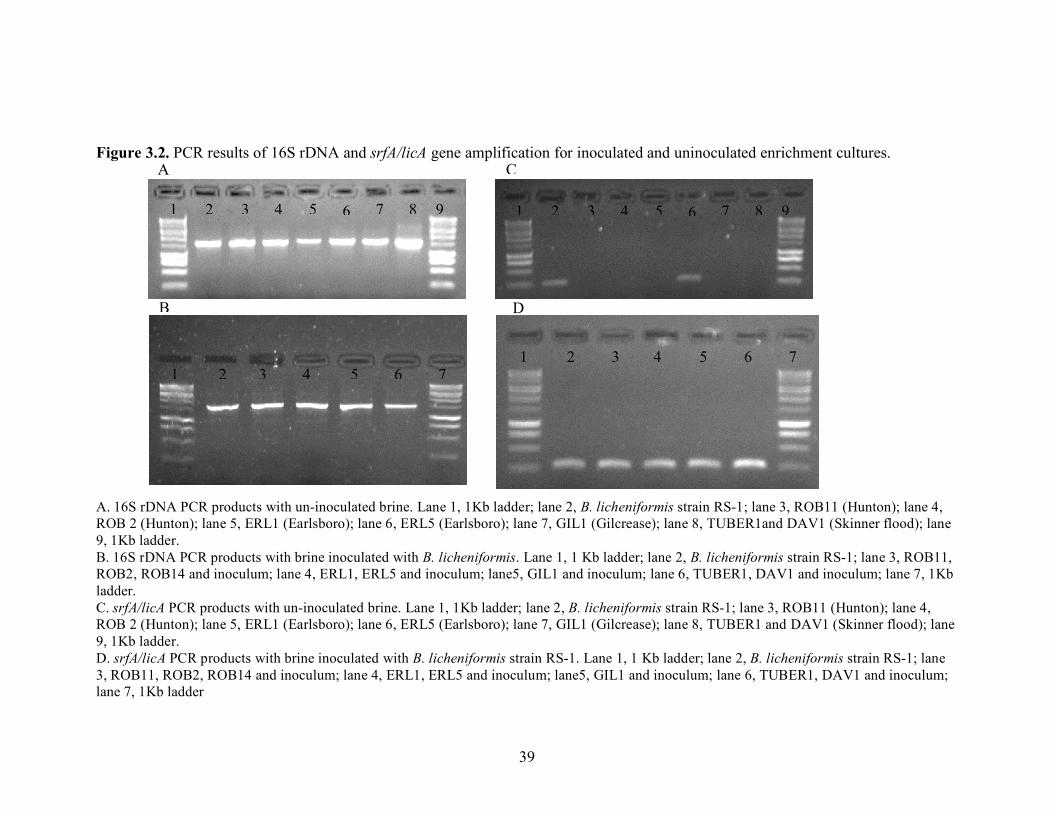
39
Figure 3.2. PCR results of 16S rDNA and srfA/licA gene amplification for inoculated and uninoculated enrichment cultures. A. 16S rDNA PCR products with un-inoculated brine. Lane 1, 1Kb ladder; lane 2, B. licheniformis strain RS-1; lane 3, ROB11 (Hunton); lane 4, ROB 2 (Hunton); lane 5, ERL1 (Earlsboro); lane 6, ERL5 (Earlsboro); lane 7, GIL1 (Gilcrease); lane 8, TUBER1and DAV1 (Skinner flood); lane 9, 1Kb ladder. B. 16S rDNA PCR products with brine inoculated with B. licheniformis. Lane 1, 1 Kb ladder; lane 2, B. licheniformis strain RS-1; lane 3, ROB11, ROB2, ROB14 and inoculum; lane 4, ERL1, ERL5 and inoculum; lane5, GIL1 and inoculum; lane 6, TUBER1, DAV1 and inoculum; lane 7, 1Kb ladder. C. srfA/licA PCR products with un-inoculated brine. Lane 1, 1Kb ladder; lane 2, B. licheniformis strain RS-1; lane 3, ROB11 (Hunton); lane 4, ROB 2 (Hunton); lane 5, ERL1 (Earlsboro); lane 6, ERL5 (Earlsboro); lane 7, GIL1 (Gilcrease); lane 8, TUBER1 and DAV1 (Skinner flood); lane 9, 1Kb ladder. D. srfA/licA PCR products with brine inoculated with B. licheniformis strain RS-1. Lane 1, 1 Kb ladder; lane 2, B. licheniformis strain RS-1; lane 3, ROB11, ROB2, ROB14 and inoculum; lane 4, ERL1, ERL5 and inoculum; lane5, GIL1 and inoculum; lane 6, TUBER1, DAV1 and inoculum; lane 7, 1Kb ladder
1 2 3 4 5 6 7 8 9
A
1 2 3 4 5 6 7
B
1 2 3 4 5 6 7 8 9
C
1 2 3 4 5 6 7
D

40
Figure 3.3. PCR results of gyrA and rhlR gene amplification for inoculated and un-inoculated enrichment cultures. A. gyrA PCR products with un-inoculated brine. Lane 1, 1Kb ladder; lane 2, B. licheniformis strain RS-1; lane 3, ROB11 (Hunton); lane 4, ROB 2 (Hunton); lane 5, ERL1 (Earlsboro); lane 6, ERL5 (Earlsboro); lane 7, GIL1 (Gilcrease); lane 8, TUBER1and DAV1 (Skinner flood); lane 9, 1Kb ladder. B. gyrA PCR products with brine inoculated with B. licheniformis. Lane 1, 1 Kb ladder; lane 2, B. licheniformis strain RS-1; lane 3, ROB11,ROB2, ROB14 and inoculum; lane 4, ERL1, ERL5 and inoculum; lane5, GIL1 and inoculum; lane 6, TUBER1, DAV1 and inoculum; lane 7, 1Kb ladder. C. rhlR PCR products with un-inoculated brine. Lane 1, 1Kb ladder; lane 2, P. aeruginosa ATCC 10145; lane 3, ROB11 (Hunton); lane 4, ROB 2 (Hunton); lane 5, ERL1 (Earlsboro); lane 6, ERL5 (Earlsboro); lane 7, GIL1(Gilcrease); lane 8, TUBER1 and DAV1(Skinner flood); lane 9, 1Kb ladder. D. rhlR PCR products with brine inoculated with B. licheniformis strain RS-1. Lane 1, 1 Kb ladder; lane 2, P. aeruginosa ATCC 10145; lane 3, ROB11, ROB2, ROB14 and inoculum; lane 4, ERL1, ERL5 and inoculum; lane5, GIL1 and inoculum; lane 6, TUBER1, DAV1 and inoculum; lane 7, 1Kb ladder.
1 2 3 4 5 6 7 8 9
1 2 3 4 5 6 7
A
B
1 2 3 4 5 6 7 8 9
C
1 2 3 4 5 6 7
D

41
Nutrient treatments
Since the enumeration and enrichment studies indicated that indigenous biosurfactant producers were detected only after enrichment and that the addition of B. licheniformis stimulated biosurfactant activity in some cases, a series of experiments was conducted to determine whether simple nutrient additions stimulate biosurfactant activity with or without an inoculum. Seven different nutrients were tested (glucose, molasses, glycerol, proteose peptone, NaNO3, K2HPO4 and NaCl) in different combinations by single and double nutrient deletion or by single and multiple nutrient additions. Glucose and molasses are commonly used carbon and energy sources for MEOR (74). K2HPO4 serves as the phosphorous source for many microorganisms and is often absent in reservoir brines (71). Glycerol is commonly used in medium to select for Pseudomonas-like microorganisms (57). Also, Folmsbee et al. (56) found that Proteose peptone was needed for anaerobic growth of strains of Bacillus subtilis and Bacillus mojavensis. The biosurfactant activity detected in brine samples from each formation with and without an inoculum of B. licheniformis for the single nutrient series is shown in Figure 3.4 to Figure 3.9. Data from all of the various treatments regimes are presented in Appendices I to V. Indigenous biosurfactant activity under aerobic conditions was detected only in Hunton formation production fluids. Maximum indigenous oil-spreading activity in Hunton formation production fluids was observed when phosphate but not the other six nutrients were deleted. The removal of nitrate and proteose peptone decreased the indigenous oil-spreading activity of brine indicating both of these nutrients were stimulatory for indigenous biosurfactant production. However, biosurfactant activity in Hunton formation production fluids was higher when the inoculum was present (Figure 3.4). In addition, the presence of an inoculum shortened the time needed before maximal oil-spreading activity was observed. In brines from all of the other formations, maximum biosurfactant production was observed when the nutrient treatments were augmented with a known biosurfactant producer (in this case B. licheniformis). Generally, maximal biosurfactant activity occurred after five days of incubations. All the formations tested showed an oil-spreading activity of 1.10 cm to 3.17 cm when the brine contained molasses and NaNO3 and B. licheniformis as the inoculum (Figures 3.4 to 3.7). From the data, the nutrient combination that most often gave maximum biosurfactant production was glucose and/or molasses with NaNO3. Proteose peptone was also highly effective for stimulating biosurfactant activity but only when used in combination with either glucose or molasses. The removal of proteose peptone from the treatment decreased oil-spreading activity, but when proteose peptone was the only organic carbon supplement, oil-spreading activity was low even if the other inorganic nutrients were present. These data suggest that proteose peptone is stimulatory when used in combination with another carbon source such as glucose or molasses. The addition of NaCl and K2HPO4 appeared to be inhibitory for the biosurfactant activity since the deletion of these nutrients often increased oil-spreading activity. Deleting glycerol from the mixture markedly decreased biosurfactant activity (Figure 3.4 to 3.7). However, little

42
or no oil spreading activity was observed when the brine was supplemented only with glycerol and NaNO3. Thus, much like proteose peptone, glycerol is stimulatory for biosurfactant only when used in combination with another carbon source. In almost all cases, oil-spreading activity was high when the brines were supplemented with glucose and/or molasses and NaNO3 (see Appendices) suggesting that additional carbon sources such as proteose peptone or glycerol may be beneficial but not required. It was observed that B. licheniformis strain RS-1 required nutrient components like glucose/molasses, nitrate, proteose peptone and glycerol for maximum biosurfactant production in a medium prepared in sterile deionized water i.e. no brine added to the nutrient components. The deletion of each component decreased biosurfactant production remarkably suggesting that these components were stimulatory. As discussed earlier, proteose peptone and glycerol seemed to be stimulatory only in the presence of other carbon sources like glucose or molasses. These results again suggest that proteose peptone and glycerol serve as additional stimulatory components, but are not absolutely required. The optimal nutrient formulation was also tested anaerobically for the Hunton, Wewoka and Earlsboro formations. Since Youssef et al. (unpublished data) found that in situ biosurfactant production occurred with the addition of an inoculum, glucose, nitrate and a mixture of metals, we tested whether this combination of nutrients would stimulate anaerobic biosurfactant activity in brines from other formations. Molasses was also tested since this is a cheap and readily available source of sugars. The anaerobic biosurfactant activity in brine with or without inoculum is shown in Figures 3.8 and 3.9. The data from all the treatments are shown in the Appendix VI to Appendix VIII. Compared to aerobic treatments, none of the anaerobic treatments gave an oil-spreading activity greater than 1.0 cm, indicating that less active biosurfactants were made, the biosurfactant concentration was lower, or a combination of these two factors occurred under anaerobic conditions. Anaerobic indigenous biosurfactant activity was observed in the treatments with the brine from the Hunton, Wewoka and Earlsboro formations (Figure 3.8, 3.9; Appendices VI to VIII). However, the indigenous biosurfactant activity was considerably less than that observed under aerobic conditions. The maximum indigenous biosurfactant production was observed when glucose, molasses, nitrate and metals were present in the medium. Deletion of one of the above components decreased the oil spreading activity, suggesting their importance for anaerobic biosurfactant production. The addition of inoculum increased the biosurfactant activity significantly (Figure 3.8, 3.9). Maximum biosurfactant activity was observed when the medium contained glucose, molasses, nitrate and metals, as found with aerobic incubations. The Hunton and Wewoka formation fluids showed the highest oil spreading activity of 1.27 cm and 0.83 cm when molasses, nitrate and inoculum were present in the brine. For the Earlsboro formation fluids, the maximum oil spreading observed was only 0.50 cm and occurred when molasses, nitrate and an inoculum were present in the brine. Anaerobic

43
biosurfactant production as measured by oil spreading activity was maximal with molasses, nitrate and inoculum. The Earlsboro formation fluids showed the least oil-spreading activity (0.5cm or less; see Appendix VIII). The high salt concentration in the brine itself may have inhibited the biosurfactant production.
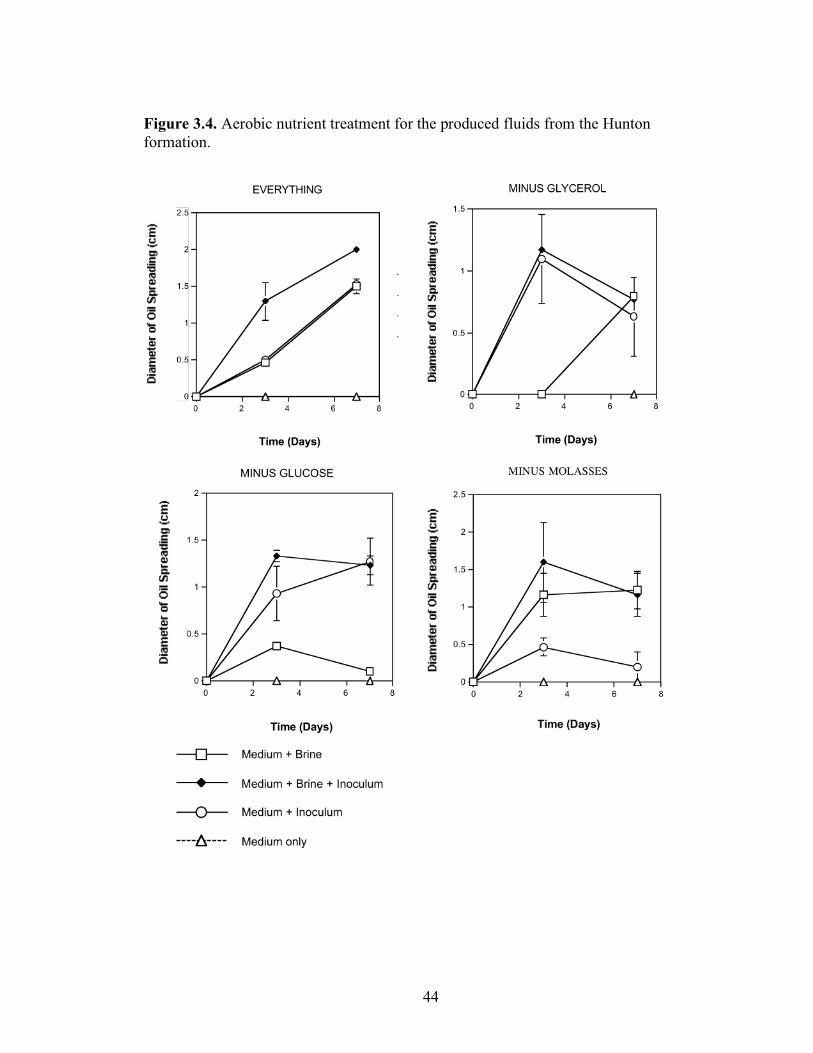
44
Figure 3.4. Aerobic nutrient treatment for the produced fluids from the Hunton formation.

45
Figure 3.4 (contd). Aerobic nutrient treatment for the produced fluids from the Hunton formation. Medium - includes the nutrient components in their respective concentration. The medium with single nutrient deletion consists of all other nutrient components except the nutrient that was eliminated. Medium + Brine – The formation fluids tested for indigenous biosurfactant activity Medium+Brine+Inoculum – The formation fluids tested for maximum biosurfactant production with bioaugmentation with B. licheniformis strain RS-1. Medium+Inoculum - B. licheniformis strain RS-1 tested for biosurfactant production was used as a positive control Medium only – Nutrient components in deionized water was used as a negative control

46
Figure 3.5. Aerobic nutrient treatment for the produced fluids from the Wewoka formation.

47
Figure 3.5 (Contd.). Aerobic nutrient treatment for the produced fluids from the Wewoka formation Medium - includes the nutrient components in their respective concentration. The medium with single nutrient deletion consists of all other nutrient components except the nutrient that was eliminated. Medium + Brine – The formation fluids tested for indigenous biosurfactant activity Medium+Brine+Inoculum – The formation fluids tested for maximum biosurfactant production with bioaugmentation with B. licheniformis strain RS-1. Medium+Inoculum - B. licheniformis strain RS-1 tested for biosurfactant production in deionized water (used as a positive control) Medium only – Nutrient components in deionized water (used as a negative control)

48
Figure 3.6. Aerobic nutrient treatment for the produced fluids from the Earlsboro formation
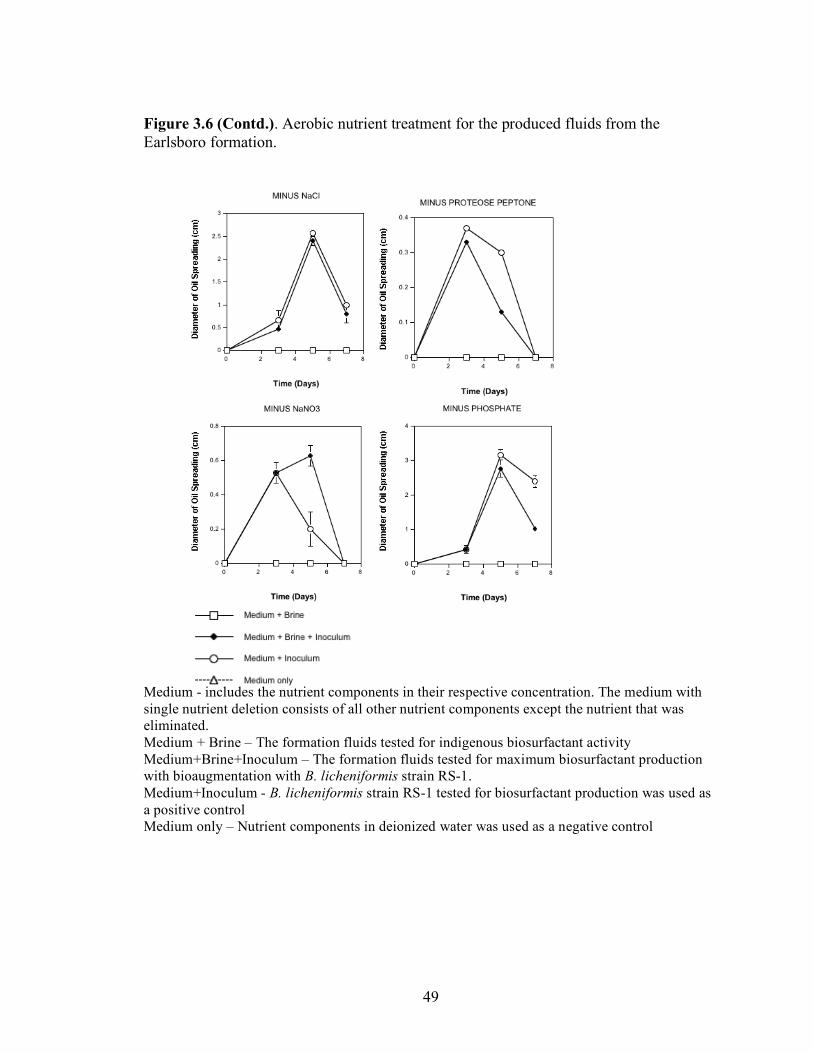
49
Figure 3.6 (Contd.). Aerobic nutrient treatment for the produced fluids from the Earlsboro formation. Medium - includes the nutrient components in their respective concentration. The medium with single nutrient deletion consists of all other nutrient components except the nutrient that was eliminated. Medium + Brine – The formation fluids tested for indigenous biosurfactant activity Medium+Brine+Inoculum – The formation fluids tested for maximum biosurfactant production with bioaugmentation with B. licheniformis strain RS-1. Medium+Inoculum - B. licheniformis strain RS-1 tested for biosurfactant production was used as a positive control Medium only – Nutrient components in deionized water was used as a negative control

50
Figure 3.7. Aerobic nutrient treatment for the produced fluids from the Gilcrease formation.
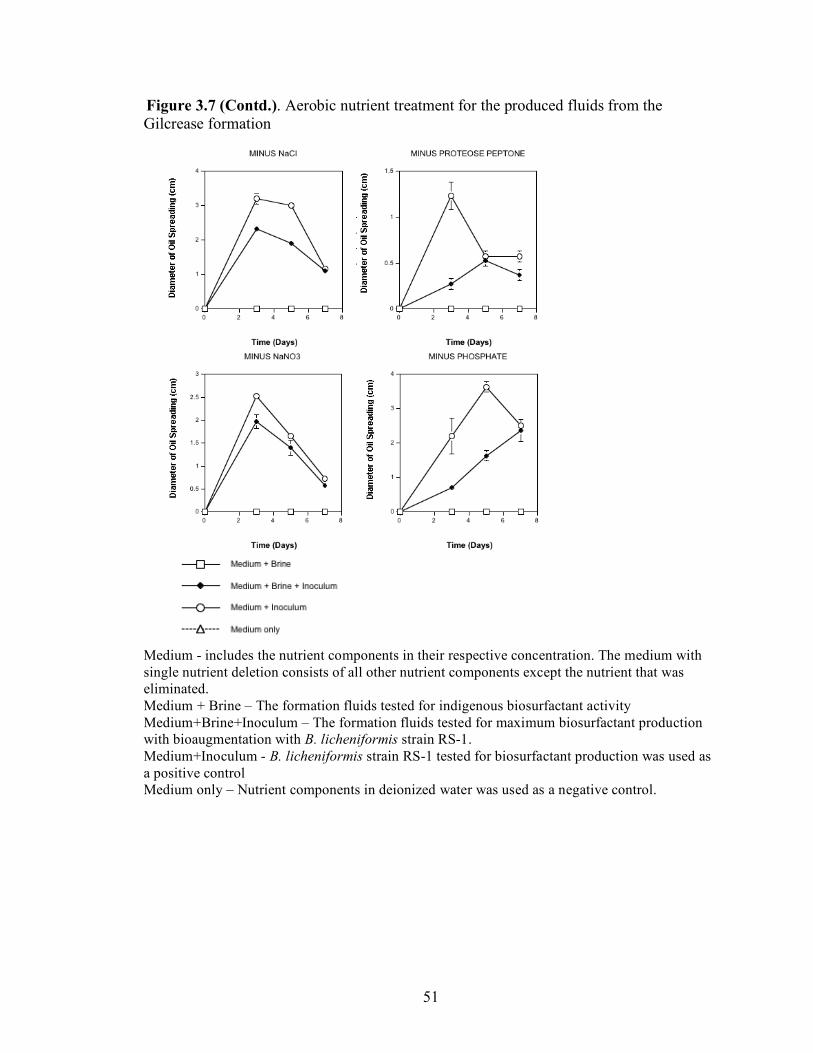
51
Figure 3.7 (Contd.). Aerobic nutrient treatment for the produced fluids from the Gilcrease formation Medium - includes the nutrient components in their respective concentration. The medium with single nutrient deletion consists of all other nutrient components except the nutrient that was eliminated. Medium + Brine – The formation fluids tested for indigenous biosurfactant activity Medium+Brine+Inoculum – The formation fluids tested for maximum biosurfactant production with bioaugmentation with B. licheniformis strain RS-1. Medium+Inoculum - B. licheniformis strain RS-1 tested for biosurfactant production was used as a positive control Medium only – Nutrient components in deionized water was used as a negative control.
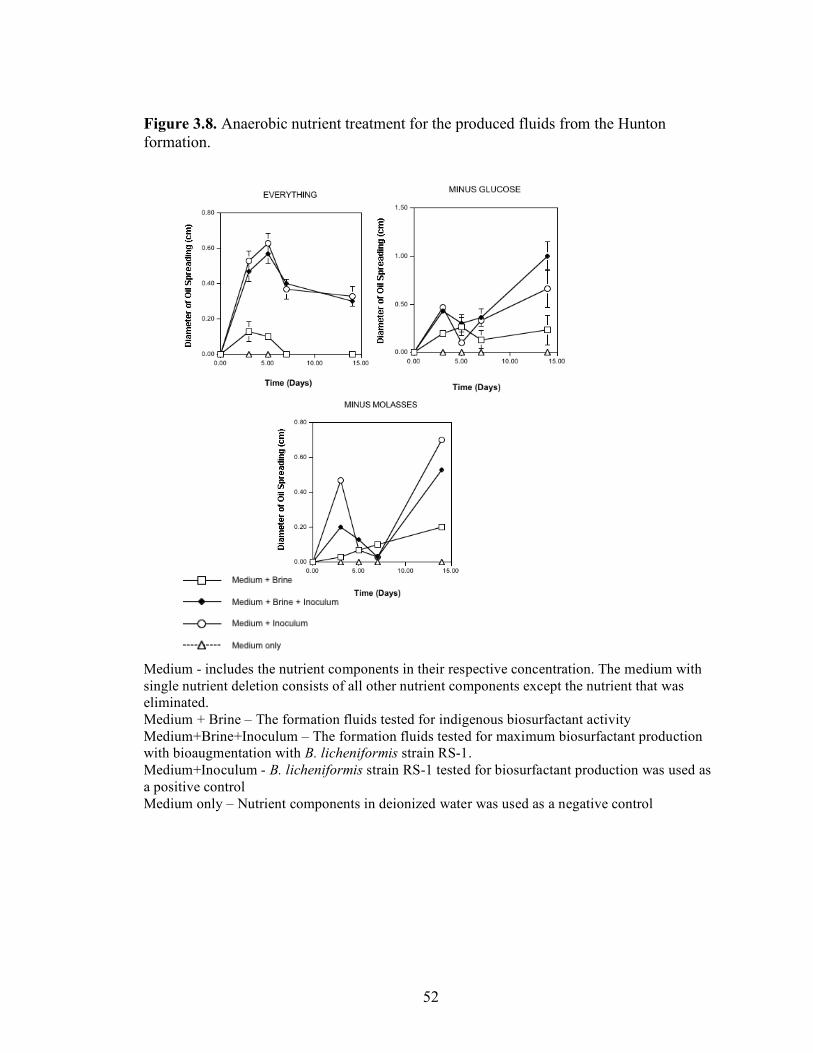
52
Figure 3.8. Anaerobic nutrient treatment for the produced fluids from the Hunton formation. Medium - includes the nutrient components in their respective concentration. The medium with single nutrient deletion consists of all other nutrient components except the nutrient that was eliminated. Medium + Brine – The formation fluids tested for indigenous biosurfactant activity Medium+Brine+Inoculum – The formation fluids tested for maximum biosurfactant production with bioaugmentation with B. licheniformis strain RS-1. Medium+Inoculum - B. licheniformis strain RS-1 tested for biosurfactant production was used as a positive control Medium only – Nutrient components in deionized water was used as a negative control

53
Figure 3. 8 (Contd.). Anaerobic nutrient treatment for the produced fluids from the Hunton formation.

54
Figure 3.9. Anaerobic nutrient treatment for the produced fluids from the Wewoka formation. Medium - includes the nutrient components in their respective concentration. The medium with single nutrient deletion consists of all other nutrient components except the nutrient that was eliminated. Medium + Brine – The formation fluids tested for indigenous biosurfactant activity Medium+Brine+Inoculum – The formation fluids tested for maximum biosurfactant production with bioaugmentation with B. licheniformis strain RS-1. Medium+Inoculum - B. licheniformis strain RS-1 tested for biosurfactant production was used as a positive control Medium only – Nutrient components in deionized water was used as a negative control
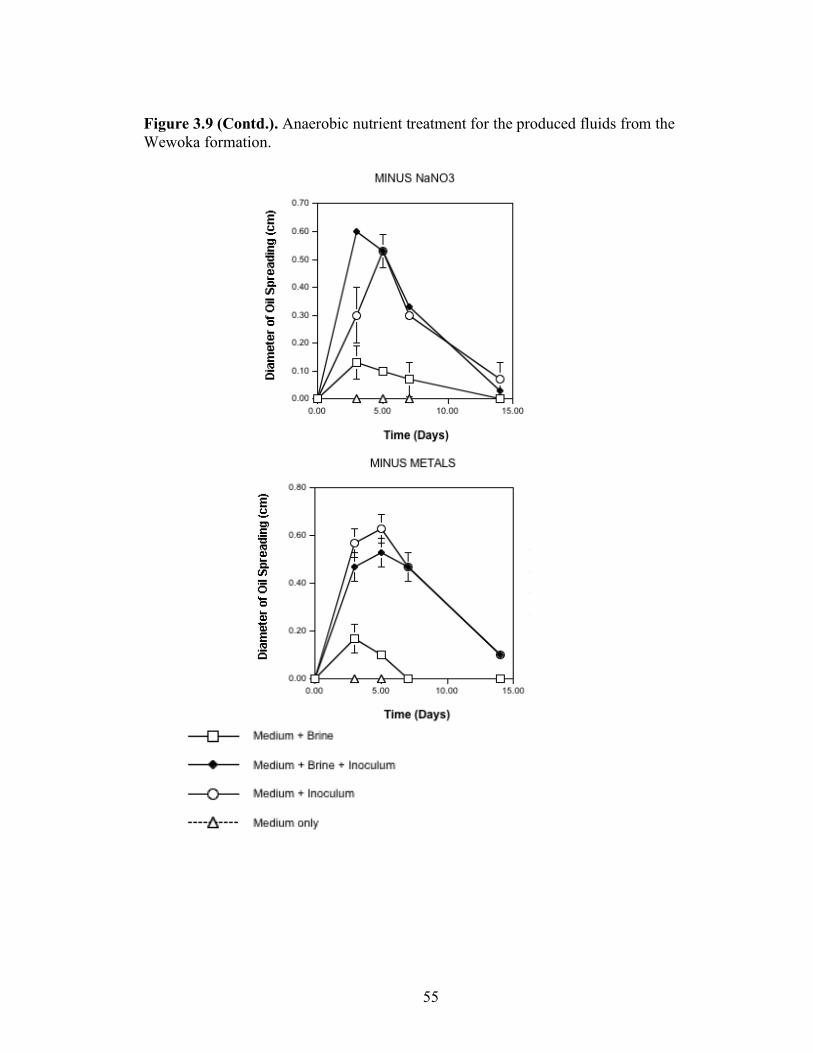
55
Figure 3.9 (Contd.). Anaerobic nutrient treatment for the produced fluids from the Wewoka formation.

56
Discussion and Conclusions This study focused on answering two important questions needed to implement in situ biosurfactant-mediated oil recovery. The first question is whether the reservoir contains biosurfactant-producing microorganisms? If not, then an appropriate inoculum must be supplied. Secondly, what nutrients are needed to stimulate biosurfactant production either by indigenous or introduction biosurfactant producers? Culture-dependent approaches were used to answer these questions, which complement the on going culture-independent approaches used in Chapter 3. The media used for enumeration and enrichment studies were known to support the growth of the most commonly studied biosurfactant producers, lipopeptide producers of the Bacillus subtilis-Bacillus licheniformis group and rhamnolipid producers in the genus Pseudomonas (1). Both lipopeptide and rhamnolipid biosurfactants are known to generate the ultra-low interfacial tensions against crude oil and benchmark hydrocarbons required for significant recovery of entrapped oil (3, 4, 5). Oil reservoirs are known to contain diverse and active microbial communities (61, 62, 63, 64) and Bacillus species have been isolated from the oil field brines (13, 43, 49). However, a systematic study of their presence in produced fluids obtained from different geological formations that have different salinities has not been conducted. Previous surveys have shown that many Oklahoma oil field have brines with high salinities (>10% NaCl) and the median salinity of Oklahoma oil field brines is about 5% NaCl (Jenneman et al. 1981). Our analyses included brines from both sandstone and carbonate formations with salinities ranging from 2% to 15% (Table 3.3). Thus, we were able to sample brines that captured the range of lithologies and salinities found in Oklahoma oil reservoirs. MPN and viable plate count approaches using PCB and medium E, which are known to support the growth on heterotrophic biosurfactant producers, did not detect any microorganisms except in brines from the Skinner Flood and Hart formations (Table 3.6 and 3.10). The enrichments with PCB, one-half strength PCB and one-tenth strength PCB showed growth with all the formation fluids, implying that heterotrophic microorganisms capable of growing in these media were probably in low numbers that were not detectable by the enumeration methods. However, MPN enumerations with PYTG medium did detect low numbers of heterotrophic bacteria in all of the brines regardless of whether full-strength or dilute media were used (Table 3.7). Low numbers of heterotrophic organisms capable of growing at high salt concentrations (10 and 15%) were detected in brines when enumerated using the PYTG medium. Adjusting the medium to match the salinity and alkalinity of the brine did not increase the cell counts, suggesting that if halophilic indigenous microorganisms were present, they were not cultured with the PYTG medium. Bhupathiraju et al. (62) and Adkins et al. (34) also detected low numbers of heterotrophic organisms (ranging in the order of 10 to 102 cells/ml) when using PCB medium. However, Bhupathiraju et al. (62) found increased cell counts when the salt concentration increased. While biosurfactant production by the indigenous heterotrophic microorganisms was not detected by the oil-spreading assay with any of the MPN or viable plating methods, other

57
lines of evidence suggest that indigenous biosurfactant producers are present in produced fluids from Oklahoma oil formations. Oil-spreading activity was detected in brines collected from the Earlsboro and Gilcrease formations. The presence of hydrocarbons in the brines may have contributed to the oil-spreading activity. However, enrichments of Earlsboro brine with PCB had very high levels of oil-spreading activity (Table 3.12), suggesting that the oil-spreading activity detected in the brine itself may have been the result of microbial activity. Indigenous biosurfactant production was detected in enrichment cultures with PCB and dilute PCB media (Table 3.12) and when specific nutrients were added directly to brine (Figures 3.4 to 3.9; see Appendices). Interestingly, specific nutrient additions only stimulated indigenous aerobic oil-spreading activity in Hunton formation brine (Figure 3.4) but low levels of indigenous oil-spreading activity were detected in enrichments with either PCB or dilute PCB with brines from all formations except from the Skinner flood (Table 3.12). Low levels of anaerobic indigenous oil-spreading activity was detected in brines from the Hunton, Wewoka, and Earlsboro formations with the addition of glucose and/or molasses with nitrate and trace metals (Figure 3.8, 3.9; see appendix VIII). The varied response to nutrient treatment may indicate the presence of different kinds of biosurfactant producers whose metabolic activity is triggered with different nutrient additions. Functional gene analysis supports this view. The srfA/licA and gyrA genes were detected in the Earlsboro 5 (ERL5) brine enrichment with PCB (Figure 3.2), indicating the presence of a member of the B. subtilis-B. licheniformis group. However, oil-spreading activity was not detected in this enrichment but was detected in the Earlsboro 1 (ERL1) brine enrichment. Neither the srfA/licA gene nor the gyrA gene was detected in Earlsboro 1 (ERL1) brine enrichment. Thus, a microorganism different from the B. subtilis-B. licheniformis group must have be responsible for oil-spreading activity in the Earlsboro 1 (ERL1) brine enrichment. No evidence for the presence of rhamnolipid-producing, Pseudomonas species was obtained. The difficulty in detecting culturable indigenous biosurfactant-producing bacteria and the low indigenous oil-spreading activity often observed argues for bioaugmentation. A fortuitous discovery of this work was the finding that B. licheniformis strain RS-1 was able to grow and produce its biosurfactant in brines with salinities ranging from 1.3 to 15%. These data show that strain RS-1 is robust enough to serve as an inoculum in diverse oil reservoirs. The addition of B. licheniformis RS-1 enhanced oil-spreading activity in low salinity brine enrichments. In most cases, greater oil-spreading activity was observed when B. licheniformis RS-1 was added to nutrient-supplemented brines compared to nutrient-supplemented brines without B. licheniformis RS-1 addition. These date suggest that the bioaugmentation with the known biosurfactant producers may be the appropriate MEOR strategy and that B. licheniformis RS-1 is a likely candidate for use as an inoculum. Glucose and/or molasses, proteose peptone, and nitrate were the critical nutrient components needed for aerobic biosurfactant production. Phosphate and salt were the inhibitory to biosurfactant production. This probably explains the presence of very low biosurfactant production in the Skinner floods (15% salinity observed in the Skinner flood [see Table 3.3]). The high salt concentration present naturally in this brine probably inhibited the production of biosurfactant, although growth was observed when B.
58
licheniformis was added as an inoculum. Anaerobic conditions are probably more reflective of the actual environmental conditions that exist in the reservoir. The information obtained with the aerobic nutrient screening allowed me to narrow the number of nutrients to be tested to glucose, molasses, nitrate and a mixture of trace metals. The highest oil-spreading activities were observed when glucose and/or molasses were present and that nitrate and the trace metals mixture stimulated oil-spreading activity. Youssef et al. (unpublished data) found that the addition of glucose, nitrate and trace metals stimulated in situ biosurfactant production by B. licheniformis RS-1 and Bacillus subtilis subsp. spizizenii strain NRRLB-23049 in a carbonate formation. Our work shows that this simple nutrient formulation is effective in stimulating anaerobic biosurfactant formation by B. licheniformis RS-1 in several brines that vary in salinity. The maximum anaerobic oil-spreading activity even in the presence of B. licheniformis RS-1 never exceeded 1.0 cm. Indigenous anaerobic oil-spreading activity was much lower than that observed under aerobic conditions. These data effectively argue that effective in situ biosurfactant production requires bioaugmentation. A major concern with a bioaugmentation approach is the multiple selective pressures that act against the establishment of the introduced strains. These factors include competition with indigenous microorganisms for nutrients or other resources and possibly predation or susceptibility to viral attack. The work by Youssef et al. (unpublished data) showed that injected biosurfactant-producing strains were metabolically active. Here, I have shown that B. licheniformis RS-1 is metabolically active in the presence of indigenous microbial oil field communities from a number of brines. Apparently, the nutrient supplementation regime creates a niche that allows B. licheniformis RS-1 to establish and become metabolically active. Our work shows that biosurfactant producers related to the Bacillus subtilis-Bacillus licheniformis are not very prevalent in the produced fluids from a number of different oil reservoirs. Only in one case was strong evidence obtained for the presence of these organisms (Earlsboro 5 brine enrichment; Figure 3.3) and this was only after enrichment by growth in PCB. However, several lines of evidence suggest that these brines do contain indigenous biosurfactant producers since oil-spreading activity was detected after various nutrient amendments. However, since most reservoirs are anaerobic, it is clear that effective in situ biosurfactant production will require bioaugmentation with a known biosurfactant producer such as Bacillus licheniformis strain RS-1 along with the addition of the appropriate nutrients (glucose, nitrate, and metals).

59
4. Molecular methodologies to detect and characterize biosurfactant producers and their use to determine the prevalence of biosurfactant producers in oil reservoirs
Abstract In-situ MEOR treatment strategy relies on a determination of whether biosurfactant producing microorganisms are indigenous to a specific oil reservoir or if bioaugmentation with such bacteria is required. We developed a culture-independent approach to detect the presence of genes involved in lipopeptide biosurfactant biosynthesis (srfA and licA genes) (surfactin and lichenysin, respectively), and the rhlR gene expressing a rhamnolipid biosurfactant transcriptional regulator in Pseudomonas aeruginosa. The PCR protocols had a high degree of accuracy in detecting biosurfactant-producing known strains. In addition, these approaches successfully detected the presence of two biosurfactant-producing Bacillus strains in produced fluids from an oil reservoir inoculated with these two strains. The PCR approaches were used to survey seven different oil formations that had widely different salinities. Genes for lipopeptide biosynthesis were detected in six of the seven formations. This finding was corroborated by the concomitant detection of members of the Bacillus subtilis-Bacillus licheniformis group, a group known to contain many biosurfactant producers, by gyrA gene amplification and sequencing. 16S rRNA gene sequence analysis also detected members of this group in formations that had chloride concentrations greater than 10%. 16S rRNA gene sequences related to heterotrophic, lactic acid-producing bacteria were commonly detected in clone libraries obtained from samples of reservoirs that were treated with a mixture of glucose and nitrate or in fluids collected from highly saline reservoirs. Culture-independent approaches support the conclusions of culture-dependent approaches that biosurfactant production is prevalent in many oil formations, even over a wide range of salinity.
Introduction Biosurfactant production is has been used to enhance hydrocarbon mobilization in subsurface environments by increasing the apparent aqueous solubility of hydrocarbons [100-105]. There are several biosurfactants that generate the low interfacial tensions between the hydrocarbon and the aqueous phases required to mobilize entrapped hydrocarbon [106, 107]. The lipopeptide biosurfactant produced by Bacillus species [108-110] and the rhamnolipid produce by various Pseudomonas species [102] reduce the interfacial tension between the hydrocarbon and aqueous phase to very low levels (<0.01 mN/m) [106, 111]. The generation of ultra-low interfacial tension results in the enhanced mobilization and recovery of oil. In addition, the critical micelle concentrations for rhamnolipids and lipopeptides are low (20 to 50 mg/L), indicating that these biosurfactants are effective at low concentrations [106]. Several U.S. Department of Energy sponsored field trials have shown the potential for biosurfactant-based microbial flooding processes [112-115]. An important question that must be answered if biosurfactant-mediated oil recovery is to be widely accepted is whether oil formations contain indigenous biosurfactant producers or whether biosurfactant producers will have to be introduced into the formation. To
60
answer this question, one must be able to detect and track biosurfactant-producing microorganisms. Since it is often difficult to culture microbes from extreme environments such as oil reservoirs, it is necessary to develop cultivation-independent approaches. Such tools provide the opportunity not only to detect and identify biosurfactant-producing microorganisms but also to monitor the growth of biosurfactant-producing strains such as Bacillus strain and competing bacteria in-situ during an ongoing MEOR treatment. Molecular tools will also assist in the characterization and classification of biosurfactant-producing isolates from oil formations. Commonly expressed in Bacillus are the srfA gene and the licA genes for the biosynthesis of the lipopeptide biosurfactants, surfactin and lichenysin, respectively. Conversely, P. aeruginosa species often express the rhlR transcriptional regulator for the rhlAB gene system responsible for biosynthesis of a rhamnolipid biosurfactant. Identification of either of these biosurfactant functional genes would establish whether indigenous species were present. Phylogenetic information from genes such as the 16S rRNA gene and gyrA especially if specifically designed for biosurfactant-producing genera would also enhance monitoring of strains as well as assist in documenting any competing microbial community changes resulting from bioamendment and/or bioaugmentation. The ability to distinguish between similar species of biosurfactant-producing isolates indigenous to oil formations using phylogenetic typing and REP-PCR fingerprinting could help in identifying a group of species with characteristics vital to the success of MEOR, especially if this group has activity over the broad range of salt concentration, temperature and pH that exist in oil formations. Ultimately, we must prove the effectiveness of these molecular tools in monitoring biostimulated and/or bioaugmented wells during the time course of an actual field test, as well as utilize them to successfully identify isolates that can proliferate and produce biosurfactant in-situ of an oil formation. Here, we report the development and use of functional genes to determine the prevalence of biosurfactant producers in oil formations with a wide range of salinity. These approaches successfully detected the presence of two Bacillus biosurfactant-producing strains used as an inoculum in produced fluids from the reservoir and delineated the changes in the microbial community after the addition of the glucose/nitrate-based nutrient mixture. Finally, we utilize culture-independent clone sequences from these formations along with phylogenetic typing of a putative B. licheniformis RS-1 strain and Sonoran Desert isolates to identify a group of related strains that have characteristics useful MEOR because they have a broad range of salt tolerance and ability to produce biosurfactants.
Materials and Methods
Development and testing of srfA3R2 functional gene primer.
As a result of the near 100% identity at the 3’ end particularly for the srfA3/licA3R described in the 2005 Annual Report [115], a new primer srfA3R2 was developed (Table 4.1) based on the same srfA3 and licA3 gene sequences available in the NCBI GenBank. In am attempt to enhance the specificity of the primer set to amplify only srfA3 and licA3 homologues, the primer srfA3R2 was moved 5 bp toward the 3’-end in relation to srfA3R

61
resulting in an expected product size of 268 bp. This relocation left the first 5 bp of the 3’-end of srfA3R2 with no sequence identity to the putative esterase gene amplified by the original srfA3/licA3R primer set. Table 4.1. PCR primer sequences utilized for detection and identification of microorganisms.
Identical reaction conditions and mixtures were used for the original srfA3/licA3F and srfA3/licA3R primers. The reaction mix consisted of 5 µL of 10X PCR buffer, 5 µL of 5 M betaine, 4 µL of 50 mM magnesium chloride, 1 µL of 10 mM dNTP mix, 1 µL of 5 pmol/µL of both srfA3/licA3 F and R2 primers, 4 µL of cell template, 0.25 µL of Platinum Taq polymerase (Invitrogen) and 28.75 µL of sterile deionized water forming a 50 µL reaction volume. The thermal cycler was again programmed for 5 min at 94oC for initial denaturation, 30 cycles of 35 s at 94oC for denaturation, 35 s at 50oC for annealing, 45 s at 72oC for extension subsequently followed by a final extension at 72oC for 6 min and a 4oC quench. A subset of type strains including the two field strains (B. subtilis subsp. spizizenii NRRL B-23049 and B. licheniformis strain RS-1) and three Gram-negative strains (Escherichia coli OU8739, Klebsiella pneumoniae OU10149 and Salmonella typhi OU10209) were then PCR amplified to test the srfA3/licA3F and srfA3/licA3R2 primers. In addition, amplification of several other species of the B. licheniformis/ subtilis clade were attempted to determine the specificity range of the srfA3/licA3 F and R2 primer set. Four strains were isolates from the Sonoran Desert including T89-11, TG2-32, TE-48 and RL-1 [116, 117]. Other strains included B. licheniformis ATCC 14580, B. sonorensis NRRL
Primer Sequence Reference 27F 5'-AGAGTTTGATCMTGG-3' 1492R 5'-TACCTTGTTACGACTT-
3' GM5F 5'GCCCGCCGCGCCCGCGCCCGTCCCGCCGCCCC
C GCCCGCCTACGGGAGGCAGCAG-3' 907R 5'-CCGTCAATTCCTTTRAGTTT-3'
srfA3/licA3 F 5'-CAAAAKCGCAKCATACCAAKTTGAG-3' srfA3/licA3 R 5'-TCATARAGCGGCAYATATTGATGC-3' srfA3/licA3 R2 5'-AGCGGCAYATATTGATGCGGYTC-
3' gyrA F 5'-CAGTCAGGAAATGCGTACGTCCTT-3' gyrA R 5'-CAAGGTAATGCTCCAGGCATTGCT-3'
rhlR F 5'-CTGCGCTCCWCGGAAATGGTG-3' rhlR R 5'-TCTGGATGWYCTTGWGGTGGAAGTTC-3'
BOXA1R 5'-CTACGGCAAGGCGACGCTGACG-3'
[6, 7]
[4, 5]
[3]
[2]
[8-11]
[1]

62
B-23154, B. mojavensis ROB2, B. mojavensis NRRL B-1469, B. mojavensis JF2, B. subtilis subsp. subtilis strain 168, B. subtilis OKB105, B. vallismortis NRRL B-4890, B. pumilis ATCC 7061, B. atrophaeus NRRL NRS B213, B. cereus ATCC 14579, B. magaterium ATCC 14581, and B. amyloliquefaciens CBD566. B. fusiformis strain RS-2 isolated from Robertson/Parrish Tank Battery oil field brine near Oil Center, OK was tested against the primers. Only srfA3/licA3 sequences for B. licheniformis ATCC 14580 and B. subtilis subsp. subtilis strain 168 had previously been identified in the NCBI GenBank. Purification of the PCR product and cloning into the pGEM vector was performed on each of the srfA3/licA3 F and R2 positive strains. A total of 3 clones were sequenced using both the T7 and SP6 vector primers for each amplicon by the Oklahoma Medical Research Facility (OMRF) Sequencing Laboratory (Oklahoma City, OK). The OMRF provided all DNA sequencing services described in this report. A consensus sequence was determined after sequence assembly and multiple sequence alignment by DNAMAN (Lynnon Biosoft) and visual inspection. Each of these consensus sequences will be deposited into the NCBI GenBank. The oil drop assay based on an existing static biofilm formation assay as described in the 2005 Annual Report (28) was again utilized to correlate srfA3/licA3 presence with qualitative measurement of biosurfactant production in a strain. A modified Bacillus Biofilm Growth Medium (BBGM) consisting of Luria Bertani broth (LB), 0.1% dextrose, 150mM ammonium sulfate, 34mM sodium citrate, 100mM potassium phosphate buffer and 1 g/L sodium nitrate was the medium used in a 96-well plate format [118]. After static growth, strains were scored positive for biosurfactant production if there was dissipation or condensation of the oil drop. Surface activity of each strain was also determined by hemolytic reaction on tryptic soy agar plates with 5% sheep blood [119].
Development and testing of rhlR functional gene primer.
A degenerate primer set was also developed and tested against type strains for rhlR which expresses a rhamnolipid biosurfactant regulator in Pseudomonas aeruginosa [8-11]. Cell or DNA template from strains of several Pseudomonas species as well as other Gram-negative strains from other genera and the Gram-positive B. subtilis subsp. subtilis strain 168 were subjected to PCR amplification with the rhlR and rhlF primer set. The reaction mix consisted of 5 µL of 10X PCR buffer, 0.5 µL DMSO, 2.5 µL of 50 mM magnesium chloride, 1 µL of 10 mM dNTP mix, 1 µL of 5 pmol/µL of both rhlRF and rhlRR primers, 4 µL of cell template, 0.25 µL of Platinum Taq polymerase (Invitrogen) and 34.75 µL of sterile deionized water forming a 50 µL reaction volume. The thermal cycler was programmed for 5 min at 95oC for initial denaturation, 10 touchdown cycles of 40 s at 95oC for denaturation, 40 s at 57.3oC minus 0.5oC per cycle to 52.3oC for annealing, 45 s at 72oC for extension followed by 23 cycles of 40 s at 95oC for denaturation, 40 s at 52.3oC for annealing, 45 s at 72oC for extension and finally a final extension at 72oC for 7 minutes and a 4oC quench.

63
Each of the strains available in culture was also tested for rhamnolipid activity using the oil spread assay using a Pseudomonas Biofilm Medium (PBM) [120] which consisted of 50mM MOPS, 2.5 g/L sodium chloride, 5.0 g/L ammonium chloride, 0.3 g/L dibasic potassium phosphate, 0.01% yeast extract, 0.5 % glucose and 0.5% casamino acids.
Detection of injected strains in produced fluids.
DNA templates extracted from time course brine for ROB 15 and ROB 13 at 14:00MT as described in the 2005 Annual Report (28) were then re-amplified with the new srfFA3/licA3 F and R2 primers. PCR mix and reaction conditions were the same except that 5 µL of extracted DNA template and 27.75 µL of sterile deionized water were utilized in the 50 µL reaction. The products were excised and extracted (Qiagen) from a 1.5% agarose gel, cloned into pGEM (Promega) then plasmid amplified and purified (Qiagen). Clones were sequenced in both directions by using the T7 and SP6 primers and assembled using DNAMAN. In addition, the same DNA extracted from time course brine for ROB 15 and ROB 13 at 14:00MT were then amplified with the gyrAF and R primers. Except for the inclusion of only the gyrA primer set, the PCR mix was identical in formulation to that used above for srfA3/licA3 amplification. However, the thermocycler was programmed for 4 min at 94oC for initial denaturation, 35 cycles of 1 min at 94oC for denaturation, 1 min at 48oC for annealing, 1.5 min at 72oC for extension subsequently followed by a final extension at 72oC for 8 min. and a 4oC quench. The products were extracted (Qiagen) from a 1.0% agarose gel, cloned into pGEM (Promega) then plasmid amplified and purified (Qiagen) and sequenced in both directions by using the T7 and SP6 primers. DNAMAN was used to assemble the sequences.
Effect of treatments on the oil reservoir microbial community.
In addition to the pGEM clones excised from the DGGE gel discussed in the 2005 Annual Report [115], 27F and 1492R primers for PCR amplification 16S rRNA gene in eubacteria were utilized with the DNA extracted from the time course brine samples before and after treatment. The reaction mix consisted of 5 µL of 10X PCR buffer, 5 µL of 5 M betaine, 4 µL of 50 mM magnesium chloride, 1 µL of 10 mM dNTP mix, 1 µL of 5 pmol/µL of both 27F and 1492R primers, 6 µL of DNA template, 0.25 µL of Platinum Taq polymerase (Invitrogen) and 26.75 µL of sterile deionized water forming a 50 µL reaction volume. The thermal cycler was programmed for 5 min at 95oC for initial denaturation, 30 cycles of 1 min at 94oC for denaturation, 2 min at 42oC for annealing, 2 min at 72oC for extension subsequently followed by a final extension at 72oC for 8 minutes and a 4oC quench. The amplicons were gel extracted and cloned into pGEM for sequencing. Approximately 8 clones were sequenced for each of the 5 wells before and after treatment (14:00MT). Sequences were assembled using DNAMAN and compared to GenBank submissions with BlastN results. The most prevalent clones from this very limited 16S survey were compared in a multiple sequence alignment using DNAMAN

64
which was then used to assemble a phylogenetic tree using the observed divergence method with 1000 bootstrap trials. srfA3/licA3 and gyrA bands from culture-dependent enrichment DNA were also PCR amplified, cloned and sequenced.
Prevalence of biosurfactant producers in various oil formations.
A 2L sample of produced brine was collected from 11 wells from 7 formation types with a range of [Cl-] concentrations (Table 4.2). For the culture-independent approach, DNA was extracted in accordance with the protocol used for the field test time course analysis described on page 19 of the 2005 Annual Report [115]. Several extractions did require the addition of a concentration step from 100 µL to 30 µL final volume by rotary vacuum concentrator. DNA formation samples were PCR amplified with the srfA3/licA3 E and R2 degenerate primers. The amplicons were excised from 1.5% agarose gels, gel extracted (QIAquick Gel Extraction Kit) and pGEM (Promega) cloned. Three individual clones were subsequently amplified for each formation band by growth in LB broth containing 100 µg/l of ampicillin. After plasmid purification (QIAprep Spin Mini Prep Kit) and A260/A280 quantification, sequencing was performed by OMRF. The formation clones (shown in red) were then aligned together with the type consensus sequences (shown in blue) in a multiple sequence alignment for phylogenetic tree construction using the Observed Divergency Distance Method and 1000 bootstrap trials.
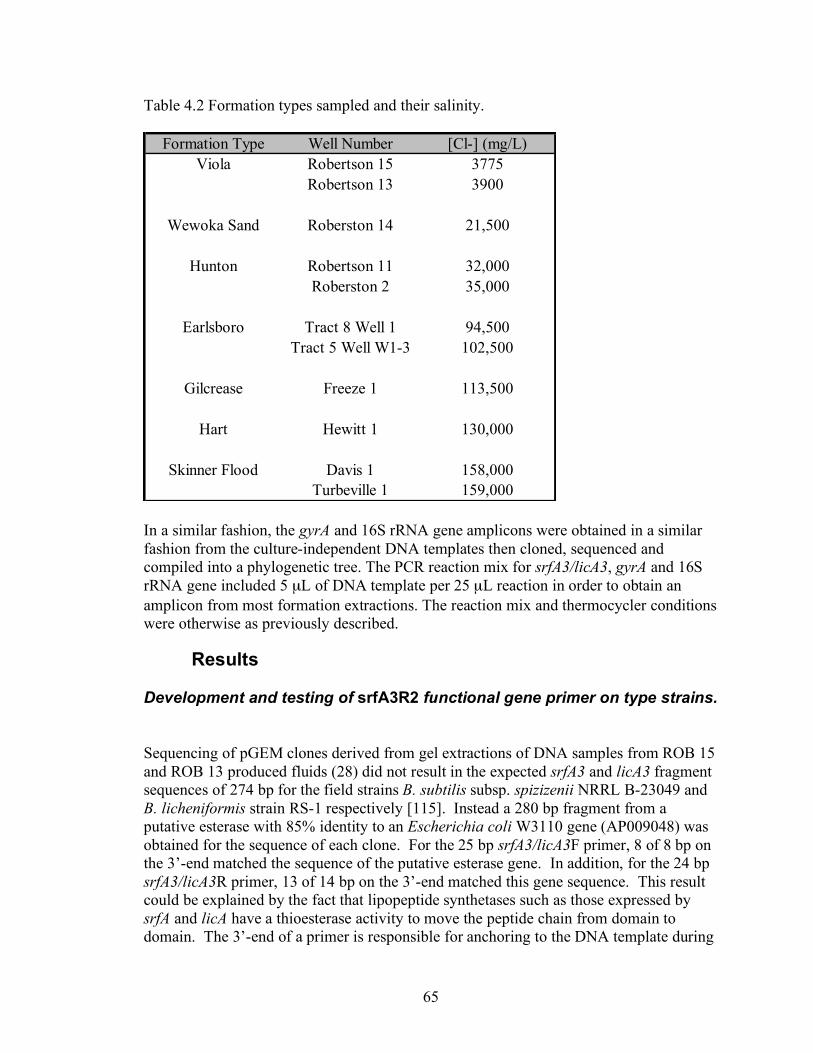
65
Table 4.2 Formation types sampled and their salinity.
Formation Type Well Number [Cl-] (mg/L)
Viola Robertson 15 3775
Robertson 13 3900
Wewoka Sand Roberston 14 21,500
Hunton Robertson 11 32,000
Roberston 2 35,000
Earlsboro Tract 8 Well 1 94,500
Tract 5 Well W1-3 102,500
Gilcrease Freeze 1 113,500
Hart Hewitt 1 130,000
Skinner Flood Davis 1 158,000
Turbeville 1 159,000 In a similar fashion, the gyrA and 16S rRNA gene amplicons were obtained in a similar fashion from the culture-independent DNA templates then cloned, sequenced and compiled into a phylogenetic tree. The PCR reaction mix for srfA3/licA3, gyrA and 16S rRNA gene included 5 µL of DNA template per 25 µL reaction in order to obtain an amplicon from most formation extractions. The reaction mix and thermocycler conditions were otherwise as previously described.
Results
Development and testing of srfA3R2 functional gene primer on type strains.
Sequencing of pGEM clones derived from gel extractions of DNA samples from ROB 15 and ROB 13 produced fluids (28) did not result in the expected srfA3 and licA3 fragment sequences of 274 bp for the field strains B. subtilis subsp. spizizenii NRRL B-23049 and B. licheniformis strain RS-1 respectively [115]. Instead a 280 bp fragment from a putative esterase with 85% identity to an Escherichia coli W3110 gene (AP009048) was obtained for the sequence of each clone. For the 25 bp srfA3/licA3F primer, 8 of 8 bp on the 3’-end matched the sequence of the putative esterase gene. In addition, for the 24 bp srfA3/licA3R primer, 13 of 14 bp on the 3’-end matched this gene sequence. This result could be explained by the fact that lipopeptide synthetases such as those expressed by srfA and licA have a thioesterase activity to move the peptide chain from domain to domain. The 3’-end of a primer is responsible for anchoring to the DNA template during

66
PCR amplification. As a result of the near 100% identity at the 3’ end for each primer particularly for srfA3/licA3R, a new primer srfA3R2 was developed based on the same srfA3 and licA3 gene sequences available in the NCBI GenBank. In an attempt to enhance the specificity of the primer set to only amplify srfA3 and licA3 homologues, the primer srfA3R2 was moved 5 bp toward 3’-end in relation to srfA3R resulting in an expected product size of 268 bp. This relocation left the first 5 bp of the 3’-end of srfA3R2 with no sequence identity to the putative esterase gene. The primer set yielded an approximately 269 bp product for the two field strains and no product for the three Gram-negative strains (Figure 4.1). Figure 4.1 srfA3/licA3 F and R2 specificity for field strains versus Gram-negative strains
B. lic
heni
form
isstra
in R
S-1
B. sub
tilis
subs
p.sp
ezizen
iiB-2
3049
Salm
onel
la ty
phi
OU
1020
9
Kle
bsie
llapn
eum
onia
eO
U10
149
Esche
rich
ia c
oli O
U87
39 RC
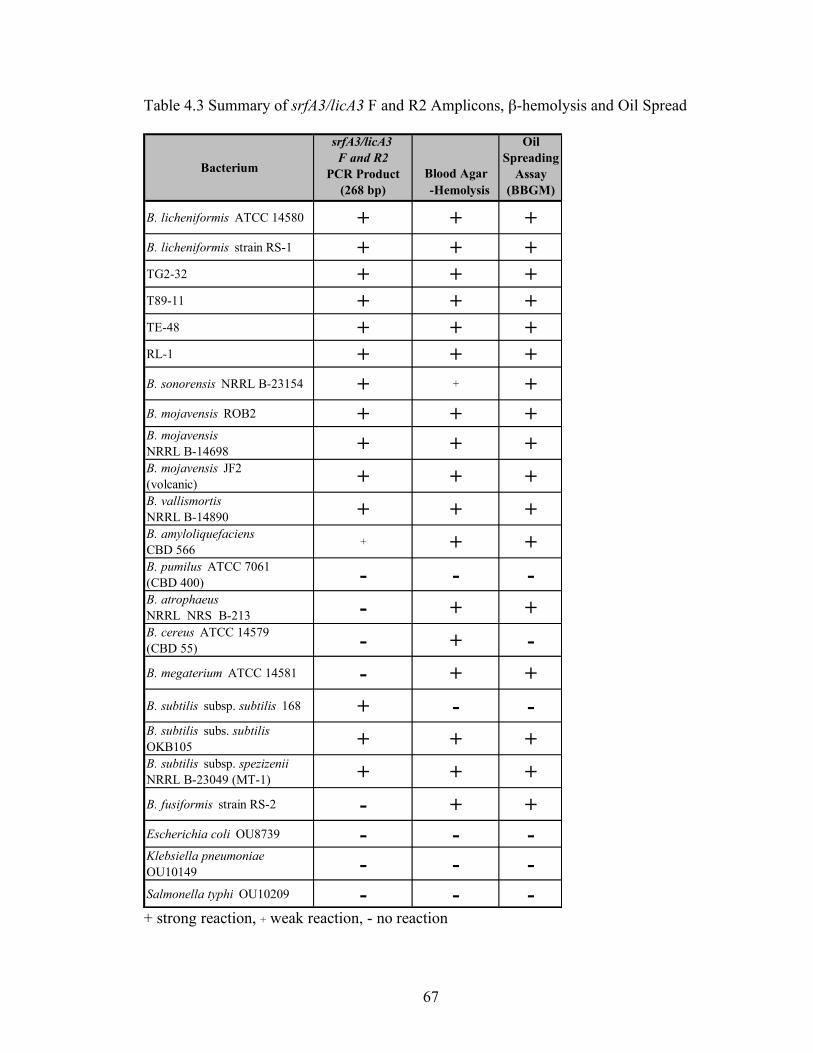
67
Table 4.3 Summary of srfA3/licA3 F and R2 Amplicons, β-hemolysis and Oil Spread
Bacterium
srfA3/licA3
F and R2
PCR Product
(268 bp)
Blood Agar ! -Hemolysis
Oil
Spreading
Assay
(BBGM)
B. licheniformis ATCC 14580 + + +
B. licheniformis strain RS-1 + + +TG2-32 + + +T89-11 + + +TE-48 + + +RL-1 + + +
B. sonorensis NRRL B-23154 + + +
B. mojavensis ROB2 + + +B. mojavensis
NRRL B-14698 + + +B. mojavensis JF2
(volcanic) + + +B. vallismortis
NRRL B-14890 + + +B. amyloliquefaciens
CBD 566+ + +
B. pumilus ATCC 7061
(CBD 400) - - -B. atrophaeus
NRRL NRS B-213 - + +B. cereus ATCC 14579
(CBD 55) - + -
B. megaterium ATCC 14581 - + +
B. subtilis subsp. subtilis 168 + - -B. subtilis subs. subtilis
OKB105 + + +B. subtilis subsp. spezizenii
NRRL B-23049 (MT-1) + + +
B. fusiformis strain RS-2 - + +
Escherichia coli OU8739 - - -Klebsiella pneumoniae
OU10149 - - -
Salmonella typhi OU10209 - - - + strong reaction, + weak reaction, - no reaction
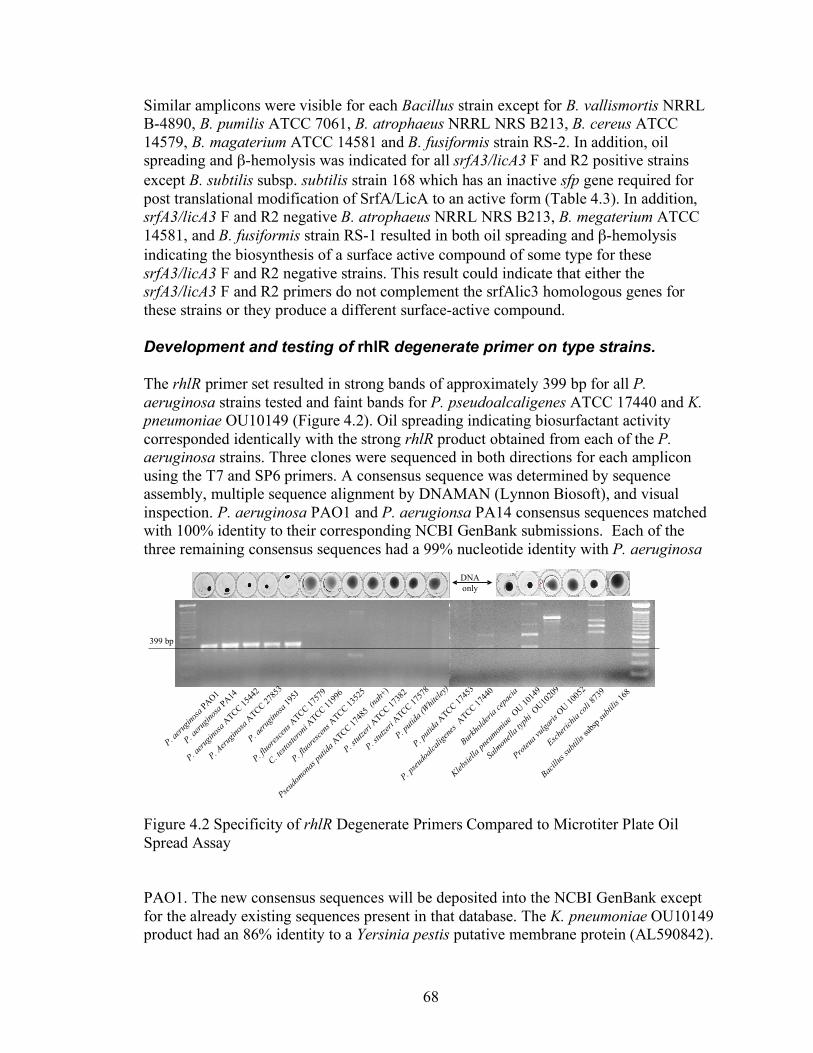
68
Similar amplicons were visible for each Bacillus strain except for B. vallismortis NRRL B-4890, B. pumilis ATCC 7061, B. atrophaeus NRRL NRS B213, B. cereus ATCC 14579, B. magaterium ATCC 14581 and B. fusiformis strain RS-2. In addition, oil spreading and β-hemolysis was indicated for all srfA3/licA3 F and R2 positive strains except B. subtilis subsp. subtilis strain 168 which has an inactive sfp gene required for post translational modification of SrfA/LicA to an active form (Table 4.3). In addition, srfA3/licA3 F and R2 negative B. atrophaeus NRRL NRS B213, B. megaterium ATCC 14581, and B. fusiformis strain RS-1 resulted in both oil spreading and β-hemolysis indicating the biosynthesis of a surface active compound of some type for these srfA3/licA3 F and R2 negative strains. This result could indicate that either the srfA3/licA3 F and R2 primers do not complement the srfAlic3 homologous genes for these strains or they produce a different surface-active compound.
Development and testing of rhlR degenerate primer on type strains.
The rhlR primer set resulted in strong bands of approximately 399 bp for all P. aeruginosa strains tested and faint bands for P. pseudoalcaligenes ATCC 17440 and K. pneumoniae OU10149 (Figure 4.2). Oil spreading indicating biosurfactant activity corresponded identically with the strong rhlR product obtained from each of the P. aeruginosa strains. Three clones were sequenced in both directions for each amplicon using the T7 and SP6 primers. A consensus sequence was determined by sequence assembly, multiple sequence alignment by DNAMAN (Lynnon Biosoft), and visual inspection. P. aeruginosa PAO1 and P. aerugionsa PA14 consensus sequences matched with 100% identity to their corresponding NCBI GenBank submissions. Each of the three remaining consensus sequences had a 99% nucleotide identity with P. aeruginosa Figure 4.2 Specificity of rhlR Degenerate Primers Compared to Microtiter Plate Oil Spread Assay PAO1. The new consensus sequences will be deposited into the NCBI GenBank except for the already existing sequences present in that database. The K. pneumoniae OU10149 product had an 86% identity to a Yersinia pestis putative membrane protein (AL590842).
Pseudo
monas
putid
a ATCC 1748
5(na
h+)
C. testo
steron
i ATCC 1199
6
P. fluo
rescen
s ATCC 1352
5
P. stutz
eriATCC 17
382
P. pseu
doalc
aligen
esATCC 17
440
P. stutz
eriATCC 17
578
P. puti
daATCC 17
453
P. aeru
ginosa
ATCC 1544
2
P. aeru
ginosa
PAO1
P. aeru
ginosa
195J
P. fluo
rescen
s ATCC 1757
9
P. aeru
ginosa
PA14
P. Aeru
ginosa
ATCC 2785
3
Burkho
lderia
cepaci
a
Salm
onell
a typ
hiOU10
209
P. puti
da(W
hitele
y)
Klebsie
llapn
eumon
iaeOU 10
149
Proteua
vulga
risOU 10
052
Escheri
chia
coli 8
739
Bacillu
s sub
tilis sub
spsub
tilis 16
8
DNA only
399 bp
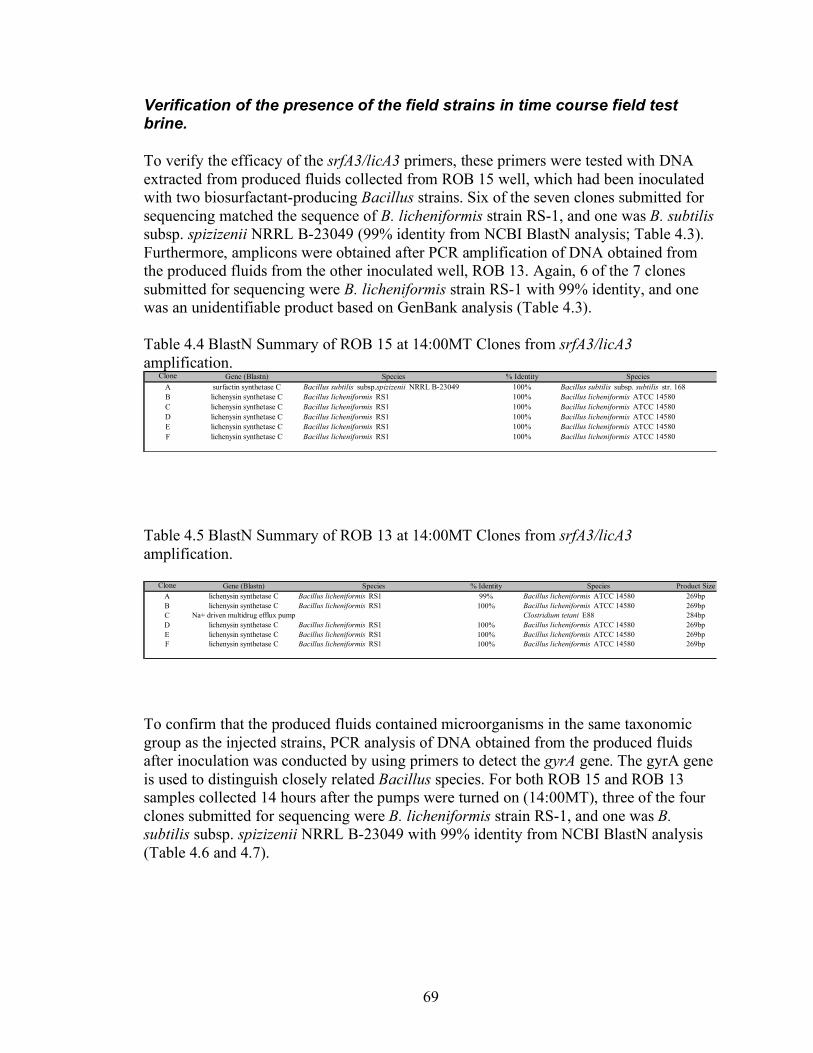
69
Verification of the presence of the field strains in time course field test brine.
To verify the efficacy of the srfA3/licA3 primers, these primers were tested with DNA extracted from produced fluids collected from ROB 15 well, which had been inoculated with two biosurfactant-producing Bacillus strains. Six of the seven clones submitted for sequencing matched the sequence of B. licheniformis strain RS-1, and one was B. subtilis subsp. spizizenii NRRL B-23049 (99% identity from NCBI BlastN analysis; Table 4.3). Furthermore, amplicons were obtained after PCR amplification of DNA obtained from the produced fluids from the other inoculated well, ROB 13. Again, 6 of the 7 clones submitted for sequencing were B. licheniformis strain RS-1 with 99% identity, and one was an unidentifiable product based on GenBank analysis (Table 4.3). Table 4.4 BlastN Summary of ROB 15 at 14:00MT Clones from srfA3/licA3 amplification.
Table 4.5 BlastN Summary of ROB 13 at 14:00MT Clones from srfA3/licA3 amplification.
To confirm that the produced fluids contained microorganisms in the same taxonomic group as the injected strains, PCR analysis of DNA obtained from the produced fluids after inoculation was conducted by using primers to detect the gyrA gene. The gyrA gene is used to distinguish closely related Bacillus species. For both ROB 15 and ROB 13 samples collected 14 hours after the pumps were turned on (14:00MT), three of the four clones submitted for sequencing were B. licheniformis strain RS-1, and one was B. subtilis subsp. spizizenii NRRL B-23049 with 99% identity from NCBI BlastN analysis (Table 4.6 and 4.7).
Clone Gene (Blastn) Species % Identity Species
A surfactin synthetase C Bacillus subtilis subsp.spizizenii NRRL B-23049 100% Bacillus subtilis subsp. subtilis str. 168
B lichenysin synthetase C Bacillus licheniformis RS1 100% Bacillus licheniformis ATCC 14580
C lichenysin synthetase C Bacillus licheniformis RS1 100% Bacillus licheniformis ATCC 14580
D lichenysin synthetase C Bacillus licheniformis RS1 100% Bacillus licheniformis ATCC 14580
E lichenysin synthetase C Bacillus licheniformis RS1 100% Bacillus licheniformis ATCC 14580
F lichenysin synthetase C Bacillus licheniformis RS1 100% Bacillus licheniformis ATCC 14580
Clone Gene (Blastn) Species % Identity Species Product Size
A lichenysin synthetase C Bacillus licheniformis RS1 99% Bacillus licheniformis ATCC 14580 269bp
B lichenysin synthetase C Bacillus licheniformis RS1 100% Bacillus licheniformis ATCC 14580 269bp
C Na+ driven multidrug efflux pump Clostridium tetani E88 284bp
D lichenysin synthetase C Bacillus licheniformis RS1 100% Bacillus licheniformis ATCC 14580 269bp
E lichenysin synthetase C Bacillus licheniformis RS1 100% Bacillus licheniformis ATCC 14580 269bp
F lichenysin synthetase C Bacillus licheniformis RS1 100% Bacillus licheniformis ATCC 14580 269bp
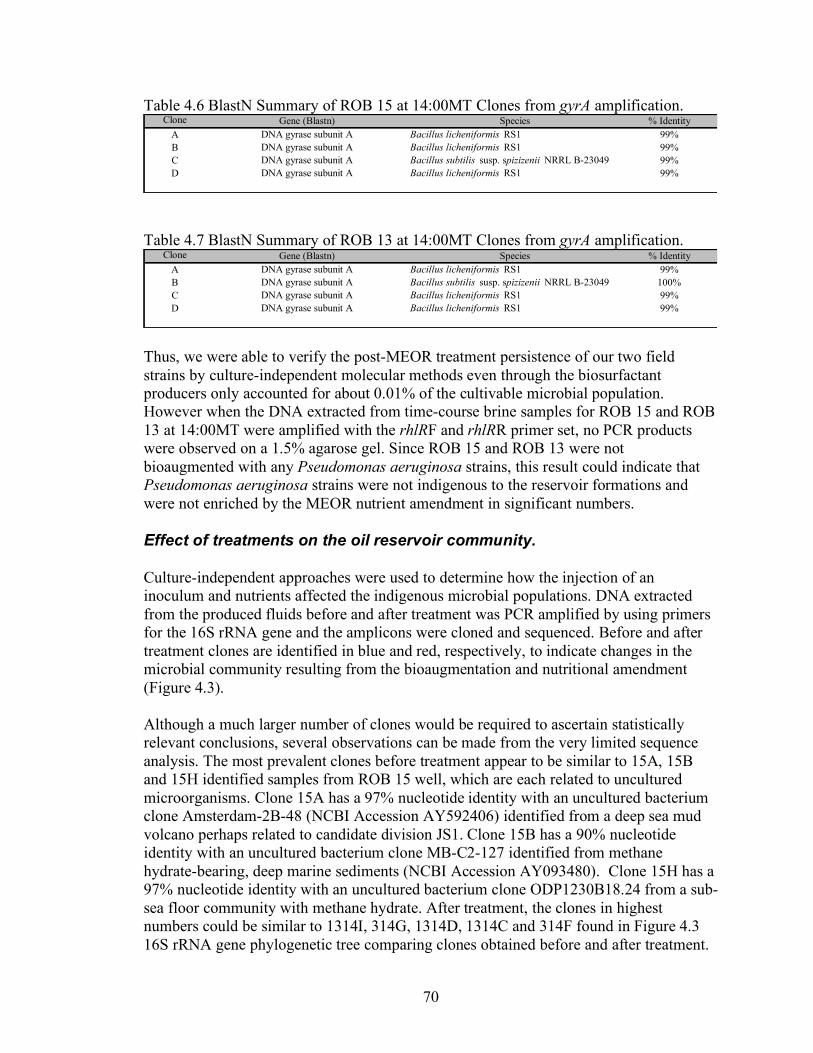
70
Table 4.6 BlastN Summary of ROB 15 at 14:00MT Clones from gyrA amplification. Clone Gene (Blastn) Species % Identity
A DNA gyrase subunit A Bacillus licheniformis RS1 99%
B DNA gyrase subunit A Bacillus licheniformis RS1 99%
C DNA gyrase subunit A Bacillus subtilis susp. spizizenii NRRL B-23049 99%
D DNA gyrase subunit A Bacillus licheniformis RS1 99%
Table 4.7 BlastN Summary of ROB 13 at 14:00MT Clones from gyrA amplification.
Clone Gene (Blastn) Species % Identity
A DNA gyrase subunit A Bacillus licheniformis RS1 99%
B DNA gyrase subunit A Bacillus subtilis susp. spizizenii NRRL B-23049 100%
C DNA gyrase subunit A Bacillus licheniformis RS1 99%
D DNA gyrase subunit A Bacillus licheniformis RS1 99%
Thus, we were able to verify the post-MEOR treatment persistence of our two field strains by culture-independent molecular methods even through the biosurfactant producers only accounted for about 0.01% of the cultivable microbial population. However when the DNA extracted from time-course brine samples for ROB 15 and ROB 13 at 14:00MT were amplified with the rhlRF and rhlRR primer set, no PCR products were observed on a 1.5% agarose gel. Since ROB 15 and ROB 13 were not bioaugmented with any Pseudomonas aeruginosa strains, this result could indicate that Pseudomonas aeruginosa strains were not indigenous to the reservoir formations and were not enriched by the MEOR nutrient amendment in significant numbers.
Effect of treatments on the oil reservoir community.
Culture-independent approaches were used to determine how the injection of an inoculum and nutrients affected the indigenous microbial populations. DNA extracted from the produced fluids before and after treatment was PCR amplified by using primers for the 16S rRNA gene and the amplicons were cloned and sequenced. Before and after treatment clones are identified in blue and red, respectively, to indicate changes in the microbial community resulting from the bioaugmentation and nutritional amendment (Figure 4.3). Although a much larger number of clones would be required to ascertain statistically relevant conclusions, several observations can be made from the very limited sequence analysis. The most prevalent clones before treatment appear to be similar to 15A, 15B and 15H identified samples from ROB 15 well, which are each related to uncultured microorganisms. Clone 15A has a 97% nucleotide identity with an uncultured bacterium clone Amsterdam-2B-48 (NCBI Accession AY592406) identified from a deep sea mud volcano perhaps related to candidate division JS1. Clone 15B has a 90% nucleotide identity with an uncultured bacterium clone MB-C2-127 identified from methane hydrate-bearing, deep marine sediments (NCBI Accession AY093480). Clone 15H has a 97% nucleotide identity with an uncultured bacterium clone ODP1230B18.24 from a sub-sea floor community with methane hydrate. After treatment, the clones in highest numbers could be similar to 1314I, 314G, 1314D, 1314C and 314F found in Figure 4.3 16S rRNA gene phylogenetic tree comparing clones obtained before and after treatment.

71
Before Treatment After TreatmentLEGEND:
15H
15E
Syntrophus aciditrophicus SB95
5A
Desulfuromonas thiophila sp. nov.98
15A
314C
uncultured candidate division JS1 bacterium clone MB-B2-103
95
1C
94
15B
Dehalococcoides ethenogenes
100
3A
uncultured bacterium clone SS-43
100
3G
3H
candidate division OP11 clone OPB92
Petrotoga mobilis
Rubrobacter taiwanensis
15G
Spirochaetes bacterium SA-10
100
1514B
1514F
95
314D
99
Pantoea agglomerans LMG 2660
100
1G
Pseudomonas aeruginosa ATCC 27853100
99
1514D
1314C
Sulfurospirillum carboxydovorans MV100
100
100
1314B
Dysgonomonas mossii
100
1314D
5E
100
Bacteroides thetaiotaomicron VPI-5482100
100
1514G
Clostridium amygdalinum ATCC BAA-501
100
5C
uncultured Clostridiales bacterium clone RsW02-041
13E
Weissella cibaria ACA-DCt2
100
1314I
314F
Trichococcus collinsii
314G
100
Bacillus licheniformis ATCC 14580
13D
Lactococcus lactis subsp. lactis strain CICC6024100
100
0.05
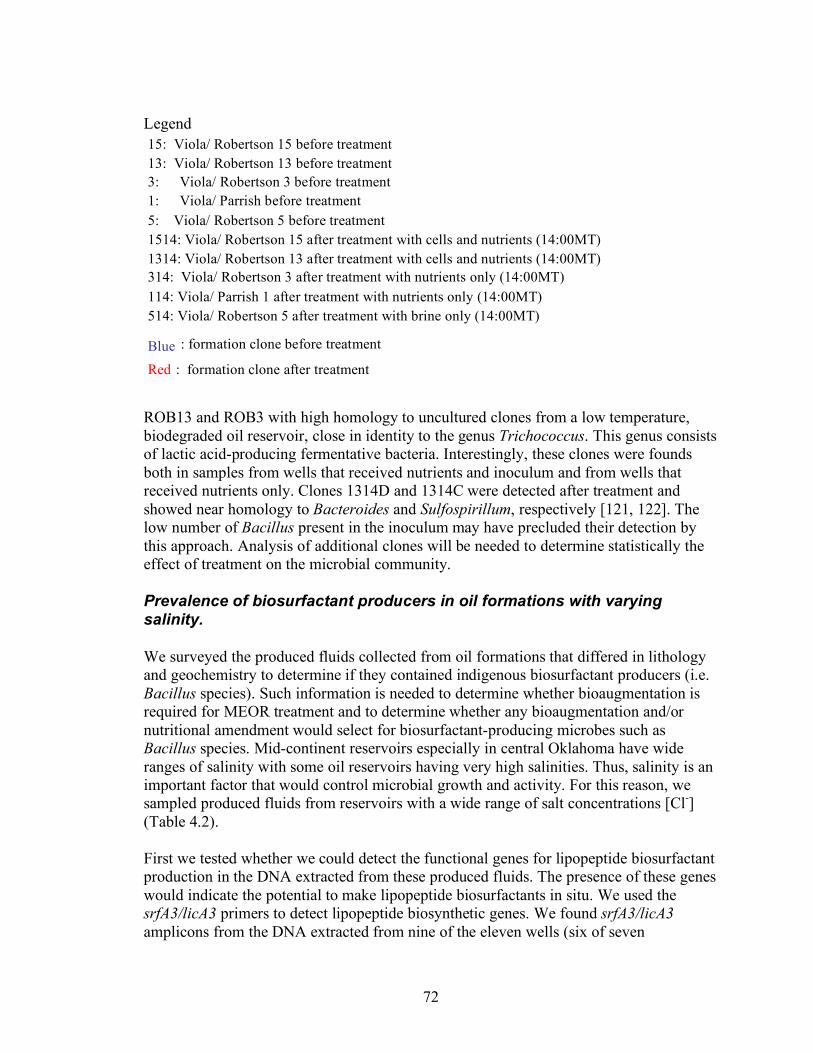
72
Legend ROB13 and ROB3 with high homology to uncultured clones from a low temperature, biodegraded oil reservoir, close in identity to the genus Trichococcus. This genus consists of lactic acid-producing fermentative bacteria. Interestingly, these clones were founds both in samples from wells that received nutrients and inoculum and from wells that received nutrients only. Clones 1314D and 1314C were detected after treatment and showed near homology to Bacteroides and Sulfospirillum, respectively [121, 122]. The low number of Bacillus present in the inoculum may have precluded their detection by this approach. Analysis of additional clones will be needed to determine statistically the effect of treatment on the microbial community.
Prevalence of biosurfactant producers in oil formations with varying salinity.
We surveyed the produced fluids collected from oil formations that differed in lithology and geochemistry to determine if they contained indigenous biosurfactant producers (i.e. Bacillus species). Such information is needed to determine whether bioaugmentation is required for MEOR treatment and to determine whether any bioaugmentation and/or nutritional amendment would select for biosurfactant-producing microbes such as Bacillus species. Mid-continent reservoirs especially in central Oklahoma have wide ranges of salinity with some oil reservoirs having very high salinities. Thus, salinity is an important factor that would control microbial growth and activity. For this reason, we sampled produced fluids from reservoirs with a wide range of salt concentrations [Cl-] (Table 4.2). First we tested whether we could detect the functional genes for lipopeptide biosurfactant production in the DNA extracted from these produced fluids. The presence of these genes would indicate the potential to make lipopeptide biosurfactants in situ. We used the srfA3/licA3 primers to detect lipopeptide biosynthetic genes. We found srfA3/licA3 amplicons from the DNA extracted from nine of the eleven wells (six of seven
15: Viola/ Robertson 15 before treatment 13: Viola/ Robertson 13 before treatment 3: Viola/ Robertson 3 before treatment 1: Viola/ Parrish before treatment 5: Viola/ Robertson 5 before treatment 1514: Viola/ Robertson 15 after treatment with cells and nutrients (14:00MT) 1314: Viola/ Robertson 13 after treatment with cells and nutrients (14:00MT) 314: Viola/ Robertson 3 after treatment with nutrients only (14:00MT) 114: Viola/ Parrish 1 after treatment with nutrients only (14:00MT) 514: Viola/ Robertson 5 after treatment with brine only (14:00MT)
Blue
: formation clone before treatment
Red : formation clone after treatment
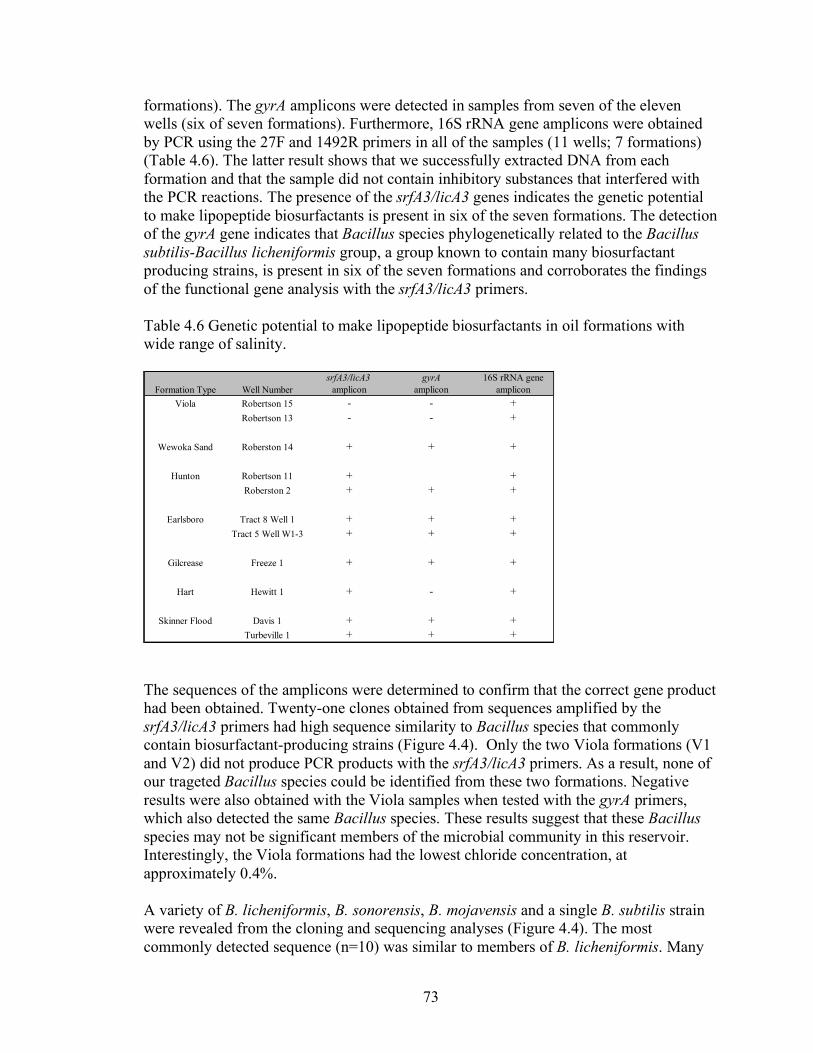
73
formations). The gyrA amplicons were detected in samples from seven of the eleven wells (six of seven formations). Furthermore, 16S rRNA gene amplicons were obtained by PCR using the 27F and 1492R primers in all of the samples (11 wells; 7 formations) (Table 4.6). The latter result shows that we successfully extracted DNA from each formation and that the sample did not contain inhibitory substances that interfered with the PCR reactions. The presence of the srfA3/licA3 genes indicates the genetic potential to make lipopeptide biosurfactants is present in six of the seven formations. The detection of the gyrA gene indicates that Bacillus species phylogenetically related to the Bacillus subtilis-Bacillus licheniformis group, a group known to contain many biosurfactant producing strains, is present in six of the seven formations and corroborates the findings of the functional gene analysis with the srfA3/licA3 primers. Table 4.6 Genetic potential to make lipopeptide biosurfactants in oil formations with wide range of salinity.
Formation Type Well Number
srfA3/licA3
amplicon
gyrA
amplicon
16S rRNA gene
amplicon
Viola Robertson 15 - - +
Robertson 13 - - +
Wewoka Sand Roberston 14 + + +
Hunton Robertson 11 + +
Roberston 2 + + +
Earlsboro Tract 8 Well 1 + + +
Tract 5 Well W1-3 + + +
Gilcrease Freeze 1 + + +
Hart Hewitt 1 + - +
Skinner Flood Davis 1 + + +
Turbeville 1 + + + The sequences of the amplicons were determined to confirm that the correct gene product had been obtained. Twenty-one clones obtained from sequences amplified by the srfA3/licA3 primers had high sequence similarity to Bacillus species that commonly contain biosurfactant-producing strains (Figure 4.4). Only the two Viola formations (V1 and V2) did not produce PCR products with the srfA3/licA3 primers. As a result, none of our trageted Bacillus species could be identified from these two formations. Negative results were also obtained with the Viola samples when tested with the gyrA primers, which also detected the same Bacillus species. These results suggest that these Bacillus species may not be significant members of the microbial community in this reservoir. Interestingly, the Viola formations had the lowest chloride concentration, at approximately 0.4%. A variety of B. licheniformis, B. sonorensis, B. mojavensis and a single B. subtilis strain were revealed from the cloning and sequencing analyses (Figure 4.4). The most commonly detected sequence (n=10) was similar to members of B. licheniformis. Many

74
of these showed significant homology to strains previously isolated from the Sonoran desert (TG2-32, T89-11, TE48 and RL-1). These strains are known to be halotolerant and grow in NaCl concentration up to 10 to 15% [116]. The formations in which B. licheniformis-related sequences were detected had chloride concentrations from 2.2% to 16%. Six sequences were related to members of B. mojavensis and were detected in four different formations that ranged from approximately 2.2% to 13% chloride concentration. One sequence was related to B. subtilis subsp. subtilis, which was obtained from the Gilcrease formation that had approximately 11.4% [Cl-]. Some sequences (100% nucleotide identity) were detected multiple times. G1F and G1H were identical to each other as were W1F, W1G, and W1H and H2B and H2C. Figure 4.4 Phylogenetic tree of srfA3/licA3 clones from different oil formation brines.
E1F
T89-11
E2D
H1G
G1F
G1H
B_licheniformis_RS1
TG2-32
D1H
H1H
W1H
W1G
W1F
TE-48
RL-1
98
B_licheniformis_ATCC_14580
96
E2C
B_sonorensis_NRRL_B-23154
H2C
H2B
D1E
100
100
E1D
HRE
W1B
B_mojavensis_ROB2
G1G
H2A
B_mojavensis_NRRL_B-1469
B_mojavensis_JF2
HRG
100
G1E
B_subtilis_subp_subtilis_strain_168
B_subtilis_OKB105
100
B_vallismortis_NRRL_B-4890
B_subtilis_subsp_spizizenii_NRRL_B-23049
97
100
B_amyloliquefaciens_CBD566
100
0.05

75
Legend for Figure 4.4, 4.5 and 4.6. Phylogenetic trees of genes of interest (srfA3/licA3, gyrA, 16S rRNA)
V1: Viola/ Robertson 15 V2: Viola/ Robertson 13 H1: Hunton / Robertson 11 H2: Hunton / Robertson 2 W1: Wewoka Sand/ Robertson 14 E1: Earlsboro 1 E2: Earlsboro 2 (Tract 5) G1: Gilcrease / Freeze 1 T1: Skinner Flood/ Turbeville 1 D1: Skinner Flood/ Davis 1 HR: Hart/ Hewitt 1
Blue : type strain consensus sequence Red : formation clone sequence
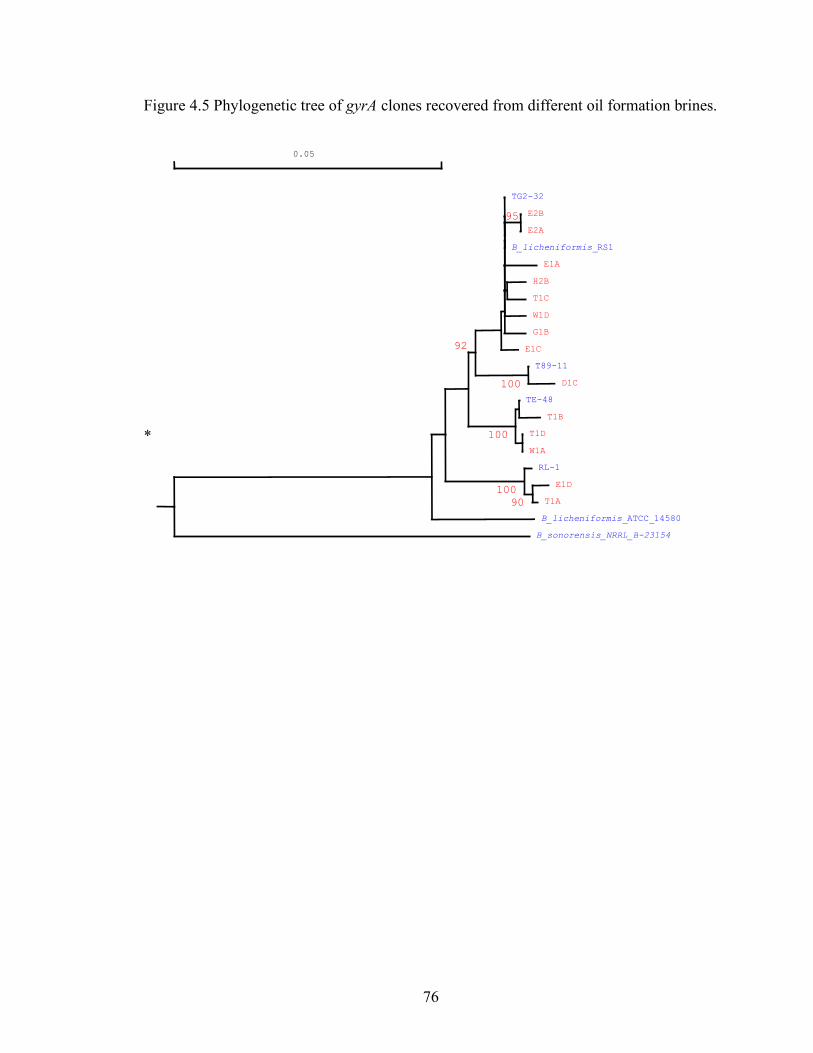
76
Figure 4.5 Phylogenetic tree of gyrA clones recovered from different oil formation brines. *
TG2-32
E2B
E2A
95
B_licheniformis_RS1
E1A
H2B
T1C
W1D
G1B
E1C
T89-11
D1C100
92
TE-48
T1B
T1D
W1A
100
RL-1
E1D
T1A90100
B_licheniformis_ATCC_14580
B_sonorensis_NRRL_B-23154
0.05

77
Figure 4.6 Phylogenetic tree of 16S rRNA gene clones related to the genus Bacillus from different oil formation brines.
B_amyloliquefaciens_ATCC_23350
B_vallismortis_DSM11031
B_mojavensis_ATCC_51516
B_mojavensis_JF-2
99
B_subtilis_subsb_subtilis_strain_168
B_subtilis_subsp_spizizenii_NRRL_B-23049
E2A
B_atrophaeus_NRRL_NRS-213
98
TG2-32
RS-1
E1B
T89-11
B_licheniformis_ATCC_14580
B_sonorensis_NRRL_B-23154
E2AA
T1D
T1A
RL-1 T1E
96
90
TE-48
100
B_pumilis_ATCC_7061
100
B_lentus_ATCC_10840
0.05
78
A total of 14 clones with similarity to Bacillus species that commonly contain biosurfactant producers were identified by culture-independent methods using the gyrA primer set (Figure 4.5). Again, only the two Viola formations samples (V1 and V2), which had low salinity, 0.4% [Cl-], did not result in a PCR product. This is consistent with the finding with the srfA3/licA3 PCR results and suggests that these Bacillus species are not indigenous to this formation. The distribution of gyrA clones was much narrower than for srfA3/licA3 in that only sequences with similarity to B. licheniformis species were detected. Many of these sequences showed significant homology to strains isolated from the Sonoran Desert. Formations in which B. licheniformis-related sequences were obtained ranged from 2.2% to 16% [Cl-]. Nine sequences grouped with strains TG2-32, T89-11 and RS-1. The E2A and E2B sequences were found in the same formation and had 100% nucleotide identity. Conversely, T1D and W1A had identical sequences but were found in different formations. Thus, species of the B. licheniformis –B. subtilis clade, which is known to contain biosurfactant producers, can be identified in a variety of formations so long as the salinity is above 0.4% in [Cl-]. Six clones with similarity to Bacillus species were detected in clone libraries obtained after amplification with the eubaterial 27F and 1492R primer set to detect the 16S rRNA gene (Figure 4.6). Five clones had sequences that grouped them with B. licheniformis, and the remaining clone had a sequence that was similar to B. subtilis subsp. spizizenii. The sequences of four clones were similar to the Sonoran Desert B. licheniformis strains RL-1 and TE-48, and one clone grouped with strainsTG2-32, T89-11 and RS-1. Interestingly, 16S rRNA gene sequences similar to Bacillus species were obtained only from Earlsboro and Turbeville brine samples. These two formations had salinities of 9.4% to 16% [Cl-]. However, 16S rRNA gene sequences were obtained from all eleven formations, showing again that the PCR protocols were effective. The gene sequences of these clones will be discussed below. Other sequences obtained from 16S rRNA gene amplification from selected formations are tabled below (Tables 4.7, 8, 9, 10, 11, 12). Since only 6 to 10 clones were obtained from each of the seven formations, statistical analysis techniques are limited. However some putative trends may be ascertained form the data. None of the clones in the Viola formation, which has approximately 0.4% [Cl-], are homologues to NCBI GenBank sequences of know halotolerant microbes or sequences obtained from high salt environments (Table 4.7). Seven sequences were most similar to those of uncultured microbes, many of which were obtained from methanogenic and dechlorinating environments. Conversely, most of the sequences from the Hunton (Robertson 11 well) formation (3.2% Cl-) have high identity with uncultured clones from brackish or hyperaline environments associated with sulfate-reducing conditions (Table 4.8). Clones C and F had sequences with 99% nucleotide homology to a cultured strain related to the sulfate reducer Desulfotignum balticum DSM7044, which was isolated from an oil reservoir model column [123]. As previously described in the 16S rRNA gene phylogenetic tree (Figure 4.6), Earlsboro 1 and Earlsboro 2 samples contained sequences related to the Bacillus licheniformis-B. subtilis clade. Interestingly, a 16S rRNA gene sequence (clone B) obtained from the

79
Earlsboro 1 sample had 99% identity to the sequence from B. licheniformis strain M1-1 (Table 4.9) [124]. The Earlsboro 1 (clone B) sequence differs by 5 bp from that of strain RS-1. The Earlsboro 16S rRNA gene sequence (clone B) could correspond to the srfA3/licA3 gene sequence detected in this sample (Figure 4.4). Earlsboro 2 samples contained a 16S rRNA gene sequence with 99% nucleotide identity to that of B. licheniformis strain ACO1 (a halo-thermotolerant strain from a Persian petroleum reservoir) and to B. subtilis strain MO2 (a halotolerant, aerobe from the Great Salt Plains of Oklahoma) (Table 4.10) [125, 126]. Furthermore, multiple 16S rRNA gene sequences with 98% or higher identity to those of lactic acid-producing fermenters such as Lactococcus lactis and Weissella confusa were found. In addition, Earlsboro 1 sample contained a 16S rRNA gene sequence similar to that of Ralstonia mannitolilytica strain AU428, which forms biofilms (Table 4.9) [127]. The Gilcrease 1 samples had five 16S rRNA gene sequences similar to that of Ralstonia sp. (Table 4.11). In samples from the Skinner Flood/Turbeville 1 formation, 3 of the 8 clones had 16S rRNA gene sequences with 99% nucleotide identity to the same B. licheniformis strain ACO1 isolated from a halo-thermotolerant isolate from Persian petroleum reservoir (Table 4.12) [125]. Four clones had 16S rRNA gene sequences that were similar to that of lactic acid-producing fermenters in the genus Lactobacillus. Earlsboro 1, Gilcrease 1/Freeze 1 and Skinner Flood/Turbeville 1 samples yielded clones of the lactic acid producing fermenting Leuconostoc genus. These reservoirs had [Cl-] from 9.4% to 16%. Table 4.7 16S rRNA gene clone summary for the Viola (Robertson 15 well) formation (0.4% m/V of [Cl-]).
Clone 16S rDNA (blastn) Accession % Identity
A Uncultured bacterium clone SHD-231 (1,2-
dichloropropane dechlorinator)
AJ306798 96%
B Uncultured bacterium clone PHB07 (propionate-
degrading methanogenic consortium)
AB232821 97%
C Olavius algarvensis sulfate-reducing
endosymbiont (Endosymbiotic sulphate-reducing
and sulphide-oxidizing bacteria in an oligochaete
worm)
AF328857 91%
D Uncultured bacterium clone: ODP1230B18.24
(methane hydrate-bearing deep marine sediments)
AB177162 96%
E Uncultured bacterium clone PHB07 (propionate-
degrading methanogenic consortium)
AB232821 97%
F Uncultured bacterium clone TANB44
(dechlorinating community resulting from in situ
biostimulation in a trichloroethene-contaminated
deep, fractured basalt aquifer)
AY667258 89%
G Uncultured anaerobic bacterium clone A-2A
(Anaerobic Swine Lagoons)
AY953190 88%
H Uncultured bacterium clone PHB07 (propionate-
degrading methanogenic consortium)
AB232821 97%
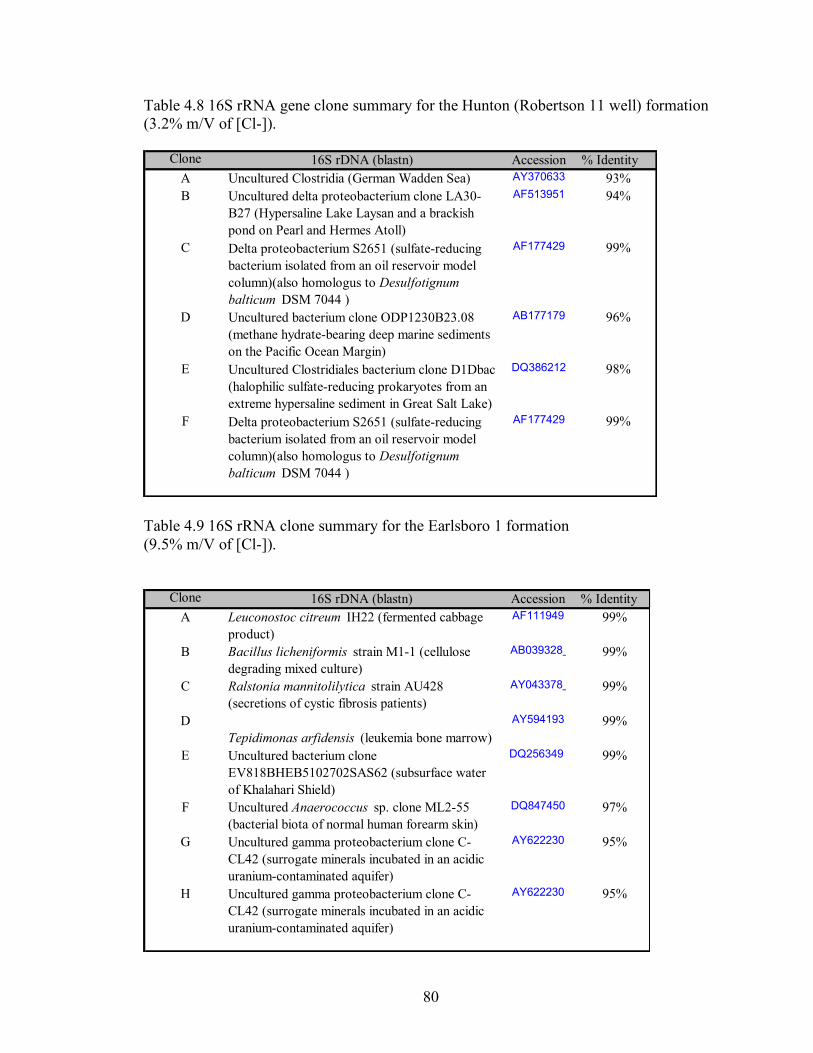
80
Table 4.8 16S rRNA gene clone summary for the Hunton (Robertson 11 well) formation (3.2% m/V of [Cl-]).
Clone 16S rDNA (blastn) Accession % Identity
A Uncultured Clostridia (German Wadden Sea) AY370633 93%
B Uncultured delta proteobacterium clone LA30-
B27 (Hypersaline Lake Laysan and a brackish
pond on Pearl and Hermes Atoll)
AF513951 94%
C Delta proteobacterium S2651 (sulfate-reducing
bacterium isolated from an oil reservoir model
column)(also homologus to Desulfotignum
balticum DSM 7044 )
AF177429 99%
D Uncultured bacterium clone ODP1230B23.08
(methane hydrate-bearing deep marine sediments
on the Pacific Ocean Margin)
AB177179 96%
E Uncultured Clostridiales bacterium clone D1Dbac
(halophilic sulfate-reducing prokaryotes from an
extreme hypersaline sediment in Great Salt Lake)
DQ386212 98%
F Delta proteobacterium S2651 (sulfate-reducing
bacterium isolated from an oil reservoir model
column)(also homologus to Desulfotignum
balticum DSM 7044 )
AF177429 99%
Table 4.9 16S rRNA clone summary for the Earlsboro 1 formation (9.5% m/V of [Cl-]).
Clone 16S rDNA (blastn) Accession % Identity
A Leuconostoc citreum IH22 (fermented cabbage
product)
AF111949 99%
B Bacillus licheniformis strain M1-1 (cellulose
degrading mixed culture)
AB039328 99%
C Ralstonia mannitolilytica strain AU428
(secretions of cystic fibrosis patients)
AY043378 99%
D
Tepidimonas arfidensis (leukemia bone marrow)
AY594193 99%
E Uncultured bacterium clone
EV818BHEB5102702SAS62 (subsurface water
of Khalahari Shield)
DQ256349 99%
F Uncultured Anaerococcus sp. clone ML2-55
(bacterial biota of normal human forearm skin)
DQ847450 97%
G Uncultured gamma proteobacterium clone C-
CL42 (surrogate minerals incubated in an acidic
uranium-contaminated aquifer)
AY622230 95%
H Uncultured gamma proteobacterium clone C-
CL42 (surrogate minerals incubated in an acidic
uranium-contaminated aquifer)
AY622230 95%

81
Table 4.10 16S rRNA gene clone summary for the Earlsboro 2 formation (10.3% m/V of [Cl-]).
Clone 16S rDNA (blastn) Accession % Identity
AA Bacillus licheniformis strain ACO1
(halothermotolerant isolate from Persian
petroleum reservoir)
DQ228696 99%
A Bacillus subtilis strain MO2 (Halotolerant
Aerobic Heterotrophic Bacteria from the Great
Salt Plains of Oklahoma)
AY553095 99%
B Lactococcus lactis subsp. lactis IL1403 AE006456 99%
D Acinetobacter calcoaceticus AJ888984 99%
E Lactococcus lactis clone 8C3 (breast milk of
healthy women)
AM157424 99%
F Lactococcus lactis clone 8C3 (breast milk of
healthy women)
AM157424 99%
G Halanaerobiaceae bacterium Benz1 (halophilic
sulfate-reducing prokaryotes from an extreme
hypersaline sediment in Great Salt Lake)
DQ386220 97%
H Weissella confusa strain Inje LM S-338 (lactic
acid bacterium)
DQ321751 98%
Table 4.11 16S rRNA gene clone summary for the Gilcrease/Freeze 1 formation (11.4% m/V of [Cl-]).
Clone 16S rDNA (blastn) Accession % Identity
AA Leuconostoc citreum IH22 (fermented cabbage
product)
AF111949 99%
BB Ralstonia sp. AU378 (Respiratory Secretions of
Cystic Fibrosis Patients)
AY043380 99%
A Ralstonia sp. AU378 (Respiratory Secretions of
Cystic Fibrosis Patients)
AY043380 99%
B Ralstonia sp. AU378 (Respiratory Secretions of
Cystic Fibrosis Patients)
AY043380 99%
C Ralstonia sp. AU378 (Respiratory Secretions of
Cystic Fibrosis Patients)
AY043380 99%
D Uncultured bacterium clone
EV818BHEB5102702SAS62 (subsurface water
of Khalahari Shield)
DQ256349 99%
E Propionibacterium acnes isolate WD1 AY642054 99%
F Ralstonia sp. AU378 (Respiratory Secretions of
Cystic Fibrosis Patients)
AY043380 99%
G Propionibacterium acnes isolate WD1 AY642054 99%
H Uncultured Desulfohalobiaceae bacterium clone
J2Dbac (halophilic sulfate-reducers from an
extreme hypersaline sediment in Great Salt Lake)
DQ386183 97%

82
Table 4.12 16S rRNA clone summary for the Skinner Flood/Turbeville 1 formation (15.9% Cl-).
Clone 16S rDNA (blastn) Accession % Identity
A Bacillus licheniformis strain ACO1
(halothermotolerant isolate from Persian
petroleum reservoir)
DQ228696 99%
B Lactococcus lactis clone 8C3 (breast milk of
healthy women)
AM157424 99%
C Lactococcus lactis clone 8C3 (breast milk of
healthy women)
AM157424 99%
D Bacillus licheniformis strain ACO1
(halothermotolerant isolate from Persian
petroleum reservoir)
DQ228696 99%
E Bacillus licheniformis strain ACO1
(halothermotolerant isolate from Persian
petroleum reservoir)
DQ228696 99%
F Leuconostoc mesenteroides strain LM2
(fermented Korean traditional foods)
AY675249 99%
G Lactobacillus fermentum strain SFCB2-6c
(Lactic Acid Bacteria Community SFC-2 and
Effects on Straw Fermentation)
DQ486144 99%
H Lactococcus lactis clone 8C3 (breast milk of
healthy women)
AM157424 99%
Discussion We found the genetic potential to make lipopeptide biosurfactants in six of the seven formations tested. In three formations, it was possible to sample multiple wells and in each case where multiple samples were obtained from the same formation, the results between the samples were reproducible. As discussed in Section 3 of this report, cultivation-dependent approaches showed that biosurfactant producers were not numerous in these formations. However, if the appropriate nutrients were used, biosurfactant activity could be stimulated. The detection of the lipopeptide genes was corroborated with the concomitant detection of the gyrA gene specific for the Bacillus subtilis-Bacillus licheniformis group. We did not obtain evidence for the presence of rhamnolipid-producing microorganisms either by culture-dependent or by culture-independent methods. The detection of the lipopeptide gene and evidence of the presence of members of the Bacillus subtilis-Bacillus licheniformis group by gyrA gene analysis in all but one of the formations sampled suggests that biosurfactant producers related to the Bacillus subtilis-Bacillus licheniformis group are prevalent in oil reservoirs with a wide range of salinity. Thus, it may not be necessary to inoculate such reservoirs. However, the addition of an inoculum could reduce shut-in times and result in more reproducible performance.

83
As a result, development of PCR primers for biosurfactant functional genes for specific Bacillus and Pseudomonas species typically capable of biosurfactant production was utilized to probe a variety of petroleum formations in central Oklahoma. The goal was to determine distinguish which petroleum formations would require bioaugmentation for successful MEOR treatment from those that may not. Although no indigenous Pseudomonas species clones were identified using rhlR or 16S rRNA gene primers for any formation type, all formations except the Viola provided clones indicative of B. licheniformis/ subtilis clade species. Thus, Viola formation wells may indeed require bioaugmentation with biosurfactant producers for any MEOR process to succeed. Conversely, oil wells in the Earlsboro or Turbeville formation types yielded B. licheniformis/ subtilis clade clones homologous to oil field isolates even with the non-specific, 16S rRNA primers and most likely would not require an inoculum. In addition, all formation production waters were above 2% [Cl-] except for the Viola formation, which had approximately 0.4% [Cl-]. Earlsboro and Turbeville production waters were approximately 10% and 16%, respectively with Turbeville being the formation with the highest [Cl-] sampled. Since many Bacillus species are at least moderately halophilic, our findings indicate that formations with at least 2% [Cl-] may have indigenous, biosurfactant producing Bacillus sp. present. Since biosurfactant activity does not appear to be indigenous to the Viola formation wells utilized in our field test, bioaugmentation and nutritional amendment were required for MEOR treatment. Even though the environmental conditions were altered by the glucose-based nutritional amendment in attempt to select for our bioaugmented field strains, B. licheniformis strain RS-1 and B. subtilis subsp. spizizenii NRRl B-23049, the normal homeostatic mechanism within the reservoir microbial community did not prevent their establishment and persistence. Both the srfA3/licA3 and gyrA primer sets successfully identified our bioaugmented strains after treatment. Given that oil reservoirs have diverse and metabolically active microbial communities, care must be taken to ensure that the nutrient regime does not stimulate detrimental activities such as souring and corrosion or competition by non-biosurfactant producing heterotrophic fermenters that contribute negatively to the MEOR effects [114]. Minimally, one will need to know what organisms are present and the factors that influence their growth and activity to exploit their activities in the reservoir. Many fermentative anaerobes produce large amounts of acids such as acetic, lactic, and butyric acids; solvents such as ethanol, acetone, butanol and 2, 3-butanediol; and gases such as CO2 and H2 from readily fermentable carbohydrate feedstocks such as molasses (30). Organic acid production can lead to the dissolution of carbonates in source rocks, enhancing permeability and porosity [128, 129]. Solvents can alter the wettability of the oil-rock interface, releasing oil from the porous matrix. Due to its preferential solubility in oil, CO2 production may swell the oil and reduce its viscosity, which would make the oil more mobile. Leuconostoc species produce dextran, an a-1, 4-D-glucan [130] that effectively reduces the permeability of fused-glass columns [131, 132]. In addition, a variety of Bacillus species that grow anaerobically and produce extracellular polysaccharides at temperatures up to 50oC and salinities up to 10% NaCl have been
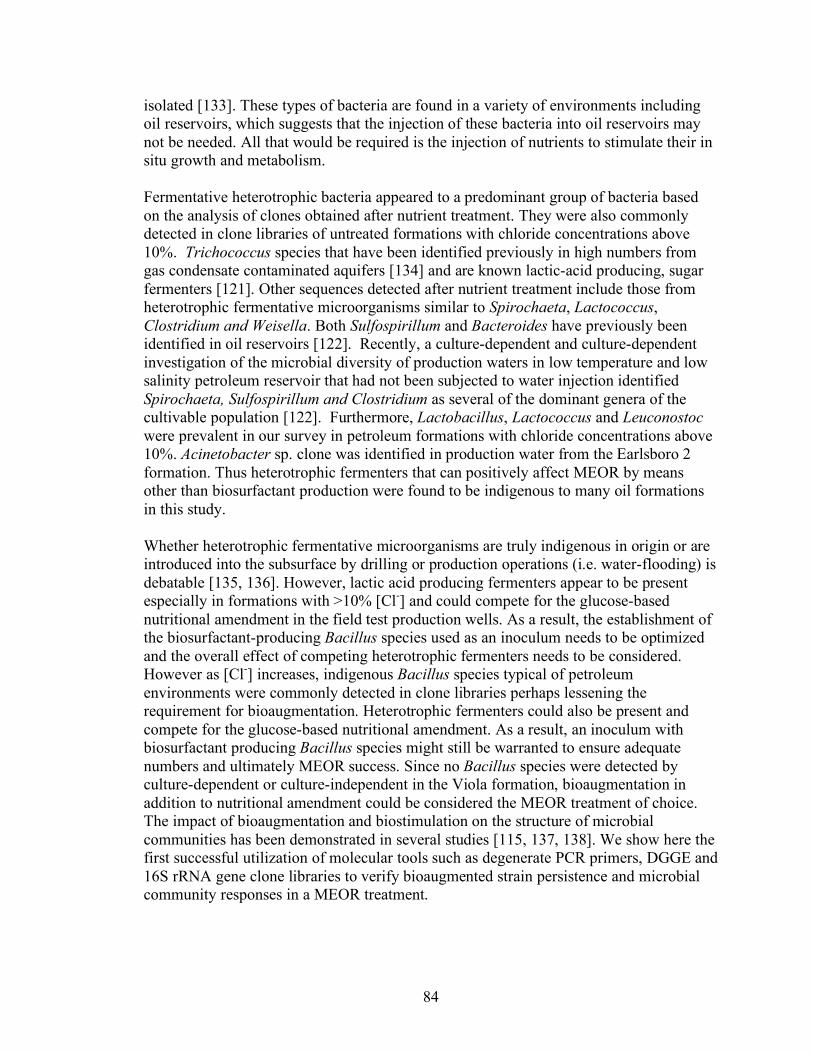
84
isolated [133]. These types of bacteria are found in a variety of environments including oil reservoirs, which suggests that the injection of these bacteria into oil reservoirs may not be needed. All that would be required is the injection of nutrients to stimulate their in situ growth and metabolism. Fermentative heterotrophic bacteria appeared to a predominant group of bacteria based on the analysis of clones obtained after nutrient treatment. They were also commonly detected in clone libraries of untreated formations with chloride concentrations above 10%. Trichococcus species that have been identified previously in high numbers from gas condensate contaminated aquifers [134] and are known lactic-acid producing, sugar fermenters [121]. Other sequences detected after nutrient treatment include those from heterotrophic fermentative microorganisms similar to Spirochaeta, Lactococcus, Clostridium and Weisella. Both Sulfospirillum and Bacteroides have previously been identified in oil reservoirs [122]. Recently, a culture-dependent and culture-dependent investigation of the microbial diversity of production waters in low temperature and low salinity petroleum reservoir that had not been subjected to water injection identified Spirochaeta, Sulfospirillum and Clostridium as several of the dominant genera of the cultivable population [122]. Furthermore, Lactobacillus, Lactococcus and Leuconostoc were prevalent in our survey in petroleum formations with chloride concentrations above 10%. Acinetobacter sp. clone was identified in production water from the Earlsboro 2 formation. Thus heterotrophic fermenters that can positively affect MEOR by means other than biosurfactant production were found to be indigenous to many oil formations in this study. Whether heterotrophic fermentative microorganisms are truly indigenous in origin or are introduced into the subsurface by drilling or production operations (i.e. water-flooding) is debatable [135, 136]. However, lactic acid producing fermenters appear to be present especially in formations with >10% [Cl-] and could compete for the glucose-based nutritional amendment in the field test production wells. As a result, the establishment of the biosurfactant-producing Bacillus species used as an inoculum needs to be optimized and the overall effect of competing heterotrophic fermenters needs to be considered. However as [Cl-] increases, indigenous Bacillus species typical of petroleum environments were commonly detected in clone libraries perhaps lessening the requirement for bioaugmentation. Heterotrophic fermenters could also be present and compete for the glucose-based nutritional amendment. As a result, an inoculum with biosurfactant producing Bacillus species might still be warranted to ensure adequate numbers and ultimately MEOR success. Since no Bacillus species were detected by culture-dependent or culture-independent in the Viola formation, bioaugmentation in addition to nutritional amendment could be considered the MEOR treatment of choice. The impact of bioaugmentation and biostimulation on the structure of microbial communities has been demonstrated in several studies [115, 137, 138]. We show here the first successful utilization of molecular tools such as degenerate PCR primers, DGGE and 16S rRNA gene clone libraries to verify bioaugmented strain persistence and microbial community responses in a MEOR treatment.
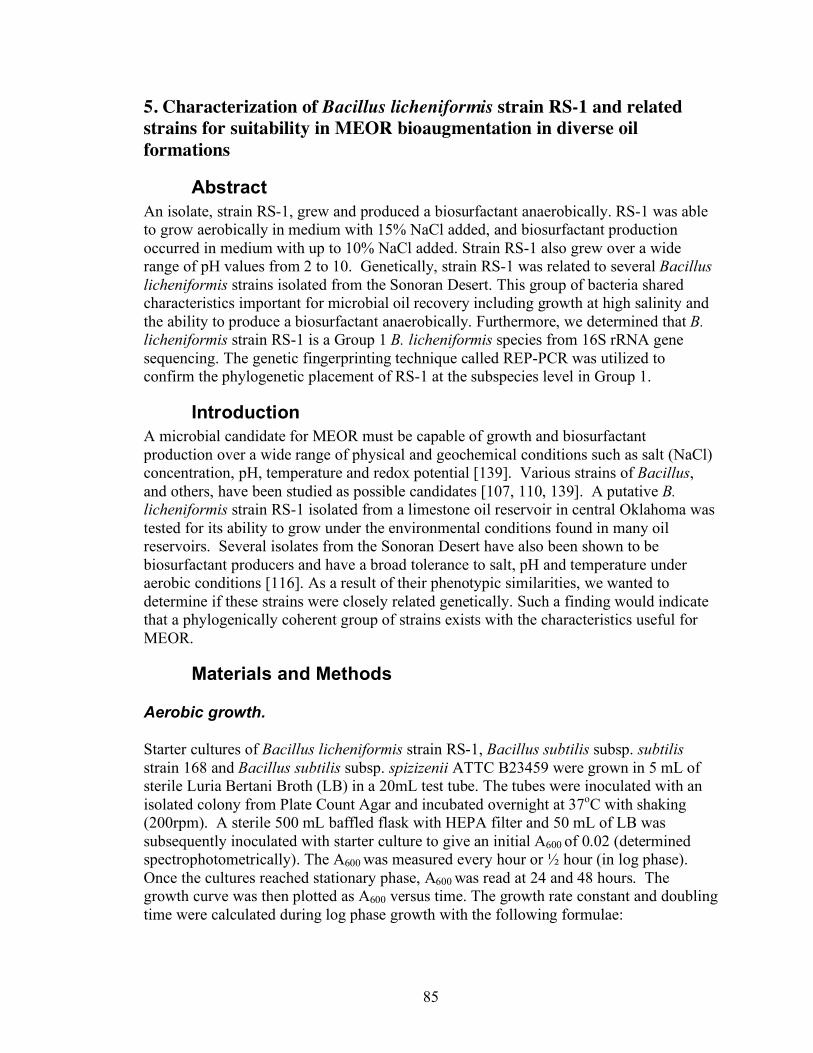
85
5. Characterization of Bacillus licheniformis strain RS-1 and related strains for suitability in MEOR bioaugmentation in diverse oil formations
Abstract An isolate, strain RS-1, grew and produced a biosurfactant anaerobically. RS-1 was able to grow aerobically in medium with 15% NaCl added, and biosurfactant production occurred in medium with up to 10% NaCl added. Strain RS-1 also grew over a wide range of pH values from 2 to 10. Genetically, strain RS-1 was related to several Bacillus licheniformis strains isolated from the Sonoran Desert. This group of bacteria shared characteristics important for microbial oil recovery including growth at high salinity and the ability to produce a biosurfactant anaerobically. Furthermore, we determined that B. licheniformis strain RS-1 is a Group 1 B. licheniformis species from 16S rRNA gene sequencing. The genetic fingerprinting technique called REP-PCR was utilized to confirm the phylogenetic placement of RS-1 at the subspecies level in Group 1.
Introduction A microbial candidate for MEOR must be capable of growth and biosurfactant production over a wide range of physical and geochemical conditions such as salt (NaCl) concentration, pH, temperature and redox potential [139]. Various strains of Bacillus, and others, have been studied as possible candidates [107, 110, 139]. A putative B. licheniformis strain RS-1 isolated from a limestone oil reservoir in central Oklahoma was tested for its ability to grow under the environmental conditions found in many oil reservoirs. Several isolates from the Sonoran Desert have also been shown to be biosurfactant producers and have a broad tolerance to salt, pH and temperature under aerobic conditions [116]. As a result of their phenotypic similarities, we wanted to determine if these strains were closely related genetically. Such a finding would indicate that a phylogenically coherent group of strains exists with the characteristics useful for MEOR.
Materials and Methods
Aerobic growth.
Starter cultures of Bacillus licheniformis strain RS-1, Bacillus subtilis subsp. subtilis strain 168 and Bacillus subtilis subsp. spizizenii ATTC B23459 were grown in 5 mL of sterile Luria Bertani Broth (LB) in a 20mL test tube. The tubes were inoculated with an isolated colony from Plate Count Agar and incubated overnight at 37oC with shaking (200rpm). A sterile 500 mL baffled flask with HEPA filter and 50 mL of LB was subsequently inoculated with starter culture to give an initial A600 of 0.02 (determined spectrophotometrically). The A600 was measured every hour or ½ hour (in log phase). Once the cultures reached stationary phase, A600 was read at 24 and 48 hours. The growth curve was then plotted as A600 versus time. The growth rate constant and doubling time were calculated during log phase growth with the following formulae:

86
Instantaneous growth rate constant: µ = ln(Xt) – ln(Xo) / (t - to) and average growth rate constant: k = µ/ln2 .
Phenotypic tests.
B. licheniformis strain RS-1, Bacillus licheniformis ATCC 14580, Bacillus sonorensis NRRL B23154, Bacillus mojavensis NRRL B 14698, B. subtilis subsp. subtilis strain 168, and B. subtilis subsp. spizizenii B23049, were tested for protease activity by streaking on skim milk plates (1% skim milk, 0.1% yeast extract, and 1.5% agar) [140]. The plates were incubated for 48 hours at 37ºC then measured for clearing diameter. The above strains were also tested for nitrate reduction by inoculating 4 mL of nitrate broth in duplicate, and incubating for 24 hours at 37ºC. The cultures were treated with NO3 Reagent A (0.6 g N, N-Dimethyl-α-naphthylamine in 100mL of 5N Acetic Acid) and NO3 Reagent B (0.8 g Sulfanilic acid in 100 mL 5N Acetic Acid).
Aerobic NaCl tolerance and the effects on biosurfactant production.
The strains tested for their aerobic NaCl tolerance were: B. licheniformis strain RS-1, B. licheniformis ATCC 14580, B. sonorensis NRRL B23154, B. mojavensis NRRL B 14698, B. subtilis subsp. subtilis strain 168, and B. subtilis subsp. spizizenii B23049. LB was again utilized as the base medium and NaCl concentration was varied. The positive and negative culture controls were LB with no NaCl at pH 7. For this experiment, 20 mL test tubes containing 4 mL of LB covering the NaCl range of 0%, 1%, 2%, 5%, 8%, 10%, and 15% were inoculated with a loopful of overnight culture in LB without NaCl addition. The cultures were incubated at 37ºC with shaking (200 rpm). The growth was qualified for five days by visual inspection using by a combination of turbidity and pellicle size. The surfactant production was checked every day with the oil spread assay according to Youssef et al. [139].
Anaerobic NaCl tolerance and the effects on biosurfactant production.
The strains tested for anaerobic NaCl tolerance were: B. licheniformis strain RS-1, TG2-32, T89-11, RL-1 and TE-48. Medium E was utilized as the base medium and the NaCl concentration was varied. The positive and negative culture controls were Medium E with no NaCl addition at pH 7. Balch tubes containing 10 mL of anaerobically prepared medium E covering the NaCl range of 0%, 1%, 2%, 5%, 8%, 10%, 15% and 18% were inoculated with an overnight Medium E culture to an A600 of 0.05. The cultures were incubated at 37ºC and static conditions. The growth was qualified for five days by a spectrophotometer at A600. The surfactant production was checked each day with the oil spread assay according to Youssef et al. [139].
Aerobic pH Tolerance of B. licheniformis-B. subtilis clade strains.
The strains tested for pH tolerance were: B. licheniformis strain RS-1, B. licheniformis ATCC 14580, B. sonorensis NRRL B23154, B. mojavensis NRRL B 14698, B. subtilis subsp. subtilis strain 168, and B. subtilis subsp. spizizenii NRRL B23049. The pH of

87
nutrient Broth (NB) was adjusted with HCl or NaOH to give a pH range of 2, 4, 6, 8, and 10. In duplicate, 4 mL of the pH media was inoculated with a loopful of overnight culture of each strain grown in NB (pH 7). The 20 mL tubes were allowed to incubate aerobically for 72 hours at 37ºC under static conditions. Growth was determined qualitatively by relative estimation of turbidity and pellicle formation.
Genotypic and genetic fingerprinting analysis of B. licheniformis strain RS-1 and Sonoran Desert isolates.
Phenol/chloroform extraction from a 50 mL overnight cell cultures of B. licheniformis strain RS-1, TG2-32, T89-11, RL-1, TE-48 grown in LB as previously described at 37oC/200 rpm were used to obtain DNA template. PCR amplification of each strain was performed by using srfA3/licA3, gyrA and 16S rRNA gene primer sets (Table 5.1). PCR mix and reaction conditions were the same as previously described (Section 4) with approximately 500ng of DNA used as template in each reaction. The products were excised and extracted (Qiagen) from a 1.0 to 1.5% agarose gel, pGEM cloned (Promega) then plasmid amplified and purified (Qiagen). Clones were sequenced in both the T7 and SP6 directions by OMRF and assembled as well as compared in a multiple sequence alignment using DNAMAN to obtain a 3 clone consensus sequence for each gene per strain. Finally, all strains and genes were compared in phylogenetic trees constructed using DNAMAN and the Observed Divergency Distance Method with 1000 bootstrap trials.

88
Table 5.1 PCR primer sequences utilized for detection and identification of microorganisms.
DNA template from each of the 5 strains as well as from type strains B. licheniformis ATCC 14580 and B. sonorensis NRRL B-23154 were also amplified in a REP-PCR reaction to obtain a genetic fingerprint comparison of the species. The reaction mix consisted of 5 µL of 10X PCR buffer, 5 µL of 5 mM betaine, 4 µL of 50 mM magnesium chloride, 1 µL of 10 mM dNTP mix, 4 µL of 50 pmol/µL of BOXA1R primer, 3 µL or approximately 500 ng of cell template, 0.25 µL of Platinum Taq polymerase (Invitrogen) and 29.75 µL of sterile deionized water forming a 50 µL reaction volume. The thermal cycler was programmed for 5 min at 95oC for initial denaturation, 30 cycles of 1 min at 94oC for denaturation, 1 min at 50oC for annealing, 2 min at 72oC for extension subsequently followed by a final extension at 72oC for 8 min and a 4oC quench.
Results
Aerobic growth curve of B. licheniformis RS-1 in Luria Bertani Broth.
From log phase growth, B. licheniformis strain RS-1 resulted in an aerobic, instantaneous growth rate constant (µ) of 0.551 hr-1 in LB (Figure 5-1). This was comparable to B. subtilis subsp. subtilis strain 168 at µ = 0.525 hr-1 but less than B. subtilis subsp. spizizenii ATCC B23459 with µ = 0.196 hr-1. However we can conclude
Primer Sequence Reference 27F 5'-AGAGTTTGATCMTGG-3' 1492R 5'-TACCTTGTTACGACTT-
3' GM5F 5'GCCCGCCGCGCCCGCGCCCGTCCCGCCGCCCC
C GCCCGCCTACGGGAGGCAGCAG-3' 907R 5'-CCGTCAATTCCTTTRAGTTT-3'
srfA3/licA3 F 5'-CAAAAKCGCAKCATACCAAKTTGAG-3' srfA3/licA3 R 5'-TCATARAGCGGCAYATATTGATGC-3' srfA3/licA3 R2 5'-AGCGGCAYATATTGATGCGGYTC-
3' gyrA F 5'-CAGTCAGGAAATGCGTACGTCCTT-3' gyrA R 5'-CAAGGTAATGCTCCAGGCATTGCT-3'
rhlR F 5'-CTGCGCTCCWCGGAAATGGTG-3' rhlR R 5'-TCTGGATGWYCTTGWGGTGGAAGTTC-3'
BOXA1R 5'-CTACGGCAAGGCGACGCTGACG-3'
[6, 7]
[4, 5]
[3]
[2]
[8-11]
[1]
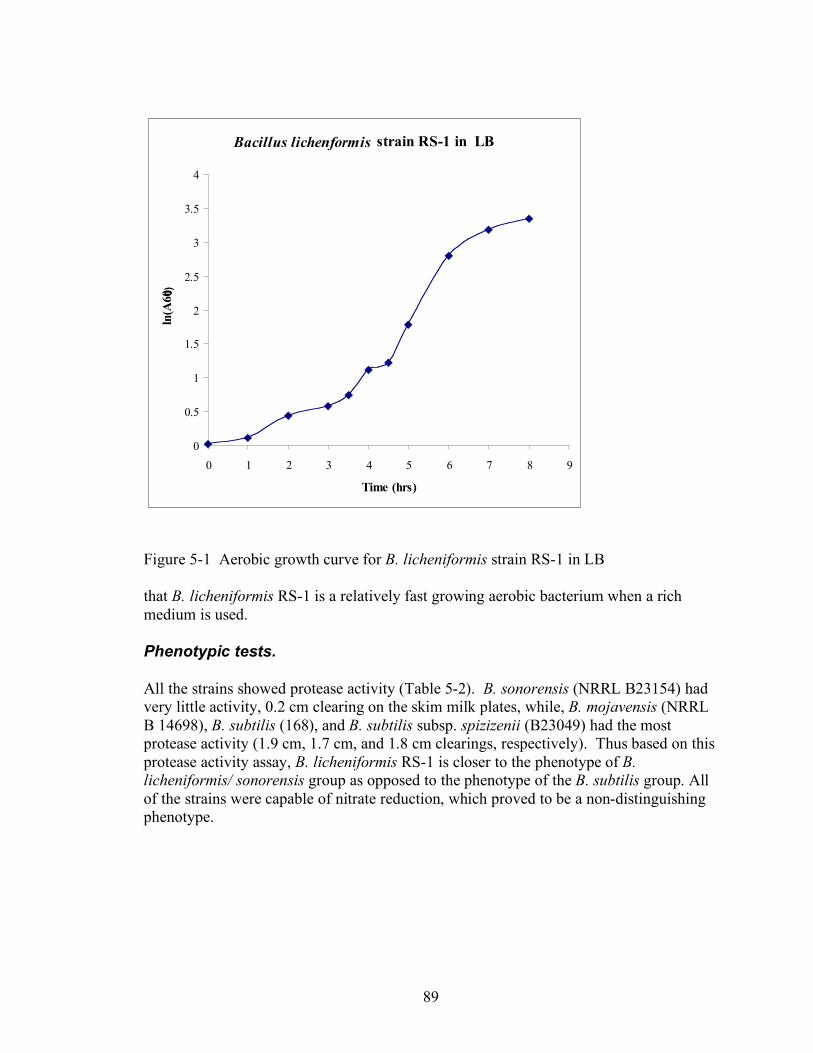
89
Figure 5-1 Aerobic growth curve for B. licheniformis strain RS-1 in LB that B. licheniformis RS-1 is a relatively fast growing aerobic bacterium when a rich medium is used.
Phenotypic tests.
All the strains showed protease activity (Table 5-2). B. sonorensis (NRRL B23154) had very little activity, 0.2 cm clearing on the skim milk plates, while, B. mojavensis (NRRL B 14698), B. subtilis (168), and B. subtilis subsp. spizizenii (B23049) had the most protease activity (1.9 cm, 1.7 cm, and 1.8 cm clearings, respectively). Thus based on this protease activity assay, B. licheniformis RS-1 is closer to the phenotype of B. licheniformis/ sonorensis group as opposed to the phenotype of the B. subtilis group. All of the strains were capable of nitrate reduction, which proved to be a non-distinguishing phenotype.
Bacillus lichenformis strain RS-1 in LB
0
0.5
1
1.5
2
2.5
3
3.5
4
0 1 2 3 4 5 6 7 8 9
Time (hrs)
ln(A
60 0)
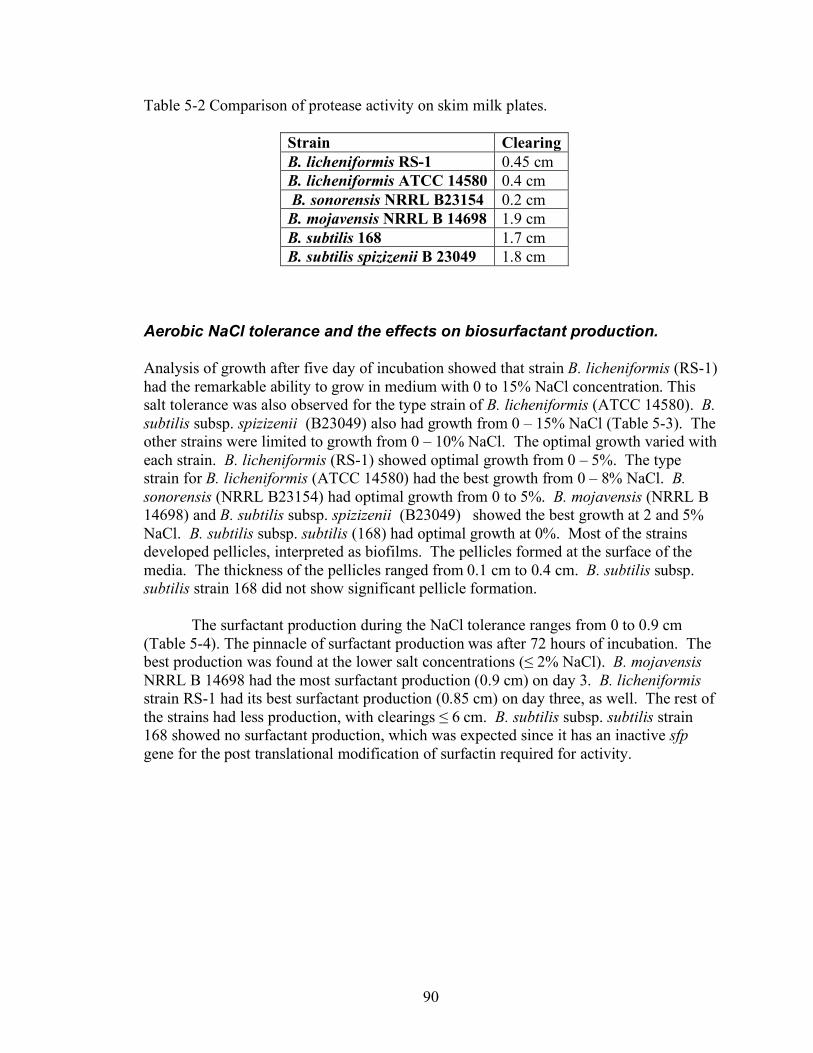
90
Table 5-2 Comparison of protease activity on skim milk plates.
Strain Clearing B. licheniformis RS-1 0.45 cm B. licheniformis ATCC 14580 0.4 cm B. sonorensis NRRL B23154 0.2 cm B. mojavensis NRRL B 14698 1.9 cm B. subtilis 168 1.7 cm B. subtilis spizizenii B 23049 1.8 cm
Aerobic NaCl tolerance and the effects on biosurfactant production.
Analysis of growth after five day of incubation showed that strain B. licheniformis (RS-1) had the remarkable ability to grow in medium with 0 to 15% NaCl concentration. This salt tolerance was also observed for the type strain of B. licheniformis (ATCC 14580). B. subtilis subsp. spizizenii (B23049) also had growth from 0 – 15% NaCl (Table 5-3). The other strains were limited to growth from 0 – 10% NaCl. The optimal growth varied with each strain. B. licheniformis (RS-1) showed optimal growth from 0 – 5%. The type strain for B. licheniformis (ATCC 14580) had the best growth from 0 – 8% NaCl. B. sonorensis (NRRL B23154) had optimal growth from 0 to 5%. B. mojavensis (NRRL B 14698) and B. subtilis subsp. spizizenii (B23049) showed the best growth at 2 and 5% NaCl. B. subtilis subsp. subtilis (168) had optimal growth at 0%. Most of the strains developed pellicles, interpreted as biofilms. The pellicles formed at the surface of the media. The thickness of the pellicles ranged from 0.1 cm to 0.4 cm. B. subtilis subsp. subtilis strain 168 did not show significant pellicle formation. The surfactant production during the NaCl tolerance ranges from 0 to 0.9 cm (Table 5-4). The pinnacle of surfactant production was after 72 hours of incubation. The best production was found at the lower salt concentrations (≤ 2% NaCl). B. mojavensis NRRL B 14698 had the most surfactant production (0.9 cm) on day 3. B. licheniformis strain RS-1 had its best surfactant production (0.85 cm) on day three, as well. The rest of the strains had less production, with clearings ≤ 6 cm. B. subtilis subsp. subtilis strain 168 showed no surfactant production, which was expected since it has an inactive sfp gene for the post translational modification of surfactin required for activity.
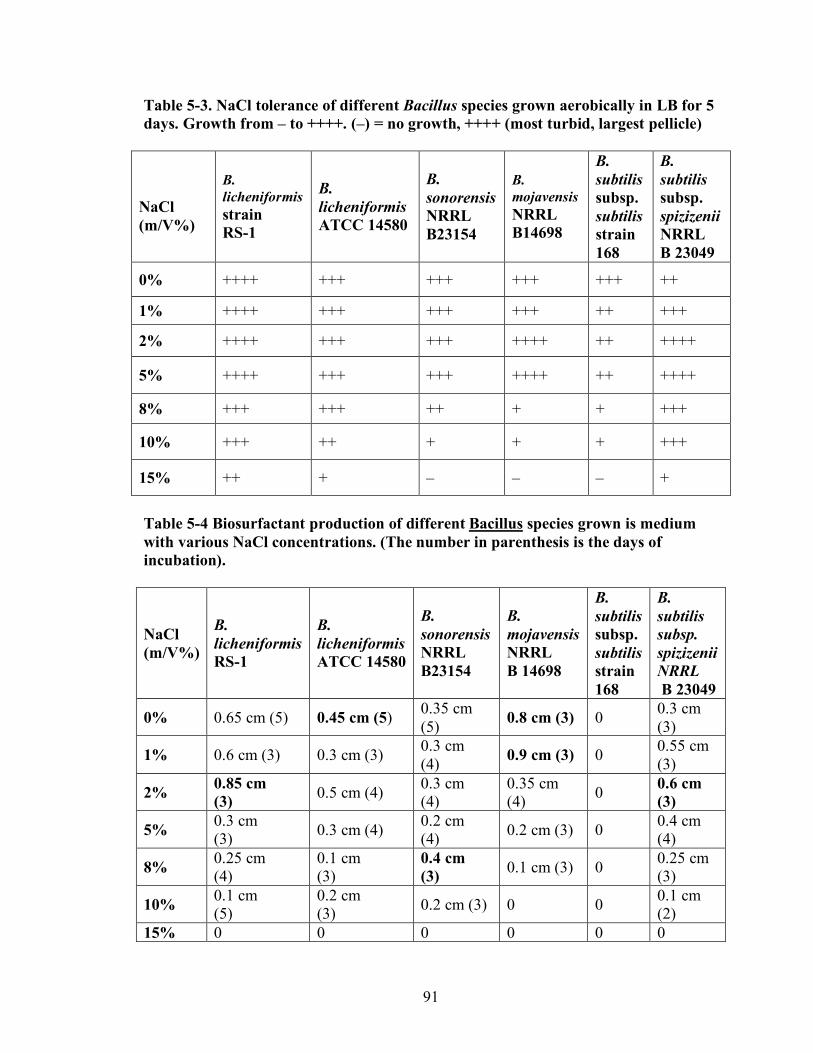
91
Table 5-3. NaCl tolerance of different Bacillus species grown aerobically in LB for 5 days. Growth from – to ++++. (–) = no growth, ++++ (most turbid, largest pellicle)
NaCl (m/V%)
B. licheniformis strain RS-1
B. licheniformis ATCC 14580
B. sonorensis NRRL B23154
B. mojavensis NRRL B14698
B. subtilis subsp. subtilis strain 168
B. subtilis subsp. spizizenii NRRL B 23049
0% ++++ +++ +++ +++ +++ ++
1% ++++ +++ +++ +++ ++ +++
2% ++++ +++ +++ ++++ ++ ++++
5% ++++ +++ +++ ++++ ++ ++++
8% +++ +++ ++ + + +++
10% +++ ++ + + + +++
15% ++ + – – – +
Table 5-4 Biosurfactant production of different Bacillus species grown is medium with various NaCl concentrations. (The number in parenthesis is the days of incubation).
NaCl (m/V%)
B. licheniformis RS-1
B. licheniformis ATCC 14580
B. sonorensis NRRL B23154
B. mojavensis NRRL B 14698
B. subtilis subsp. subtilis strain 168
B. subtilis subsp. spizizenii NRRL B 23049
0% 0.65 cm (5) 0.45 cm (5) 0.35 cm (5) 0.8 cm (3) 0 0.3 cm
(3)
1% 0.6 cm (3) 0.3 cm (3) 0.3 cm (4) 0.9 cm (3) 0 0.55 cm
(3)
2% 0.85 cm (3) 0.5 cm (4) 0.3 cm
(4) 0.35 cm (4) 0 0.6 cm
(3)
5% 0.3 cm (3) 0.3 cm (4) 0.2 cm
(4) 0.2 cm (3) 0 0.4 cm (4)
8% 0.25 cm (4)
0.1 cm (3)
0.4 cm (3) 0.1 cm (3) 0 0.25 cm
(3)
10% 0.1 cm (5)
0.2 cm (3) 0.2 cm (3) 0 0 0.1 cm
(2) 15% 0 0 0 0 0 0

92
Anaerobic NaCl tolerance and the effects on biosurfactant production.
Strains T89-11 and TG2-32 along with B. licheniformis strain RS-1 grew in medium with 5% NaCl and without NaCl added (Figure 5-2). The maximum A600 ranged from 0.5 to 0.6 whether NaCl was added or not, except for strain RS-1, which did not grow as well in medium without NaCl added (Figure 5-2). The group 2 strain, RL-1, grew to a maximum A600 of 0.5 in medium without NaCl added, but only reached an A600 0.3 in medium with 5% NaCl added.
Anaerobic Medium E with O% NaCl
0
0.1
0.2
0.3
0.4
0.5
0.6
0.7
0.8
0 1 2 3 4 5 6
Days
A600
RS-1 TG2-32 T89-11 RL-1 TE-48
Anaerobic Medium E with 5% NaCl
0
0.1
0.2
0.3
0.4
0.5
0.6
0.7
0 1 2 3 4 5 6
Days
A60
0
RS-1 TG2-32 T89-11 RL-1 TE-48
Figure 5-2 Anaerobic growth of Sonoran Desert strains and RS-1 in Medium E with 0% and 5% NaCl added.

93
Anaerobic Medium E with 0% NaCl
0
0.05
0.1
0.15
0.2
0.25
0.3
0.35
0.4
0.45
0 1 2 3 4 5 6
Days
Oil
Sp
read
Dia
met
er (
cm)l
RS-1 TG2-32 T89-11 RL-1 TE-48
Anaerobic Medium E with 5% NaCl
0
0.05
0.1
0.15
0.2
0.25
0 1 2 3 4 5 6
Days
Oil
Sp
read
Dia
met
er (
cm)l
RS-1 TG2-32 T89-11 RL-1 TE-48
Figure 5-3 Anaerobic biosurfactant production of Sonoran Desert strains and RS-1 in Medium E with 5% NaCl Strains RS-1, RL-1, TG2-32, and T89-11 each had biosurfactant activity when grown anaerobically in medium E with or without the addition of 5% NaCl (Figure 5-3). Strain TE-48 did not produce a biosurfactant in either medium. The Group 2 strain RL-1 and oil spread diameters of 0.2 in medium with and without the addition of 5% NaCl. The Group 1 strains TG2-32 and T89-11 had larger oil spread diameters at 0% NaCl compared to 5% NaCl. RS-1 had the largest oil spread diameter at 0% and 5% NaCl. Biosurfactant activity appeared to peak after about 3 to 4 days of incubation for both RS-1 and RL-1.
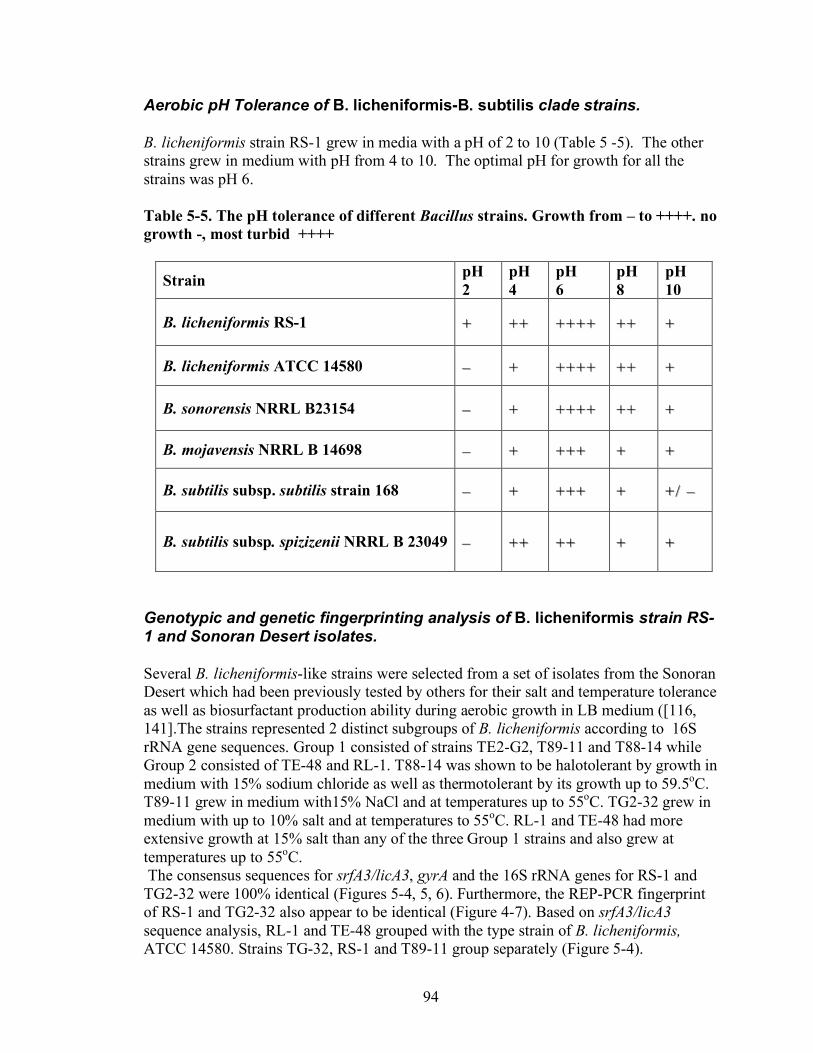
94
Aerobic pH Tolerance of B. licheniformis-B. subtilis clade strains.
B. licheniformis strain RS-1 grew in media with a pH of 2 to 10 (Table 5 -5). The other strains grew in medium with pH from 4 to 10. The optimal pH for growth for all the strains was pH 6. Table 5-5. The pH tolerance of different Bacillus strains. Growth from – to ++++. no growth -, most turbid ++++
Strain pH 2
pH 4
pH 6
pH 8
pH 10
B. licheniformis RS-1 ++ ++++ ++++++++ ++++ ++
B. licheniformis ATCC 14580 –– ++ ++++++++ ++++ ++
B. sonorensis NRRL B23154 –– ++ ++++++++ ++++ ++
B. mojavensis NRRL B 14698 –– ++ ++++++ ++ ++
B. subtilis subsp. subtilis strain 168 –– ++ ++++++ ++ +/ +/ ––
B. subtilis subsp. spizizenii NRRL B 23049 –– ++++ ++++ ++ ++
Genotypic and genetic fingerprinting analysis of B. licheniformis strain RS-1 and Sonoran Desert isolates.
Several B. licheniformis-like strains were selected from a set of isolates from the Sonoran Desert which had been previously tested by others for their salt and temperature tolerance as well as biosurfactant production ability during aerobic growth in LB medium ([116, 141].The strains represented 2 distinct subgroups of B. licheniformis according to 16S rRNA gene sequences. Group 1 consisted of strains TE2-G2, T89-11 and T88-14 while Group 2 consisted of TE-48 and RL-1. T88-14 was shown to be halotolerant by growth in medium with 15% sodium chloride as well as thermotolerant by its growth up to 59.5oC. T89-11 grew in medium with15% NaCl and at temperatures up to 55oC. TG2-32 grew in medium with up to 10% salt and at temperatures to 55oC. RL-1 and TE-48 had more extensive growth at 15% salt than any of the three Group 1 strains and also grew at temperatures up to 55oC. The consensus sequences for srfA3/licA3, gyrA and the 16S rRNA genes for RS-1 and TG2-32 were 100% identical (Figures 5-4, 5, 6). Furthermore, the REP-PCR fingerprint of RS-1 and TG2-32 also appear to be identical (Figure 4-7). Based on srfA3/licA3 sequence analysis, RL-1 and TE-48 grouped with the type strain of B. licheniformis, ATCC 14580. Strains TG-32, RS-1 and T89-11 group separately (Figure 5-4).
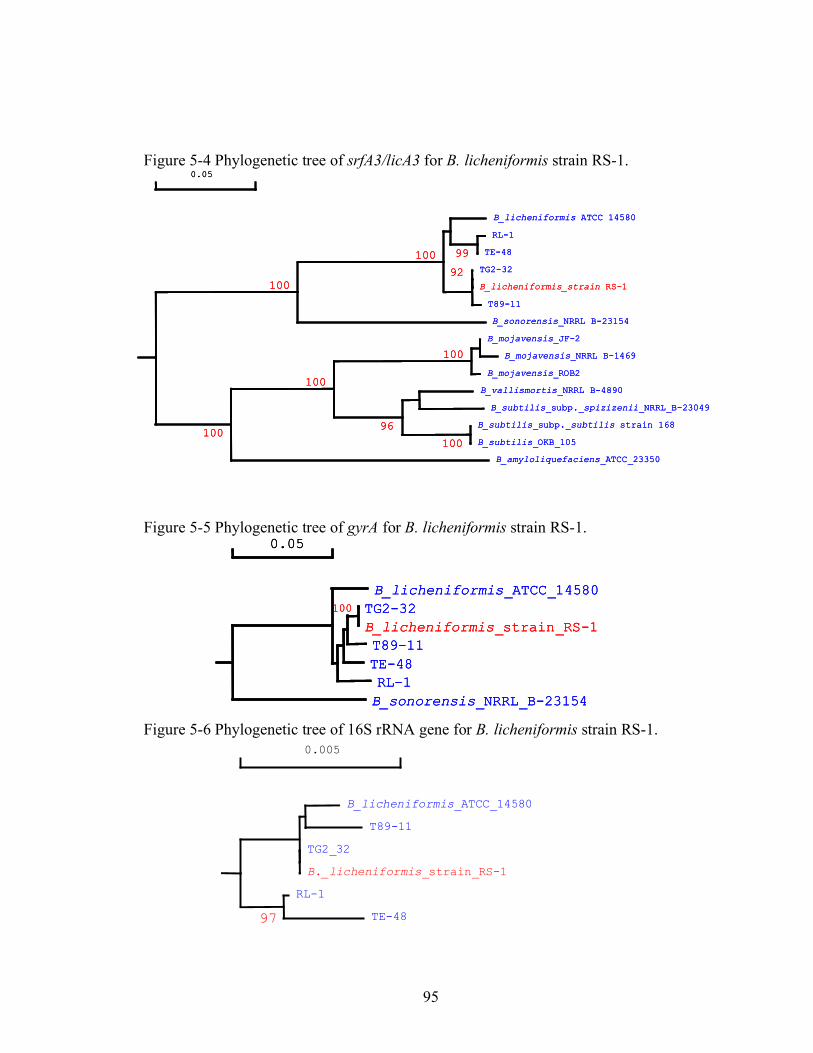
95
Figure 5-4 Phylogenetic tree of srfA3/licA3 for B. licheniformis strain RS-1. Figure 5-5 Phylogenetic tree of gyrA for B. licheniformis strain RS-1. Figure 5-6 Phylogenetic tree of 16S rRNA gene for B. licheniformis strain RS-1.
B_licheniformis ATCC 14580
RL-1
TE-4899
TG2-32
B_licheniformis_strain RS-1
92
T89-11
100
B_sonorensis_NRRL B-23154
100
B_mojavensis_JF-2
B_mojavensis_NRRL B-1469
B_mojavensis_ROB2
100
B_vallismortis_NRRL B-4890
B_subtilis_subp._spizizenii_NRRL_B-23049
B_subtilis_subp._subtilis strain 168
B_subtilis_OKB_105100
96
100
B_amyloliquefaciens_ATCC_23350
100
0.05
B_licheniformis_ATCC_14580
TG2-32
B_licheniformis_strain_RS-1
100
T89-11
TE-48
RL-1
B_sonorensis_NRRL_B-23154
0.05
B_licheniformis_ATCC_14580
TG2-32
B_licheniformis_strain_RS-1
100
T89-11
TE-48
RL-1
B_sonorensis_NRRL_B-23154
0.05
B_licheniformis_ATCC_14580
TG2-32
B_licheniformis_strain_RS-1
100
T89-11
TE-48
RL-1
B_sonorensis_NRRL_B-23154
0.05
B_licheniformis_ATCC_14580
T89-11
TG2_32
B._licheniformis_strain_RS-1
RL-1
TE-4897
0.005
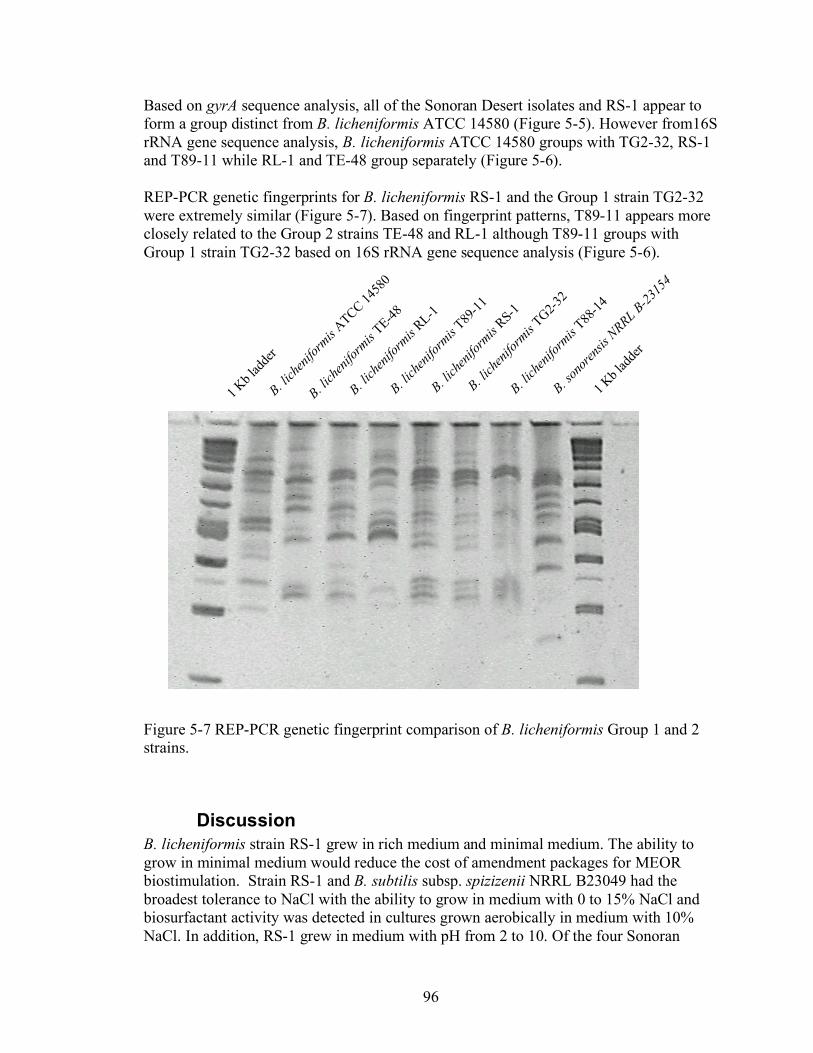
96
Based on gyrA sequence analysis, all of the Sonoran Desert isolates and RS-1 appear to form a group distinct from B. licheniformis ATCC 14580 (Figure 5-5). However from16S rRNA gene sequence analysis, B. licheniformis ATCC 14580 groups with TG2-32, RS-1 and T89-11 while RL-1 and TE-48 group separately (Figure 5-6). REP-PCR genetic fingerprints for B. licheniformis RS-1 and the Group 1 strain TG2-32 were extremely similar (Figure 5-7). Based on fingerprint patterns, T89-11 appears more closely related to the Group 2 strains TE-48 and RL-1 although T89-11 groups with Group 1 strain TG2-32 based on 16S rRNA gene sequence analysis (Figure 5-6). Figure 5-7 REP-PCR genetic fingerprint comparison of B. licheniformis Group 1 and 2 strains.
Discussion B. licheniformis strain RS-1 grew in rich medium and minimal medium. The ability to grow in minimal medium would reduce the cost of amendment packages for MEOR biostimulation. Strain RS-1 and B. subtilis subsp. spizizenii NRRL B23049 had the broadest tolerance to NaCl with the ability to grow in medium with 0 to 15% NaCl and biosurfactant activity was detected in cultures grown aerobically in medium with 10% NaCl. In addition, RS-1 grew in medium with pH from 2 to 10. Of the four Sonoran
B. lic
heni
form
isA
TCC 1
4580
B. lic
heni
form
isTE-4
8
B. lic
heni
form
isRL-1
B. lic
heni
form
isT89-
11
B. lic
heni
form
isRS-1
B. lic
heni
form
isTG
2-32
B. lic
heni
form
isT88-
14
B. son
oren
sisNRRL B
-231
54
1 K
b la
dder
1 K
b la
dder
97
Desert isolates tested, three were able to produce a biosurfactant anaerobically. Protease activity of RS-1 is consistent with its placement in the B. licheniformis/sonorensis clade. Genotypically, B. licheniformis strain RS-1 is very similar to strain TG2-32 based on 100% homology in srfA3/licA3, gyrA and 16S rRNA gene sequences as well as closely matching REP-PCR genetic fingerprints. Thus, phenotypic and genotypic results to date place RS-1 as a member of Group 1 B. licheniformis species. Other strains of B. licheniformis have also been found to be capable of growth at high salinities [110, 116]. B. licheniformis RS-1 appears to be the most robust member of a generally salt tolerant group, which includes a several halotolerant, Sonoran Desert isolates, all of which produce biosurfactants both aerobically and anaerobically. This clade of microorganisms has characteristics that are useful for MEOR and could be used as an inoculum in reservoirs with differing salinities.

98
6. Microbial Stimulation Treatment of High Water-Cut Wells in the Viola Formation, Pontotoc County, OK
Abstract Microbial stimulation of water-flooded reservoirs in the tertiary stage of oil recovery could be an economical technology to recover substantial quantities of entrapped oil. However, beneficial microbial metabolic activity in-situ has often not been rigorously correlated with the persistence and activity of injected bacterial species and oil recovery. We injected a glucose-nitrate-mineral nutrient mixture and two Bacillus strains into two wells to correlate in-situ metabolism and growth with oil recovery. Two wells producing from the same Viola formation were each inoculated with 500 bbl of tank battery brine mixed with nutrients (glucose, sodium nitrate and trace metals) as well as Bacillus licheniformis RS-1 and Bacillus subtilis subsp. subtilis spizizenii NRRL B-23049. Analysis of production water from the “huff and puff” treatment indicated in-situ metabolism of the nutrients, growth of the injected strains and other heterotrophic fermenting bacteria, and production of bacterial products including biosurfactant, carbon dioxide, acetate, lactate, succinate, ethanol and 2, 3-butanediol, many of which are potentially useful in enhancing oil recovery. A lipopeptide biosurfactant concentration of at least 11 mg/L is required to mobilize entrapped oil from sandstone cores. Both wells had a peak lipopeptide biosurfactant concentration of 20 and 28 mg/L respectively and an average carbon balance of glucose used and metabolic products and cells made of 91%. The increase in biosurfactant, acids, alcohols and carbon dioxide during the first 5 days after commencement of production corresponded directly with increasing oil recovery. Furthermore, wellhead measurements of total produced water, the water/oil ratio (WOR) and the percent oil cut as well as separation tank battery production data indicated that a corresponding net increase of 183 bbl in oil recovery occurred in during the first 100 days of sampling. Economic analysis at $60/bbl oil using the results obtained thus far showed a 55-day return on the $6000 investment, a $4980 net profit, and an average recovery cost of $33/bbl.
Introduction When an oil reservoir reaches economic maturity during tertiary treatment by water-flooding, approximately 30% to 50% of the original oil present remains entrapped by capillary forces in the porous matrix of the formation [142-144]. In microbial stimulation processes, a well near its economic limit, is injected with beneficial bacterial culture in aqueous solution mixed with fermentable carbohydrate such as glucose or molasses [145]. In a field study of 24 microbially stimulated wells, Petrogen, Inc. determined that 75% showed an increase in oil production over a 3 to 6 month period [145]. Such microbially enhanced oil recovery (MEOR) processes employ the use of microbial metabolites such as biosurfactants, gases, acids and solvents to improve oil recovery by such mechanisms as interfacial tension reduction, reservoir pressurization, increase in porosity, viscosity reduction and wettability alteration [145-148]. Some Bacillus species can use glucose under nitrate-reducing conditions and produce acids such as acetate and
99
lactate, alcohols (solvents) such as ethanol and 2, 3-butanediol and carbon dioxide [145, 149]. A few Bacillus species are also able to produce detergent-like molecules called lipopeptide biosurfactants. Lipopeptide biosurfactants can create the reduction in interfacial tension between the hydrocarbon and aqueous phases required for mobilization of the entrapped oil [150, 151]. In the summer of 2005, a series of 50-bbl injections of brine mixed with nutrient (glucose, nitrate and trace metals) and two bacteria, Bacillus licheniformis RS-1 and Bacillus subtilis subsp. subtilis spizizenii NRRL B-23049, were conducted in a “huff and puff” style on wells producing from the same Viola formation in Pontotoc County, OK. From this field experiment, we were able to show that the injected Bacillus species were metabolically activity after a five day incubation period and produced the expected products lipopeptide biosurfactant, acetate, lactate, ethanol and 2, 3- butanediol. Furthermore, injected strains persisted and were recoverable from the formation. The produced fluids from the wells that received the two bacterial strains had an average lipopeptide concentration of approximately 90 mg/L, which is about 9 fold above the minimum concentration needed to mobilize entrapped oil from sandstone cores [152, 153]. Neither the biosurfactant nor the Bacillus strains were recovered from any of the other control wells that received only nutrients or only tank battery brine. The data established the technical feasibility of MEOR using our Bacillus isolates and the nutritional amendment package. As a result, in November 2007, we scaled-up the “huff and puff” treatments on the same wells to 500-bbl inoculums of brine mixed with the same nutrients and Bacillus species in order to determine whether the microbial process improved oil recovery.
Methodology Baseline analysis Robertson 13 and Robertson 15 wells, which produce from the same Viola formation in Pontotoc County, OK, were used in this study. Baseline data for Robertson 13 and Robertson 15 wells were obtained prior to the microbial treatment. Average daily WOR and percent oil cut values were determined periodically by collecting wellhead fluid samples with a graduated flask over a six-week period prior to stimulation. A flow fluid production was measured with flow totalizers installed at each wellhead pump. The average daily oil recovery from the Robertson tank battery over the 3 months prior to stimulation was obtained from office records. Baseline chemical analyses of production fluids taken just prior to treatment showed the absence of the lipopeptide biosurfactant, acetate, lactate, succinate, formate, ethanol or 2, 3-butanediol. Three-series most probable number (MPN) analyses were used to determine a background numbers of heterotrophic bacteria. Spore forming bacteria or biosurfactant-producing bacteria of which Bacilli would be included were not detected. Finally, an oil spread assay was also performed and established that surface active compounds such as biosurfactants were not present in the production water from each well [154, 155].
100
Preparation of inoculum A total of seven, 10-liter carboys of B. licheniformis RS-1 and six, 10-liter carboys of B. subtilis subsp. spizizenii strain NRRL B-23049 were grown in Medium E [154, 155] at 37oC for 48 hours with dispersion tubes for agitation and aeration. After concentration of the cultures by tangential flow filtration, the cells were stored at 4oC in sterile, 2-liter bottles. Microbial stimulation field experiment A 500-bbl frac tank was placed adjacent to each of the two wellheads (Robertson 15 and Robertson 13) and filled with 50 bbl of tank battery brine free of oil by using a pump truck. Each frac tank was equipped with a 5-hp gasoline powered pump for recirculation of its contents. With the recirculation pump running, 79.5 kg of glucose, 7.9 kg of sodium nitrate, 19.9 g of magnesium sulfate, 2 g of manganese sulfate, 2 g of zinc sulfate, 2 g of iron sulfate, 0.2 g of copper sulfate, 0.2 g of aluminum potassium sulfate, 0.2 g of boric acid, 0.2 g of sodium molybdate, 0.1 g of sodium selenate and 0.6 g of nickel chloride were added to each frac tank [155]. Next, each frac tank received 3.5 liters of concentrated B. licheniformis RS-1 and 3 liters of B. subtilis subsp. spizizenii strain NRRL B-23049 as inoculum (total number of cells was 0.3 x 10¹³). The frac tank contents were mixed twice per day for 5 days by using the recirculation pumps. The average outdoor ambient temperature was approximately 10oC. After 5 days the inoculum was ready for injection to about 500 bbl by addition of 100-bbl increments of tank battery brine free of oil. During this time, 715.5 kg of glucose, 71.1 kg of sodium nitrate, 179.1 g of magnesium sulfate, 18 g of manganese sulfate, 18 g of zinc sulfate, 18 g of iron sulfate, 1.8 g of copper sulfate, 1.8 g of aluminum potassium sulfate, 1.8 g of boric acid, 1.8 g of sodium molybdate, 0.9 g of sodium selenate, 5.4 g of nickel chloride and 1.25 kg of sodium fluorescein were added to each frac tank and mixed by recirculation pump. The Robertson 15 production pump was stopped, and the 500-bbl inoculum with nutrients was injected into the wellhead by using the gasoline recirculation pump. Due to the lower permeability, injection into the Robertson 13 well required the use of the pump truck. The inoculum was then allowed to incubate in-situ for 4.5 days. Down-hole temperature was estimated to be 23oC. Both wellhead pumps were re-started on the morning of the fifth day after injection. Approximately 6 hours after production was resumed, the first daily sampling and field measurement session occurred and was repeated at approximately the same time for the next 6 days. The protocol consisted of the following for each well: 1) Record flowmeter totalizer data 2) Measure production water temperature with a thermometer 3) Measure the WOR with a graduated flask 4) Take three, 1-liter samples of production water in sterile bags for chemical and microbial analyses which were transported to laboratory on ice 5) Measure pH using indicator strip 6) Measure the alkalinity with a HACH kit, and
101
7) Measure the degrees of oil spreading. Chemical analysis The lipopeptide biosurfactant was quantified by using high performance liquid chromatography (HPLC) and standards curves prepared with purified lipopeptide from each Bacillus strain [154]. Oil spreading activity was measured by determining the diameter of clearing when a drop of fluid was added to a thin film of oil [154, 156]. The sugar concentration was determined by using a modified orcinol/H2SO4 method with glucose as the standard [157]. Acetate, succinate, formate, ethanol and 2, 3- butanediol were quantified by using gas chromatography (GC) [155, 158, 159]. Lactate was quantified by HPLC [155]. Carbon dioxide production was calculated by the amount of carbon dioxide present from the alkalinity (HACH) and pH. Glucose utilization and metabolite production was calculated by summing the product of the concentration of a compound in each sample times fluid volume produced during the interval from the last sampling. Product recoveries were corrected for the amount of product present in the inoculum. Microbiological analysis Heterotrophic bacteria, spore-forming bacteria and biosurfactant producing bacteria were enumerated using a three-series MPN technique in 96-well microtiter plates with production water used as inoculum [155]. Plates were incubated statically at room temperature for 48 hours. Plate count broth (PCB) with 5% sodium chloride was the medium used for total heterotrophic bacteria. Production water was incubated at 85oC for 20 minutes before inoculation in PCB with 5% sodium chloride for determination of spore-forming bacteria. Dissipation of sterile crude oil added to the medium surface of PCB microtiter plates with 5% sodium chloride was used to estimate the number of biosurfactant-producing bacteria. In addition, plate count agar (PCA) with 5% sodium chloride were inoculated from positive biosurfactant-producing bacteria wells to identify colonies with morphologies identical to that of the injected Bacillus strains. Oil recovery analysis On days 5 through 20 after injection, flow totalizer and WOR measurements were recorded daily at the wellhead. Daily flow totalizer readings were used to determine daily production water volumes. WOR data determined with a graduated flask were converted to percent oil cut. After this time period, the same measurements were recorded on a weekly basis. For 100 days prior to and after the test, daily oil recovered from the Robertson separation tank battery was also obtained. The Robertson tank battery includes oil production from 7 wells. An average daily production from the Robertson tank battery prior to the microbial test was 11 bbl/day. This value was subtracted from the daily oil production data collected after the microbial test to determine the net increase in oil production due to the microbial treatment.

102
Results Pre-injection, average daily WOR and percent oil cut were 39:1 and 2.5%, respectively, for each well. Average daily production rates were 150 bbl/day for Robertson 15 and 100 bbl/day for Robertson 13. The average daily oil production of the Robertson tank battery was 11 bbl/day over a 3-month interval prior to stimulation. Three-series most probable number (MPN) analyses did not detect any heterotrophic, spore forming or biosurfactant producing bacteria. During the sampling, a total of about 5.1 and 5.8 kg of the biosurfactant was from the production fluids from the Robertson 13 and 15 wells, respectively. Previous sand-packed and sandstone core laboratory column studies indicated that about 2.2 mL of residual oil recovery was recovered per mg of lipopeptide biosurfactant used [160]. Based on the amount of biosurfactant present in the produced fluids, the laboratory derived relationship would predict that 151 bbl of oil should be recovered from the two wells. This assumes that the oil recovery is solely due to the activity of the biosurfactant. Although the data indicate oil production is still above pre-treatment levels, during the first 100 days after the microbial stimulation, the net increase in oil production is approximately 183 bbl as calculated from the Robertson separation tank battery data (Figure 1).
-50
0
50
100
150
200
0 20 40 60 80 100 120
Days
To
tal
Net
Oil
Reco
very
(b
bl)
Figure 1: The total net increase in oil production from the Robertson
separation tank battery

103
0
5
10
15
20
25
-150 -100 -50 0 50 100 150
Days
Dail
y O
il R
ecover
y (
bb
l/d
ay)
Figure 2: The daily oil recovery from the Robertson separation tank battery
0
5
10
15
20
25
-13 -7 -1 5 11 17
Days
Da
ily
Oil
Rec
ov
ery
(b
bl)
0
200
400
600
800
1000
1200
1400
1600
1800
2000
In-situ
Co
mb
ined
Da
ily
Mic
ro
bia
l M
eta
bo
lite
Reco
very
(mo
les)
crude oil lipopeptide X 100 alcohol acid glucose CO2
Figure 3: Comparison of the daily oil recovery with the in-situ combined daily microbial
metabolite recoveries for the Robertson separation tank battery

104
0
5
10
15
20
25
30
35
40
45
0 2000 4000 6000 8000 10000 12000 14000 16000 18000
Total Produced Volume (bbl)
Wate
r/O
il R
ati
o
Robertson 13 Robertson 15 Figure 4: The time-course of WOR for Robertson 15 and 13 wellhead samples
0
2
4
6
8
10
12
0 2000 4000 6000 8000 10000 12000 14000 16000 18000
Total Produced Volume (bbl)
% O
il C
ut
Robertson 13 Robertson 15 Figure 5: The time-course of percent oil cut for Robertson 15 and 13
wellhead samples

105
0
50
100
150
200
250
300
0 2000 4000 6000 8000 10000 12000 14000 16000 18000
Total Produced Volume (bbl)
Aver
age
Dail
y P
rod
uct
ion
Volu
me
(bb
l/d
ay)
.
Robertson 13 Robertson 15 Figure 6: The average daily production volumes for Robertson 15 and 13
wellhead samples
The daily tank battery oil recovery volumes before and after stimulation are shown in Figure 2. There is a lot of scatter to the data, but oil production exceeded 15 bbl/day 27% of the time after treatment while only 7% of the time prior to treatment. The concentrations of lipopeptide biosurfactant, alcohols, acids and carbon dioxide from days 5 through 11 post-injection are shown in Figure 3. Increases in oil recovery occurred after metabolite production occurred (Figure 3). The WOR for Robertson 15 production was 39:1 prior to the microbial treatment. Immediately after the microbial treatment, the WOR decreased to a low of 9:1 and has increased to about 31:1 after 100 days, which is still below pre-treatment levels (Figure 4). Corresponding, the percent oil cut for Robertson 15 has increased due to treatment (Figure 5). A maximum of 10% was observed on post-injection day 11, which corresponded with a 9-bbl peak in net daily oil recovery from the tank battery. After 100 days, the percent oil cut is 3.1%, which is still above the 2.5% baseline value (Figure 5). Production data for the Robertson 13 well show that the WOR has decreased from the baseline value of 39:1 to near 26:1 after the first 100 days (Figure 4). The percent oil cut reached a peak of 5% and has fluctuated between the 2.5% baseline and 3.5% since then (Figure 5). The average daily production volume for Robertson 15 peaked near 250 bbl/day after 2000 bbl of total production volume and correlated with peak in percent oil cut and minimum WOR (Figure 6). Subsequently, daily production volume of Robertson 15 decreased to the baseline value of 150 bbl/day. The average daily production volume from the Robertson 13 well peaked near 160 bbl/day, but this occurred at 500-bbl total production volume before the peak in

106
percent oil cut and minimum WOR, which occurred at 3000 bbl total production volume. After 100 days post-stimulation, the daily production volume of Robertson 13 is at the 100 bbl/day baseline value.
The average carbon recovery for the two wells 91% indicating that almost all of the glucose carbon that was injected was accounted for in unused sugar, other metabolites and cells recovered from production fluids collected six days after production began. The microbes converted glucose into acids (acetate, lactate, formate and succinate) carbon dioxide, alcohols (ethanol and 2, 3- butanediol), the biosurfactant and cells. Both the presence of the biosurfactant and 2, 3-butanediol are characteristic of Bacillus species. Both wells had a peak lipopeptide biosurfactant concentration of 20 and 28 mg/L, respectively, which is above the 11 mg/L required to mobilize oil from laboratory sandstone cores (21, 31). The number of heterotrophic fermentative bacteria injected into Robertson 13 and 15 was 1 x 10¹³ and 3.5 x 10¹³, respectively. After incubation in the formation, the total heterotrophic bacteria recovered in produced fluids was 5 x 10¹³ and 1 x 10¹⁴ for Robertson 13 and Robertson 15 wells, respectively. Thus, bacterial numbers increased 5-fold in-situ for Robertson 13 and 3-fold in-situ for Robertson 15. Biosurfactant-producing bacteria totaled 4.8 x 10¹³ for Robertson 13 and 9.7 x 10¹³ for Robertson 15. Spore-forming bacteria recovered from Robertson 13 totaled 1.6 x 10¹⁰ and 8.4 x 10⁹ for Robertson 15. Oil spread assays detected biosurfactant activity in the production fluids that were collected six days after production resumed. These quantitative results in total indicate significant, almost exclusive in-situ growth of our injected Bacillus strains occurred and corresponded with the expected metabolic activities and improved oil recovery.
Economic analysis The total material and equipment expenses for the stimulation were approximately $3000 per well. It was estimated that the microbial process increased oil production by 183 bbl (net improvement to data). Thus, economic analysis through the first 100 days of post-stimulation production using this value indicates that additional oil was recovered at approximately $33/bbl. Assuming $60/bbl oil, a 55 day return on investment and a $4980 net profit were realized from the microbial stimulation.
Conclusion The microbial stimulation process improved oil production, decreased the WOR, and increased the percent oil cut. The expected products of microbial metabolism were detected in the produced fluids after treatment in quantities sufficient to mobilize crude oil. Initial economics are encouraging, although optimization of the process is needed to increase biosurfactant concentrations and to reduce the incremental cost of recovery. Acknowledgements

107
We thank Stan Lemons of Arrow-Wego Perforators (Ada, OK) and Steve McDaniel of Arrow Oil and Gas, Inc. (Ada, OK) as well as Courtney Brackin and Marshall Brackin and other employees of Arrow Holding, Inc. for the use of the field and assistance in conducting the field trial. Technical assistance of Jim Davis, Sandra Weiland, Neil Wofford and Foluke Ajisafe of the University of Oklahoma are also greatly appreciated.

108
References 1. Lane, D.L., 16S/23S rRNA sequencing, in Nucleic Acid Techniques in Bacterial
Systematics, E. Stackenbradt and M. Goodfellow, Editors. 1991, Wiley: New York.
2. Chun, J. and K.S. Bae, Phylogenetic analysis of Bacillus subtilis and related taxa based on partial gyrA gene sequences. Antonie Van Leeuwenhoek, 2000. 78(2): p. 123-7.
3. Koeuth, T., J. Versalovic, and J.R. Lupski, Differential subsequence conservation of interspersed repetitive Streptococcus pneumoniae BOX elements in diverse bacteria. Genome Res, 1995. 5(4): p. 408-18.
4. Muyzer, G., E.C. de Waal, and A.G. Uitterlinden, Profiling of complex microbial populations by denaturing gradient gel electrophoresis analysis of polymerase chain reaction-amplified genes coding for 16S rRNA. Appl Environ Microbiol, 1993. 59(3): p. 695-700.
5. Muyzer, G., et al., Phylogenetic relationships of Thiomicrospira species and their identification in deep-sea hydrothermal vent samples by denaturing gradient gel electrophoresis of 16S rDNA fragments. Arch Microbiol, 1995. 164(3): p. 165-72.
6. Cosmina, P., et al., Sequence and analysis of the genetic locus responsible for surfactin synthesis in Bacillus subtilis. Mol Microbiol, 1993. 8(5): p. 821-31.
7. Konz, D., S. Doekel, and M.A. Marahiel, Molecular and biochemical characterization of the protein template controlling biosynthesis of the lipopeptide lichenysin. J Bacteriol, 1999. 181(1): p. 133-40.
8. Ochsner, U.A., A. Fiechter, and J. Reiser, Isolation, characterization, and expression in Escherichia coli of the Pseudomonas aeruginosa rhlAB genes encoding a rhamnosyltransferase involved in rhamnolipid biosurfactant synthesis. J Biol Chem, 1994. 269(31): p. 19787-95.
9. Ochsner, U.A., T. Hembach, and A. Fiechter, Production of rhamnolipid biosurfactants. Adv Biochem Eng Biotechnol, 1996. 53: p. 89-118.
10. Ochsner, U.A., et al., Isolation and characterization of a regulatory gene affecting rhamnolipid biosurfactant synthesis in Pseudomonas aeruginosa. J Bacteriol, 1994. 176(7): p. 2044-54.
11. Ochsner, U.A. and J. Reiser, Autoinducer-mediated regulation of rhamnolipid biosurfactant synthesis in Pseudomonas aeruginosa. Proc Natl Acad Sci U S A, 1995. 92(14): p. 6424-8.
12. Green, D.W. and G.P. Willhite, Enhanced oil recovery. 1998, Richardson, TX: Society of Petroleum Engineers.
13. Weihong, Q., et al., Interfacial behavior of pure surfactants for enhanced oil recovery - Part 1: A study on the adsorption and distribution of cetylbenzene sulfonate. Tenside, Surfactants, Detergents, 2003. 40(2): p. 87-89.
14. Strand, S., D.C. Standnes, and T. Austad, Spontaneous imbibition of aqueous surfactant solutions into neutral to oil-wet carbonate cores: Effects of brine salinity and composition. Energy and Fuels, 2003. 17(5): p. 1133-1144.

109
15. Brown, L.R., A.A. Vadie, and J.O. Stephens, Slowing production decline and extending the economic life of an oil field: new MEOR technology. SPE Reservoir Eval. & Eng., 2002. 5(1): p. 33-41.
16. Sheehy, A.J. Field studies of microbial EOR. (SPE 13223). in Proceedings: SPE/DOE Seventh Symposium on Enhanced Oil Recovery. 1990. Tulsa, OK, USA: Society of Petroleum Engineers, Richardson, TX.
17. Bryant, R.S. and T.E. Burchfield, Microbial enhanced waterflooding: a pilot study. Devel. Petr. Sci., 1991. 31: p. 399-420.
18. Davidson, S.W. and H.H. Russell, A MEOR pilot test in the Loco field, in Proceedings of the Symposium on the Application of Microorganisms to Petroleum Technology, T.E. Burchfield and R.S. Bryant, Editors. 1988, National Technical Information Service, Springfield, VA. p. VII 1-VII 12.
19. Lazar, I., et al., MEOR, recent field trials in Romania: reservoir selection, type of inoculum, protocol for well treatment and line monitoring. Devel. Petr. Sci., 1993. 39: p. 265-288.
20. Lin, S.-C., Biosurfactants: Recent Advances. Journal of Chemical Technology and Biotechnology, 1996. 66(2): p. 109.
21. Desai, J.D. and I.M. Banat, Microbial production of surfactants and their commercial potential. Microbiol. Mol. Biol. Rev., 1997. 61(1): p. 47-64.
22. Lin, S.-C., et al., Structural and immunological characterization of a biosurfactant produced by Bacillus licheniformis JF-2. Appl. Environ. Microbiol., 1994. 60: p. 31-38.
23. McInerney, M.J., M. Javaheri, and D.P. Nagle, Jr., Properties of the biosurfactant produced by Bacillus licheniformis strain JF-2. J. Ind. Microbiol., 1990. 5(2-3): p. 95-101.
24. Council, N.P., Enhanced oil recovery, 1984(June): p. 61-83. 25. Department of Energy, Oil and Gas RD&D Programs, DOE/FE-0386. 1999, U.
S. Department of Energy, Office of Fossil Energy. p. 4-13. 26. Johnston, K.H. and C.H. Riggs, U. S. Department of Interior, Bureau of Mines.
1946. 27. Bryant, R.S., MEOR screening criteria fit 27% of U.S. oil reservoirs. Oil and Gas
Journal, 1991. 89(15): p. 56-59. 28. Bregnard, T.P., P. Hohener, and J. Zeyer, Bioavailability and biodegradation of
weathered diesel fuel in aquifer material and denitryfing conditions. Environ. Sci. Technol, 1998. 17: p. 1222-1229.
29. Duncan, J.E., G.M. Hatch, and J. Belik, Susceptibility of exogenous surfactant to phospholipase A2 degradation. Can. J. Physiol. Pharmacol., 1996. 74: p. 957-963.
30. Field, J.A., et al., Identification of persistent anionic surfactant-derived chemicals in sewage effluent and groundwater. Journal Contaminant Hydrology, 1992. 9: p. 55-78.
31. Yeh, D.H. and S.G. Pavlostathis, Development of hexachlorobenzene-degrading dechlorinating mixed cultures using polysorbate surfactants as a carbon source. Water Science and Technology, 2001. 43: p. 43-50.
32. Raiders, R.A., et al., Selectivity and depth of microbial plugging in Berea sandstone cores. Journal of Industrial Microbiology, 1986. 1: p. 195-203.

110
33. Knapp, R.M., et al. Design and implementation of a microbially enhanced oil recovery field pilot, Payne County, Oklahoma. in SPE Annual Technical Conference, 1992, Oct 4-7 1992. 1992. Washington, DC, USA: Publ by Soc of Petroleum Engineers of AIME, Richardson, TX, USA.
34. Abdulrazag, Y., R.A. Almehaideb, and O. Chaalal. Project of increasing oil recovery from UAE reservoirs using bacteria flooding. (SPE 56827). in Proceedings of the SPE Annual Technical Conference. 1999: Society of Petroleum Engineers, Richardson, TX.
35. Marsh, T.L., et al., Mechanisms of microbial oil recovery by Clostridium acetobutylicum and Bacillus strain JF-2, in The Fifth International Conference on Microbial Enhanced Oil Recovery and Related Problems for Solving Environmental Problems. (CONF-9509173). R.S. Bryant and K.L. Sublette, Editors. 1995, National Technical Information Service: Springfield, VA. p. 593-610.
36. Sugihardjo, E.H. and S.W. Pratomo. Microbial Core flooding experiments using indigenous microbes. (SPE 57306). in Proceedings of the SPE Asia Pacific Improved Oil Recovery Conference. 1999. Kuala Lampur, Malaysia: Society of Petroleum Engineers, Richardson, TX.
37. Thomas, C.P., G.A. Bala, and M.L. Duvall, Surfactant-based Enhanced Oil Recovery mediated by naturally occuring microorganisms. Society of Petroleum Engineers, 1993. 11: p. 287-298.
38. Yakimov, M.M., et al., The potential of Bacillus licheniformis strains for in situ enhanced oil recovery. J. Petr. Sci. Engineer., 1997. 18: p. 147-160.
39. Yonebayashi, H., et al., Fundamental studies on MEOR with anaerobes. Flooding experiments using sandpack for estimation of capabilities of microbes. Sekiyu Gijutsu Kyokaishi, 1997. 62(3): p. 195-202.
40. Bryant, S.L. and T.P. Lockhart, Reservoir-engineering analysis of microbial enhanced oil recovery. JPT, Journal of Petroleum Technology, 2001. 53(1): p. 57-58.
41. McInerney, M.J., et al., Development of microorganisms with improved transport and biosurfactant activity for enhanced oil recover. Annual Report for DOE DE-FE-02NT15321. University of Oklahoma. 2003.
42. Folsmbee, M.J., M.J. McInerney, and D.P. Nagle, Anaerobic growth of Bacillus mojavensis Jf-2 and three other Bacillus strains requires DNA. Appl. Environ. Microbiol., 2004. in press.
43. Knapp, R.M., et al., Development of a microbial enhanced oil recovery process for the Delaware-Childers Field, Nowata County. Oklahoma Geological Survey Circular, 2002. 108: p. 193-200.
44. McInerney, M.J., et al., Development of more effective biosurfactants for enhanced oil recovery. Final Technical Report for DOE DE-AC26-98BC15113. University of Oklahoma. 2001.
45. Tabor, J.J., Dynamic and static forces required to remove a discontinuous oil phase from porous media containing both oil and water. Soc. Pet. Eng. J., 1969. 9: p. 3-12.
46. Reed, R.L. and R.N. Healy, Some physicochemical aspects of microemulsion flooding: a review., in Improved Oil Recovery by Surfactant and Polymer
111
Flooding, D.O. Shah and R.S. Schechter, Editors. 1977, Academic Press, Inc.: Orlando, FL. p. 383-437.
47. Sabatini, D.A., et al., Integrated design of surfactant enhanced DNAPL remediation. efficient supersolubilization and gradient systems. J. Contam. Hydrol., 2000. 45: p. 99-121.
48. Van Poolen, H.K., and Associates., Fundamentals of Enhanced Oil Recovery. 1980, Tulsa, OK: PennWell Publishing Co.
49. Duffield, A.R., R.S. Ramamurthy, and J.R. Campanelli, Surfactant enhanced mobilization of mineral oil within porous media. Water, Air, and Soil Pollution, 2003. 143(1-4): p. 111-122.
50. Thomas, S. and S.M. Farouq Ali, Micellar flooding and ASP - chemical methods for enhanced oil recovery. Journal of Canadian Petroleum Technology, 2001. 40(2): p. 46-52.
51. Sharma, M.M. and G. Georjiou, Microbial enhanced oil recovery research: Final report, Annex 5. 1993, Dep. Pet. Eng.,Texas Univ.,Austin,TX,USA. p. 131 pp.
52. Zhang, Y. and R.M. Miller, Enhanced octadecane dispersion and biodegradation by a Pseudomonas rhamnolipid surfactant (biosurfactant). Appl. Environ. Microbiol., 1992. 58: p. 3276-3282.
53. Zhang, Y., W.J. Maier, and R.M. Miller, Effect of rhamnolipids on the dissolution, bioavailability, and biodegradation of phenanthrene. Environ. Sci. Technol., 1997. 31: p. 2211-2217.
54. Morán, A.C., et al., Enhancement of hydrocarbon waste biodegradation by addition of a biosurfactant from Bacillus subtilis O9. Biodegradation, 2000. 11: p. 65-71.
55. Thangamani, S. and G.S. Shreve, Effect of anionic biosurfactant on hexadecane partitioning in multiphase systems. Environ. Sci. Technol., 1993. 28(12): p. 1993-2000.
56. Ivshina, I.B., M.S. Kuyukina, and N. Christofi, Oil desorption from mineral and organic materials using biosurfactant complexes produced by Rhodococcus species. World J. Microbiol. Biotechnol., 1998. 14: p. 711-717.
57. García-Junco, M., E. De Olmedo, and J.J. Ortega-Calvo, Bioavailability of solid and non-aqueous phase liquid (NAPL)-dissolved phenanthrene to the biosurfactant-producing bacterium Pseudomonas aeruginosa 19SJ. Environ. Microbiol., 2001. 3(9): p. 561-9.
58. Toren, A., et al., Solubilization of polyaromatic hydrocarbons by recombinant bioemulsifier AlnA. Appl. Microbiol. Biotechnol., 2002. 59: p. 580-584.
59. Maier, R.M. and G. Soberon-Chavez, Pseudomonas aeruginosa rhamnolipids: biosynthesis and potential applications. Appl. Microbiol. Biotechnol., 2000. 54(5): p. 625-633.
60. Ron, E.Z. and E. Rosenberg, Natural roles of biosurfactants. Environ. Microbiol., 2001. 3(4): p. 229-236.
61. Jones, W.R., Biosurfactants, bioavailability and bioremediation. Global Environ. Biotechnol., 1997: p. 379-390.
62. Bouchez-Naïtali, M., et al., Evidence for interfacial uptake in hexadecane degradation by Rhodococcus equi: the importance of cell flocculation. Microbiology, 2001. 147(Pt 9): p. 2537-43.
112
63. Al-Tahhan, R.A., et al., Rhamnolipid-induced removal of lipopolysaccharide from Pseudomonas aeruginosa: effect on cell surface properties and interaction with hydrophobic substrates. Appl. Environ. Microbiol., 2000. 66(8): p. 3262-3268.
64. Wick, L.Y. and H. Harms, Bacterial strategies to optimize the bioavailability of solid PAH. International In Situ and On-Site Bioremediation Symposium, 6th, San Diego, CA, United States, June 4-7, 2001, 2001. 3: p. 251-257.
65. Noordman, W.H., et al., The enhancement by surfactants of hexadecane degradation by Pseudomonas aeruginosa varies with substrate availability. Journal of Biotechnology, 2002. 94(2): p. 195-212.
66. Dean, S.M., et al., Phenanthrene degradation in soils co-inoculated with phenanthrene-degrading and biosurfactant-producing bacteria. Journal of Environmental Quality, 2001. 30(4): p. 1126-1133.
67. Lin, S.C., et al., Structural and immunological characterization of a biosurfactant produced by Bacillus licheniformis JF-2. Appl. Environ. Microbiol., 1994. 60(1): p. 31-38.
68. Georgiou, G., S.-C. Lin, and M.M. Sharma, Surface-active compounds from microorganisms. Biotechnology (N Y), 1992. 10(1): p. 60-65.
69. McInerney, M.J., M. Javaheri, and D.P. Nagle, Properties of the biosurfactant produced by Bacillus licheniformis strain JF-2. J. Indust. Microbiol., 1990. 5: p. 95-102.
70. Desai, J. and I.M. Banat, Microbial production of surfactants and their commercial potential. Microbiol. Mol. Biol. Rev., 1997. 61: p. 47-64.
71. Rosenberg, E. and E.Z. Ron, High- and low-molecular mass microbial surfactants. Appl. Microbiol. Biotechnol., 1999. 52: p. 154-162.
72. Fiechter, A., Biosurfactants: moving towards industrial application. Trends Food Sci Technol., 1992. 10(6): p. 208-217.
73. Morikawa, M., Y. Hirata, and T. Imanaka, A study on the structure-function relationship of lipopeptide biosurfactants. Biochim. Biophys. Acta, 2000. 1488(3): p. 211-8.
74. Van Dyke, M.I., et al., Pseudomonas aeruginosa UG2 rhamnolipid biosurfactants: structural characterization and their use in removing hydrophobic compounds from soil. Can. J. Microbiol., 1993. 39(11): p. 1071-1078.
75. Herman, D.C., R.J. Lenhard, and R.M. Miller, Formation and removal of hydrocarbon residual in porous media: effects of attached bacteria and biosurfactants. Environ. Sci. Technol., 1997. 31: p. 1290-1294.
76. Herman, D.C., Y. Zhang, and R.M. Miller, Rhamnolipid (biosurfactant) effects on cell aggregation and biodegradation of residual hexadecane under saturated flow conditions. Appl. Environ. Microbiol., 1997. 63: p. 3622-3627.
77. Thomas, C.P., G.A. Bala, and M.L. Duvall, Surfactant-based enhanced oil recovery mediated by naturally occurring microorganisms. Soc. Petrol. Eng. Reservoir Eng., 1993. 11: p. 285-291.
78. Marsh, T.L., et al., Mechanisms of microbial oil recovery by Clostridium acetobutylicum and Bacillus strain JF-2., in The Fifth International Conference on Microbial Enhanced Oil Recovery and Related Problems for Solving Environmental Problems, K.L. Sublette, Editor. 1995, Office of Scientific and Technical Information, CONF-9509173. p. 593-610.

113
79. Shiau, B.J., D.A. Sabatini, and J.H. Harwell, Removal of chlorinated solvents in subsurface media using edible surfactants: column studies. J. Environ. Engineer. ASCE, 2000. 126(7): p. 611-621.
80. Salager, J.-L., Microemulsions, in Handbook of Detergents. Part A. Properties, G. Broze, Editor. 1999, Marcel Dekker, Inc.: New York. p. 253-302.
81. Smith, S.A., et al., Performance and chemical stability of a new class of ethoxylated sulfate surfactants in a subsurface remediation application. Colloids Surfaces A: Physiochem. Eng. Aspects, 1996. 116: p. 225-239.
82. Krebs-Yuill, B., Harwell, J.H., Sabatini, D.A., and Knox, R.C., Economic Considerations in Surfactant-Enhanced Pump-and-Treat Remediation, in Surfactant-Enhanced Remediation of Subsurface Contamination, ACS Symposium Series 594, J.H. Harwell, Editor. 1995, American Chemical Society: Washington, D.C. p. 265-278.
83. Shariati, P., et al., Anaerobic metabolism in Bacillus licheniformis NCIB 6346. Microbiology, 1995. 141: p. 1117-1124.
84. Orphan, V.J., et al., Culture-dependent and culture-independent characterization of microbial assemblages associated with high-temperature petroleum reservoirs. Appl. Environ. Microbiol., 2000. 66: p. 700-711.
85. Bhupathiraju, V.K., M.J. McInerney, and R.M. Knapp, Pretest studies for a Microbially Enhanced Oil Recovery field pilot in a hypersaline oil reservoir. Geomicrobiology Journal, 1993. 11: p. 19-34.
86. Bernard, F.P., J. Connan, and M. Magot. Indigenous microorganisms in connate water of many oil fields: a new tool in exploration and production techniques. (SPE 24811). in Proceedings of the SPE Annual Technical Conference. 1992: Society of Petroleum Engineers, Richardson, TX.
87. Grassia, G.S., et al., A systematic survey for thermophilic fermentative bacteria in high temperature petroleum reservoirs. FEMS Microbiol. Ecol., 1996. 21: p. 47-58.
88. Stetter, K.O., et al., Hyperthermophilic archaea are thriving in deep North Sea and Alaska oil reservoirs. Nature, 1993. 363: p. 743-745.
89. Magot, M., B. Ollivier, and B.K.C. Patel, Microbiology of petroleum reservoirs. Antonie van Leeuwenhoek J. Microbiol. Serol., 2000. 77: p. 103-116.
90. Nazina, T.N., et al., Taxonomic study of aerobic thermophilic bacilli: descriptions of Geobacillus subterraneus gen. nov., sp. nov., Geobacillus uznensis sp. nov. from petroleum reservoirs and tranfer of Bacillus stearothermophilus, Bacillus thermoleovorans, Bacillus kaustophilus, Bacillus, thermoglucosidasius, and Bacillus thermodenitrificans to Geobacillus as new combinations G. stearothermophilus, G. thermoleovorans, G. kaustophilus, G. thermoglucosidasius, and G. thermodenitrificans. Int. j. System. Evol. Microbiol., 2001. 51: p. 433-446.
91. Nazina, T.N., et al., [Physiological and phylogenetic diversity of thermophilic spore-forming hydrocarbon-oxidizing bacteria from oil fields]. Mikrobiologiia, 2000. 69(1): p. 113-9.
92. Jenneman, G.E., et al., A halotolerant, biosurfactant-producing Bacillus species potentially useful for enhanced oil recovery. Dev. Ind. Microbiol., 1983. 24: p. 485-92.

114
93. Yonebayashi, H., et al., Screening of microorganisms for Microbial Enhanced Oil Recovery processes. Sekiyu Gakaishi, 2000. 43 (1): p. 59-69.
94. Yonebayashi, H., et al., Fundamental studies on MEOR with anaerobes. Evaluation of activities of isolated anaerobes. Sekiyu Gijutsu Kyokaishi, 1996. 61(5): p. 443-451.
95. Bodour, A.A., M. Drees, and R.M. Maier, Distribution of biosurfactant-producing bacteria in undisturbed and contaminated arid southwestern soils. Appl. Environ. Microbiol., 2003. 69: p. 3280-3287.
96. Sullivan, E.R., Molecular genetics of biosurfactant production. Curr. Opin. Biotechnol., 1998. 9(3): p. 263-9.
97. Konz, D., S. Doekel, and M.A. Marahiel, Molecular and biochemical characterization of the protein template controlling biosynthesis of lipopeptide lichenysin. J. Bacteriol., 1999. 1999: p. 133-140.
98. Nakano, M.M., M.A. Marahiel, and P. Zuber, Identification of a genetic locus required for biosynthesis of the lipopeptide antibiotic surfactin in Bacillus subtilis. J. Bacteriol., 1988. 170(12): p. 5662-5668.
99. Cosby, W.M., et al., Altered srf expression in Bacillus subtilis resulting from changes in culture pH is dependent on the Spo0K oligopeptide permease and the ComQX system of extracellular control. J. Bacteriol., 1998. 180: p. 1438-1445.
100. Garcia-Junco, M., E. De Olmedo, and J.J. Ortega-Calvo, Bioavailability of solid and non-aqueous phase liquid (NAPL)-dissolved phenanthrene to the biosurfactant-producing bacterium Pseudomonas aeruginosa 19SJ. Environ Microbiol, 2001. 3(9): p. 561-9.
101. Herman, D.C., Y. Zhang, and R.M. Miller, Rhamnolipid (biosurfactant) effects on cell aggregation and biodegradation of residual hexadecane under saturated flow conditions. Appl Environ Microbiol, 1997. 63(9): p. 3622-7.
102. Maier, R.M. and G. Soberon-Chavez, Pseudomonas aeruginosa rhamnolipids: biosynthesis and potential applications. Appl Microbiol Biotechnol, 2000. 54(5): p. 625-33.
103. Ron, E.Z. and E. Rosenberg, Natural roles of biosurfactants. Environ Microbiol, 2001. 3(4): p. 229-36.
104. Toren, A., et al., Solubilization of polyaromatic hydrocarbons by recombinant bioemulsifier AlnA. Appl Microbiol Biotechnol, 2002. 59(4-5): p. 580-4.
105. Zhang, Y. and R.M. Miller, Enhanced octadecane dispersion and biodegradation by a Pseudomonas rhamnolipid surfactant (biosurfactant). Appl Environ Microbiol, 1992. 58(10): p. 3276-82.
106. Lin, S.C., et al., Structural and immunological characterization of a biosurfactant produced by Bacillus licheniformis JF-2. Appl Environ Microbiol, 1994. 60(1): p. 31-8.
107. McInerney, M.J., M. Javaheri, and D.P. Nagle, Jr., Properties of the biosurfactant produced by Bacillus licheniformis strain JF-2. J Ind Microbiol, 1990. 5(2-3): p. 95-101.
108. Desai, J.D. and I.M. Banat, Microbial production of surfactants and their commercial potential. Microbiol Mol Biol Rev, 1997. 61(1): p. 47-64.
109. Rosenberg, E. and E.Z. Ron, High- and low-molecular-mass microbial surfactants. Appl Microbiol Biotechnol, 1999. 52(2): p. 154-62.

115
110. Yakimov, M.M., et al., The potential of Bacillus licheniformis strains for in situ enhanced oil recovery. Journal of Petroleum Science and Engineering, 1997. 18(1): p. 147-160.
111. McInerney, M.J. and D.W.S. Westlake, Microbially enhanced oil rcovery, in Microbial Mineral Recovery, H.J. Ehrlich and C. Brierly, Editors. 1990, MacMillan Publishing Co.: New York. p. 409-445.
112. Bryant, R.S., et al., Microbial-enhanced waterflooding. SPE Reservoir Eng, 1990. 5: p. 9-13.
113. Bryant, R.S., et al., Microbial-enhanced waterflooding field pilots. Dev Petrol Sci, 1993. 39: p. 289-306.
114. McInerney, M.J., D.P. Nagle, and R.M. Knapp, Microbially enhanced oil recovery: past, present, and future, in Petroleum Microbiology, B. Ollivier and M. Magot, Editors. 2005, ASM Press: Washigton, D.C.
115. McInerney, M.J., et al., Development of an in situ biosurfactant production technology for enhanced oil recovery (DE-F26-04NT15532). 2005, U.S. Department of Energy. p. 45.
116. Zheng, W., Characterization of surfactant-producing Bacillus species: physiology and phylogeny, in Biological Sciences. 2000, University of Tulsa: Tulsa, OK. p. 124.
117. Duncan, K.E., et al., Fine-scale genetic and phenotypic structure in natural populations of Bacillus subtilis and Bacillus licheniformis: implicationsfor bacterial evolution and speciation. Evolution, 1994. 48: p. 2002-2025.
118. Hamon, M.A. and B.A. Lazazzera, The sporulation transcription factor Spo0A is required for biofilm development in Bacillus subtilis. Mol Microbiol, 2001. 42(5): p. 1199-209.
119. Youssef, N.H., et al., Comparison of methods to detect biosurfactant production by diverse microorganisms. J Microbiol Methods, 2004. 56(3): p. 339-47.
120. Ramsey, M.M. and M. Whiteley, Pseudomonas aeruginosa attachment and biofilm development in dynamic environments. Mol Microbiol, 2004. 53(4): p. 1075-87.
121. Liu, J.R., et al., Emended description of the genus Trichococcus, description of Trichococcus collinsii sp. nov., and reclassification of Lactosphaera pasteurii as Trichococcus pasteurii comb. nov. and of Ruminococcus palustris as Trichococcus palustris comb. nov. in the low-G+C gram-positive bacteria. Int J Syst Evol Microbiol, 2002. 52(Pt 4): p. 1113-26.
122. Grabowski, A., et al., Microbial diversity in production waters of a low-temperature biodegraded oil reservoir. FEMS Microbiol. Ecol., 2005. 54(3): p. 427-443.
123. Myhr, S. and T. Torsvik, Characterization of strain S2651, a novel oil degrading sulfate-reducing bacterium isolated from an oil reservoir model column. 1999, Univerisy of Bergen: Bergen, Norway.
124. Kato, S., et al., Effective cellulose degradation by a mixed-culture system composed of a cellulolytic Clostridium and aerobic non-cellulolytic bacteria. FEMS Microbiol Ecol, 2004. 51(1): p. 133-42.
116
125. Amoozegar, M.-A., et al., 16S rDNA sequence of halothermotolerant Bacillus licheniformis isolated from Persian petroleum reservoir. 2005, Tehran University: Tehran, Iran.
126. Buchheim, J.A. and M.A. Buchheim, Halotolerant aerobic heterotrophic bacteria from the great salt plains of Oklahoma. 2004, University of Tulsa: Tulsa, OK.
127. Coenye, T., et al., Characterization of unusual bacteria isolated from respiratory secretions of cystic fibrosis patients and description of Inquilinus limosus gen. nov., sp. nov. J Clin Microbiol, 2002. 40(6): p. 2062-9.
128. Adkins, J.P., et al., Microbially enhanced oil recovery from unconsolidated limestone cores. Geomicrobiol., 1992. 10: p. 77-86.
129. Udegbunam, E.O., et al. Assessing the effects of microbial metabolism and metabolites on reservoir pore structure. SPE 22846. in In Proceedings of the SPE Annual Technical Conference. 1991. Richrdson, TX.
130. Harrah, T., B. Panilaitis, and D. Kaplan, Microbial polysaccharides, in The Prokaryotes: an Evolving Electronic Resource for the Microbiological Community, M. Dworkin, et al., Editors. 2004, Springer-Verlag: New York.
131. Kim, D.S. and H.S. Fogler, Biomass evolution in porous media and its effects on permeability under starvation conditions. Biotechnol Bioeng, 2000. 69(1): p. 47-56.
132. Shaw, J.C., et al., Bacterial fouling in a model core system. Appl Environ Microbiol, 1985. 50: p. 693-701.
133. Pfiffner, S.M., et al., Isolation of Halotolerant, Thermotolerant, Facultative Polymer-Producing Bacteria and Characterization of the Exopolymer. Appl Environ Microbiol, 1986. 51(6): p. 1224-1229.
134. Gieg, L.M., et al., Intrinsic Bioremediation of Petroleum Hydrocarbons in a gas condensate-contaminted aquifer. Environ Sci Technol, 1999. 33(15): p. 2550-2560.
135. Magot, M., Petroleum Microbiology, in Petroleum Microbiology, B. Ollivier and M. Magot, Editors. 2005, ASM Press: Washington, D.C. p. 21-34.
136. Ollivier, B. and J.-L. Cayol, Fermentative, Iron-reducing, and nitrate-reducing microorganisms, in Petroleum Microbiology, B. Ollivier and M. Magot, Editors. 2005, ASM Press: Washigton, D.C. p. 71-88.
137. Major, D.W., et al., Field demonstration of successful bioaugmentation to achieve dechlorination of tetrachloroethene to ethene. Environ Sci Technol, 2002. 36(23): p. 5106-16.
138. Silva, E., et al., Combined bioaugmentation and biostimulation to cleanup soil contaminated with high concentrations of atrazine. Environ Sci Technol, 2004. 38(2): p. 632-7.
139. Youssef, N.H., K.E. Duncan, and M.J. McInerney, Importance of 3-hydroxy fatty acid composition of lipopeptides for biosurfactant activity. Environ Microbiol, 2005. 71: p. 7690-7695.
140. Wery, N., et al., Use of a packed-column bioreactor for isolation of diverse protease-producing bacteria from antarctic soil. Appl Environ Microbiol, 2003. 69(3): p. 1457-64.
117
141. Palmisano, M.M., et al., Bacillus sonorensis sp. nov., a close relative of Bacillus licheniformis, isolated from soil in the Sonoran Desert, Arizona. Int J Syst Evol Microbiol, 2001. 51(Pt 5): p. 1671-9.
142. Hall, C., et al., Hydrocarbons and the evolution of human culture. Nature, 2003. 426: p. 318-322.
143. Lundquist, A.D., et al., Energy for a new century: Increasing domestic energy production., in National Energy Policy Report, N.E.P.D. Group, Editor. 2001.
144. Planckaert, M., Oil reservoirs and oil production, in Petroleum Microbiology, B. Ollivier and M. Magot, Editors. 2005, ASM Press: Washington, D.C. p. 3-19.
145. McInerney, M.J., D.P. Nagle, and R.M. Knapp, Microbially enhanced oil recovery: past, present, and future, in Petroleum Microbiology, B. Ollivier and M. Magot, Editors. 2005, ASM Press: Washington D.C. p. 215-237.
146. Banat, I.M., Biosurfactants production and possible uses in microbial enhanced oil recovery and oil pollution remediation: a review. Bioresource Technol., 1995. 51: p. 1-12.
147. Bryant, R.S. and T.E. Burchfield, Review of microbial technology for improving oil recovery. SPE Reservoir Eng., 1989. 4: p. 151-154.
148. Li, Q., et al., Application of microbial enhanced oil recovery technique to Daqing oil field. Biochem. Eng. J., 2002. 11: p. 197-199.
149. Shariati, P., et al., Anaerobic metabolism in Bacillus licheniformis NCBI 6346. Microbiology, 1995. 141: p. 1117-1124.
150. Linn, S.C., et al., Structural and immunological characterization of a biosurfactant produced by Bacillus licheniformis JF-2. Appl. Environ. Microbiol., 1994. 60: p. 31-38.
151. McInerney, M.J., M. Javaheri, and D.P. Nagle, Properties of the biosurfactant produced by Bacillus licheniformis strain JF-2. J. Ind. Microbiol., 1990. 5: p. 95-102.
152. Knapp, R.M., et al., Development of a microbially enhanced oil recovery process for the Delaware Childers Field, Nowata County. Oklahoma Geological Survey Circular, 2002. 108: p. 193-200.
153. Maudgalya, S., et al., Presented at the SPE Production and Operations Symposium. 2005: Oklahoma City, OK.
154. Youssef, N.H., et al., Comparison of methods to detect biosurfactant production by diverse microorganisms. J. Microbiol. Methods, 2004. 56: p. 339-347.
155. Youssef, N.H., et al., In situ biosurfactant production by Bacillus strains injected into a limestone petroleum reservoir. Appl. Environ. Microbiol., 2007. 73: p. 1239-1247.
156. Morikawa, M., Y. Hirata, and T. Imanaka, A study on the structure-function relationship of lipopeptide biosurfactants. Biochem. Biophys. Acta, 2000. 1488: p. 211-218.
157. Tahzibi, A., F. Kamal, and M.M. Assadi, Improved production of rhamnolipids by a Pseudomonas aeruginosa mutant. Iran. Biomed., 2004. 8: p. 25-31.
158. Henis, Y., J.R. Gould, and M. Alexander, Detection and identification of bacteria by gas chromatography. Appl. Microbiol., 1966. 14: p. 513-524.

118
159. Larson, L., P.A. Mardh, and G. Odham, Detection of alcohols and volatile fatty acids by head-space gas chromatography in identification of anaerobic bacteria. J. Clin. Microbiol., 1978. 7: p. 23-27.
160. McInerney, M.J., et al., Final report to the U.S. Department of Energy: Development of microorganisms with improved transport and biosurfactant activity for enhanced oil recovery. 2005, University of Oklahoma.

119
Appendices

120
APPENDIX I
Aerobic nutrient treatment for Hunton formation fluids Table 13. Biosurfactant production with a single nutrient component deleted for Hunton formation fluids.
Diameter of Oil spreading (cm) for the optimal nutrient treatment package TIME (Days) MEDIUM+BRINE MEDIUM+BRINE+INOCULUM MEDIUM+INOCULUM MEDIUM ONLY Everything added
Day3 0.47 ± 0.06 1.30± 0.26 0.50±0.00 0.00±0.00 Day7 1.50± 0.10 2.00± 0.00 1.53± 0.06 0.00± 0.00
Minus Glucose Day3 0.37 ± 0.06 1.33± 0.06 0.93± 0.31 0.00± 0.00 Day7 0.10± 0.10 1.23±0.25 1.27±0.12 0.00±0.00
Minus Proteose peptone Day3 0.30±0.26 0.47±0.15 0.40±0.36 0.00±0.00 Day7 0.17±0.29 0.40±0.10 0.07±0.12 0.00±0.00
Minus Molasses Day3 1.17±0.29 1.60±0.53 0.47±0.12 0.00 ±0.00 Day7 1.23±0.25 1.17±0.29 0.20±0.20 0.00±0.00
Minus NaCl Day3 0.00±0.00 2.50±0.50 2.43±0.60 0.00±0.00 Day7 1.17±1.04 0.80±0.72 1.53±1.70 0.00± 0.00
Minus Nitrate Day3 0.07± 0.00 0.07±0.00 1.60±0.66 0.00±0.00 Day7 0.37±0.21 0.20±0.20 0.97±1.19 0.00±0.00
Minus Phosphate Day3 0.87±0.83 2.10±0.36 2.03±0.71 0.00±0.00 Day7 1.77±1.57 1.50±1.32 1.77±1.54 0.00±0.00
Minus Glycerol Day3 0.00±0.00 1.17±0.29 1.10±0.36 0.00±0.00 Day7 0.80±0.35 0.77±0.40 0.63±0.32 0.00±0.00

121
Table 14. Biosurfactant production with double nutrient component deleted for Hunton formation fluids.
Diameter of Oil spreading (cm) for the optimal nutrient treatment package TIME (Days) MEDIUM+BRINE MEDIUM+BRINE+INOCULUM MEDIUM+INOCULUM MEDIUM ONLY Minus Glucose Minus Molasses
Day3 0.30±0.14 1.00±0.00 0.47±0.15 0.00±0.00 Day7 0.27±0.06 0.90±0.10 0.27±0.06 0.00±0.00
Minus Glucose Minus Proteose peptone Day3 0.00±0.00 0.53±0.12 0.43±0.51 0.00±0.00 Day7 0.03±0.06 0.53±0.12 0.53±0.21 0.00±0.00
Minus Glucose Minus NaCl Day3 0.57±0.21 2.87±0.12 3.40±1.05 0.00±0.00 Day7 2.00±0.00 1.87±0.21 0.90±0.95 0.00±0.00
Minus Glucose Minus Phosphate Day3 0.47±0.15 1.83±0.76 2.37±0.32 0.00±0.00 Day7 0.37±0.29 2.17±0.29 7.10±0.14 0.00±0.00
Minus Glucose Minus Nitrate Day3 0.37±0.15 1.30±1.08 1.10±0.36 0.00±0.00 Day7 0.13±0.12 1.70±0.62 0.43±0.59 0.00±0.00
Minus Glucose Minus Glycerol Day3 0.17±0.15 0.10±0.00 0.07±0.12 0.00±0.00 Day7 0.35±0.07 0.17±0.29 0.37±0.35 0.00±0.00
Minus Molasses Minus Proteose peptone Day3 0.00±0.00 0.20±0.10 0.33±0.06 0.00±0.00 Day7 0.00±0.00 0.27±0.06 0.17±0.06 0.00±0.00
Minus Molasses Minus NaCl Day3 0.20±0.10 2.00±0.50 0.37±0.06 0.00±0.00 Day7 0.23±0.06 1.83±0.29 0.13±0.12 0.00±0.00
Minus Molasses Minus Phosphate Day3 0.00±0.00 0.50±0.26 0.30±0.14 0.00±0.00 Day7 1.17 ±0.67 1.97±0.57 0.13±0.12 0.00±0.00
Minus Molasses Minus Nitrate Day3 0.17±0.15 0.87±0.23 0.37±0.12 0.00±0.00 Day7 0.00±0.00 0.20±0.20 0.27±0.06 0.00±0.00

122
TIME (Days) MEDIUM+BRINE MEDIUM+BRINE+INOCULUM MEDIUM+INOCULUM MEDIUM ONLY Minus Molasses Minus Nitrate
Day3 0.07±0.06 0.27±0.25 0.50±0.10 0.00±0.00 Day7 0.00±0.00 0.00±0.00 0.27±0.25 0.00±0.00
Minus Proteose peptone Minus NaCl Day3 0.17±0.00 0.53±0.06 0.57±0.15 0.00±0.00 Day7 0.00±0.00 0.00±0.00 0.43±0.06 0.00±0.00
Minus Proteose peptone Minus Phosphate Day3 0.30±0.10 0.87±0.12 0.60±0.26 0.00±0.00 Day7 0.37±0.06 0.50±0.10 0.67±0.29 0.00±0.00
Minus Proteose peptone Minus Nitrate Day3 0.00±0.00 0.00±0.00 0.20±0.10 0.00±0.00 Day7 0.00±0.00 0.15±0.21 0.33±0.15 0.00±0.00
Minus Proteose peptone Minus Glycerol Day3 0.00±0.00 0.53±0.23 0.93±0.42 0.00±0.00 Day7 0.00±0.00 0.20±0.17 0.53±0.06 0.00±0.00
Minus Glycerol Minus NaCl Day3 0.33±0.23 0.50±0.10 0.40±0.17 0.00±0.00 Day7 0.53±0.50 0.80±0.20 2.37±0.06 0.00±0.00
Minus Glycerol Minus Phosphate Day3 0.00±0.00 0.50±0.10 0.43±0.40 0.00±0.00 Day7 0.33±0.31 0.30±0.30 0.13±0.23 0.00±0.00
Minus Glycerol Minus Nitrate Day3 0.00±0.00 0.00±0.00 0.00±0.00 0.00±0.00 Day7 0.00±0.00 0.73±0.12 0.33±0.31 0.00±0.00

123
Table 15. Biosurfactant production a single nutrient component added for Hunton formation fluids.
Diameter of Oil spreading (cm) for the optimal nutrient treatment package TIME (Days) MEDIUM+BRINE MEDIUM+BRINE+INOCULUM MEDIUM+INOCULUM MEDIUM ONLY Glucose Only
Day3 0.35±0.05 0.00±0.00 0.00±0.00 0.00±0.00 Day7 0.00±0.00 0.30±0.26 0.13±0.23 0.00±0.00
Molasses Only Day3 0.00±0.00 0.00±0.00 0.00±0.00 0.00±0.00 Day7 0.30±0.26 0.43±0.45 0.93±0.86 0.00±0.00
Proteose peptone Only Day3 0.00±0.00 0.00±0.00 0.00±0.00 0.00±0.00 Day7 0.00±0.00 0.00±0.00 0.00±0.00 0.00±0.00
Glycerol Only Day3 0.00±0.00 0.33±0.25 0.00±0.00 0.00±0.00 Day7 0.13±0.23 0.53±0.47 0.00±0.00 0.00±0.00
Phosphate Only Day3 0.00±0.00 0.00±0.00 0.00±0.00 0.00±0.00 Day7 0.00±0.00 0.00 ±0.00 0.30±0.26 0.00±0.00
Nitrate Only Day3 0.00±0.00 0.00±0.00 0.00±0.00 0.00±0.00 Day7 0.00±0.00 0.27±0.23 0.00±0.00 0.00±0.00

124
Table 16. Biosurfactant production with double nutrient components added for Hunton formation fluids.
Diameter of Oil spreading (cm) for the optimal nutrient treatment package TIME (Days) MEDIUM+BRINE MEDIUM+BRINE+INOCULUM MEDIUM+INOCULUM MEDIUMONLY Plus Glucose Plus Proteose Peptone
Day3 0.30±0.08 0.63±0.12 0.33±0.05 0.00±0.00 Day7 0.00±0.00 0.00±0.00 0.23±0.40 0.00±0.00
Plus Glucose Plus Molasses Day3 0.00±0.00 0.30±0.22 0.37±0.05 0.17±0.24 Day7 0.00±0.00 0.00±0.00 0.00±0.00 0.00±0.00
Plus Glucose Plus NaCl Day3 0.00±0.00 0.30±0.00 0.43±0.05 0.00±0.00 Day7 0.00±0.00 0.27±0.23 0.57±0.06 0.00±0.00
Plus Glucose Plus Phosphate Day3 0.00±0.00 0.00±0.00 0.00±0.00 0.00±0.00 Day7 0.00±0.00 0.13±0.23 0.73±0.31 0.00±0.00
Plus Glucose Plus Nitrate Day3 0.00±0.00 0.63±0.05 0.50±0.08 0.00±0.00 Day7 0.00±0.00 1.30±0.42 0.55±0.07 0.00±0.00
Plus Glucose Plus Glycerol Day3 0.00±0.00 0.00±0.00 0.00±0.00 0.00±0.00 Day7 0.13±0.23 0.67±0.06 0.40±0.00 0.00±0.00
Plus Molasses Plus Proteose Peptone Day3 1.40±0.57 0.53±0.75 3.00±0.29 0.00±0.00 Day7 1.23±0.31 0.00±0.00 0.87±0.31 0.00±0.00
Plus Molasses Plus NaCl Day3 0.40±0.08 1.10±0.08 2.00±0.43 0.00±0.00 Day7 0.00±0.00 1.26±0.20 3.53±0.45 0.00±0.00
Plus Molasses Plus Nitrate Day3 0.40±0.08 1.10±0.08 2.0±0.43 0.00±0.00 Day7 0.00±0.00 0.00±0.00 0.00±0.00 0.00±0.00
Plus Molasses Plus Phosphate Day3 0.23±0.17 0.33±0.05 0.30±0.00 0.00±0.00 Day7 0.00±0.00 0.00±0.00 0.00±0.00 0.00±0.00
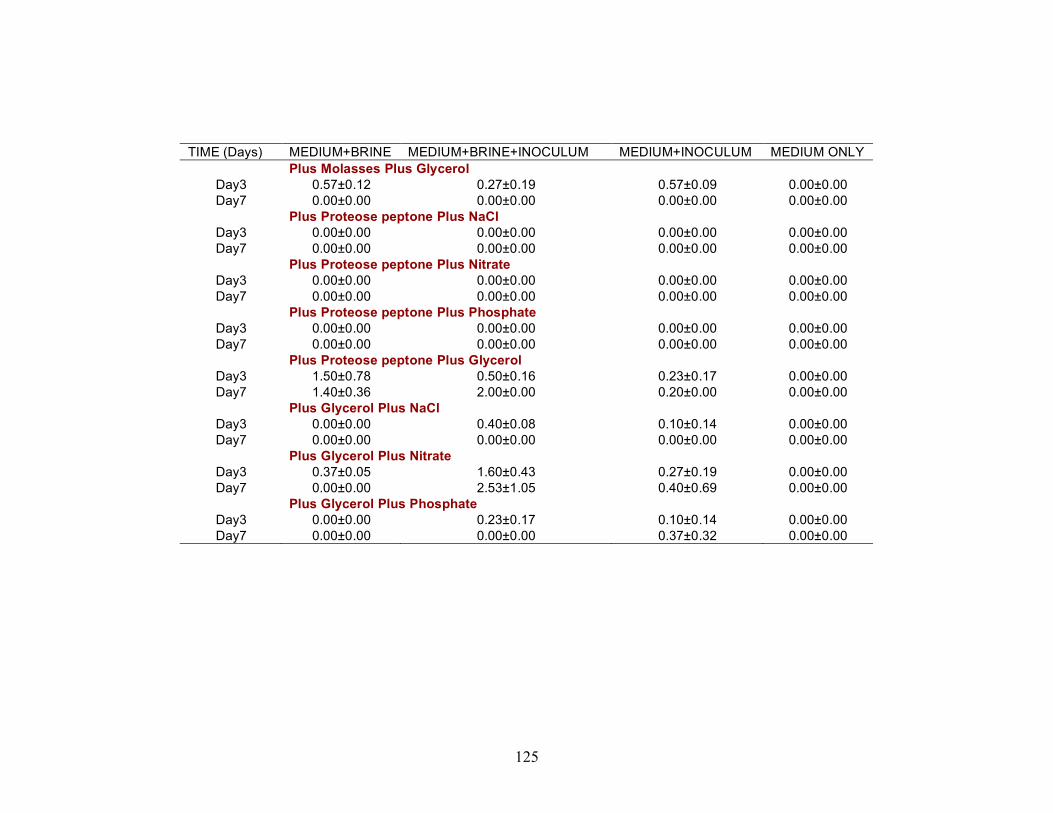
125
TIME (Days) MEDIUM+BRINE MEDIUM+BRINE+INOCULUM MEDIUM+INOCULUM MEDIUM ONLY Plus Molasses Plus Glycerol
Day3 0.57±0.12 0.27±0.19 0.57±0.09 0.00±0.00 Day7 0.00±0.00 0.00±0.00 0.00±0.00 0.00±0.00
Plus Proteose peptone Plus NaCl Day3 0.00±0.00 0.00±0.00 0.00±0.00 0.00±0.00 Day7 0.00±0.00 0.00±0.00 0.00±0.00 0.00±0.00
Plus Proteose peptone Plus Nitrate Day3 0.00±0.00 0.00±0.00 0.00±0.00 0.00±0.00 Day7 0.00±0.00 0.00±0.00 0.00±0.00 0.00±0.00
Plus Proteose peptone Plus Phosphate Day3 0.00±0.00 0.00±0.00 0.00±0.00 0.00±0.00 Day7 0.00±0.00 0.00±0.00 0.00±0.00 0.00±0.00
Plus Proteose peptone Plus Glycerol Day3 1.50±0.78 0.50±0.16 0.23±0.17 0.00±0.00 Day7 1.40±0.36 2.00±0.00 0.20±0.00 0.00±0.00
Plus Glycerol Plus NaCl Day3 0.00±0.00 0.40±0.08 0.10±0.14 0.00±0.00 Day7 0.00±0.00 0.00±0.00 0.00±0.00 0.00±0.00
Plus Glycerol Plus Nitrate Day3 0.37±0.05 1.60±0.43 0.27±0.19 0.00±0.00 Day7 0.00±0.00 2.53±1.05 0.40±0.69 0.00±0.00
Plus Glycerol Plus Phosphate Day3 0.00±0.00 0.23±0.17 0.10±0.14 0.00±0.00 Day7 0.00±0.00 0.00±0.00 0.37±0.32 0.00±0.00

126
APPENDIX II Aerobic nutrient treatment for Wewoka formation fluids
Table 17. Biosurfactant production with a single nutrient component deleted for Wewoka formation fluids.
Diameter of Oil Spreading (cm) for optimal nutrient treatment package. TIME (Days) MEDIUM+BRINE MEDIUM+BRINE+INOCULUM MEDIUM+INOCULUM MEDIUM ONLY
Everything added Day 3 0.00±0.00 2.53±0.06 2.70±2.40 0.00±0.00 Day 5 0.00±0.00 3.33±0.29 6.63±0.32 0.00±0.00 Day 7 0.00±0.00 4.20±0.20 6.50±0.10 0.00±0.00
Minus Glucose Day 3 0.00±0.00 1.80±0.20 1.20±0.52 0.00±0.00 Day 5 0.00±0.00 1.63±0.29 0.47±0.12 0.00±0.00 Day 7 0.00±0.00 0.00±0.00 0.73±0.21 0.00±0.00
Minus Protese peptone Day 3 0.00±0.00 0.33±0.06 0.37±0.15 0.00±0.00 Day 5 0.00±0.00 0.13±0.15 0.30±0.26 0.00±0.00 Day 7 0.00±0.00 0.00±0.00 0.00±0.00 0.00±0.00
Minus Molasses Day 3 0.00±0.00 0.23±0.21 0.00±0.00 0.00±0.00 Day 5 0.00±0.00 1.70±0.17 0.00±0.00 0.00±0.00 Day 7 0.00±0.00 0.00±0.00 0.00±0.00 0.00±0.00
Minus NaCl Day 3 0.00±0.00 3.00±0.20 3.43±0.12 0.00±0.00 Day 5 0.00±0.00 3.03±0.06 3.40±0.06 0.00±0.35 Day 7 0.00±0.00 0.37±0.06 3.30±0.26 0.00±0.00
Minus Nitrate Day 3 0.00±0.00 0.10±0.17 0.20±0.17 0.00±0.00 Day 5 0.00±0.00 0.17±0.15 0.03±0.00 0.00±0.00 Day 7 0.00±0.00 0.00±0.00 0.00±0.00 0.00±0.00
Minus Phosphate Day 3 0.00±0.00 3.70±0.75 3.53±0.23 0.00±0.00 Day 5 0.00±0.00 4.30±0.66 4.73±0.12 0.00±0.00 Day 7 0.00±0.00 2.77±0.25 2.50±0.10 0.00±0.00
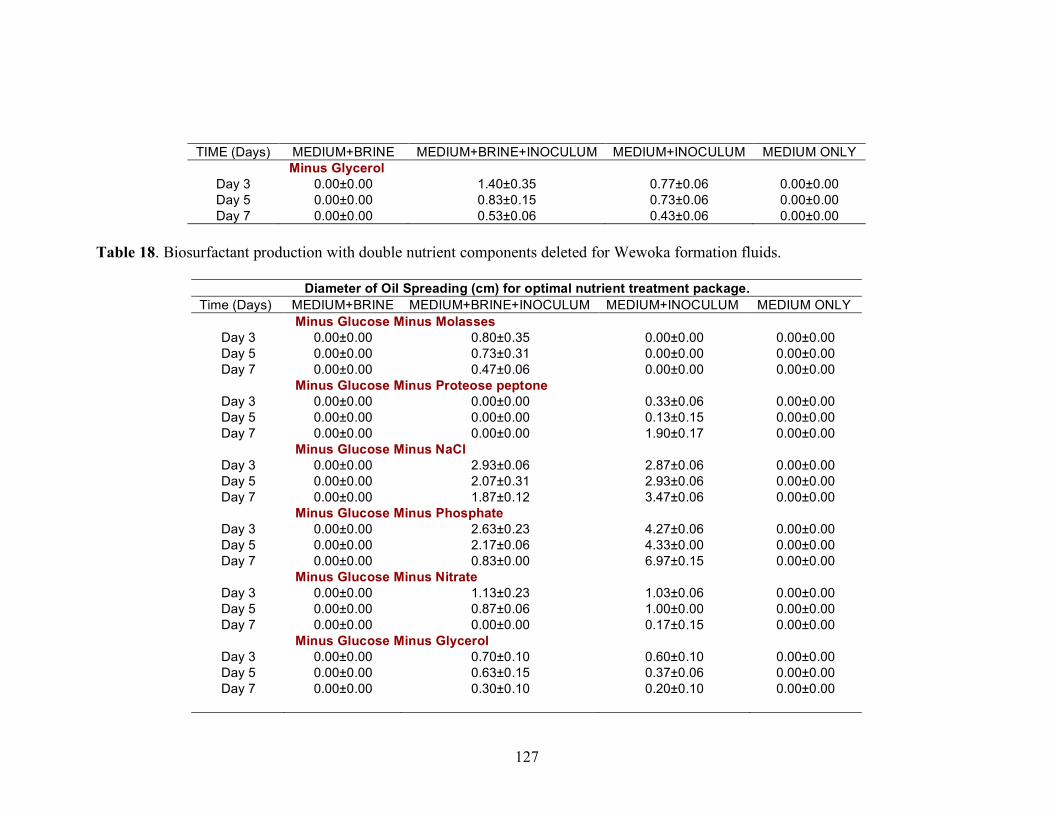
127
TIME (Days) MEDIUM+BRINE MEDIUM+BRINE+INOCULUM MEDIUM+INOCULUM MEDIUM ONLY Minus Glycerol
Day 3 0.00±0.00 1.40±0.35 0.77±0.06 0.00±0.00 Day 5 0.00±0.00 0.83±0.15 0.73±0.06 0.00±0.00 Day 7 0.00±0.00 0.53±0.06 0.43±0.06 0.00±0.00
Table 18. Biosurfactant production with double nutrient components deleted for Wewoka formation fluids.
Diameter of Oil Spreading (cm) for optimal nutrient treatment package. Time (Days) MEDIUM+BRINE MEDIUM+BRINE+INOCULUM MEDIUM+INOCULUM MEDIUM ONLY
Minus Glucose Minus Molasses Day 3 0.00±0.00 0.80±0.35 0.00±0.00 0.00±0.00 Day 5 0.00±0.00 0.73±0.31 0.00±0.00 0.00±0.00 Day 7 0.00±0.00 0.47±0.06 0.00±0.00 0.00±0.00
Minus Glucose Minus Proteose peptone Day 3 0.00±0.00 0.00±0.00 0.33±0.06 0.00±0.00 Day 5 0.00±0.00 0.00±0.00 0.13±0.15 0.00±0.00 Day 7 0.00±0.00 0.00±0.00 1.90±0.17 0.00±0.00
Minus Glucose Minus NaCl Day 3 0.00±0.00 2.93±0.06 2.87±0.06 0.00±0.00 Day 5 0.00±0.00 2.07±0.31 2.93±0.06 0.00±0.00 Day 7 0.00±0.00 1.87±0.12 3.47±0.06 0.00±0.00
Minus Glucose Minus Phosphate Day 3 0.00±0.00 2.63±0.23 4.27±0.06 0.00±0.00 Day 5 0.00±0.00 2.17±0.06 4.33±0.00 0.00±0.00 Day 7 0.00±0.00 0.83±0.00 6.97±0.15 0.00±0.00
Minus Glucose Minus Nitrate Day 3 0.00±0.00 1.13±0.23 1.03±0.06 0.00±0.00 Day 5 0.00±0.00 0.87±0.06 1.00±0.00 0.00±0.00 Day 7 0.00±0.00 0.00±0.00 0.17±0.15 0.00±0.00
Minus Glucose Minus Glycerol Day 3 0.00±0.00 0.70±0.10 0.60±0.10 0.00±0.00 Day 5 0.00±0.00 0.63±0.15 0.37±0.06 0.00±0.00 Day 7 0.00±0.00 0.30±0.10 0.20±0.10 0.00±0.00
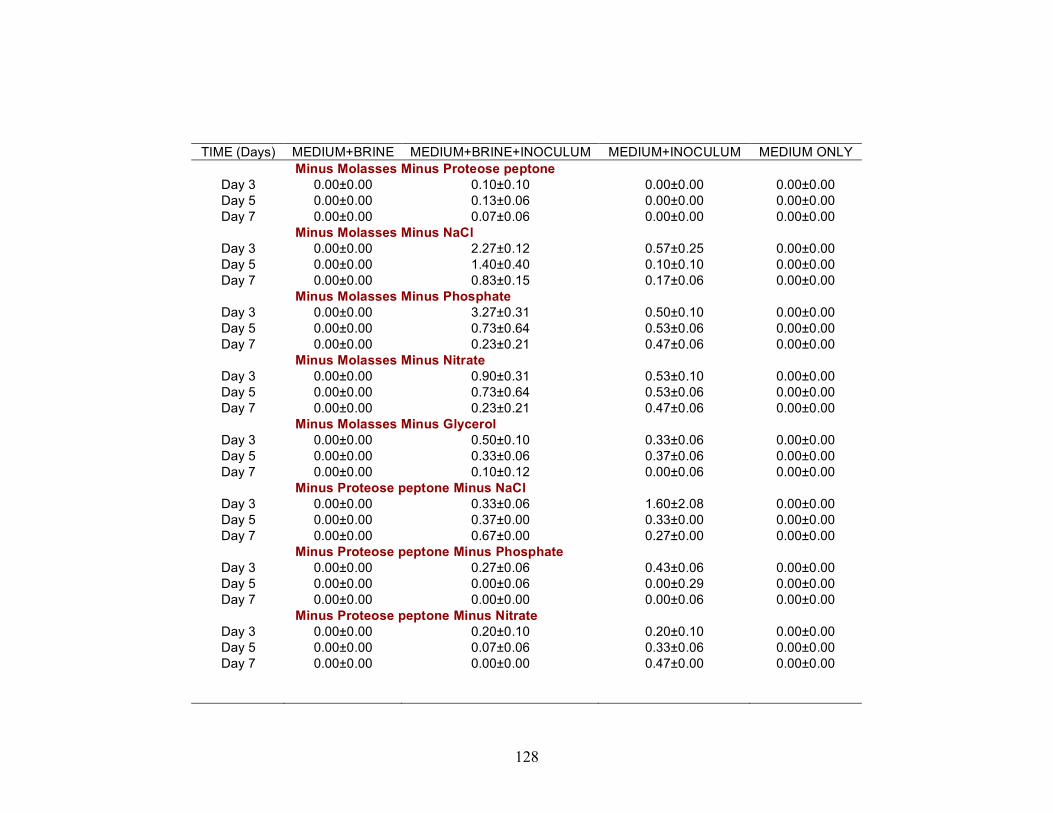
128
TIME (Days) MEDIUM+BRINE MEDIUM+BRINE+INOCULUM MEDIUM+INOCULUM MEDIUM ONLY Minus Molasses Minus Proteose peptone
Day 3 0.00±0.00 0.10±0.10 0.00±0.00 0.00±0.00 Day 5 0.00±0.00 0.13±0.06 0.00±0.00 0.00±0.00 Day 7 0.00±0.00 0.07±0.06 0.00±0.00 0.00±0.00
Minus Molasses Minus NaCl Day 3 0.00±0.00 2.27±0.12 0.57±0.25 0.00±0.00 Day 5 0.00±0.00 1.40±0.40 0.10±0.10 0.00±0.00 Day 7 0.00±0.00 0.83±0.15 0.17±0.06 0.00±0.00
Minus Molasses Minus Phosphate Day 3 0.00±0.00 3.27±0.31 0.50±0.10 0.00±0.00 Day 5 0.00±0.00 0.73±0.64 0.53±0.06 0.00±0.00 Day 7 0.00±0.00 0.23±0.21 0.47±0.06 0.00±0.00
Minus Molasses Minus Nitrate Day 3 0.00±0.00 0.90±0.31 0.53±0.10 0.00±0.00 Day 5 0.00±0.00 0.73±0.64 0.53±0.06 0.00±0.00 Day 7 0.00±0.00 0.23±0.21 0.47±0.06 0.00±0.00
Minus Molasses Minus Glycerol Day 3 0.00±0.00 0.50±0.10 0.33±0.06 0.00±0.00 Day 5 0.00±0.00 0.33±0.06 0.37±0.06 0.00±0.00 Day 7 0.00±0.00 0.10±0.12 0.00±0.06 0.00±0.00
Minus Proteose peptone Minus NaCl Day 3 0.00±0.00 0.33±0.06 1.60±2.08 0.00±0.00 Day 5 0.00±0.00 0.37±0.00 0.33±0.00 0.00±0.00 Day 7 0.00±0.00 0.67±0.00 0.27±0.00 0.00±0.00
Minus Proteose peptone Minus Phosphate Day 3 0.00±0.00 0.27±0.06 0.43±0.06 0.00±0.00 Day 5 0.00±0.00 0.00±0.06 0.00±0.29 0.00±0.00 Day 7 0.00±0.00 0.00±0.00 0.00±0.06 0.00±0.00
Minus Proteose peptone Minus Nitrate Day 3 0.00±0.00 0.20±0.10 0.20±0.10 0.00±0.00 Day 5 0.00±0.00 0.07±0.06 0.33±0.06 0.00±0.00 Day 7 0.00±0.00 0.00±0.00 0.47±0.00 0.00±0.00

129
TIME (Days) MEDIUM+BRINE MEDIUM+BRINE+INOCULUM MEDIUM+INOCULUM MEDIUM ONLY Minus Proteose peptone Minus Glycerol
Day 3 0.00±0.00 0.53±0.06 0.60±0.00 0.00±0.00 Day 5 0.00±0.00 0.07±0.06 0.13±0.10 0.00±0.00 Day 7 0.00±0.00 0.00±0.00 0.00±0.06 0.00±0.00
Minus Glycerol Minus NaCl Day 3 0.00±0.00 1.67±0.15 2.47±0.06 0.00±0.00 Day 5 0.00±0.00 0.13±0.10 0.30±0.06 0.00±0.00 Day 7 0.00±0.00 0.00±0.10 0.17±0.12 0.00±0.00
Minus Glycerol Minus Phosphate Day 3 0.00±0.00 1.37±0.15 2.47±0.06 0.00±0.00 Day 5 0.00±0.00 1.10±0.10 1.17±0.06 0.00±0.00 Day 7 0.00±0.00 0.50±0.06 0.67±0.12 0.00±0.00
Minus Glycerol Minus Nitrate Day 3 0.00±0.00 0.10±0.10 0.13±0.06 0.00±0.00 Day 5 0.00±0.00 0.23±0.06 0.03±0.10 0.10±0.10 Day 7 0.00±0.00 0.00±0.00 0.00±0.00 0.00±0.00

130
Table 19. Biosurfactant production with a single nutrient component added for Wewoka formation fluids.
Diameter of Oil Spreading (cm) for optimal nutrient treatment package. Time (Days) MEDIUM+BRINE MEDIUM+BRINE+INOCULUM MEDIUM+INOCULUM MEDIUM ONLY Glucose only
Day 3 0.00±0.00 0.00±0.00 0.00±0.00 0.00±0.00 Day 5 0.00±0.00 0.00±0.00 0.00±0.00 0.00±0.00 Day 7 0.00±0.00 0.00±0.00 0.00±0.00 0.00±0.00
Molasses only Day 3 0.00±0.00 0.00±0.00 0.00±0.00 0.00±0.00 Day 5 0.00±0.00 0.00±0.00 0.00±0.00 0.00±0.00 Day 7 0.00±0.00 0.00±0.00 0.00±0.00 0.00±0.00
Proteose peptone only Day 3 0.00±0.00 0.00±0.00 0.13±0.23 0.00±0.00 Day 5 0.00±0.00 0.00±0.00 0.00±0.00 0.00±0.00 Day 7 0.00±0.00 0.00±0.00 0.00±0.00 0.00±0.00
Glycerol only Day 3 0.00±0.00 0.00±0.00 0.13±0.23 0.00±0.00 Day 5 0.00±0.00 0.00±0.00 0.00±0.00 0.00±0.00 Day 7 0.00±0.00 0.00±0.00 0.00±0.00 0.00±0.00
Phosphate only Day 3 0.00±0.00 0.00±0.00 0.00±0.00 0.00±0.00 Day 5 0.00±0.00 0.00±0.00 0.00±0.00 0.00±0.00 Day 7 0.00±0.00 0.00±0.00 0.00±0.00 0.00±0.00
Nitrate only Day 3 0.00±0.00 0.00±0.00 0.00±0.00 0.00±0.00 Day 5 0.00±0.00 0.00±0.00 0.00±0.00 0.00±0.00 Day 7 0.00±0.00 0.00±0.00 0.00±0.00 0.00±0.00

131
Table 20. Biosurfactant production with double nutrient component added for Wewoka formation fluids.
Diameter of Oil Spreading (cm) for optimal nutrient treatment package. TIME (Days) MEDIUM+BRINE MEDIUM+BRINE+INOCULUM MEDIUM+INOCULUM MEDIUM ONLY Plus Glucose Plus Proteose peptone
Day 3 0.00±0.00 3.07±0.38 0.23±0.21 0.00±0.00 Day 5 0.00±0.00 2.97±0.40 0.90±0.17 0.00±0.00 Day 7 0.00±0.00 0.03±0.06 0.83±0.15 0.00±0.00
Plus Glucose Plus Molasses Day 3 0.00±0.00 0.53±0.06 0.40±0.00 0.00±0.00 Day 5 0.00±0.00 0.27±0.06 0.00±0.00 0.00±0.00 Day 7 0.00±0.00 0.33±0.06 0.00±0.00 0.00±0.00
Plus Glucose Plus NaCl Day 3 0.00±0.00 0.27±0.06 0.40±0.00 0.00±0.00 Day 5 0.00±0.00 0.53±0.06 0.37±0.06 0.00±0.00 Day 7 0.00±0.00 0.03±0.06 0.13±0.23 0.00±0.00
Plus Glucose Plus Phosphate Day 3 0.00±0.00 0.00±0.00 0.00±0.00 0.00±0.00 Day 5 0.00±0.00 0.00±0.00 0.00±0.00 0.00±0.00 Day 7 0.00±0.00 0.00±0.00 0.00±0.00 0.00±0.00
Plus Glucose Plus Nitrate Day 3 0.00±0.00 0.20±0.10 0.00±0.00 0.00±0.00 Day 5 0.00±0.00 0.50±0.10 0.00±0.00 0.00±0.00 Day 7 0.00±0.00 0.30±0.06 0.47±0.06 0.00±0.00
Plus Glucose Plus Glycerol Day 3 0.00±0.00 0.17±0.06 0.00±0.00 0.00±0.00 Day 5 0.00±0.00 0.17±0.06 0.00±0.00 0.00±0.00 Day 7 0.00±0.00 0.00±0.00 0.00±0.00 0.00±0.00
Plus Molasses Plus Proteose peptone Day 3 0.00±0.00 0.57±0.06 0.57±0.15 0.00±0.00 Day 5 0.00±0.00 0.80±0.20 4.83±1.04 0.00±0.00 Day 7 0.00±0.00 0.63±0.15 1.20±0.30 0.00±0.00

132
TIME (Days) MEDIUM+BRINE MEDIUM+BRINE+INOCULUM MEDIUM+INOCULUM MEDIUM ONLY Plus Molasses Plus NaCl
Day 3 0.00±0.00 0.37±0.06 0.57±0.06 0.00±0.00 Day 5 0.00±0.00 1.43±0.40 0.87±0.32 0.00±0.00 Day 7 0.00±0.00 0.50±0.10 0.50±0.10 0.00±0.00
Plus Molasses Plus Nitrate Day 3 0.00±0.00 1.10±0.10 3.53±0.45 0.00±0.00 Day 5 0.00±0.00 0.73±0.32 2.93±0.21 0.00±0.00 Day 7 0.00±0.00 0.53±0.06 3.53±0.45 0.00±0.00
Plus Molasses Plus Phosphate Day 3 0.00±0.00 0.17±0.06 0.00±0.00 0.00±0.00 Day 5 0.00±0.00 0.80±0.20 1.57±0.86 0.00±0.00 Day 7 0.00±0.00 0.00±0.00 1.80±0.36 0.00±0.00
Plus Molasses Plus Glycerol Day 3 0.00±0.00 0.20±0.00 0.00±0.00 0.00±0.00 Day 5 0.00±0.00 0.47±0.06 3.30±0.82 0.00±0.00 Day 7 0.00±0.00 0.37±0.06 3.47±1.08 0.00±0.00
Plus Proteose peptone Plus NaCl Day 3 0.00±0.00 0.15±0.07 0.53±0.06 0.00±0.00 Day 5 0.00±0.00 0.07±0.06 0.00±0.00 0.00±0.00 Day 7 0.00±0.00 0.00±0.00 0.00±0.00 0.00±0.00
Plus Proteose peptone Plus Nitrate Day 3 0.00±0.00 0.10±0.17 0.50±0.17 0.00±0.00 Day 5 0.00±0.00 0.00±0.00 0.00±0.00 0.00±0.00 Day 7 0.00±0.00 0.00±0.00 0.00±0.00 0.00±0.00
Plus Proteose peptone Plus Phosphate Day 3 0.00±0.00 0.00±0.00 0.43±0.06 0.00±0.00 Day 5 0.00±0.00 0.000.00 0.43±0.00 0.00±0.00 Day 7 0.00±0.00 0.00±0.00 0.00±0.00 0.00±0.00
Plus Proteose peptone Plus Glycerol Day 3 0.00±0.00 0.17±0.06 0.37±0.32 0.00±0.00 Day 5 0.00±0.00 2.63±0.15 3.300.82 0.00±0.00 Day 7 0.00±0.00 1.30±0.17 0.00±0.00 0.00±0.00

133
TIME (Days) MEDIUM+BRINE MEDIUM+BRINE+INOCULUM MEDIUM+INOCULUM MEDIUM ONLY Plus Glycerol Plus NaCl
Day 3 0.00±0.00 0.10±0.10 0.00±0.00 0.00±0.00 Day 5 0.00±0.00 0.93±0.12 0.00±0.00 0.00±0.00 Day 7 0.00±0.00 0.53±0.06 0.00±0.00 0.00±0.00
Plus Glycerol Plus Nitrate Day 3 0.00±0.00 0.03±0.06 0.27±0.23 0.00±0.00 Day 5 0.00±0.00 0.57±0.06 0.50±0.10 0.00±0.00 Day 7 0.00±0.00 0.00±0.00 0.00±0.00 0.00±0.00
Plus Glycerol Plus Phosphate Day 3 0.00±0.00 0.00±0.00 0.00±0.00 0.00±0.00 Day 5 0.00±0.00 0.00±0.00 0.00±0.00 0.00±0.00 Day 7 0.00±0.00 0.00±0.00 0.00±0.00 0.00±0.00

134
Appendix III Aerobic Nutrient treatment for Earlsboro formation
Table 21. Biosurfactant production with a single nutrient component deleted for Earlsboro formation fluids.
Oil Spreading (cm) for the optimal aerobic nutrient treatment package TIME (Days) MEDIUM + BRINE MEDIUM+BRINE+INOCULUM MEDIUM+INOCULUM MEDIUM ONLY
Everything added Day 3 0.00±0.00 0.20±0.10 2.53±0.06 0.00±0.00 Day 5 0.00±0.00 0.60±0.20 4.53±0.42 0.00±0.00 Day 7 0.00±0.00 0.33±0.06 4.50±0.10 0.00±0.00
Minus Glucose Day 3 0.00±0.00 0.33±0.06 1.27±0.40 0.00±0.00 Day 5 0.00±0.00 0.40±0.10 0.47±0.12 0.00±0.00 Day 7 0.00±0.00 0.33±0.06 0.73±0.21 0.00±0.00
Minus Proteose peptone Day 3 0.00±0.00 0.33±0.06 0.37±0.15 0.00±0.00 Day 5 0.00±0.00 0.13±0.15 0.30±0.26 0.00±0.00 Day 7 0.00±0.00 0.00±0.00 0.00±0.00 0.00±0.00
Minus Molasses Day 3 0.00±0.00 0.30±0.00 0.27±0.06 0.00±v Day 5 0.00±0.00 0.63±0.06 0.17±0.06 0.00±0.00 Day 7 0.00±0.00 0.20±0.10 0.00±0.00 0.00±0.00
Minus NaCl Day 3 0.00±0.00 0.47±0.06 0.67±0.21 0.00±0.00 Day 5 0.00±0.00 2.40±0.10 2.57±0.06 0.00±0.00 Day 7 0.00±0.00 0.80±0.20 1.00±0.10 0.00±0.00
Minus Nitrate Day 3 0.00±0.00 0.53±0.06 0.53±0.06 0.00±0.00 Day 5 0.00±0.00 0.63±0.06 0.20±0.10 0.00±0.00 Day 7 0.00±0.00 0.00±0.00 0.00±0.00 0.00±0.00
Minus Phosphate Day 3 0.00±0.00 0.43±0.12 0.43±0.06 0.00±0.00 Day 5 0.00±0.00 2.77±0.06 3.17±0.15 0.00±0.00 Day 7 0.00±0.00 1.03±0.06 2.40±0.17 0.00±0.00

135
TIME (Days) MEDIUM + BRINE MEDIUM+BRINE+INOCULUM MEDIUM+INOCULUM MEDIUM ONLY Minus Glycerol
Day 3 0.00±0.00 0.43±0.06 0.57±0.06 0.00±0.00 Day 5 0.00±0.00 0.50±0.10 1.00±0.10 0.00±0.00 Day 7 0.00±0.00 0.37±0.12 0.47±0.06 0.00±0.06
Table 22. Biosurfactant production with double nutrient components deleted for Earlsboro formation fluids.
Oil Spreading (cm) for the optimal aerobic nutrient treatment package for the Earlsboro formation fluids TIME (Days) MEDIUM + BRINE MEDIUM+BRINE+INOCULUM MEDIUM+INOCULUM MEDIUM ONLY
Minus Glucose Minus Molasses Day 3 0.00±0.00 0.10±0.10 0.00±0.00 0.00±0.00 Day 5 0.00±0.00 0.67±0.12 0.27±0.06 0.00±0.00 Day 7 0.00±0.00 0.43±0.06 0.20±0.10 0.00±0.00
Minus Glucose Minus Proteose peptone Day 3 0.00±0.00 0.03±0.06 0.63±0.06 0.00±0.00 Day 5 0.00±0.00 0.00±0.00 0.70±0.10 0.00±0.00 Day 7 0.00±0.00 0.00±0.00 0.80±0.26 0.00±0.00
Minus Glucose Minus NaCl Day 3 0.00±0.00 0.90±0.10 2.50±0.10 0.00±0.00 Day 5 0.00±0.00 0.77±0.15 0.37±0.06 0.00±0.00 Day 7 0.00±0.00 0.47±0.06 0.00±0.06 0.00±0.00
Minus Glucose Minus Phosphate Day 3 0.00±0.00 3.13±0.15 4.53±0.06 0.00±0.00 Day 5 0.00±0.00 2.53±0.46 4.53±0.06 0.00±0.00 Day 7 0.00±0.00 1.70±0.26 3.97±0.15 0.00±0.00
Minus Glucose Minus Nitrate Day 3 0.00±0.00 0.37±0.06 0.67±0.21 0.00±0.00 Day 5 0.00±0.00 0.57±0.06 0.57±0.06 0.00±0.00 Day 7 0.00±0.00 0.20±0.10 0.20±0.10 0.00±0.00
Minus Glucose Minus Glycerol Day 3 0.00±0.00 0.90±0.10 1.00±0.00 0.00±0.00 Day 5 0.00±0.00 1.63±0.15 0.63±0.25 0.00±0.00 Day 7 0.00±0.00 0.50±0.10 0.37±0.32 0.00±0.00
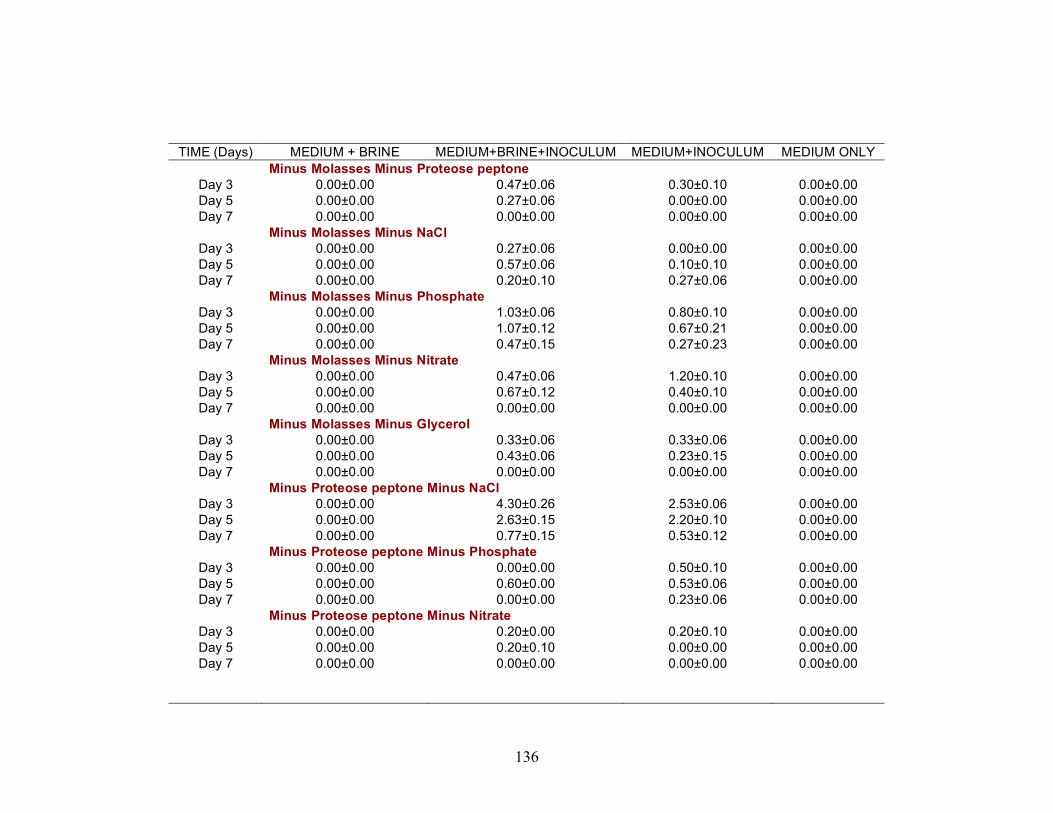
136
TIME (Days) MEDIUM + BRINE MEDIUM+BRINE+INOCULUM MEDIUM+INOCULUM MEDIUM ONLY Minus Molasses Minus Proteose peptone
Day 3 0.00±0.00 0.47±0.06 0.30±0.10 0.00±0.00 Day 5 0.00±0.00 0.27±0.06 0.00±0.00 0.00±0.00 Day 7 0.00±0.00 0.00±0.00 0.00±0.00 0.00±0.00
Minus Molasses Minus NaCl Day 3 0.00±0.00 0.27±0.06 0.00±0.00 0.00±0.00 Day 5 0.00±0.00 0.57±0.06 0.10±0.10 0.00±0.00 Day 7 0.00±0.00 0.20±0.10 0.27±0.06 0.00±0.00
Minus Molasses Minus Phosphate Day 3 0.00±0.00 1.03±0.06 0.80±0.10 0.00±0.00 Day 5 0.00±0.00 1.07±0.12 0.67±0.21 0.00±0.00 Day 7 0.00±0.00 0.47±0.15 0.27±0.23 0.00±0.00
Minus Molasses Minus Nitrate Day 3 0.00±0.00 0.47±0.06 1.20±0.10 0.00±0.00 Day 5 0.00±0.00 0.67±0.12 0.40±0.10 0.00±0.00 Day 7 0.00±0.00 0.00±0.00 0.00±0.00 0.00±0.00
Minus Molasses Minus Glycerol Day 3 0.00±0.00 0.33±0.06 0.33±0.06 0.00±0.00 Day 5 0.00±0.00 0.43±0.06 0.23±0.15 0.00±0.00 Day 7 0.00±0.00 0.00±0.00 0.00±0.00 0.00±0.00
Minus Proteose peptone Minus NaCl Day 3 0.00±0.00 4.30±0.26 2.53±0.06 0.00±0.00 Day 5 0.00±0.00 2.63±0.15 2.20±0.10 0.00±0.00 Day 7 0.00±0.00 0.77±0.15 0.53±0.12 0.00±0.00
Minus Proteose peptone Minus Phosphate Day 3 0.00±0.00 0.00±0.00 0.50±0.10 0.00±0.00 Day 5 0.00±0.00 0.60±0.00 0.53±0.06 0.00±0.00 Day 7 0.00±0.00 0.00±0.00 0.23±0.06 0.00±0.00
Minus Proteose peptone Minus Nitrate Day 3 0.00±0.00 0.20±0.00 0.20±0.10 0.00±0.00 Day 5 0.00±0.00 0.20±0.10 0.00±0.00 0.00±0.00 Day 7 0.00±0.00 0.00±0.00 0.00±0.00 0.00±0.00

137
TIME (Days) MEDIUM + BRINE MEDIUM+BRINE+INOCULUM MEDIUM+INOCULUM MEDIUM ONLY Minus Proteose peptone Minus Glycerol
Day 3 0.00±0.00 0.13±0.06 0.30±0.10 0.00±0.00 Day 5 0.00±0.00 0.20±0.00 0.33±0.15 0.00±0.00 Day 7 0.00±0.00 0.00±0.00 0.17±0.06 0.00±0.00
Minus Glycerol Minus NaCl Day 3 0.00±0.00 0.30±0.10 1.43±0.21 0.00±0.00 Day 5 0.00±0.00 0.47±0.15 0.80±0.10 0.00±0.00 Day 7 0.00±0.00 0.00±0.00 0.00±0.00 0.00±0.00
Minus Glycerol Minus Phosphate Day 3 0.00±0.00 1.30±0.17 2.47±0.12 0.00±0.00 Day 5 0.00±0.00 1.53±0.06 1.50±0.30 0.00±0.00 Day 7 0.00±0.00 0.67±0.21 0.53±0.06 0.00±0.00
Minus Glycerol Minus Nitrate Day 3 0.00±0.00 0.30±0.10 0.50±0.10 0.00±0.00 Day 5 0.00±0.00 0.33±0.15 0.40±0.10 0.00±0.00 Day 7 0.00±0.00 0.50±0.10 0.00±0.00 0.00±0.00

138
Table 23. Biosurfactant production a single nutrient component added for Earlsboro formation fluids.
Oil Spreading (cm) for the optimal aerobic nutrient treatment package TIME (Days) MEDIUM+BRINE MEDIUM+BRINE+INOCULUM MEDIUM+INOCULUM MEDIUM ONLY
Glucose only Day 3 0.00±0.00 0.00±0.00 0.13±0.06 0.00±0.00 Day 5 0.00±0.00 0.00±0.00 0.13±0.12 0.00±0.00 Day 7 0.00±0.00 0.00±0.00 0.10±0.00 0.00±0.00
Molasses only Day 3 0.00±0.00 0.00±0.00 0.20±0.00 0.00±0.00 Day 5 0.00±0.00 0.00±0.00 0.00±0.00 0.00±0.00 Day 7 0.00±0.00 0.00±0.00 0.00±0.00 0.00±0.00
Protoese peptone only Day 3 0.00±0.00 0.60±0.17 0.53±0.06 0.00±0.00 Day 5 0.00±0.00 0.53±0.06 0.30±0.10 0.00±0.00 Day 7 0.00±0.00 0.00±0.00 0.00±0.00 0.00±0.00
Glycerol only Day 3 0.00±0.00 0.20±0.10 0.33±0.06 0.00±0.00 Day 5 0.00±0.00 0.00±0.00 0.20±0.00 0.00±0.00 Day 7 0.00±0.00 0.00±0.00 0.00±0.00 0.00±0.00
Phosphate only Day 3 0.00±0.00 0.00±0.00 0.00±0.00 0.00±0.00 Day 5 0.00±0.00 0.00±0.00 0.00±0.00 0.00±0.00 Day 7 0.00±0.00 0.00±0.00 0.00±0.00 0.00±0.00
Nitrate only Day 3 0.00±0.00 0.00±0.00 0.00±0.00 0.00±0.00 Day 5 0.00±0.00 0.00±0.00 0.00±0.00 0.00±0.00 Day 7 0.00±0.00 0.00±0.00 0.00±0.00 0.00±0.00

139
Table 24. Biosurfactant production with double nutrient components added for Earlsboro formation fluids.
Oil Spreading (cm) for the optimal aerobic nutrient treatment package TIME (Days) MEDIUM + BRINE MEDIUM+BRINE+INOCULUM MEDIUM+INOCULUM MEDIUM ONLY
Plus Glucose Plus Proteose peptone Day 3 0.00±0.00 0.63±0.06 0.60±0.10 0.00±0.00 Day 5 0.00±0.00 2.10±0.10 0.90±0.17 0.00±0.00 Day 7 0.00±0.00 1.00±0.10 0.17±0.06 0.00±0.00
Plus Glucose Plus Molasses Day 3 0.00±0.00 0.00±v 0.40±0.00 0.00±0.00 Day 5 0.00±0.00 0.00±0.00 0.00±0.00 0.00±0.00 Day 7 0.00±0.00 0.00±0.00 0.00±0.00 0.00±0.00
Plus Glucose Plus NaCl Day 3 0.00±0.00 0.37±0.06 0.30±0.26 0.00±0.00 Day 5 0.00±0.00 0.43±0.12 0.20±0.10 0.00±0.00 Day 7 0.00±0.00 0.13±0.06 0.00±0.00 0.00±0.00
Plus Glucose Plus Phosphate Day 3 0.00±0.00 0.17±0.06 0.00±0.00 0.00±0.00 Day 5 0.00±0.00 0.20±0.10 0.00±0.00 0.00±0.00 Day 7 0.00±0.00 0.00±0.00 0.00±0.00 0.00±0.00
Plus Glucose Plus Nitrate Day 3 0.00±0.00 0.23±0.06 0.00±0.00 0.00±0.00 Day 5 0.00±0.00 0.17±0.15 0.00±0.00 0.00±0.00 Day 7 0.00±0.00 0.00±0.00 0.00±0.00 0.00±0.00
Plus Glucose Plus Glycerol Day 3 0.00±0.00 0.13±0.06 0.00±0.00 0.00±0.00 Day 5 0.00±0.00 0.27±0.06 0.00±0.00 0.00±0.00 Day 7 0.00±0.00 0.00±0.00 0.00±0.00 0.00±0.00
Plus Molasses Plus Proteose peptone Day 3 0.00±0.00 0.60±0.10 0.53±0.06 0.00±0.00 Day 5 0.00±0.00 0.50±0.10 4.77±0.74 0.00±0.00 Day 7 0.00±0.00 0.23±0.15 1.20±0.40 0.00±0.00

140
TIME (Days) MEDIUM + BRINE MEDIUM+BRINE+INOCULUM MEDIUM+INOCULUM MEDIUM ONLY Plus Molasses Plus NaCl
Day 3 0.00±0.00 0.00±0.00 0.57±0.06 0.00±0.00 Day 5 0.00±0.00 0.00±0.00 0.83±0.21 0.00±0.00 Day 7 0.00±0.00 0.00±0.00 0.50±0.10 0.00±0.00
Plus Molasses Plus Nitrate Day 3 0.00±0.00 1.63±0.15 2.43±0.80 0.00±0.00 Day 5 0.00±0.00 2.17±0.06 2.93±0.21 0.00±0.00 Day 7 0.00±0.00 1.27±0.21 3.53±0.45 0.00±0.00
Plus Molasses Plus Phosphate Day 3 0.00±0.00 0.10±0.10 0.00±0.00 0.00±0.00 Day 5 0.00±0.00 0.00±0.00 0.00±0.00 0.00±0.00 Day 7 0.00±0.00 0.00±0.00 0.00±0.00 0.00±0.00
Plus Molasses Plus Glycerol Day 3 0.00±0.00 0.37±0.06 0.00±0.00 0.00±0.00 Day 5 0.00±0.00 0.17±0.06 0.00±0.00 0.00±0.00 Day 7 0.00±0.00 0.00±0.00 0.00±0.00 0.00±0.00
Plus Proteose peptone Plus NaCl Day 3 0.00±0.00 0.47±0.15 0.53±0.06 0.00±0.00 Day 5 0.00±0.00 0.30±0.10 0.20±0.10 0.00±0.00 Day 7 0.00±0.00 0.00±0.00 0.00±0.00 0.00±0.00
Plus Proteose peptone Plus Nitrate Day 3 0.00±0.00 0.53±0.06 0.47±0.06 0.00±0.00 Day 5 0.00±0.00 0.60±0.00 0.00±0.00 0.00±0.00 Day 7 0.00±0.00 0.30±0.00 0.00±0.00 0.00±0.00
Plus Proteose peptone Plus Phosphate Day 3 0.00±0.00 0.00±0.00 0.00±0.00 0.00±0.00 Day 5 0.00±0.00 0.00±0.00 0.00±0.00 0.00±0.00 Day 7 0.00±0.00 0.00±0.00 0.00±0.00 0.00±0.00
Plus Proteose peptone Plus Glycerol Day 3 0.00±0.00 0.00±0.00 0.00±0.00 0.00±0.00 Day 5 0.00±0.00 0.00±0.00 0.00±0.00 0.00±0.00 Day 7 0.00±0.00 0.00±0.00 0.00±0.00 0.00±0.00

141
TIME (Days) MEDIUM + BRINE MEDIUM+BRINE+INOCULUM MEDIUM+INOCULUM MEDIUM ONLY Plus Glycerol Plus NaCl
Day 3 0.00±0.00 0.00±0.00 0.00±0.00 0.00±0.00 Day 5 0.00±0.00 0.00±0.00 0.00±0.00 0.00±0.00 Day 7 0.00±0.00 0.00±0.00 0.00±0.00 0.00±0.00
Plus Glycerol Plus Nitrate Day 3 0.00±0.00 0.00±0.00 0.27±0.00 0.00±0.00 Day 5 0.00±0.00 0.00±0.00 0.17±0.06 0.00±0.00 Day 7 0.00±0.00 0.00±0.00 0.130.06 0.00±0.00
Plus Glycerol Plus Phosphate Day 3 0.00±0.00 0.00±0.00 0.00±0.00 0.00±0.00 Day 5 0.00±0.00 0.00±0.00 0.00±0.00 0.00±0.00 Day 7 0.00±0.00 0.00±0.00 0.00±0.00 0.00±0.00
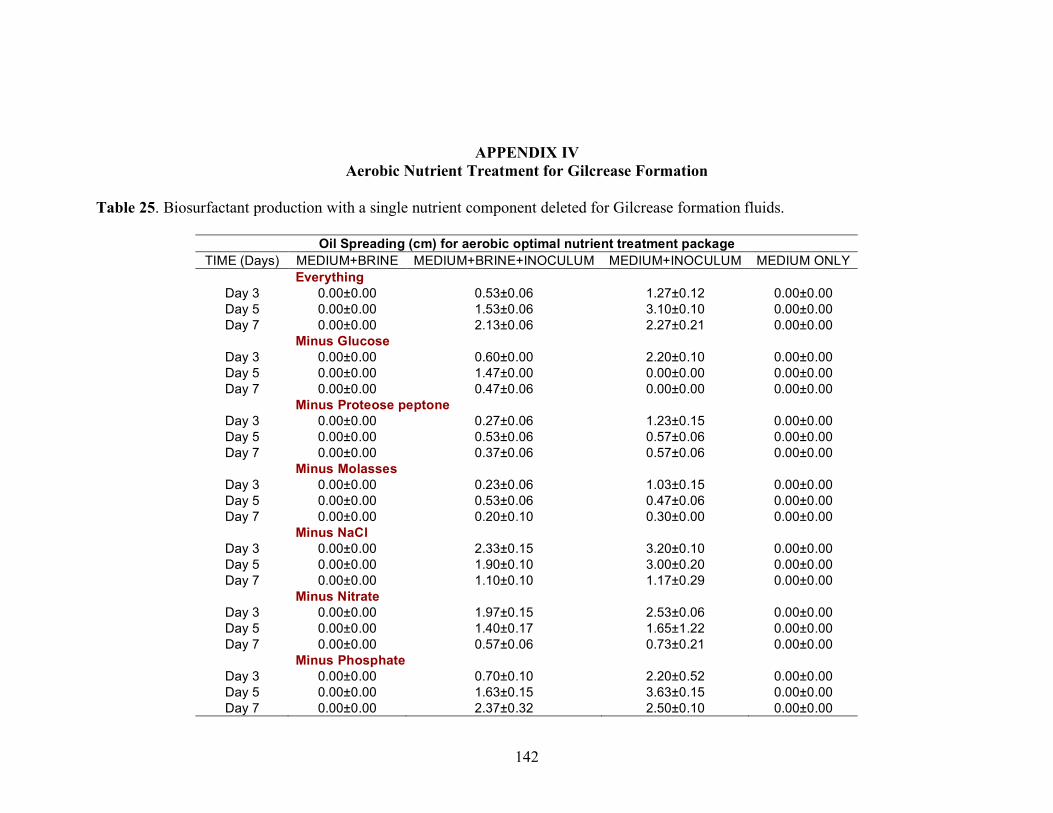
142
APPENDIX IV Aerobic Nutrient Treatment for Gilcrease Formation
Table 25. Biosurfactant production with a single nutrient component deleted for Gilcrease formation fluids.
Oil Spreading (cm) for aerobic optimal nutrient treatment package TIME (Days) MEDIUM+BRINE MEDIUM+BRINE+INOCULUM MEDIUM+INOCULUM MEDIUM ONLY
Everything Day 3 0.00±0.00 0.53±0.06 1.27±0.12 0.00±0.00 Day 5 0.00±0.00 1.53±0.06 3.10±0.10 0.00±0.00 Day 7 0.00±0.00 2.13±0.06 2.27±0.21 0.00±0.00
Minus Glucose Day 3 0.00±0.00 0.60±0.00 2.20±0.10 0.00±0.00 Day 5 0.00±0.00 1.47±0.00 0.00±0.00 0.00±0.00 Day 7 0.00±0.00 0.47±0.06 0.00±0.00 0.00±0.00
Minus Proteose peptone Day 3 0.00±0.00 0.27±0.06 1.23±0.15 0.00±0.00 Day 5 0.00±0.00 0.53±0.06 0.57±0.06 0.00±0.00 Day 7 0.00±0.00 0.37±0.06 0.57±0.06 0.00±0.00
Minus Molasses Day 3 0.00±0.00 0.23±0.06 1.03±0.15 0.00±0.00 Day 5 0.00±0.00 0.53±0.06 0.47±0.06 0.00±0.00 Day 7 0.00±0.00 0.20±0.10 0.30±0.00 0.00±0.00
Minus NaCl Day 3 0.00±0.00 2.33±0.15 3.20±0.10 0.00±0.00 Day 5 0.00±0.00 1.90±0.10 3.00±0.20 0.00±0.00 Day 7 0.00±0.00 1.10±0.10 1.17±0.29 0.00±0.00
Minus Nitrate Day 3 0.00±0.00 1.97±0.15 2.53±0.06 0.00±0.00 Day 5 0.00±0.00 1.40±0.17 1.65±1.22 0.00±0.00 Day 7 0.00±0.00 0.57±0.06 0.73±0.21 0.00±0.00
Minus Phosphate Day 3 0.00±0.00 0.70±0.10 2.20±0.52 0.00±0.00 Day 5 0.00±0.00 1.63±0.15 3.63±0.15 0.00±0.00 Day 7 0.00±0.00 2.37±0.32 2.50±0.10 0.00±0.00
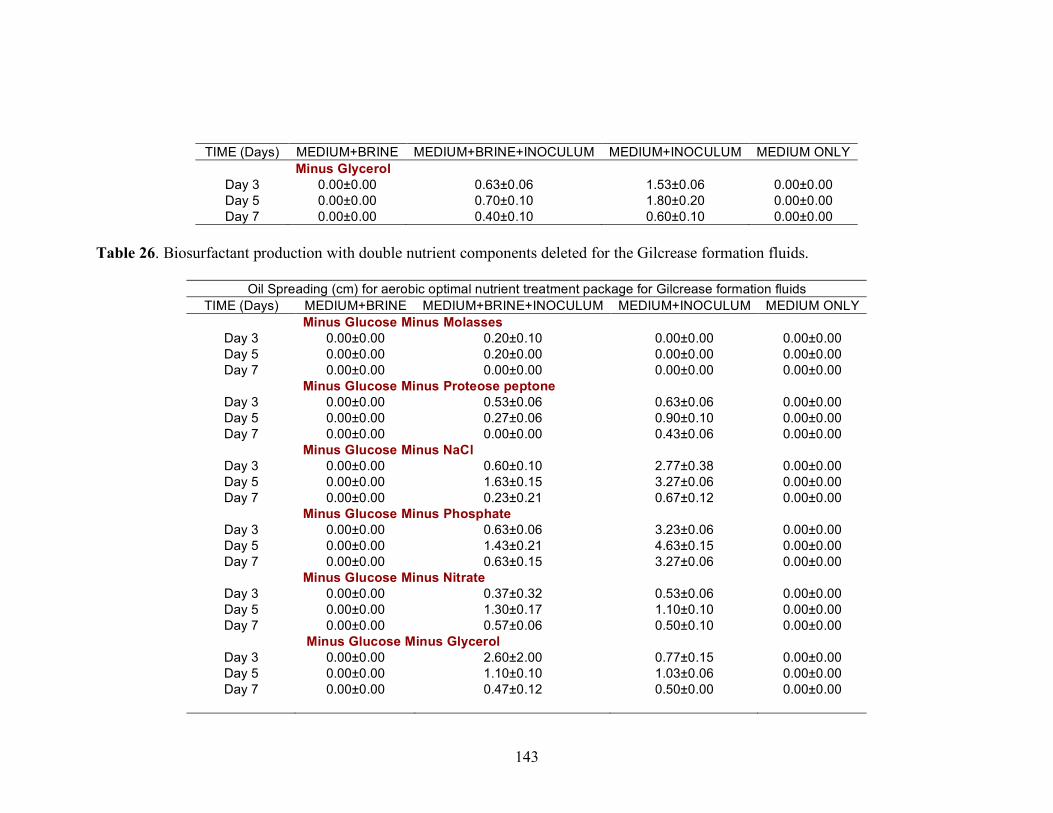
143
TIME (Days) MEDIUM+BRINE MEDIUM+BRINE+INOCULUM MEDIUM+INOCULUM MEDIUM ONLY Minus Glycerol
Day 3 0.00±0.00 0.63±0.06 1.53±0.06 0.00±0.00 Day 5 0.00±0.00 0.70±0.10 1.80±0.20 0.00±0.00 Day 7 0.00±0.00 0.40±0.10 0.60±0.10 0.00±0.00
Table 26. Biosurfactant production with double nutrient components deleted for the Gilcrease formation fluids.
Oil Spreading (cm) for aerobic optimal nutrient treatment package for Gilcrease formation fluids TIME (Days) MEDIUM+BRINE MEDIUM+BRINE+INOCULUM MEDIUM+INOCULUM MEDIUM ONLY
Minus Glucose Minus Molasses Day 3 0.00±0.00 0.20±0.10 0.00±0.00 0.00±0.00 Day 5 0.00±0.00 0.20±0.00 0.00±0.00 0.00±0.00 Day 7 0.00±0.00 0.00±0.00 0.00±0.00 0.00±0.00
Minus Glucose Minus Proteose peptone Day 3 0.00±0.00 0.53±0.06 0.63±0.06 0.00±0.00 Day 5 0.00±0.00 0.27±0.06 0.90±0.10 0.00±0.00 Day 7 0.00±0.00 0.00±0.00 0.43±0.06 0.00±0.00
Minus Glucose Minus NaCl Day 3 0.00±0.00 0.60±0.10 2.77±0.38 0.00±0.00 Day 5 0.00±0.00 1.63±0.15 3.27±0.06 0.00±0.00 Day 7 0.00±0.00 0.23±0.21 0.67±0.12 0.00±0.00
Minus Glucose Minus Phosphate Day 3 0.00±0.00 0.63±0.06 3.23±0.06 0.00±0.00 Day 5 0.00±0.00 1.43±0.21 4.63±0.15 0.00±0.00 Day 7 0.00±0.00 0.63±0.15 3.27±0.06 0.00±0.00
Minus Glucose Minus Nitrate Day 3 0.00±0.00 0.37±0.32 0.53±0.06 0.00±0.00 Day 5 0.00±0.00 1.30±0.17 1.10±0.10 0.00±0.00 Day 7 0.00±0.00 0.57±0.06 0.50±0.10 0.00±0.00
Minus Glucose Minus Glycerol Day 3 0.00±0.00 2.60±2.00 0.77±0.15 0.00±0.00 Day 5 0.00±0.00 1.10±0.10 1.03±0.06 0.00±0.00 Day 7 0.00±0.00 0.47±0.12 0.50±0.00 0.00±0.00
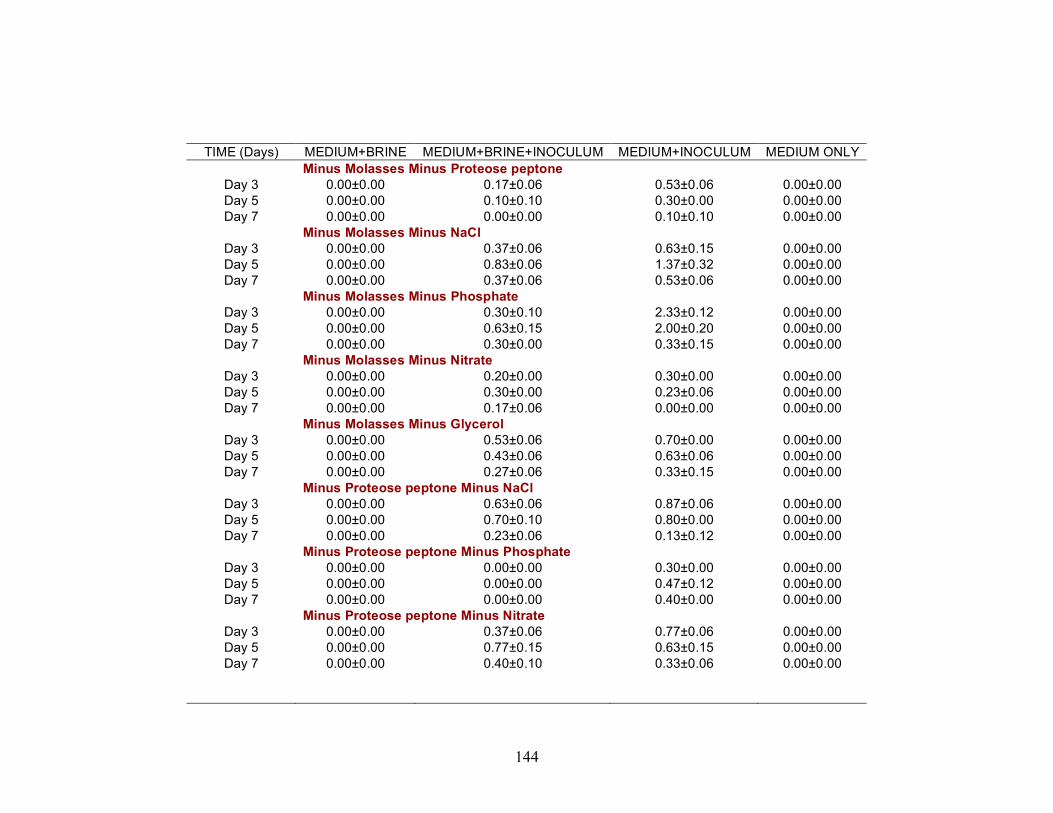
144
TIME (Days) MEDIUM+BRINE MEDIUM+BRINE+INOCULUM MEDIUM+INOCULUM MEDIUM ONLY Minus Molasses Minus Proteose peptone
Day 3 0.00±0.00 0.17±0.06 0.53±0.06 0.00±0.00 Day 5 0.00±0.00 0.10±0.10 0.30±0.00 0.00±0.00 Day 7 0.00±0.00 0.00±0.00 0.10±0.10 0.00±0.00
Minus Molasses Minus NaCl Day 3 0.00±0.00 0.37±0.06 0.63±0.15 0.00±0.00 Day 5 0.00±0.00 0.83±0.06 1.37±0.32 0.00±0.00 Day 7 0.00±0.00 0.37±0.06 0.53±0.06 0.00±0.00
Minus Molasses Minus Phosphate Day 3 0.00±0.00 0.30±0.10 2.33±0.12 0.00±0.00 Day 5 0.00±0.00 0.63±0.15 2.00±0.20 0.00±0.00 Day 7 0.00±0.00 0.30±0.00 0.33±0.15 0.00±0.00
Minus Molasses Minus Nitrate Day 3 0.00±0.00 0.20±0.00 0.30±0.00 0.00±0.00 Day 5 0.00±0.00 0.30±0.00 0.23±0.06 0.00±0.00 Day 7 0.00±0.00 0.17±0.06 0.00±0.00 0.00±0.00
Minus Molasses Minus Glycerol Day 3 0.00±0.00 0.53±0.06 0.70±0.00 0.00±0.00 Day 5 0.00±0.00 0.43±0.06 0.63±0.06 0.00±0.00 Day 7 0.00±0.00 0.27±0.06 0.33±0.15 0.00±0.00
Minus Proteose peptone Minus NaCl Day 3 0.00±0.00 0.63±0.06 0.87±0.06 0.00±0.00 Day 5 0.00±0.00 0.70±0.10 0.80±0.00 0.00±0.00 Day 7 0.00±0.00 0.23±0.06 0.13±0.12 0.00±0.00
Minus Proteose peptone Minus Phosphate Day 3 0.00±0.00 0.00±0.00 0.30±0.00 0.00±0.00 Day 5 0.00±0.00 0.00±0.00 0.47±0.12 0.00±0.00 Day 7 0.00±0.00 0.00±0.00 0.40±0.00 0.00±0.00
Minus Proteose peptone Minus Nitrate Day 3 0.00±0.00 0.37±0.06 0.77±0.06 0.00±0.00 Day 5 0.00±0.00 0.77±0.15 0.63±0.15 0.00±0.00 Day 7 0.00±0.00 0.40±0.10 0.33±0.06 0.00±0.00

145
TIME (Days) MEDIUM+BRINE MEDIUM+BRINE+INOCULUM MEDIUM+INOCULUM MEDIUM ONLY Minus Proteose peptone Minus Glycerol
Day 3 0.00±0.00 0.37±0.06 0.80±0.00 0.00±0.00 Day 5 0.00±0.00 0.47±0.12 1.03±0.00 0.00±0.00 Day 7 0.00±0.00 0.57±0.06 0.33±0.15 0.00±0.00
Minus Glycerol Minus NaCl Day 3 0.00±0.00 0.53±0.00 2.53±0.64 0.00±0.00 Day 5 0.00±0.00 1.00±0.00 2.80±0.20 0.00±0.00 Day 7 0.00±0.00 0.20±0.10 0.00±0.00 0.00±0.00
Minus Glycerol Minus PO4 Day 3 0.00±0.00 0.43±0.06 1.87±0.12 0.00±0.00 Day 5 0.00±0.00 0.77±0.15 1.63±0.15 0.00±0.00 Day 7 0.00±0.00 0.53±0.06 1.10±0.10 0.00±0.00
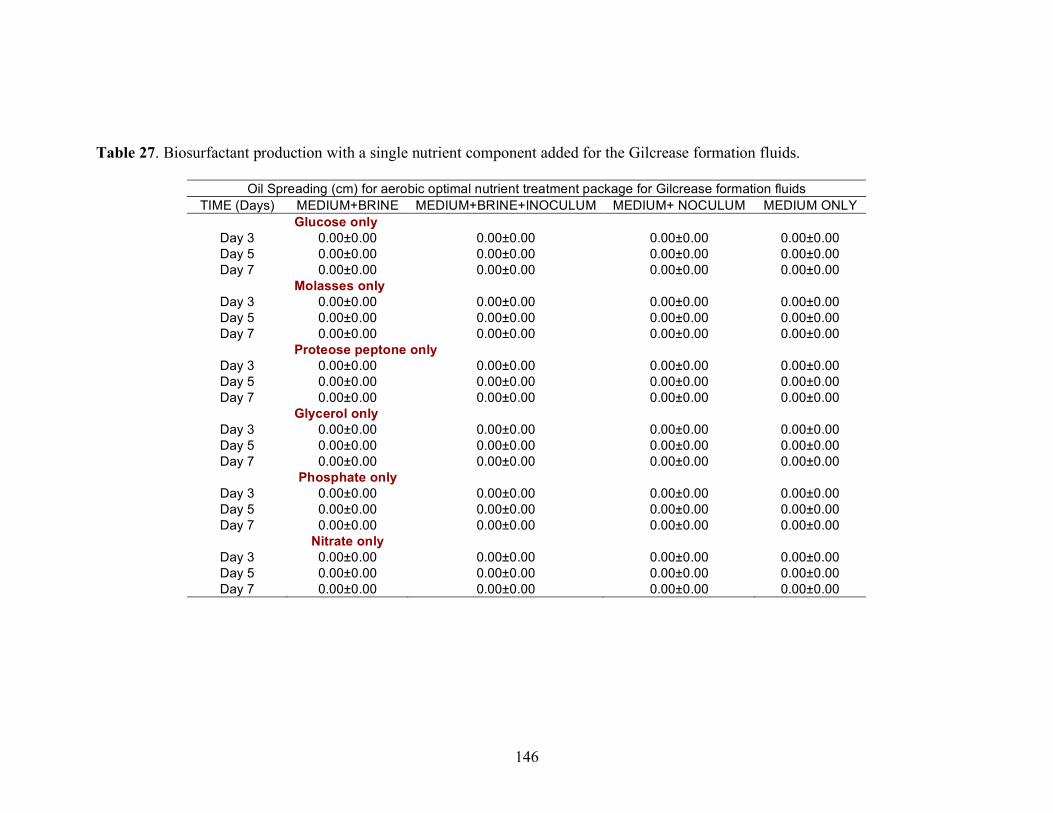
146
Table 27. Biosurfactant production with a single nutrient component added for the Gilcrease formation fluids.
Oil Spreading (cm) for aerobic optimal nutrient treatment package for Gilcrease formation fluids TIME (Days) MEDIUM+BRINE MEDIUM+BRINE+INOCULUM MEDIUM+ NOCULUM MEDIUM ONLY
Glucose only Day 3 0.00±0.00 0.00±0.00 0.00±0.00 0.00±0.00 Day 5 0.00±0.00 0.00±0.00 0.00±0.00 0.00±0.00 Day 7 0.00±0.00 0.00±0.00 0.00±0.00 0.00±0.00
Molasses only Day 3 0.00±0.00 0.00±0.00 0.00±0.00 0.00±0.00 Day 5 0.00±0.00 0.00±0.00 0.00±0.00 0.00±0.00 Day 7 0.00±0.00 0.00±0.00 0.00±0.00 0.00±0.00
Proteose peptone only Day 3 0.00±0.00 0.00±0.00 0.00±0.00 0.00±0.00 Day 5 0.00±0.00 0.00±0.00 0.00±0.00 0.00±0.00 Day 7 0.00±0.00 0.00±0.00 0.00±0.00 0.00±0.00
Glycerol only Day 3 0.00±0.00 0.00±0.00 0.00±0.00 0.00±0.00 Day 5 0.00±0.00 0.00±0.00 0.00±0.00 0.00±0.00 Day 7 0.00±0.00 0.00±0.00 0.00±0.00 0.00±0.00
Phosphate only Day 3 0.00±0.00 0.00±0.00 0.00±0.00 0.00±0.00 Day 5 0.00±0.00 0.00±0.00 0.00±0.00 0.00±0.00 Day 7 0.00±0.00 0.00±0.00 0.00±0.00 0.00±0.00
Nitrate only Day 3 0.00±0.00 0.00±0.00 0.00±0.00 0.00±0.00 Day 5 0.00±0.00 0.00±0.00 0.00±0.00 0.00±0.00 Day 7 0.00±0.00 0.00±0.00 0.00±0.00 0.00±0.00

147
Table 28. Biosurfactant production with double nutrient components added for the Gilcrease formation fluids.
Oil Spreading (cm) for aerobic optimal nutrient treatment package TIME (Days) MEDIUM + BRINE MEDIUM+BRINE+INOCULUM MEDIUM+INOCULUM MEDIUM ONLY
Plus Glucose Plus Proteose peptone Day 3 0.00±0.00 0.67±0.06 0.43±0.06 0.00±0.00 Day 5 0.00±0.00 2.00±0.20 1.03±0.21 0.00±0.00 Day 7 0.00±0.00 0.63±0.15 0.83±0.15 0.00±0.00
Plus Glucose Plus Molasses Day 3 0.00±0.00 0.20±0.10 0.27±0.06 0.00±0.00 Day 5 0.00±0.00 0.00±0.00 0.00±0.00 0.00±0.00 Day 7 0.00±0.00 0.00±0.00 0.00±0.00 0.00±0.00
Plus Glucose Plus NaCl Day 3 0.00±0.00 0.33±0.29 0.33±0.06 0.00±0.00 Day 5 0.00±0.00 0.23±0.06 0.37±0.06 0.00±0.00 Day 7 0.00±0.00 0.00±0.00 0.20±0.10 0.00±0.00
Plus Glucose Plus Phosphate Day 3 0.00±0.00 0.20±0.10 0.00±0.00 0.00±0.00 Day 5 0.00±0.00 0.20±0.00 0.00±0.00 0.00±0.00 Day 7 0.00±0.00 0.17±0.12 0.00±0.00 0.00±0.00
Plus Glucose Plus Nitrate Day 3 0.00±0.00 0.00±0.00 0.00±0.00 0.00±0.00 Day 5 0.00±0.00 0.00±0.00 0.00±0.00 0.00±0.00 Day 7 0.00±0.00 0.00±0.00 0.00±0.00 0.00±0.00
Plus Glucose Plus Glycerol Day 3 0.00±0.00 0.00±0.00 0.00±0.00 0.00±0.00 Day 5 0.00±0.00 0.00±0.00 0.00±0.00 0.00±0.00 Day 7 0.00±0.00 0.00±0.00 0.00±0.00 0.00±0.00
Plus Molasses Plus Proteose peptone Day 3 0.00±0.00 0.77±0.15 0.90±0.10 0.00±0.00 Day 5 0.00±0.00 1.07±0.06 1.27±0.21 0.00±0.00 Day 7 0.00±0.00 0.57±0.06 0.97±0.21 0.00±0.00

148
TIME (Days) MEDIUM + BRINE MEDIUM+BRINE+INOCULUM MEDIUM+INOCULUM MEDIUM ONLY Plus Molasses Plus NaCl
Day 3 0.00±0.00 0.53±0.06 0.83±0.06 0.00±0.00 Day 5 0.00±0.00 1.07±0.06 1.40±0.17 0.00±0.00 Day 7 0.00±0.00 0.43±0.06 0.53±0.00 0.00±0.00
Plus Molasses Plus Nitrate Day 3 0.00±0.00 1.80±0.20 1.87±0.12 0.00±0.00 Day 5 0.00±0.00 2.97±0.25 3.27±0.06 0.00±0.00 Day 7 0.00±0.00 3.17±0.15 3.37±0.23 0.00±0.00
Plus Molasses Plus Phosphate Day 3 0.00±0.00 0.40±0.10 0.60±0.20 0.00±0.00 Day 5 0.00±0.00 0.53±0.06 0.70±0.17 0.00±0.00 Day 7 0.00±0.00 0.30±0.10 0.20±0.00 0.00±0.00
Plus Molasses Plus Glycerol Day 3 0.00±0.00 1.53±0.06 1.33±0.12 0.00±0.00 Day 5 0.00±0.00 1.13±0.12 2.37±0.32 0.00±0.00 Day 7 0.00±0.00 1.40±0.35 1.93±0.12 0.00±0.00
Plus Proteose peptone Plus NaCl Day 3 0.00±0.00 0.17 0.27 0.00 Day 5 0.00±0.00 0.10 0.20 0.00 Day 7 0.00±0.00 0.00 0.00 0.00
Plus Proteose peptone Plus Nitrate
Day 3 0.00±0.00 0.00±0.00 0.37±0.06 0.00±0.00 Day 5 0.00±0.00 0.20±0.00 0.17±0.06 0.00±0.00 Day 7 0.00±0.00 0.00±0.00 0.00±0.00 0.00±0.00
Plus Proteose peptone Plus Phosphate Day 3 0.00±0.00 0.00±0.00 0.13±0.06 0.00±0.00 Day 5 0.00±0.00 0.00±0.00 0.10±0.10 0.00±0.00 Day 7 0.00±0.00 0.00±0.00 0.00±0.00 0.00±0.00
Plus Proteose peptone Plus Glycerol DAY3 0.00±0.00 0.00±0.00 0.00±0.00 0.00±0.00 DAY5 0.00±0.00 0.00±0.00 0.00±0.00 0.00±0.00 DAY7 0.00±0.00 0.00±0.00 0.00±0.00 0.00±0.00
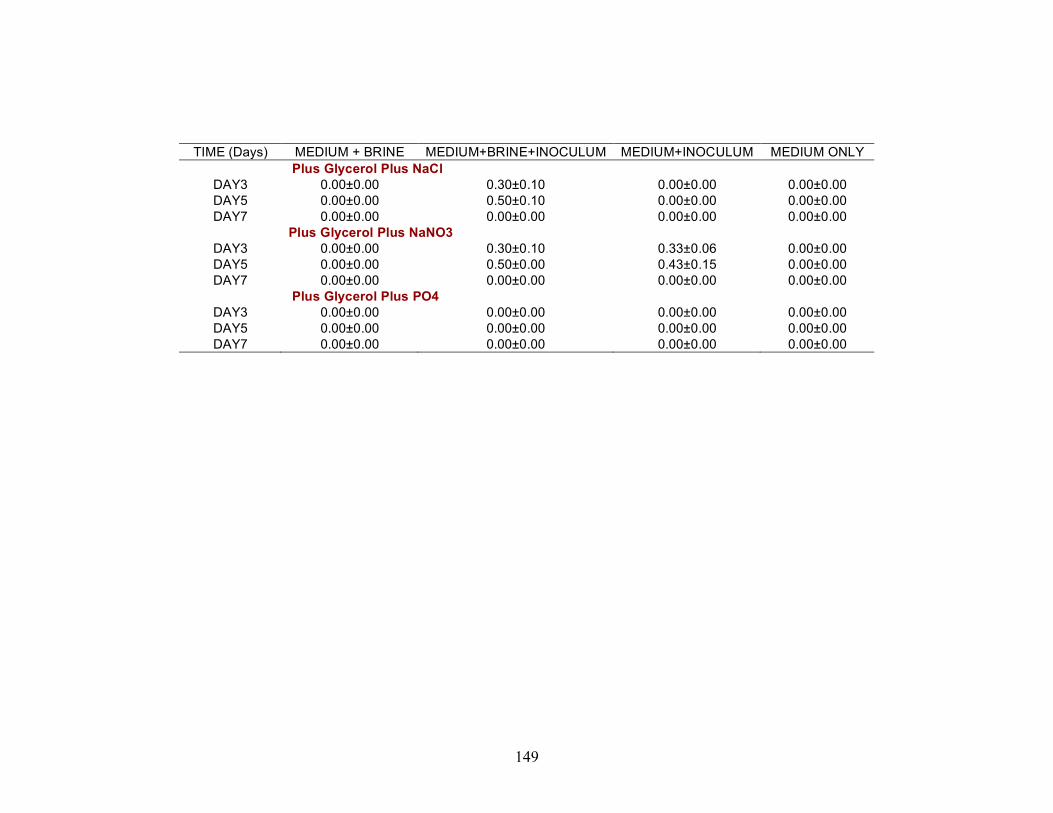
149
TIME (Days) MEDIUM + BRINE MEDIUM+BRINE+INOCULUM MEDIUM+INOCULUM MEDIUM ONLY Plus Glycerol Plus NaCl
DAY3 0.00±0.00 0.30±0.10 0.00±0.00 0.00±0.00 DAY5 0.00±0.00 0.50±0.10 0.00±0.00 0.00±0.00 DAY7 0.00±0.00 0.00±0.00 0.00±0.00 0.00±0.00
Plus Glycerol Plus NaNO3 DAY3 0.00±0.00 0.30±0.10 0.33±0.06 0.00±0.00 DAY5 0.00±0.00 0.50±0.00 0.43±0.15 0.00±0.00 DAY7 0.00±0.00 0.00±0.00 0.00±0.00 0.00±0.00
Plus Glycerol Plus PO4 DAY3 0.00±0.00 0.00±0.00 0.00±0.00 0.00±0.00 DAY5 0.00±0.00 0.00±0.00 0.00±0.00 0.00±0.00 DAY7 0.00±0.00 0.00±0.00 0.00±0.00 0.00±0.00
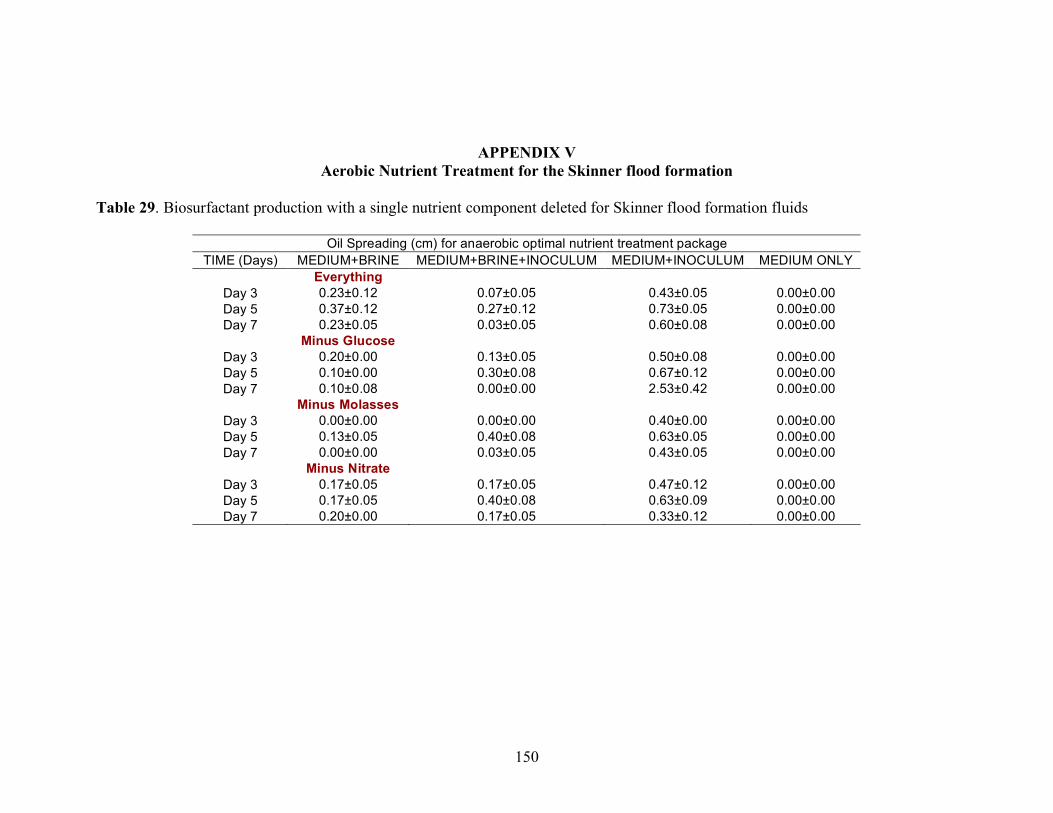
150
APPENDIX V Aerobic Nutrient Treatment for the Skinner flood formation
Table 29. Biosurfactant production with a single nutrient component deleted for Skinner flood formation fluids
Oil Spreading (cm) for anaerobic optimal nutrient treatment package TIME (Days) MEDIUM+BRINE MEDIUM+BRINE+INOCULUM MEDIUM+INOCULUM MEDIUM ONLY
Everything Day 3 0.23±0.12 0.07±0.05 0.43±0.05 0.00±0.00 Day 5 0.37±0.12 0.27±0.12 0.73±0.05 0.00±0.00 Day 7 0.23±0.05 0.03±0.05 0.60±0.08 0.00±0.00
Minus Glucose Day 3 0.20±0.00 0.13±0.05 0.50±0.08 0.00±0.00 Day 5 0.10±0.00 0.30±0.08 0.67±0.12 0.00±0.00 Day 7 0.10±0.08 0.00±0.00 2.53±0.42 0.00±0.00
Minus Molasses Day 3 0.00±0.00 0.00±0.00 0.40±0.00 0.00±0.00 Day 5 0.13±0.05 0.40±0.08 0.63±0.05 0.00±0.00 Day 7 0.00±0.00 0.03±0.05 0.43±0.05 0.00±0.00
Minus Nitrate Day 3 0.17±0.05 0.17±0.05 0.47±0.12 0.00±0.00 Day 5 0.17±0.05 0.40±0.08 0.63±0.09 0.00±0.00 Day 7 0.20±0.00 0.17±0.05 0.33±0.12 0.00±0.00

151
Table 30. Biosurfactant production with a single nutrient component added for Skinner flood formation fluids
Oil Spreading (cm) for anaerobic optimal nutrient treatment package TIME (Days) MEDIUM+BRINE MEDIUM+BRINE+INOCULUM MEDIUM+INOCULUM MEDIUM ONLY
Molasses only Day 3 0.13±0.05 0.10±0.00 0.33±0.05 0.00±0.00 Day 5 0.10±0.00 0.37±0.05 0.53±0.05 0.00±0.00 Day 7 0.20±0.00 0.13±0.05 0.40±0.00 0.00±0.00
Glucose only Day 3 0.03±0.05 0.10±0.14 0.23±0.05 0.00±0.00 Day 5 0.10±0.08 0.13±0.19 0.47±0.05 0.00±0.00 Day 7 0.00±0.00 0.07±0.09 0.37±0.09 0.00±0.00

152
APPENDIX VI Anaerobic Nutrient Treatment for Hunton Formation
Table 31. Biosurfactant production with a single nutrient component deleted for Hunton formation fluids.
Oil Spreading (cm) for anaerobic optimal nutrient treatment package TIME (Days) MEDIUM+BRINE MEDIUM+BRINE+INOCULUM MEDIUM+INOCULUM MEDIUM ONLY Everything
Day 3 0.13±0.06 0.47±0.06 0.53±0.06 0.00±0.00 Day 5 0.10±0.00 0.57±0.06 0.63±0.06 0.00±0.00 Day 7 0.00±0.00 0.40±0.00 0.37±0.06 0.00±0.00 Day 14 0.00±0.00 0.30±0.00 0.33±0.06 0.00±0.00
Minus Glucose Day 3 0.20±0.00 0.43±0.05 0.47±0.09 0.00±0.00 Day 5 0.27±0.09 0.30±0.00 0.10±0.14 0.00±0.00 Day 7 0.13±0.09 0.37±0.05 0.33±0.12 0.00±0.00 Day 14 0.23±0.15 1.00±0.20 0.67±0.12 0.00±0.00
Minus Molasses Day 3 0.03±0.05 0.20±0.00 0.47±0.05 0.00±0.00 Day 5 0.07±0.05 0.13±0.05 0.07±0.09 0.00±0.00 Day 7 0.10±0.00 0.03±0.05 0.03±0.05 0.00±0.00 Day 14 0.20±0.00 0.53±0.12 0.70±0.10 0.00±0.00
Minus Nitrate Day 3 0.00±0.00 0.63±0.05 0.73±0.05 0.00±0.00 Day 5 0.20±0.16 0.20±0.08 0.07±0.05 0.00±0.00 Day 7 0.17±0.09 0.13±0.05 0.17±0.05 0.00±0.00 Day 14 0.13±0.06 0.57±0.06 0.47±0.06 0.00±0.00
Minus Metals Day 3 0.00±0.00 0.57±0.26 0.20±0.00 0.00±0.00 Day 5 0.00±0.00 0.00±0.00 0.23±0.05 0.00±0.00 Day 7 0.10±0.14 0.17±0.05 0.10±0.00 0.00±0.00 Day 14 0.23±0.06 0.40±0.00 0.57±0.06 0.00±0.00
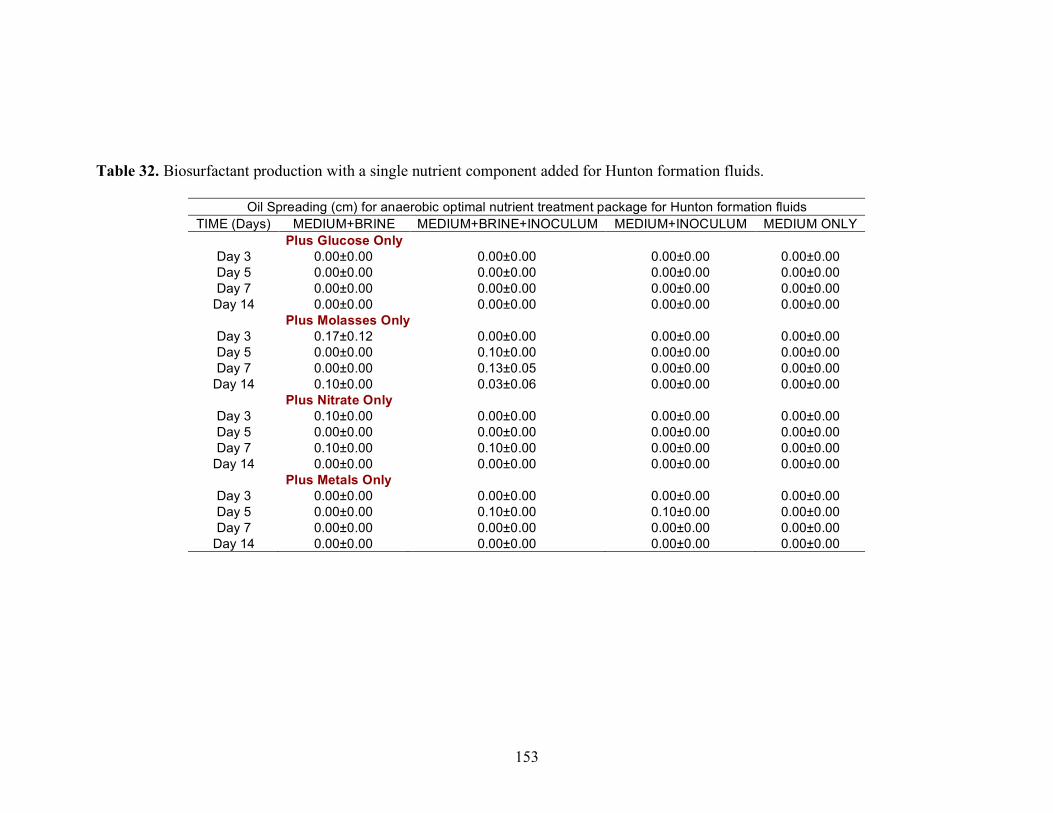
153
Table 32. Biosurfactant production with a single nutrient component added for Hunton formation fluids.
Oil Spreading (cm) for anaerobic optimal nutrient treatment package for Hunton formation fluids TIME (Days) MEDIUM+BRINE MEDIUM+BRINE+INOCULUM MEDIUM+INOCULUM MEDIUM ONLY Plus Glucose Only
Day 3 0.00±0.00 0.00±0.00 0.00±0.00 0.00±0.00 Day 5 0.00±0.00 0.00±0.00 0.00±0.00 0.00±0.00 Day 7 0.00±0.00 0.00±0.00 0.00±0.00 0.00±0.00
Day 14 0.00±0.00 0.00±0.00 0.00±0.00 0.00±0.00 Plus Molasses Only
Day 3 0.17±0.12 0.00±0.00 0.00±0.00 0.00±0.00 Day 5 0.00±0.00 0.10±0.00 0.00±0.00 0.00±0.00 Day 7 0.00±0.00 0.13±0.05 0.00±0.00 0.00±0.00
Day 14 0.10±0.00 0.03±0.06 0.00±0.00 0.00±0.00 Plus Nitrate Only
Day 3 0.10±0.00 0.00±0.00 0.00±0.00 0.00±0.00 Day 5 0.00±0.00 0.00±0.00 0.00±0.00 0.00±0.00 Day 7 0.10±0.00 0.10±0.00 0.00±0.00 0.00±0.00
Day 14 0.00±0.00 0.00±0.00 0.00±0.00 0.00±0.00 Plus Metals Only
Day 3 0.00±0.00 0.00±0.00 0.00±0.00 0.00±0.00 Day 5 0.00±0.00 0.10±0.00 0.10±0.00 0.00±0.00 Day 7 0.00±0.00 0.00±0.00 0.00±0.00 0.00±0.00
Day 14 0.00±0.00 0.00±0.00 0.00±0.00 0.00±0.00
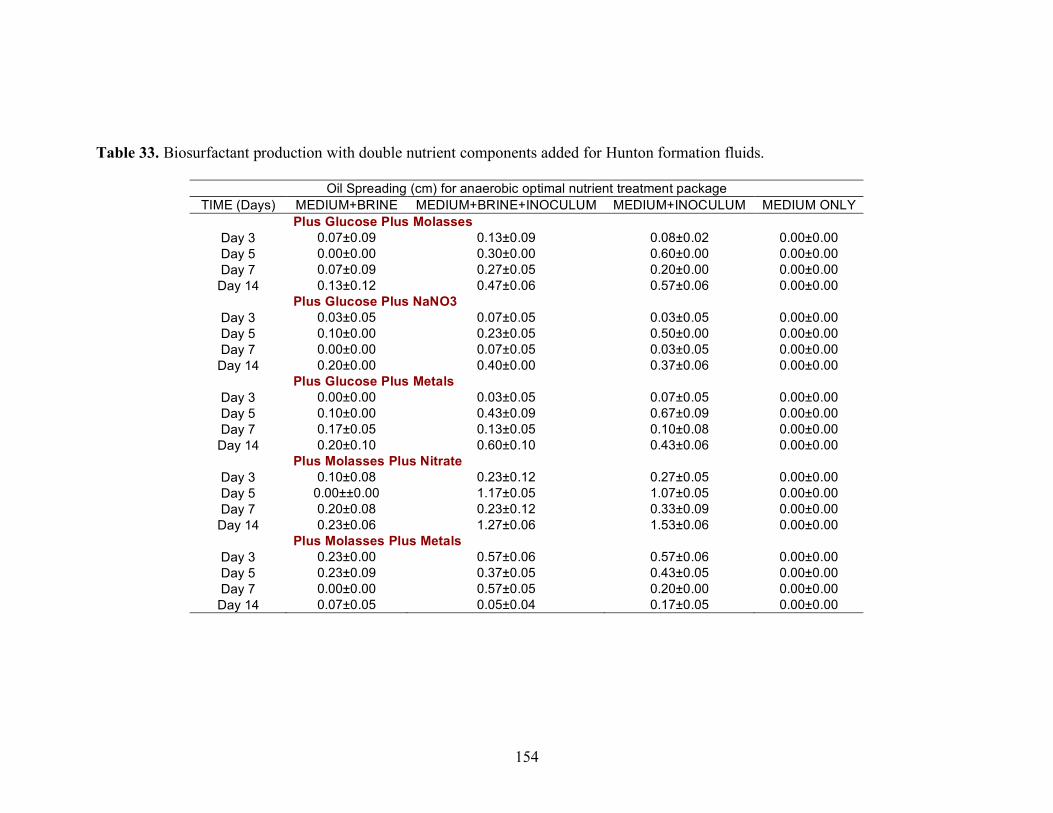
154
Table 33. Biosurfactant production with double nutrient components added for Hunton formation fluids.
Oil Spreading (cm) for anaerobic optimal nutrient treatment package TIME (Days) MEDIUM+BRINE MEDIUM+BRINE+INOCULUM MEDIUM+INOCULUM MEDIUM ONLY
Plus Glucose Plus Molasses Day 3 0.07±0.09 0.13±0.09 0.08±0.02 0.00±0.00 Day 5 0.00±0.00 0.30±0.00 0.60±0.00 0.00±0.00 Day 7 0.07±0.09 0.27±0.05 0.20±0.00 0.00±0.00 Day 14 0.13±0.12 0.47±0.06 0.57±0.06 0.00±0.00
Plus Glucose Plus NaNO3 Day 3 0.03±0.05 0.07±0.05 0.03±0.05 0.00±0.00 Day 5 0.10±0.00 0.23±0.05 0.50±0.00 0.00±0.00 Day 7 0.00±0.00 0.07±0.05 0.03±0.05 0.00±0.00 Day 14 0.20±0.00 0.40±0.00 0.37±0.06 0.00±0.00
Plus Glucose Plus Metals Day 3 0.00±0.00 0.03±0.05 0.07±0.05 0.00±0.00 Day 5 0.10±0.00 0.43±0.09 0.67±0.09 0.00±0.00 Day 7 0.17±0.05 0.13±0.05 0.10±0.08 0.00±0.00 Day 14 0.20±0.10 0.60±0.10 0.43±0.06 0.00±0.00
Plus Molasses Plus Nitrate Day 3 0.10±0.08 0.23±0.12 0.27±0.05 0.00±0.00 Day 5 0.00±±0.00 1.17±0.05 1.07±0.05 0.00±0.00 Day 7 0.20±0.08 0.23±0.12 0.33±0.09 0.00±0.00 Day 14 0.23±0.06 1.27±0.06 1.53±0.06 0.00±0.00
Plus Molasses Plus Metals Day 3 0.23±0.00 0.57±0.06 0.57±0.06 0.00±0.00 Day 5 0.23±0.09 0.37±0.05 0.43±0.05 0.00±0.00 Day 7 0.00±0.00 0.57±0.05 0.20±0.00 0.00±0.00 Day 14 0.07±0.05 0.05±0.04 0.17±0.05 0.00±0.00
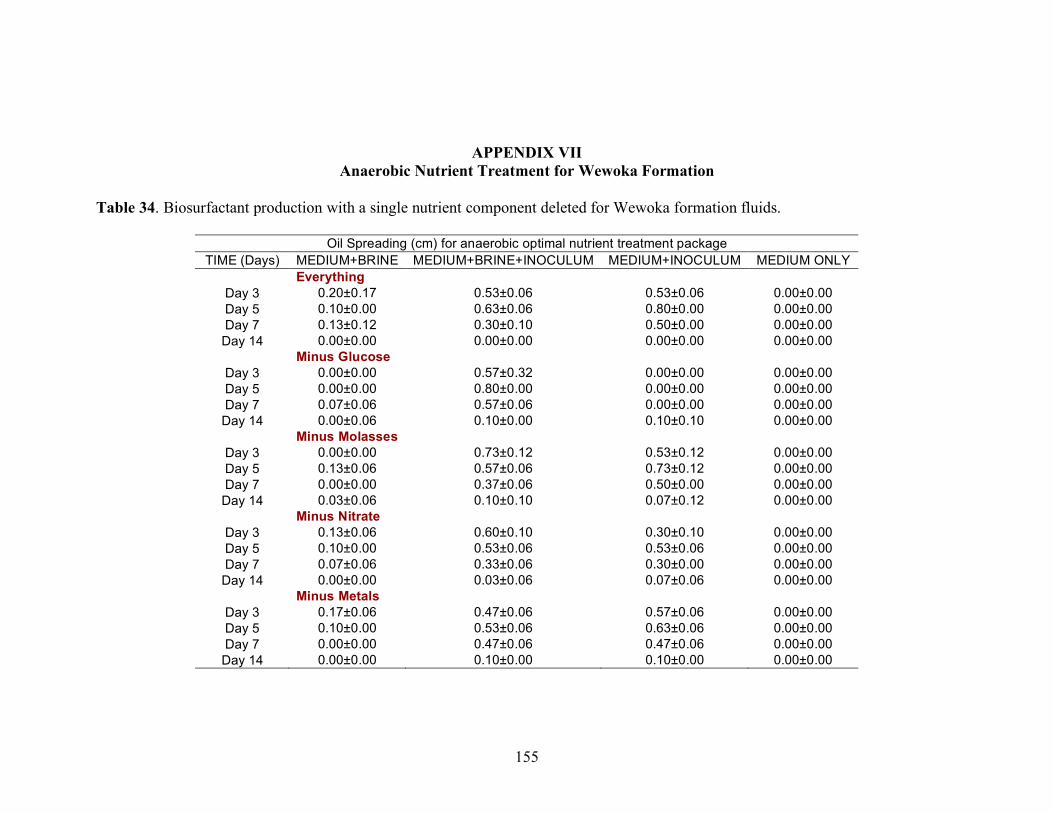
155
APPENDIX VII Anaerobic Nutrient Treatment for Wewoka Formation
Table 34. Biosurfactant production with a single nutrient component deleted for Wewoka formation fluids.
Oil Spreading (cm) for anaerobic optimal nutrient treatment package TIME (Days) MEDIUM+BRINE MEDIUM+BRINE+INOCULUM MEDIUM+INOCULUM MEDIUM ONLY
Everything Day 3 0.20±0.17 0.53±0.06 0.53±0.06 0.00±0.00 Day 5 0.10±0.00 0.63±0.06 0.80±0.00 0.00±0.00 Day 7 0.13±0.12 0.30±0.10 0.50±0.00 0.00±0.00 Day 14 0.00±0.00 0.00±0.00 0.00±0.00 0.00±0.00
Minus Glucose Day 3 0.00±0.00 0.57±0.32 0.00±0.00 0.00±0.00 Day 5 0.00±0.00 0.80±0.00 0.00±0.00 0.00±0.00 Day 7 0.07±0.06 0.57±0.06 0.00±0.00 0.00±0.00 Day 14 0.00±0.06 0.10±0.00 0.10±0.10 0.00±0.00
Minus Molasses Day 3 0.00±0.00 0.73±0.12 0.53±0.12 0.00±0.00 Day 5 0.13±0.06 0.57±0.06 0.73±0.12 0.00±0.00 Day 7 0.00±0.00 0.37±0.06 0.50±0.00 0.00±0.00 Day 14 0.03±0.06 0.10±0.10 0.07±0.12 0.00±0.00
Minus Nitrate Day 3 0.13±0.06 0.60±0.10 0.30±0.10 0.00±0.00 Day 5 0.10±0.00 0.53±0.06 0.53±0.06 0.00±0.00 Day 7 0.07±0.06 0.33±0.06 0.30±0.00 0.00±0.00 Day 14 0.00±0.00 0.03±0.06 0.07±0.06 0.00±0.00
Minus Metals Day 3 0.17±0.06 0.47±0.06 0.57±0.06 0.00±0.00 Day 5 0.10±0.00 0.53±0.06 0.63±0.06 0.00±0.00 Day 7 0.00±0.00 0.47±0.06 0.47±0.06 0.00±0.00 Day 14 0.00±0.00 0.10±0.00 0.10±0.00 0.00±0.00

156
Table 35. Biosurfactant production with a single nutrient component added for Wewoka formation fluids.
Oil Spreading (cm) for anaerobic optimal nutrient treatment package TIME (Days) MEDIUM+BRINE MEDIUM+BRINE+INOCULUM MEDIUM+INOCULUM MEDIUM ONLY
Glucose only Day 3 0.00±0.00 0.20±0.10 0.00±0.00 0.00±0.00 Day 5 0.00±0.00 0.13±0.06 0.00±0.00 0.00±0.00 Day 7 0.00±0.00 0.17±0.06 0.00±0.00 0.00±0.00
Day 14 0.00±0.00 0.10±0.00 0.00±0.00 0.00±0.00 Molasses only
Day 3 0.20±0.00 0.20±0.00 0.40±0.00 0.00±0.00 Day 5 0.20±0.00 0.20±0.00 0.33±0.06 0.00±0.00 Day 7 0.10±0.00 0.20±0.00 0.23±0.12 0.00±0.00
Day 14 0.00±0.00 0.00±0.00 0.10±0.00 0.00±0.00 Nitrate only
Day 3 0.00±0.00 0.17±0.06 0.07±0.06 0.00±0.00 Day 5 0.00±0.00 0.20±0.10 0.20±0.10 0.00±0.00 Day 7 0.00±0.00 0.13±0.06 0.13±0.06 0.00±0.00
Day 14 0.10±0.00 0.20±0.00 0.10±0.00 0.00±0.00 Metals only
Day 3 0.00±0.00 0.00±0.00 0.00±0.00 0.00±0.00 Day 5 0.00±0.00 0.00±0.00 0.00±0.00 0.00±0.00 Day 7 0.00±0.00 0.00±0.00 0.00±0.00 0.00±0.00
Day 14 0.00±0.00 0.00±0.00 0.00±0.00 0.10±0.00
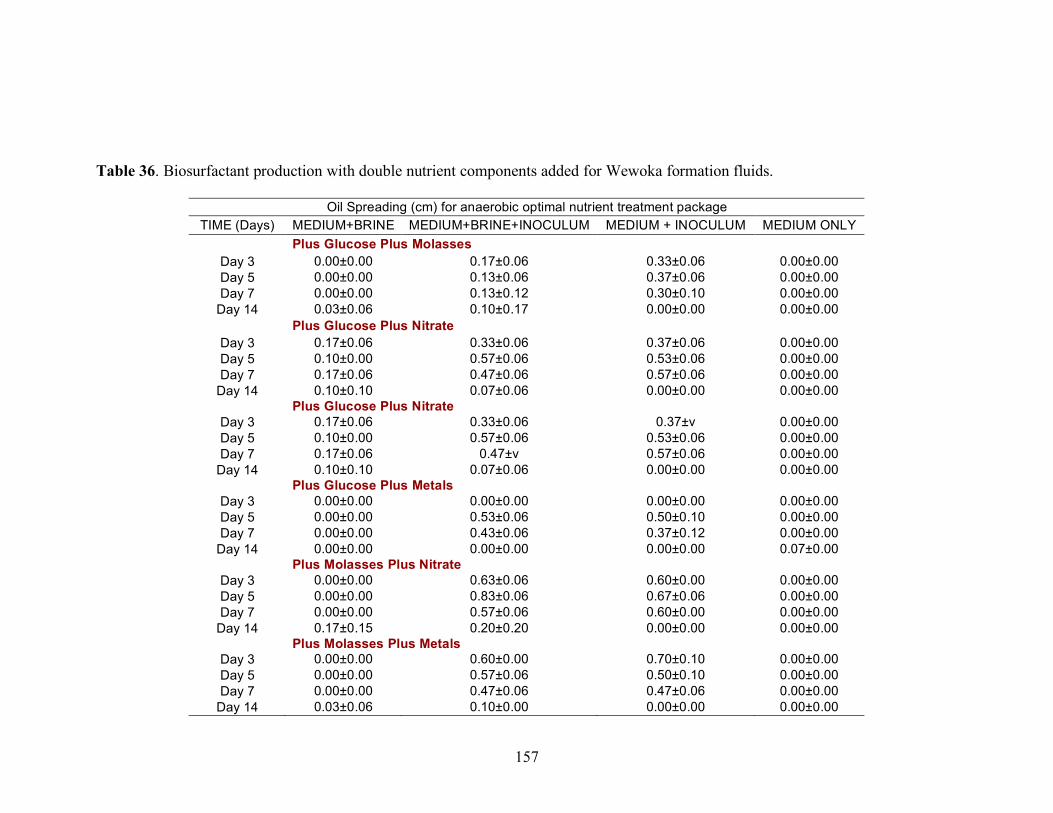
157
Table 36. Biosurfactant production with double nutrient components added for Wewoka formation fluids.
Oil Spreading (cm) for anaerobic optimal nutrient treatment package TIME (Days) MEDIUM+BRINE MEDIUM+BRINE+INOCULUM MEDIUM + INOCULUM MEDIUM ONLY
Plus Glucose Plus Molasses Day 3 0.00±0.00 0.17±0.06 0.33±0.06 0.00±0.00 Day 5 0.00±0.00 0.13±0.06 0.37±0.06 0.00±0.00 Day 7 0.00±0.00 0.13±0.12 0.30±0.10 0.00±0.00
Day 14 0.03±0.06 0.10±0.17 0.00±0.00 0.00±0.00 Plus Glucose Plus Nitrate
Day 3 0.17±0.06 0.33±0.06 0.37±0.06 0.00±0.00 Day 5 0.10±0.00 0.57±0.06 0.53±0.06 0.00±0.00 Day 7 0.17±0.06 0.47±0.06 0.57±0.06 0.00±0.00
Day 14 0.10±0.10 0.07±0.06 0.00±0.00 0.00±0.00 Plus Glucose Plus Nitrate
Day 3 0.17±0.06 0.33±0.06 0.37±v 0.00±0.00 Day 5 0.10±0.00 0.57±0.06 0.53±0.06 0.00±0.00 Day 7 0.17±0.06 0.47±v 0.57±0.06 0.00±0.00
Day 14 0.10±0.10 0.07±0.06 0.00±0.00 0.00±0.00 Plus Glucose Plus Metals
Day 3 0.00±0.00 0.00±0.00 0.00±0.00 0.00±0.00 Day 5 0.00±0.00 0.53±0.06 0.50±0.10 0.00±0.00 Day 7 0.00±0.00 0.43±0.06 0.37±0.12 0.00±0.00
Day 14 0.00±0.00 0.00±0.00 0.00±0.00 0.07±0.00 Plus Molasses Plus Nitrate
Day 3 0.00±0.00 0.63±0.06 0.60±0.00 0.00±0.00 Day 5 0.00±0.00 0.83±0.06 0.67±0.06 0.00±0.00 Day 7 0.00±0.00 0.57±0.06 0.60±0.00 0.00±0.00
Day 14 0.17±0.15 0.20±0.20 0.00±0.00 0.00±0.00 Plus Molasses Plus Metals
Day 3 0.00±0.00 0.60±0.00 0.70±0.10 0.00±0.00 Day 5 0.00±0.00 0.57±0.06 0.50±0.10 0.00±0.00 Day 7 0.00±0.00 0.47±0.06 0.47±0.06 0.00±0.00
Day 14 0.03±0.06 0.10±0.00 0.00±0.00 0.00±0.00
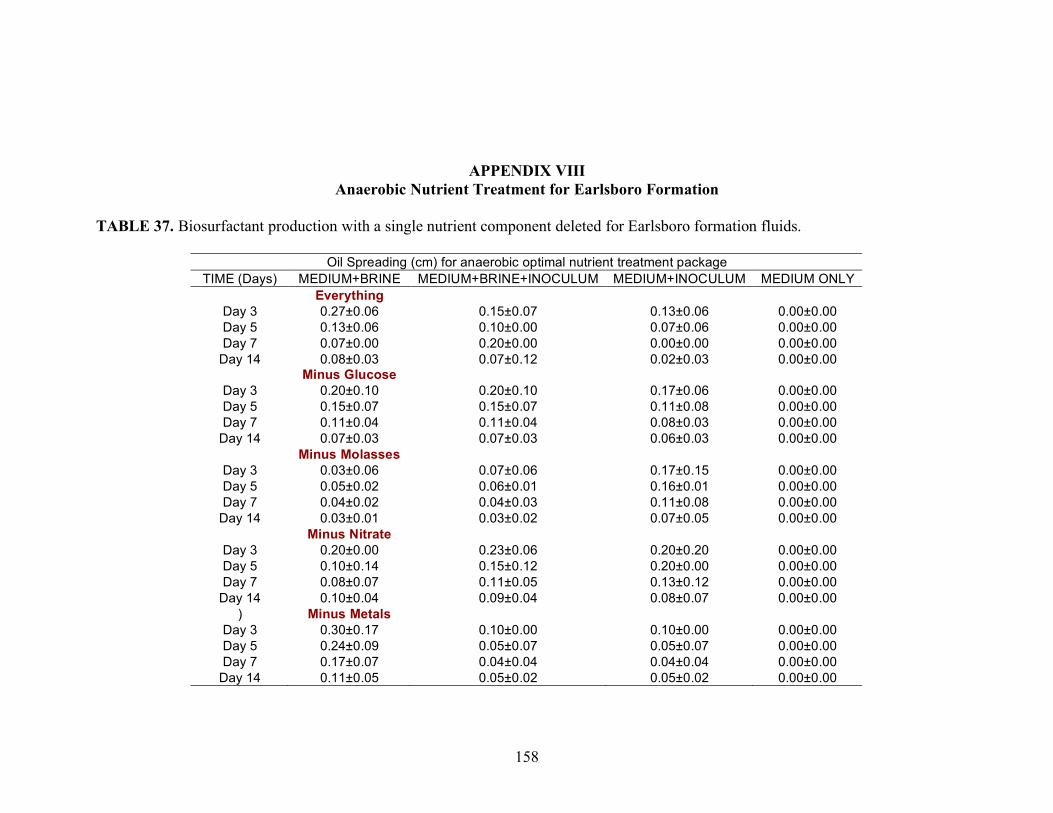
158
APPENDIX VIII
Anaerobic Nutrient Treatment for Earlsboro Formation
TABLE 37. Biosurfactant production with a single nutrient component deleted for Earlsboro formation fluids.
Oil Spreading (cm) for anaerobic optimal nutrient treatment package TIME (Days) MEDIUM+BRINE MEDIUM+BRINE+INOCULUM MEDIUM+INOCULUM MEDIUM ONLY
Everything Day 3 0.27±0.06 0.15±0.07 0.13±0.06 0.00±0.00 Day 5 0.13±0.06 0.10±0.00 0.07±0.06 0.00±0.00 Day 7 0.07±0.00 0.20±0.00 0.00±0.00 0.00±0.00
Day 14 0.08±0.03 0.07±0.12 0.02±0.03 0.00±0.00 Minus Glucose
Day 3 0.20±0.10 0.20±0.10 0.17±0.06 0.00±0.00 Day 5 0.15±0.07 0.15±0.07 0.11±0.08 0.00±0.00 Day 7 0.11±0.04 0.11±0.04 0.08±0.03 0.00±0.00
Day 14 0.07±0.03 0.07±0.03 0.06±0.03 0.00±0.00 Minus Molasses
Day 3 0.03±0.06 0.07±0.06 0.17±0.15 0.00±0.00 Day 5 0.05±0.02 0.06±0.01 0.16±0.01 0.00±0.00 Day 7 0.04±0.02 0.04±0.03 0.11±0.08 0.00±0.00
Day 14 0.03±0.01 0.03±0.02 0.07±0.05 0.00±0.00 Minus Nitrate
Day 3 0.20±0.00 0.23±0.06 0.20±0.20 0.00±0.00 Day 5 0.10±0.14 0.15±0.12 0.20±0.00 0.00±0.00 Day 7 0.08±0.07 0.11±0.05 0.13±0.12 0.00±0.00
Day 14 0.10±0.04 0.09±0.04 0.08±0.07 0.00±0.00 ) Minus Metals
Day 3 0.30±0.17 0.10±0.00 0.10±0.00 0.00±0.00 Day 5 0.24±0.09 0.05±0.07 0.05±0.07 0.00±0.00 Day 7 0.17±0.07 0.04±0.04 0.04±0.04 0.00±0.00
Day 14 0.11±0.05 0.05±0.02 0.05±0.02 0.00±0.00
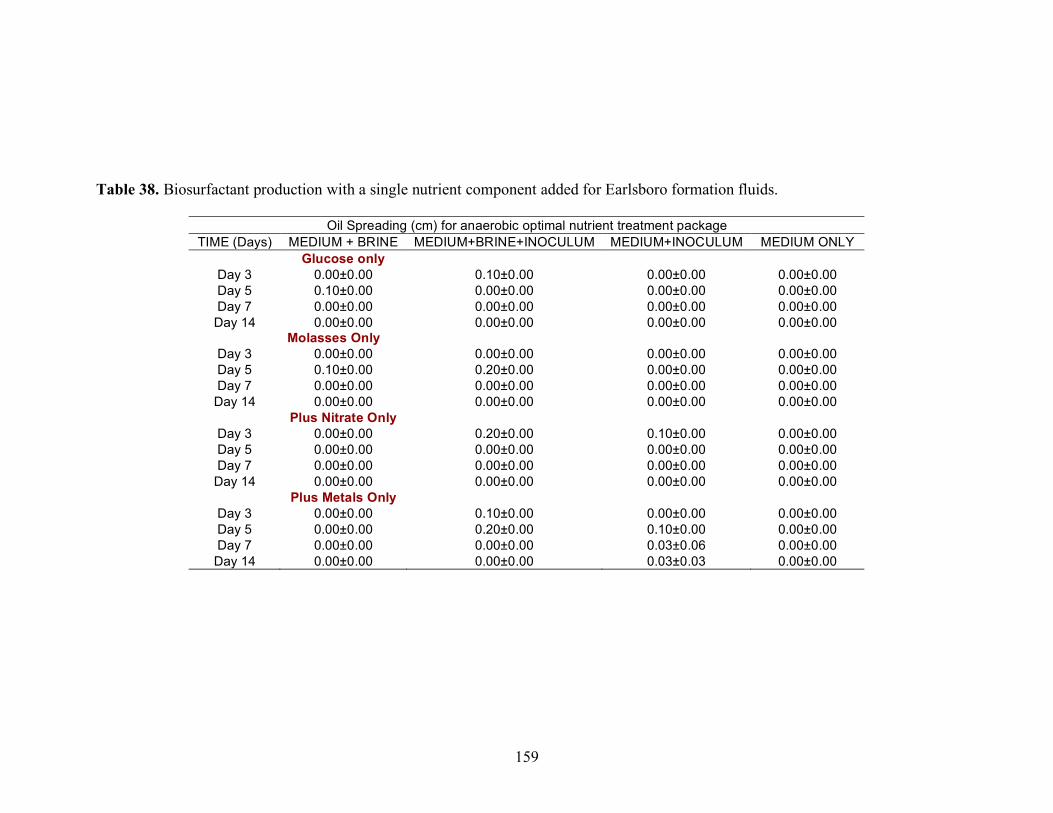
159
Table 38. Biosurfactant production with a single nutrient component added for Earlsboro formation fluids.
Oil Spreading (cm) for anaerobic optimal nutrient treatment package TIME (Days) MEDIUM + BRINE MEDIUM+BRINE+INOCULUM MEDIUM+INOCULUM MEDIUM ONLY
Glucose only Day 3 0.00±0.00 0.10±0.00 0.00±0.00 0.00±0.00 Day 5 0.10±0.00 0.00±0.00 0.00±0.00 0.00±0.00 Day 7 0.00±0.00 0.00±0.00 0.00±0.00 0.00±0.00 Day 14 0.00±0.00 0.00±0.00 0.00±0.00 0.00±0.00
Molasses Only Day 3 0.00±0.00 0.00±0.00 0.00±0.00 0.00±0.00 Day 5 0.10±0.00 0.20±0.00 0.00±0.00 0.00±0.00 Day 7 0.00±0.00 0.00±0.00 0.00±0.00 0.00±0.00 Day 14 0.00±0.00 0.00±0.00 0.00±0.00 0.00±0.00
Plus Nitrate Only Day 3 0.00±0.00 0.20±0.00 0.10±0.00 0.00±0.00 Day 5 0.00±0.00 0.00±0.00 0.00±0.00 0.00±0.00 Day 7 0.00±0.00 0.00±0.00 0.00±0.00 0.00±0.00 Day 14 0.00±0.00 0.00±0.00 0.00±0.00 0.00±0.00
Plus Metals Only Day 3 0.00±0.00 0.10±0.00 0.00±0.00 0.00±0.00 Day 5 0.00±0.00 0.20±0.00 0.10±0.00 0.00±0.00 Day 7 0.00±0.00 0.00±0.00 0.03±0.06 0.00±0.00 Day 14 0.00±0.00 0.00±0.00 0.03±0.03 0.00±0.00
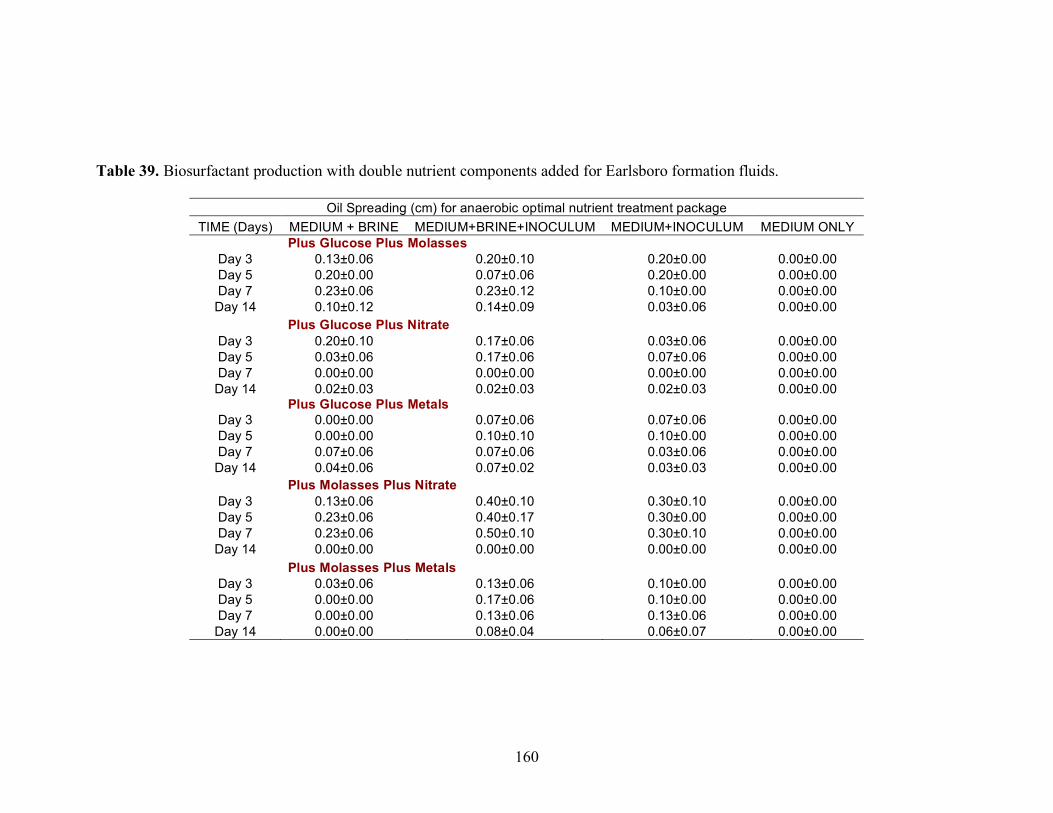
160
Table 39. Biosurfactant production with double nutrient components added for Earlsboro formation fluids.
Oil Spreading (cm) for anaerobic optimal nutrient treatment package TIME (Days) MEDIUM + BRINE MEDIUM+BRINE+INOCULUM MEDIUM+INOCULUM MEDIUM ONLY
Plus Glucose Plus Molasses Day 3 0.13±0.06 0.20±0.10 0.20±0.00 0.00±0.00 Day 5 0.20±0.00 0.07±0.06 0.20±0.00 0.00±0.00 Day 7 0.23±0.06 0.23±0.12 0.10±0.00 0.00±0.00 Day 14 0.10±0.12 0.14±0.09 0.03±0.06 0.00±0.00
Plus Glucose Plus Nitrate Day 3 0.20±0.10 0.17±0.06 0.03±0.06 0.00±0.00 Day 5 0.03±0.06 0.17±0.06 0.07±0.06 0.00±0.00 Day 7 0.00±0.00 0.00±0.00 0.00±0.00 0.00±0.00 Day 14 0.02±0.03 0.02±0.03 0.02±0.03 0.00±0.00
Plus Glucose Plus Metals Day 3 0.00±0.00 0.07±0.06 0.07±0.06 0.00±0.00 Day 5 0.00±0.00 0.10±0.10 0.10±0.00 0.00±0.00 Day 7 0.07±0.06 0.07±0.06 0.03±0.06 0.00±0.00 Day 14 0.04±0.06 0.07±0.02 0.03±0.03 0.00±0.00
Plus Molasses Plus Nitrate Day 3 0.13±0.06 0.40±0.10 0.30±0.10 0.00±0.00 Day 5 0.23±0.06 0.40±0.17 0.30±0.00 0.00±0.00 Day 7 0.23±0.06 0.50±0.10 0.30±0.10 0.00±0.00 Day 14 0.00±0.00 0.00±0.00 0.00±0.00 0.00±0.00
Plus Molasses Plus Metals Day 3 0.03±0.06 0.13±0.06 0.10±0.00 0.00±0.00 Day 5 0.00±0.00 0.17±0.06 0.10±0.00 0.00±0.00 Day 7 0.00±0.00 0.13±0.06 0.13±0.06 0.00±0.00 Day 14 0.00±0.00 0.08±0.04 0.06±0.07 0.00±0.00

161


![Enhanced biosurfactant production through cloning of … · Enhanced biosurfactant production through cloning of three genes and role of esterase ... agents [1,2,4,5]. ... New Delhi,](https://static.fdocuments.net/doc/165x107/5b5ad5b27f8b9a905c8cc115/enhanced-biosurfactant-production-through-cloning-of-enhanced-biosurfactant.jpg)


