Development of a multiplex real-time PCR assay for ...
23
University of Nebraska - Lincoln University of Nebraska - Lincoln DigitalCommons@University of Nebraska - Lincoln DigitalCommons@University of Nebraska - Lincoln Faculty Publications, Department of Statistics Statistics, Department of 1-1-2021 Development of a multiplex real-time PCR assay for predicting Development of a multiplex real-time PCR assay for predicting macrolide and tetracycline resistance associated with bacterial macrolide and tetracycline resistance associated with bacterial pathogens of bovine respiratory disease pathogens of bovine respiratory disease Enakshy Dutta University of Nebraska–Lincoln, [email protected] John Loy University of Nebraska-Lincoln, [email protected] Caitlyn A. Deal University of Nebraska–Lincoln, [email protected] Emily L. Wynn USDA ARS Roman L. Hruska U.S. Meat Animal Research Center, [email protected] Michael L. Clawson USDA, [email protected] See next page for additional authors Follow this and additional works at: https://digitalcommons.unl.edu/statisticsfacpub Part of the Other Statistics and Probability Commons Dutta, Enakshy; Loy, John; Deal, Caitlyn A.; Wynn, Emily L.; Clawson, Michael L.; Clarke, Jennifer; and Wang, Bing, "Development of a multiplex real-time PCR assay for predicting macrolide and tetracycline resistance associated with bacterial pathogens of bovine respiratory disease" (2021). Faculty Publications, Department of Statistics. 123. https://digitalcommons.unl.edu/statisticsfacpub/123 This Article is brought to you for free and open access by the Statistics, Department of at DigitalCommons@University of Nebraska - Lincoln. It has been accepted for inclusion in Faculty Publications, Department of Statistics by an authorized administrator of DigitalCommons@University of Nebraska - Lincoln.
Transcript of Development of a multiplex real-time PCR assay for ...
University of Nebraska - Lincoln University of Nebraska - Lincoln
DigitalCommons@University of Nebraska - Lincoln DigitalCommons@University of Nebraska - Lincoln
Faculty Publications, Department of Statistics Statistics, Department of
1-1-2021
Development of a multiplex real-time PCR assay for predicting Development of a multiplex real-time PCR assay for predicting
macrolide and tetracycline resistance associated with bacterial macrolide and tetracycline resistance associated with bacterial
pathogens of bovine respiratory disease pathogens of bovine respiratory disease
Enakshy Dutta University of Nebraska–Lincoln, [email protected]
John Loy University of Nebraska-Lincoln, [email protected]
Caitlyn A. Deal University of Nebraska–Lincoln, [email protected]
Emily L. Wynn USDA ARS Roman L. Hruska U.S. Meat Animal Research Center, [email protected]
Michael L. Clawson USDA, [email protected]
See next page for additional authors
Follow this and additional works at: https://digitalcommons.unl.edu/statisticsfacpub
Part of the Other Statistics and Probability Commons
Dutta, Enakshy; Loy, John; Deal, Caitlyn A.; Wynn, Emily L.; Clawson, Michael L.; Clarke, Jennifer; and Wang, Bing, "Development of a multiplex real-time PCR assay for predicting macrolide and tetracycline resistance associated with bacterial pathogens of bovine respiratory disease" (2021). Faculty Publications, Department of Statistics. 123. https://digitalcommons.unl.edu/statisticsfacpub/123
This Article is brought to you for free and open access by the Statistics, Department of at DigitalCommons@University of Nebraska - Lincoln. It has been accepted for inclusion in Faculty Publications, Department of Statistics by an authorized administrator of DigitalCommons@University of Nebraska - Lincoln.

Authors Authors Enakshy Dutta, John Loy, Caitlyn A. Deal, Emily L. Wynn, Michael L. Clawson, Jennifer Clarke, and Bing Wang
This article is available at DigitalCommons@University of Nebraska - Lincoln: https://digitalcommons.unl.edu/statisticsfacpub/123
pathogens
Article
Development of a Multiplex Real-Time PCR Assay forPredicting Macrolide and Tetracycline Resistance Associatedwith Bacterial Pathogens of Bovine Respiratory Disease
Enakshy Dutta 1,†, John Dustin Loy 2,† , Caitlyn A. Deal 2, Emily L. Wynn 3, Michael L. Clawson 3 ,Jennifer Clarke 1,4 and Bing Wang 4,*
�����������������
Citation: Dutta, E.; Loy, J.D.; Deal,
C.A.; Wynn, E.L.; Clawson, M.L.;
Clarke, J.; Wang, B. Development of
a Multiplex Real-Time PCR Assay for
Predicting Macrolide and Tetracycline
Resistance Associated with Bacterial
Pathogens of Bovine Respiratory
Disease. Pathogens 2021, 10, 64.
https://doi.org/10.3390/
pathogens10010064
Received: 21 December 2020
Accepted: 12 January 2021
Published: 13 January 2021
Publisher’s Note: MDPI stays neu-
tral with regard to jurisdictional clai-
ms in published maps and institutio-
nal affiliations.
Copyright: © 2021 by the authors. Li-
censee MDPI, Basel, Switzerland.
This article is an open access article
distributed under the terms and con-
ditions of the Creative Commons At-
tribution (CC BY) license (https://
creativecommons.org/licenses/by/
4.0/).
1 Department of Statistics, University of Nebraska-Lincoln, Lincoln, NE 68583, USA;[email protected] (E.D.); [email protected] (J.C.)
2 School of Veterinary Medicine and Biomedical Sciences, University of Nebraska-Lincoln, Lincoln,NE 68583, USA; [email protected] (J.D.L.); [email protected] (C.A.D.)
3 U.S. Meat Animal Research Center, Agricultural Research Service, United States Department of Agriculture,Clay Center, NE 68933, USA; [email protected] (E.L.W.); [email protected] (M.L.C.)
4 Department of Food Science and Technology, University of Nebraska-Lincoln, Lincoln, NE 68588, USA* Correspondence: [email protected]; Tel.: +1-(402)-472-2517† These authors contributed equally to this work.
Abstract: Antimicrobial resistance (AMR) in bovine respiratory disease (BRD) is an emerging concernthat may threaten both animal and public health. Rapid and accurate detection of AMR is essentialfor prudent drug therapy selection during BRD outbreaks. This study aimed to develop a multiplexquantitative real-time polymerase chain reaction assay (qPCR) to provide culture-independent infor-mation regarding the phenotypic AMR status of BRD cases and an alternative to the gold-standard,culture-dependent test. Bovine clinical samples (297 lung and 111 nasal) collected in Nebraska weresubjected to qPCR quantification of macrolide (MAC) and tetracycline (TET) resistance genes andgold-standard determinations of AMR of BRD pathogens. Receiver operating characteristic curveanalysis was used to classify AMR based on the qPCR results. For lung tissues, the qPCR methodshowed good agreement with the gold-standard test for both MACs and TETs, with a sensitivity of67–81% and a specificity higher than 80%. For nasal swabs, qPCR results passed validation criteriaonly for TET resistance detection, with a sensitivity of 88%, a specificity of 80% and moderate agree-ment. The culture-independent assay developed here provides the potential for more rapid AMRcharacterization of BRD cases directly from clinical samples at equivalent accuracy and higher timeefficiency compared with the gold-standard, culture-based test.
Keywords: bovine clinical samples; prudent antibiotic use; culture independent; rapid detection;receiver operating characteristic; quantitative PCR
1. Introduction
Bovine respiratory disease (BRD) is one of the most common and costly cattle diseasesand affects 97% of feedlots, or 16% of cattle, with economic losses estimated to exceed1 billion USD/year [1,2]. BRD is a disease complex with multiple contributing factors,including environment, viruses, bacteria, and the host [3]. Disease onset is commonlyinitiated by viral infections, which may suppress host defense mechanisms, allowing op-portunistic bacterial pathogens to replicate and colonize deeper in the lung. Environmentalfactors such as crowding, poor ventilation, weather, and weaning increase stress and alsoreduce host immunity [4]. The coexistence of multiple viral and bacterial pathogens oftenincreases the severity of BRD outbreaks, leading to higher mortality and morbidity ratesand associated economic burdens [5,6].
Among pathogenic bacteria causing BRD in feedlot cattle and neonatal calves, Mannheimiahaemolytica is the most frequently isolated, followed by Histophilus somni and Pasteurella mul-
Pathogens 2021, 10, 64. https://doi.org/10.3390/pathogens10010064 https://www.mdpi.com/journal/pathogens

Pathogens 2021, 10, 64 2 of 21
tocida [1]. The multifactorial nature of BRD is often a challenge for disease management.Administration of antibiotic drugs for treatment and/or metaphylaxis (control and preven-tion) purposes may potentially select for resistance among bacterial pathogen populations [7].Recent studies have shown that the frequency of antimicrobial resistance (AMR) in BRDbacterial pathogens in feedlots is increasing, particularly resistance to macrolides (MACs)and tetracyclines (TETs) [8], which are among the most commonly used antibiotics on beefcattle feedlots in the United States [9–12]. The development of AMR could compromisethe effectiveness of antibiotics for the treatment and control of BRD, potentially leading tohigher mortality and lower productivity among cattle populations. Increasing AMR in BRDpathogens may also threaten public health, as the resistance genes found in BRD pathogensare contained within integrative conjugative elements (ICEs) that could potentially be trans-ferred from BRD pathogens to zoonotic bacteria [10]. Hence, tools for rapidly and accuratelydetecting potential AMR are critical components of outbreak monitoring by veterinariansand producers. Such tools could be used as adjuncts to existing culture-independent BRDpathogen detection methods that use similar technology and workflows [13]. In addition,the use of these tools would enable rapid evaluation of the potential efficacy of antimicrobialinterventions and ultimately benefit the beef industry and support antimicrobial stewardshipby enabling informed selection of optimal drugs for BRD therapies.
Classic culture-based methods for determining AMR commonly involve isolatingand identifying organisms on solid media and assessing the growth inhibition of isolatedbacterial strains under a series of concentrations of the target antibiotic to determine theminimum inhibitory concentration (MIC) [14]. As described by the Clinical and Labora-tory Standards Institute (CLSI), isolates are classified as susceptible (S), intermediate (I),or resistant (R) to an antibiotic based on the relationships between MIC measurementsand “breakpoints”, which are usually determined by taking into consideration the clini-cal outcomes of infections when the antibiotic is used [15]. The culture-based approachis widely used and is still considered the “gold-standard” test by national and interna-tional surveillance programs for monitoring AMR [14]. However, this method requiresthe growth, isolation, and identification of the target pathogens in pure culture, whichcan be time consuming and challenging due to sample contamination or overgrowth withenvironmental organisms [13].
In recent decades, molecular methods for detecting and quantifying AMR genes haveshown promise as potential alternatives to the gold-standard AMR detection [16]. Quantita-tive real-time polymerase chain reaction (qPCR), which uses hydrolysis probes to generatea fluorescence signal, enables real-time assessment of DNA amplification and quantificationof the genetic materials in the original sample. The qPCR approach also permits multiplexeddetection of several gene targets in a single reaction. A recent study demonstrated thatthis approach is extremely useful for detecting opportunistic bacterial pathogens in bovineclinical samples and has advantages over culture-based approaches, especially when multi-ple pathogens coexist in the presence of normal flora [13]. These advantages make qPCRa powerful tool for the detection of genes that confer AMR using existing sample types andworkflows. The detection of AMR genes in clinical samples (lungs and respiratory swabs)would provide veterinarians and clinicians with information on the presence or absenceof AMR genes within hours to guide therapy selection. Although the detection of AMRgenes in a sample does not necessarily indicate that the resistance genes are carried by BRDpathogens, such detection can be used as an indicator for the potential risks of antimicrobial-resistant infections in BRD outbreaks. Although the use of qPCR for AMR detection intandem with culture-independent pathogen detection assays has not yet been evaluated,such a combination would provide information on the co-presence of BRD pathogens andBRD-associated resistance genes [13].
Unlike the gold-standard method, which generates a phenotypic classification ofAMR, qPCR assays generate cycle threshold (Ct) values, which are continuous valuesrepresenting the number of cycles at which the fluorescence signal exceeds the thresholdvalue (i.e., the background signal level) and are used to estimate the number of gene
Pathogens 2021, 10, 64 3 of 21
copies in the original sample. To accurately predict the AMR classification index usinga molecular testing method, an extensive epidemiological evaluation of the method basedon a comparison with gold-standard methods must be conducted. Hence, the objectives ofthe present study were to (1) develop a qPCR method for the quantification of MAC andTET resistance genes in BRD clinical samples; (2) determine the optimal cutoff to supporttranslation of qPCR results to a phenotypic classification of AMR; and (3) evaluate thevalidity of AMR phenotypic classification by the qPCR assay.
2. Results2.1. Characteristics of the Multiplex qPCR Assay
In silico analyses showed 100% identity of the primer and probe loci to strains ofM. haemolytica and P. multocida (Table S1). For the H. somni strains, 100% identity to ICEtetRgene targets was observed for sequences in GenBank; the remaining three targets were notfound in H. somni strains available at the time of analysis. These resistance genes are notunique to BRD pathogens and are found on the chromosomes and/or plasmids of non-BRD-causing microbes (Table S2). The sequence identity of the primers and probes withnon-BRD pathogen bacterial species does not indicate off-target binding to other genes, asit is expected that these AMR gene sequences are found in various other bacterial species.
Preliminary evaluation of the assay using the reference strains indicated that themultiplex qPCR assay detected all of the targets in the M. haemolytica reference strainand had sensitivity for all four targets of <3.2 CFU/mL, with Ct values ranging from37.34 (ICEtetR) to 35.70 (msrE) at the lowest detectable concentration (Table 1). The assayalso correctly classified all M. haemolytica reference strains that had been determined tocontain the target genes (Table S3). Due to the lack of sequences for non-M. haemolytica BRDpathogens in GenBank or other databases, a panel of H. somni (35 strains) and P. multocida(5 strains) from BRD cases that had been subjected to MIC testing was also evaluated (TableS4). The detection of MAC resistance genes by the assay corresponded with phenotypicMAC and TET resistance in 26 and 28 of 35 H. somni strains, respectively. For P. multocida,genotypic results that agreed with the phenotypes for both TET and MAC resistance wereobtained for all five strains. To validate assay specificity, we also tested ATCC referencestrains of Actinobacillus pleuropneumoniae, Mannheimia granulomatis, H. somni, and B. trehalosithat do not exhibit phenotypic resistance. No qPCR targets were detected in any of thesereference strains. The susceptibility of two bovine respiratory strains of B. trehalosi was alsoevaluated; as expected, the tetracycline-resistant (TETr) and macrolide-resistant (MACr)strain was positive for all four targets, whereas the susceptible strain was negative forall targets.
2.2. Phenotypic Antimicrobial Resistance Based on the Gold-Standard Test
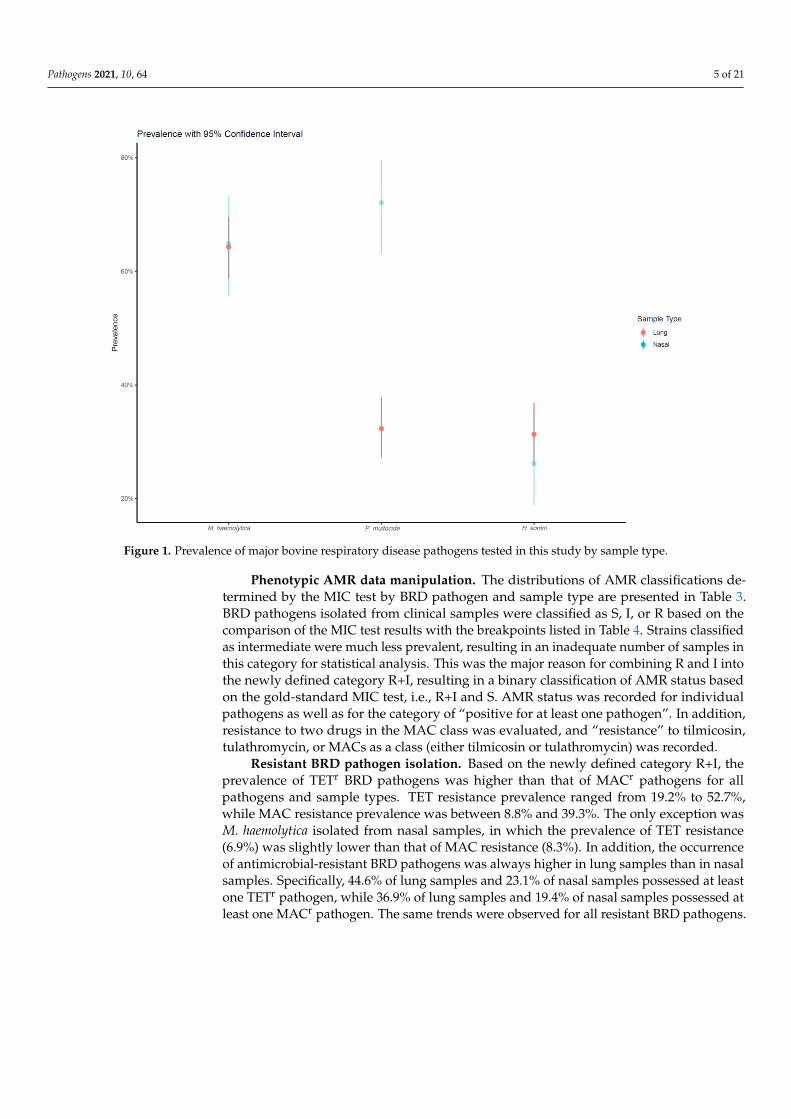
BRD pathogen detection. Along with the sample distribution, Table 2 shows theprevalence of BRD pathogens by sample type. In addition to the individual BRD pathogensexamined in this study, a new pathogen category, “positive for at least one BRD pathogen”,was evaluated. Overall, of the submitted samples for BRD diagnosis, at least one BRDpathogen was detected in 97.8%. In general, the prevalence of samples with at least one BRDpathogen was higher for lung samples (99.7%) than nasal samples (97.3%). Consistent withprevious reports, M. haemolytica was the most frequently isolated BRD pathogen, comprising63.7% of tested samples, followed by P. multocida (42.5%) and H. somni (29.6%). However, thepathogen distribution varied by sample type (Figure 1). Specifically, among lung samples,M. haemolytica was the most prevalent pathogen (64.3%), followed by P. multocida andH. somni at similar levels (32.3% and 31.3%). By contrast, both M. haemolytica and P. multocidawere relatively highly prevalent in nasal samples (64.9% and 72.1%), whereas H. somni wasnot (26.1%).
Pathogens 2021, 10, 64 4 of 21
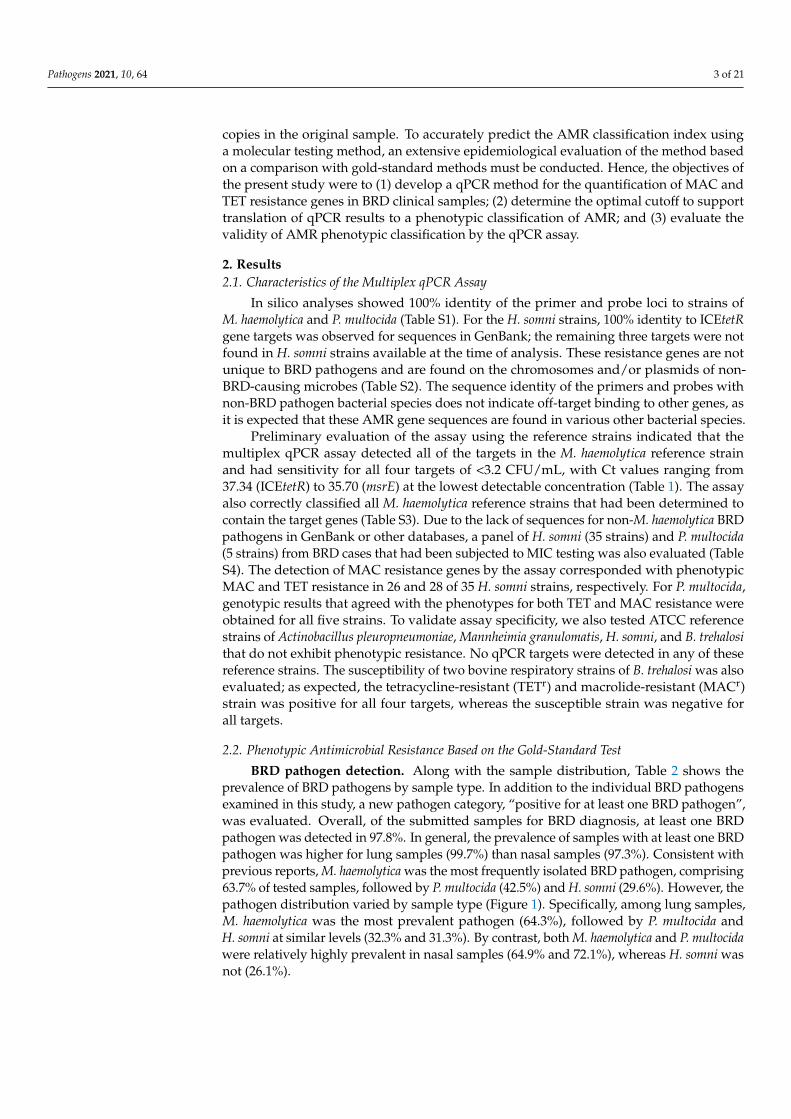
Table 1. Sensitivity and limit of detection in colony forming units per reaction (CFU/rxn) using aMannheimia haemolytica reference strain (1621) confirmed to have targets by whole-genome sequencing.
Target CFU/rxn Ct 1 CD 2 RE 3
ICETetR 3200 26.78ICETetR 320 30.23ICETetR 32 33.53ICETetR 3.2 37.34 0.982 0.95erm42 3200 26.32erm42 320 29.85erm42 32 32.95erm42 3.2 36.17 0.986 1.00mph E 3200 25.61mph E 320 29.05mph E 32 32.30mph E 3.2 36.56 0.985 0.88msr E 3200 25.44msr E 320 28.82msrE 32 32.04msr E 3.2 35.70 0.985 0.98
1 Ct = threshold cycle, 2 CD = correlation of determination, R2, 3 RE = reaction efficiency (10ˆ(−1/slope)−1).
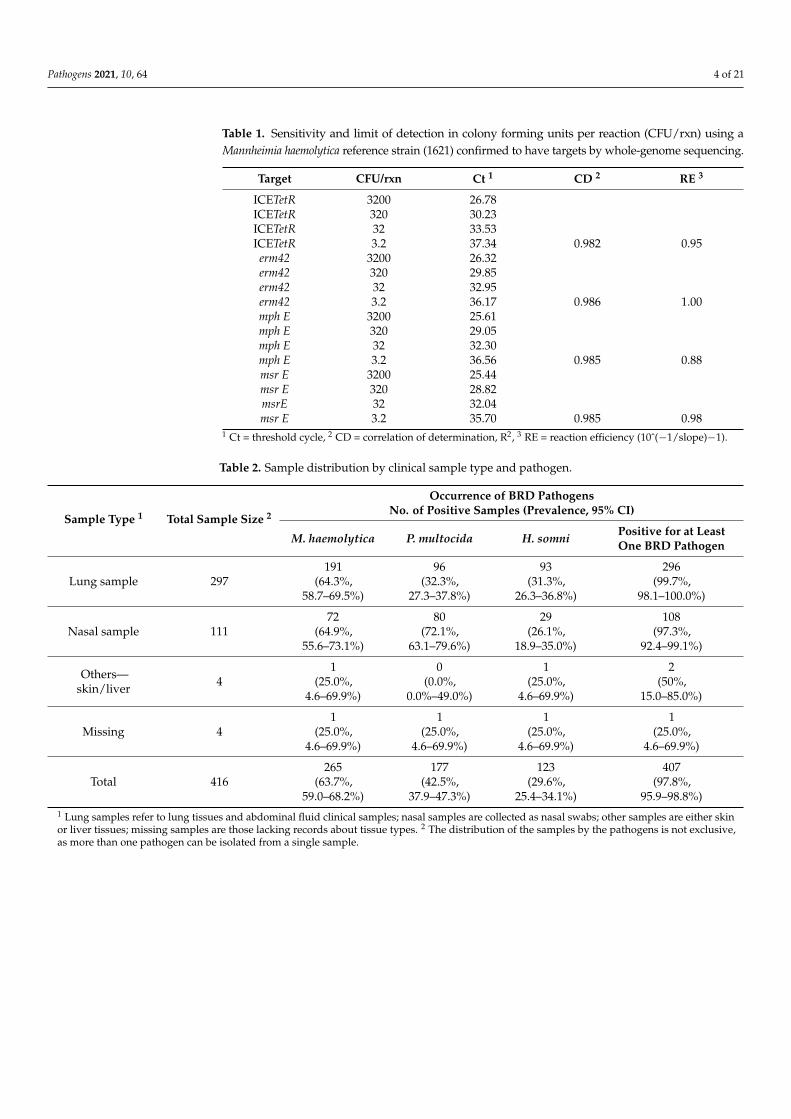
Table 2. Sample distribution by clinical sample type and pathogen.
Sample Type 1 Total Sample Size 2
Occurrence of BRD PathogensNo. of Positive Samples (Prevalence, 95% CI)
M. haemolytica P. multocida H. somni Positive for at LeastOne BRD Pathogen
Lung sample 297191
(64.3%,58.7–69.5%)
96(32.3%,
27.3–37.8%)
93(31.3%,
26.3–36.8%)
296(99.7%,
98.1–100.0%)
Nasal sample 11172
(64.9%,55.6–73.1%)
80(72.1%,
63.1–79.6%)
29(26.1%,
18.9–35.0%)
108(97.3%,
92.4–99.1%)
Others—skin/liver 4
1(25.0%,
4.6–69.9%)
0(0.0%,
0.0%–49.0%)
1(25.0%,
4.6–69.9%)
2(50%,
15.0–85.0%)
Missing 41
(25.0%,4.6–69.9%)
1(25.0%,
4.6–69.9%)
1(25.0%,
4.6–69.9%)
1(25.0%,
4.6–69.9%)
Total 416265
(63.7%,59.0–68.2%)
177(42.5%,
37.9–47.3%)
123(29.6%,
25.4–34.1%)
407(97.8%,
95.9–98.8%)1 Lung samples refer to lung tissues and abdominal fluid clinical samples; nasal samples are collected as nasal swabs; other samples are either skinor liver tissues; missing samples are those lacking records about tissue types. 2 The distribution of the samples by the pathogens is not exclusive,as more than one pathogen can be isolated from a single sample.
Pathogens 2021, 10, 64 5 of 21Pathogens 2021, 10, x FOR PEER REVIEW 5 of 22
Figure 1. Prevalence of major bovine respiratory disease pathogens tested in this study by sample type.
Phenotypic AMR data manipulation. The distributions of AMR classifications de-
termined by the MIC test by BRD pathogen and sample type are presented in Table 3.
BRD pathogens isolated from clinical samples were classified as S, I, or R based on the
comparison of the MIC test results with the breakpoints listed in Table 4. Strains classified
as intermediate were much less prevalent, resulting in an inadequate number of samples
in this category for statistical analysis. This was the major reason for combining R and I
into the newly defined category R+I, resulting in a binary classification of AMR status
based on the gold-standard MIC test, i.e., R+I and S. AMR status was recorded for indi-
vidual pathogens as well as for the category of “positive for at least one pathogen”. In
addition, resistance to two drugs in the MAC class was evaluated, and “resistance” to
tilmicosin, tulathromycin, or MACs as a class (either tilmicosin or tulathromycin) was rec-
orded.
Figure 1. Prevalence of major bovine respiratory disease pathogens tested in this study by sample type.
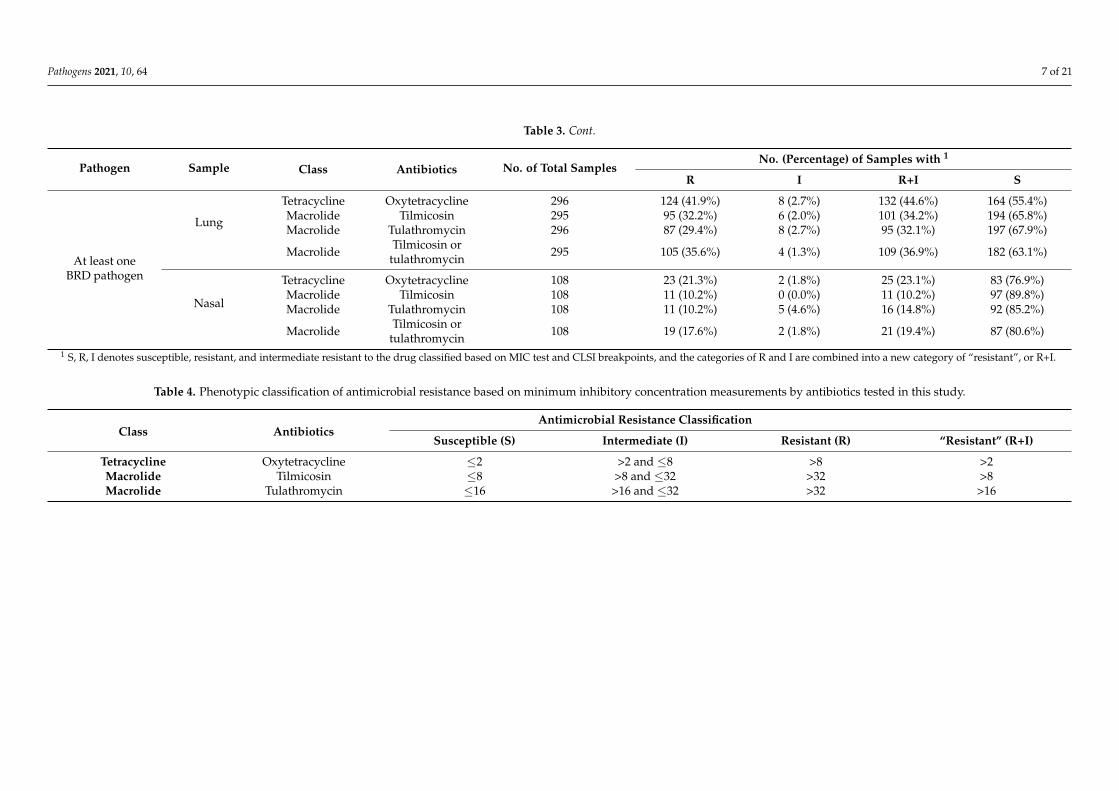
Phenotypic AMR data manipulation. The distributions of AMR classifications de-termined by the MIC test by BRD pathogen and sample type are presented in Table 3.BRD pathogens isolated from clinical samples were classified as S, I, or R based on thecomparison of the MIC test results with the breakpoints listed in Table 4. Strains classifiedas intermediate were much less prevalent, resulting in an inadequate number of samples inthis category for statistical analysis. This was the major reason for combining R and I intothe newly defined category R+I, resulting in a binary classification of AMR status basedon the gold-standard MIC test, i.e., R+I and S. AMR status was recorded for individualpathogens as well as for the category of “positive for at least one pathogen”. In addition,resistance to two drugs in the MAC class was evaluated, and “resistance” to tilmicosin,tulathromycin, or MACs as a class (either tilmicosin or tulathromycin) was recorded.
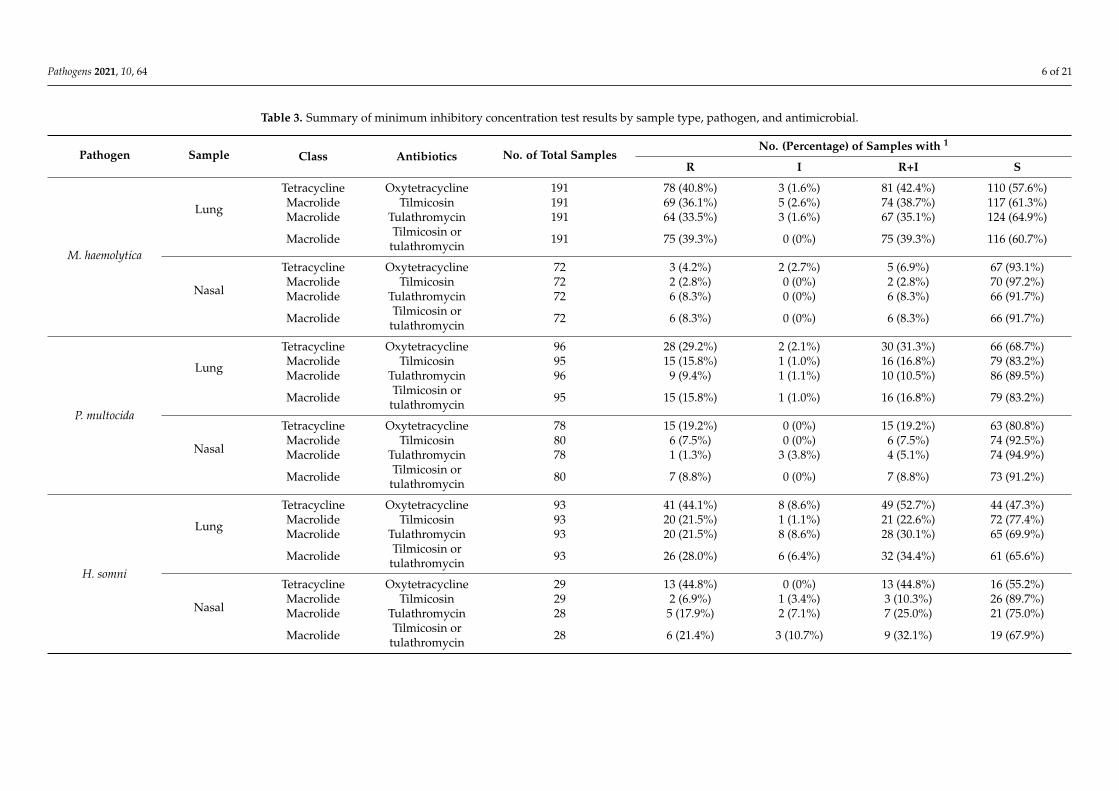
Resistant BRD pathogen isolation. Based on the newly defined category R+I, theprevalence of TETr BRD pathogens was higher than that of MACr pathogens for allpathogens and sample types. TET resistance prevalence ranged from 19.2% to 52.7%,while MAC resistance prevalence was between 8.8% and 39.3%. The only exception wasM. haemolytica isolated from nasal samples, in which the prevalence of TET resistance(6.9%) was slightly lower than that of MAC resistance (8.3%). In addition, the occurrenceof antimicrobial-resistant BRD pathogens was always higher in lung samples than in nasalsamples. Specifically, 44.6% of lung samples and 23.1% of nasal samples possessed at leastone TETr pathogen, while 36.9% of lung samples and 19.4% of nasal samples possessed atleast one MACr pathogen. The same trends were observed for all resistant BRD pathogens.
Pathogens 2021, 10, 64 6 of 21
Table 3. Summary of minimum inhibitory concentration test results by sample type, pathogen, and antimicrobial.
Pathogen Sample Class Antibiotics No. of Total SamplesNo. (Percentage) of Samples with 1
R I R+I S
M. haemolytica
Lung
Tetracycline Oxytetracycline 191 78 (40.8%) 3 (1.6%) 81 (42.4%) 110 (57.6%)Macrolide Tilmicosin 191 69 (36.1%) 5 (2.6%) 74 (38.7%) 117 (61.3%)Macrolide Tulathromycin 191 64 (33.5%) 3 (1.6%) 67 (35.1%) 124 (64.9%)
Macrolide Tilmicosin ortulathromycin 191 75 (39.3%) 0 (0%) 75 (39.3%) 116 (60.7%)
Nasal
Tetracycline Oxytetracycline 72 3 (4.2%) 2 (2.7%) 5 (6.9%) 67 (93.1%)Macrolide Tilmicosin 72 2 (2.8%) 0 (0%) 2 (2.8%) 70 (97.2%)Macrolide Tulathromycin 72 6 (8.3%) 0 (0%) 6 (8.3%) 66 (91.7%)
Macrolide Tilmicosin ortulathromycin 72 6 (8.3%) 0 (0%) 6 (8.3%) 66 (91.7%)
P. multocida
Lung
Tetracycline Oxytetracycline 96 28 (29.2%) 2 (2.1%) 30 (31.3%) 66 (68.7%)Macrolide Tilmicosin 95 15 (15.8%) 1 (1.0%) 16 (16.8%) 79 (83.2%)Macrolide Tulathromycin 96 9 (9.4%) 1 (1.1%) 10 (10.5%) 86 (89.5%)
Macrolide Tilmicosin ortulathromycin 95 15 (15.8%) 1 (1.0%) 16 (16.8%) 79 (83.2%)
Nasal
Tetracycline Oxytetracycline 78 15 (19.2%) 0 (0%) 15 (19.2%) 63 (80.8%)Macrolide Tilmicosin 80 6 (7.5%) 0 (0%) 6 (7.5%) 74 (92.5%)Macrolide Tulathromycin 78 1 (1.3%) 3 (3.8%) 4 (5.1%) 74 (94.9%)
Macrolide Tilmicosin ortulathromycin 80 7 (8.8%) 0 (0%) 7 (8.8%) 73 (91.2%)
H. somni
Lung
Tetracycline Oxytetracycline 93 41 (44.1%) 8 (8.6%) 49 (52.7%) 44 (47.3%)Macrolide Tilmicosin 93 20 (21.5%) 1 (1.1%) 21 (22.6%) 72 (77.4%)Macrolide Tulathromycin 93 20 (21.5%) 8 (8.6%) 28 (30.1%) 65 (69.9%)
Macrolide Tilmicosin ortulathromycin 93 26 (28.0%) 6 (6.4%) 32 (34.4%) 61 (65.6%)
Nasal
Tetracycline Oxytetracycline 29 13 (44.8%) 0 (0%) 13 (44.8%) 16 (55.2%)Macrolide Tilmicosin 29 2 (6.9%) 1 (3.4%) 3 (10.3%) 26 (89.7%)Macrolide Tulathromycin 28 5 (17.9%) 2 (7.1%) 7 (25.0%) 21 (75.0%)
Macrolide Tilmicosin ortulathromycin 28 6 (21.4%) 3 (10.7%) 9 (32.1%) 19 (67.9%)
Pathogens 2021, 10, 64 7 of 21
Table 3. Cont.
Pathogen Sample Class Antibiotics No. of Total SamplesNo. (Percentage) of Samples with 1
R I R+I S
At least oneBRD pathogen
Lung
Tetracycline Oxytetracycline 296 124 (41.9%) 8 (2.7%) 132 (44.6%) 164 (55.4%)Macrolide Tilmicosin 295 95 (32.2%) 6 (2.0%) 101 (34.2%) 194 (65.8%)Macrolide Tulathromycin 296 87 (29.4%) 8 (2.7%) 95 (32.1%) 197 (67.9%)
Macrolide Tilmicosin ortulathromycin 295 105 (35.6%) 4 (1.3%) 109 (36.9%) 182 (63.1%)
Nasal
Tetracycline Oxytetracycline 108 23 (21.3%) 2 (1.8%) 25 (23.1%) 83 (76.9%)Macrolide Tilmicosin 108 11 (10.2%) 0 (0.0%) 11 (10.2%) 97 (89.8%)Macrolide Tulathromycin 108 11 (10.2%) 5 (4.6%) 16 (14.8%) 92 (85.2%)
Macrolide Tilmicosin ortulathromycin 108 19 (17.6%) 2 (1.8%) 21 (19.4%) 87 (80.6%)
1 S, R, I denotes susceptible, resistant, and intermediate resistant to the drug classified based on MIC test and CLSI breakpoints, and the categories of R and I are combined into a new category of “resistant”, or R+I.
Table 4. Phenotypic classification of antimicrobial resistance based on minimum inhibitory concentration measurements by antibiotics tested in this study.
Class AntibioticsAntimicrobial Resistance Classification
Susceptible (S) Intermediate (I) Resistant (R) “Resistant” (R+I)
Tetracycline Oxytetracycline ≤2 >2 and ≤8 >8 >2Macrolide Tilmicosin ≤8 >8 and ≤32 >32 >8Macrolide Tulathromycin ≤16 >16 and ≤32 >32 >16
Pathogens 2021, 10, 64 8 of 21
2.3. Optimal Ct Cutoff Value Determination
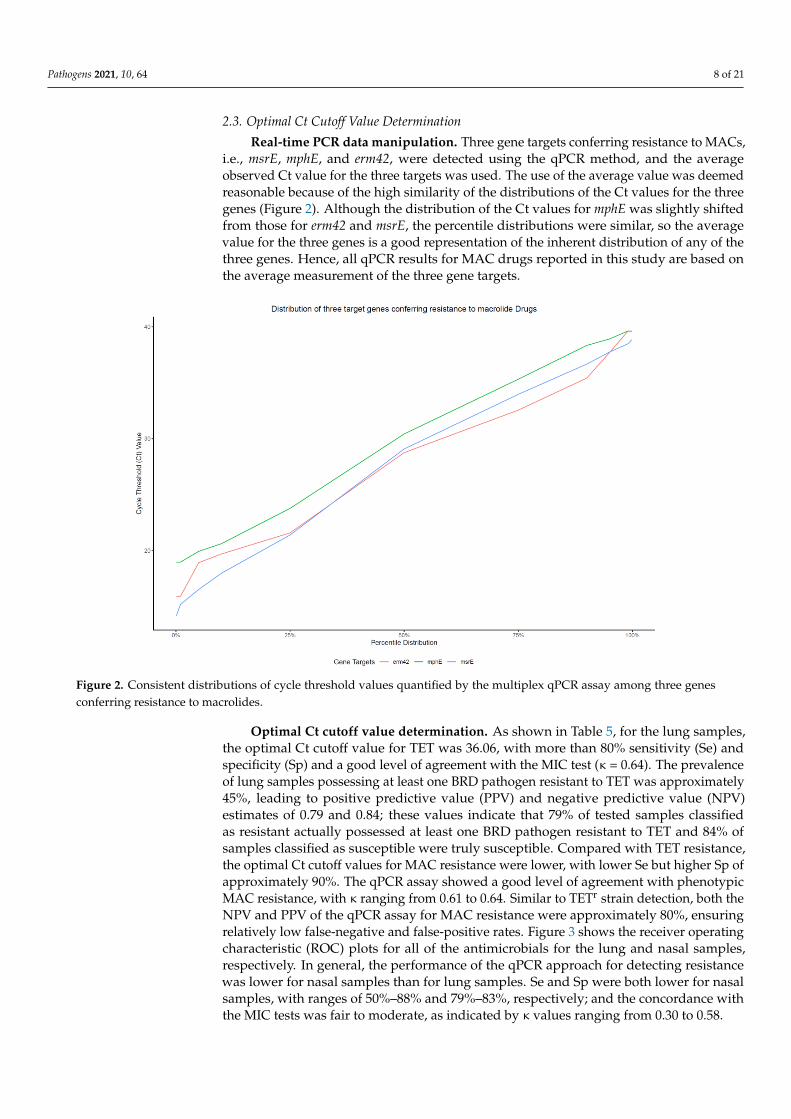
Real-time PCR data manipulation. Three gene targets conferring resistance to MACs,i.e., msrE, mphE, and erm42, were detected using the qPCR method, and the averageobserved Ct value for the three targets was used. The use of the average value was deemedreasonable because of the high similarity of the distributions of the Ct values for the threegenes (Figure 2). Although the distribution of the Ct values for mphE was slightly shiftedfrom those for erm42 and msrE, the percentile distributions were similar, so the averagevalue for the three genes is a good representation of the inherent distribution of any of thethree genes. Hence, all qPCR results for MAC drugs reported in this study are based onthe average measurement of the three gene targets.
Pathogens 2021, 10, x FOR PEER REVIEW 1 of 22
Resistant BRD pathogen isolation. Based on the newly defined category R+I, the
prevalence of TETr BRD pathogens was higher than that of MACr pathogens for all path-
ogens and sample types. TET resistance prevalence ranged from 19.2% to 52.7%, while
MAC resistance prevalence was between 8.8% and 39.3%. The only exception was M. hae-
molytica isolated from nasal samples, in which the prevalence of TET resistance (6.9%) was
slightly lower than that of MAC resistance (8.3%). In addition, the occurrence of antimi-
crobial-resistant BRD pathogens was always higher in lung samples than in nasal samples.
Specifically, 44.6% of lung samples and 23.1% of nasal samples possessed at least one TETr
pathogen, while 36.9% of lung samples and 19.4% of nasal samples possessed at least one
MACr pathogen. The same trends were observed for all resistant BRD pathogens.
2.3. Optimal Ct Cutoff Value Determination
Real-time PCR data manipulation. Three gene targets conferring resistance to
MACs, i.e., msrE, mphE, and erm42, were detected using the qPCR method, and the aver-
age observed Ct value for the three targets was used. The use of the average value was
deemed reasonable because of the high similarity of the distributions of the Ct values for
the three genes (Figure 2). Although the distribution of the Ct values for mphE was slightly
shifted from those for erm42 and msrE, the percentile distributions were similar, so the
average value for the three genes is a good representation of the inherent distribution of
any of the three genes. Hence, all qPCR results for MAC drugs reported in this study are
based on the average measurement of the three gene targets.
Figure 2. Consistent distributions of cycle threshold values quantified by the multiplex qPCR assay among three genes
conferring resistance to macrolides.
Figure 2. Consistent distributions of cycle threshold values quantified by the multiplex qPCR assay among three genesconferring resistance to macrolides.
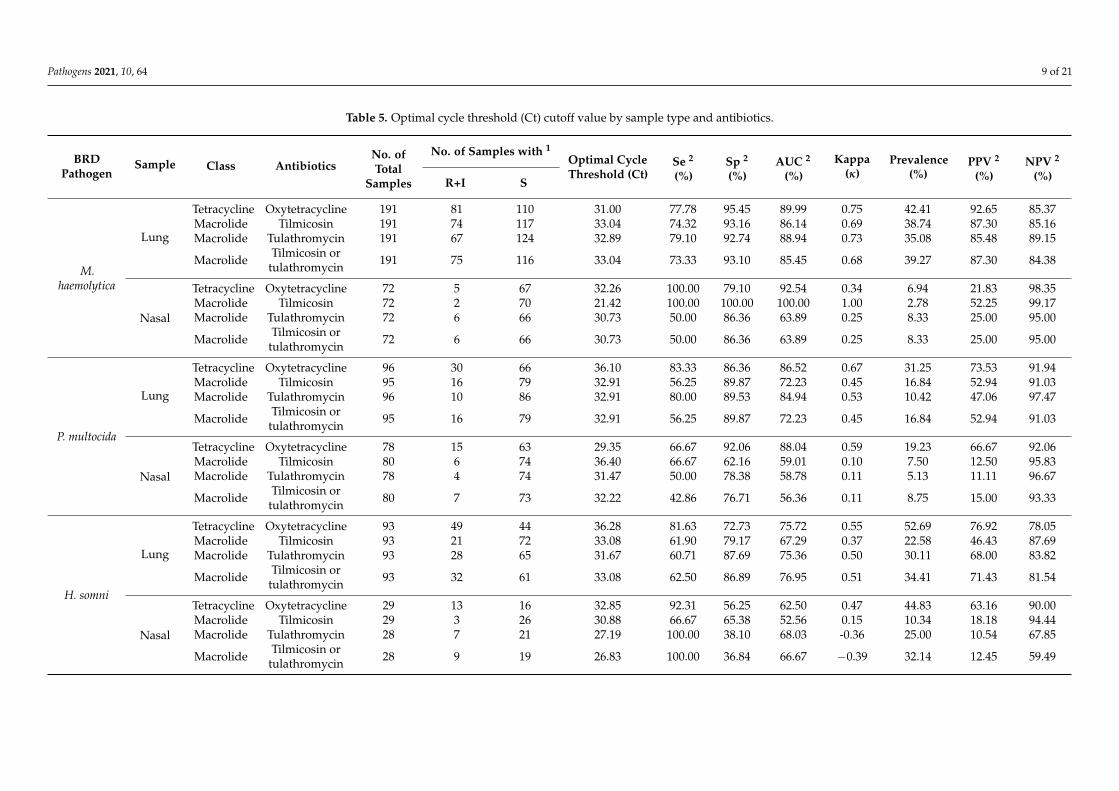
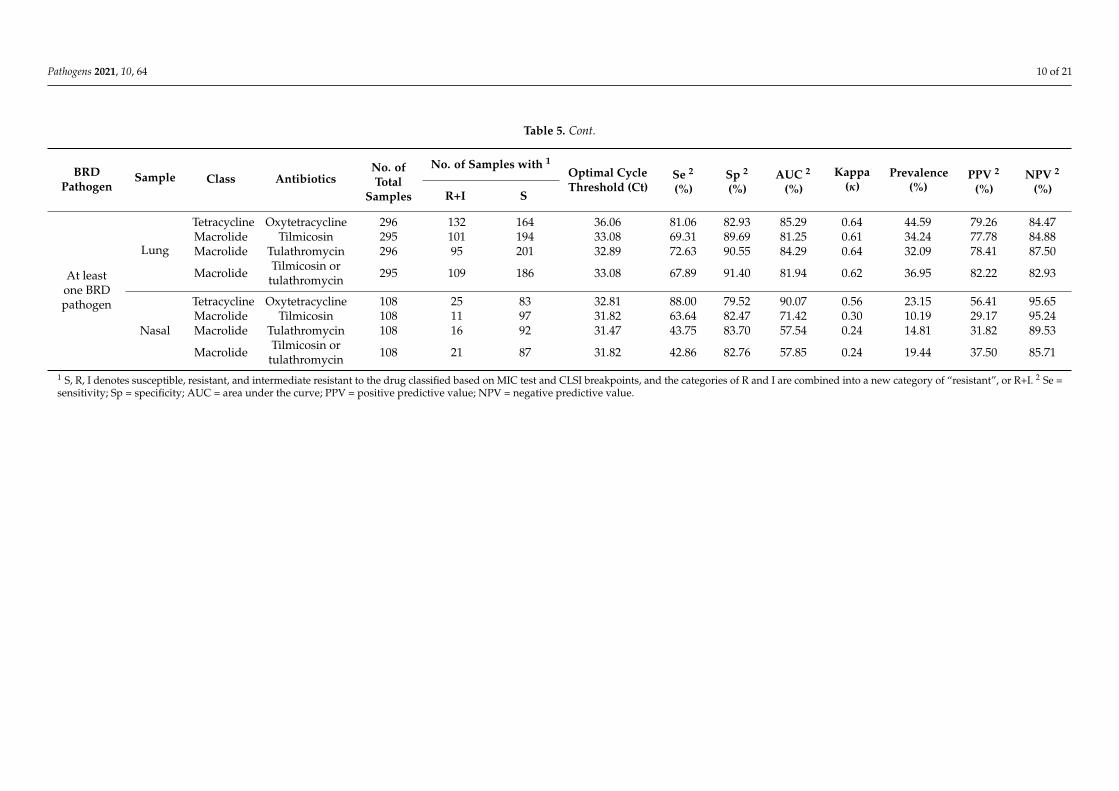
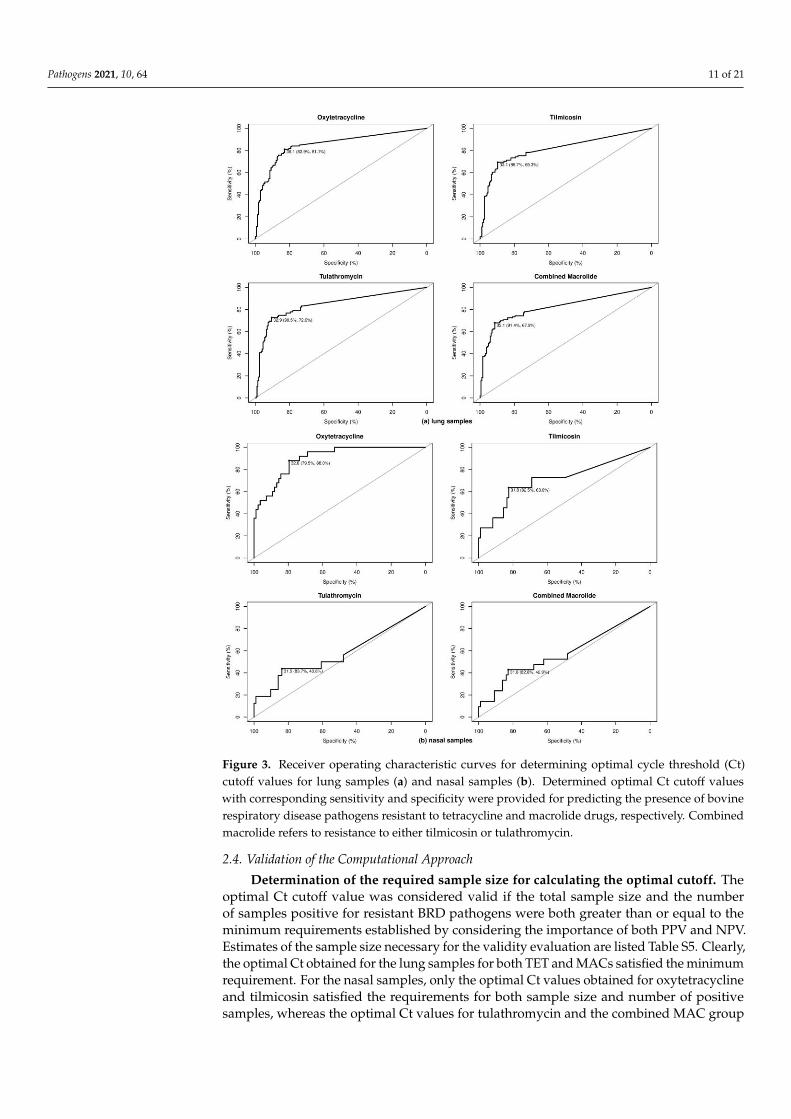
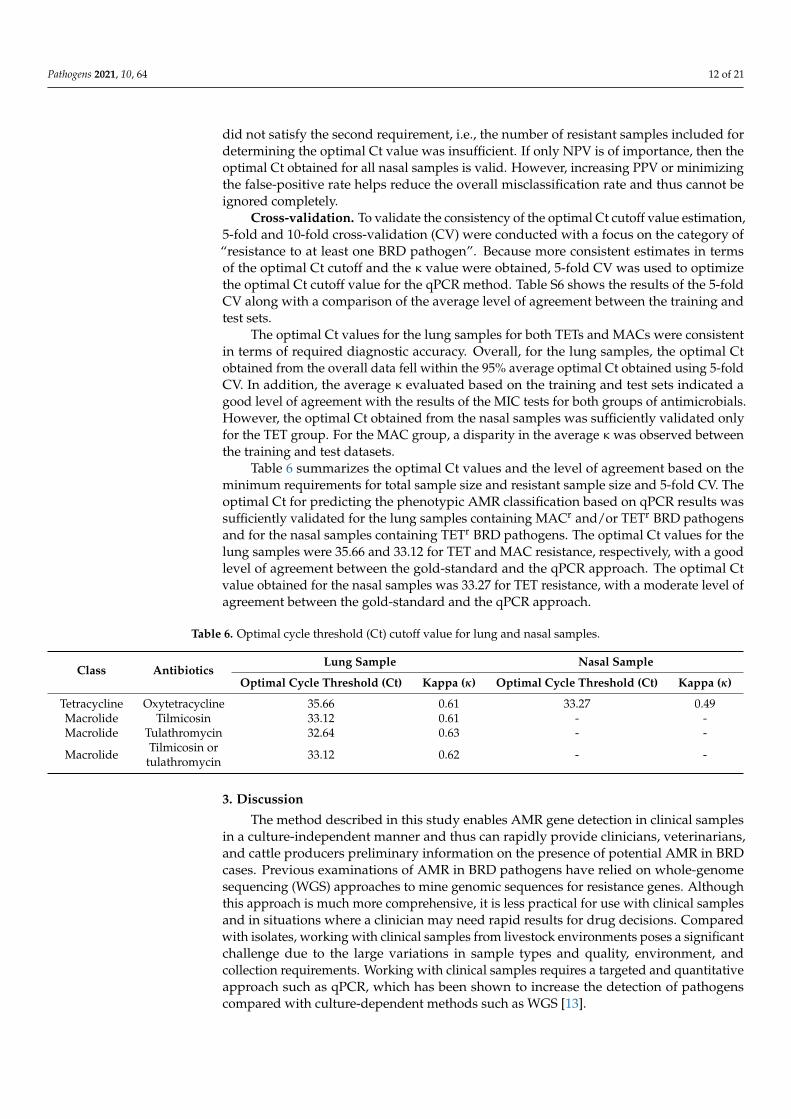
Optimal Ct cutoff value determination. As shown in Table 5, for the lung samples,the optimal Ct cutoff value for TET was 36.06, with more than 80% sensitivity (Se) andspecificity (Sp) and a good level of agreement with the MIC test (κ = 0.64). The prevalenceof lung samples possessing at least one BRD pathogen resistant to TET was approximately45%, leading to positive predictive value (PPV) and negative predictive value (NPV)estimates of 0.79 and 0.84; these values indicate that 79% of tested samples classifiedas resistant actually possessed at least one BRD pathogen resistant to TET and 84% ofsamples classified as susceptible were truly susceptible. Compared with TET resistance,the optimal Ct cutoff values for MAC resistance were lower, with lower Se but higher Sp ofapproximately 90%. The qPCR assay showed a good level of agreement with phenotypicMAC resistance, with κ ranging from 0.61 to 0.64. Similar to TETr strain detection, both theNPV and PPV of the qPCR assay for MAC resistance were approximately 80%, ensuringrelatively low false-negative and false-positive rates. Figure 3 shows the receiver operatingcharacteristic (ROC) plots for all of the antimicrobials for the lung and nasal samples,respectively. In general, the performance of the qPCR approach for detecting resistancewas lower for nasal samples than for lung samples. Se and Sp were both lower for nasalsamples, with ranges of 50%–88% and 79%–83%, respectively; and the concordance withthe MIC tests was fair to moderate, as indicated by κ values ranging from 0.30 to 0.58.
Pathogens 2021, 10, 64 9 of 21
Table 5. Optimal cycle threshold (Ct) cutoff value by sample type and antibiotics.
BRDPathogen
Sample Class AntibioticsNo. ofTotal
Samples
No. of Samples with 1Optimal CycleThreshold (Ct)
Se 2
(%)Sp 2
(%)AUC 2
(%)Kappa
(κ)Prevalence
(%)PPV 2
(%)NPV 2
(%)R+I S
M.haemolytica
Lung
Tetracycline Oxytetracycline 191 81 110 31.00 77.78 95.45 89.99 0.75 42.41 92.65 85.37Macrolide Tilmicosin 191 74 117 33.04 74.32 93.16 86.14 0.69 38.74 87.30 85.16Macrolide Tulathromycin 191 67 124 32.89 79.10 92.74 88.94 0.73 35.08 85.48 89.15
Macrolide Tilmicosin ortulathromycin 191 75 116 33.04 73.33 93.10 85.45 0.68 39.27 87.30 84.38
Nasal
Tetracycline Oxytetracycline 72 5 67 32.26 100.00 79.10 92.54 0.34 6.94 21.83 98.35Macrolide Tilmicosin 72 2 70 21.42 100.00 100.00 100.00 1.00 2.78 52.25 99.17Macrolide Tulathromycin 72 6 66 30.73 50.00 86.36 63.89 0.25 8.33 25.00 95.00
Macrolide Tilmicosin ortulathromycin 72 6 66 30.73 50.00 86.36 63.89 0.25 8.33 25.00 95.00
P. multocida
Lung
Tetracycline Oxytetracycline 96 30 66 36.10 83.33 86.36 86.52 0.67 31.25 73.53 91.94Macrolide Tilmicosin 95 16 79 32.91 56.25 89.87 72.23 0.45 16.84 52.94 91.03Macrolide Tulathromycin 96 10 86 32.91 80.00 89.53 84.94 0.53 10.42 47.06 97.47
Macrolide Tilmicosin ortulathromycin 95 16 79 32.91 56.25 89.87 72.23 0.45 16.84 52.94 91.03
Nasal
Tetracycline Oxytetracycline 78 15 63 29.35 66.67 92.06 88.04 0.59 19.23 66.67 92.06Macrolide Tilmicosin 80 6 74 36.40 66.67 62.16 59.01 0.10 7.50 12.50 95.83Macrolide Tulathromycin 78 4 74 31.47 50.00 78.38 58.78 0.11 5.13 11.11 96.67
Macrolide Tilmicosin ortulathromycin 80 7 73 32.22 42.86 76.71 56.36 0.11 8.75 15.00 93.33
H. somni
Lung
Tetracycline Oxytetracycline 93 49 44 36.28 81.63 72.73 75.72 0.55 52.69 76.92 78.05Macrolide Tilmicosin 93 21 72 33.08 61.90 79.17 67.29 0.37 22.58 46.43 87.69Macrolide Tulathromycin 93 28 65 31.67 60.71 87.69 75.36 0.50 30.11 68.00 83.82
Macrolide Tilmicosin ortulathromycin 93 32 61 33.08 62.50 86.89 76.95 0.51 34.41 71.43 81.54
Nasal
Tetracycline Oxytetracycline 29 13 16 32.85 92.31 56.25 62.50 0.47 44.83 63.16 90.00Macrolide Tilmicosin 29 3 26 30.88 66.67 65.38 52.56 0.15 10.34 18.18 94.44Macrolide Tulathromycin 28 7 21 27.19 100.00 38.10 68.03 -0.36 25.00 10.54 67.85
Macrolide Tilmicosin ortulathromycin 28 9 19 26.83 100.00 36.84 66.67 −0.39 32.14 12.45 59.49
Pathogens 2021, 10, 64 10 of 21
Table 5. Cont.
BRDPathogen
Sample Class AntibioticsNo. ofTotal
Samples
No. of Samples with 1Optimal CycleThreshold (Ct)
Se 2
(%)Sp 2
(%)AUC 2
(%)Kappa
(κ)Prevalence
(%)PPV 2
(%)NPV 2
(%)R+I S
At leastone BRDpathogen
Lung
Tetracycline Oxytetracycline 296 132 164 36.06 81.06 82.93 85.29 0.64 44.59 79.26 84.47Macrolide Tilmicosin 295 101 194 33.08 69.31 89.69 81.25 0.61 34.24 77.78 84.88Macrolide Tulathromycin 296 95 201 32.89 72.63 90.55 84.29 0.64 32.09 78.41 87.50
Macrolide Tilmicosin ortulathromycin 295 109 186 33.08 67.89 91.40 81.94 0.62 36.95 82.22 82.93
Nasal
Tetracycline Oxytetracycline 108 25 83 32.81 88.00 79.52 90.07 0.56 23.15 56.41 95.65Macrolide Tilmicosin 108 11 97 31.82 63.64 82.47 71.42 0.30 10.19 29.17 95.24Macrolide Tulathromycin 108 16 92 31.47 43.75 83.70 57.54 0.24 14.81 31.82 89.53
Macrolide Tilmicosin ortulathromycin 108 21 87 31.82 42.86 82.76 57.85 0.24 19.44 37.50 85.71
1 S, R, I denotes susceptible, resistant, and intermediate resistant to the drug classified based on MIC test and CLSI breakpoints, and the categories of R and I are combined into a new category of “resistant”, or R+I. 2 Se =sensitivity; Sp = specificity; AUC = area under the curve; PPV = positive predictive value; NPV = negative predictive value.
Pathogens 2021, 10, 64 11 of 21
Pathogens 2021, 10, x FOR PEER REVIEW 2 of 22
Optimal Ct cutoff value determination. As shown in Table 5, for the lung samples,
the optimal Ct cutoff value for TET was 36.06, with more than 80% sensitivity (Se) and spec-
ificity (Sp) and a good level of agreement with the MIC test (κ = 0.64). The prevalence of
lung samples possessing at least one BRD pathogen resistant to TET was approximately
45%, leading to positive predictive value (PPV) and negative predictive value (NPV) esti-
mates of 0.79 and 0.84; these values indicate that 79% of tested samples classified as resistant
actually possessed at least one BRD pathogen resistant to TET and 84% of samples classified
as susceptible were truly susceptible. Compared with TET resistance, the optimal Ct cutoff
values for MAC resistance were lower, with lower Se but higher Sp of approximately 90%.
The qPCR assay showed a good level of agreement with phenotypic MAC resistance, with
κ ranging from 0.61 to 0.64. Similar to TETr strain detection, both the NPV and PPV of the
qPCR assay for MAC resistance were approximately 80%, ensuring relatively low false-neg-
ative and false-positive rates. Figure 3 shows the receiver operating characteristic (ROC)
plots for all of the antimicrobials for the lung and nasal samples, respectively. In general,
the performance of the qPCR approach for detecting resistance was lower for nasal samples
than for lung samples. Se and Sp were both lower for nasal samples, with ranges of 50%–
88% and 79%–83%, respectively; and the concordance with the MIC tests was fair to mod-
erate, as indicated by κ values ranging from 0.30 to 0.58.
Pathogens 2021, 10, x FOR PEER REVIEW 3 of 22
Figure 3. Receiver operating characteristic curves for determining optimal cycle threshold (Ct) cutoff values for lung sam-
ples (a) and nasal samples (b). Determined optimal Ct cutoff values with corresponding sensitivity and specificity were
provided for predicting the presence of bovine respiratory disease pathogens resistant to tetracycline and macrolide drugs,
respectively. Combined macrolide refers to resistance to either tilmicosin or tulathromycin.
Figure 3. Receiver operating characteristic curves for determining optimal cycle threshold (Ct)cutoff values for lung samples (a) and nasal samples (b). Determined optimal Ct cutoff valueswith corresponding sensitivity and specificity were provided for predicting the presence of bovinerespiratory disease pathogens resistant to tetracycline and macrolide drugs, respectively. Combinedmacrolide refers to resistance to either tilmicosin or tulathromycin.
2.4. Validation of the Computational Approach
Determination of the required sample size for calculating the optimal cutoff. Theoptimal Ct cutoff value was considered valid if the total sample size and the numberof samples positive for resistant BRD pathogens were both greater than or equal to theminimum requirements established by considering the importance of both PPV and NPV.Estimates of the sample size necessary for the validity evaluation are listed Table S5. Clearly,the optimal Ct obtained for the lung samples for both TET and MACs satisfied the minimumrequirement. For the nasal samples, only the optimal Ct values obtained for oxytetracyclineand tilmicosin satisfied the requirements for both sample size and number of positivesamples, whereas the optimal Ct values for tulathromycin and the combined MAC group
Pathogens 2021, 10, 64 12 of 21
did not satisfy the second requirement, i.e., the number of resistant samples included fordetermining the optimal Ct value was insufficient. If only NPV is of importance, then theoptimal Ct obtained for all nasal samples is valid. However, increasing PPV or minimizingthe false-positive rate helps reduce the overall misclassification rate and thus cannot beignored completely.
Cross-validation. To validate the consistency of the optimal Ct cutoff value estimation,5-fold and 10-fold cross-validation (CV) were conducted with a focus on the category of“resistance to at least one BRD pathogen”. Because more consistent estimates in termsof the optimal Ct cutoff and the κ value were obtained, 5-fold CV was used to optimizethe optimal Ct cutoff value for the qPCR method. Table S6 shows the results of the 5-foldCV along with a comparison of the average level of agreement between the training andtest sets.
The optimal Ct values for the lung samples for both TETs and MACs were consistentin terms of required diagnostic accuracy. Overall, for the lung samples, the optimal Ctobtained from the overall data fell within the 95% average optimal Ct obtained using 5-foldCV. In addition, the average κ evaluated based on the training and test sets indicated agood level of agreement with the results of the MIC tests for both groups of antimicrobials.However, the optimal Ct obtained from the nasal samples was sufficiently validated onlyfor the TET group. For the MAC group, a disparity in the average κ was observed betweenthe training and test datasets.
Table 6 summarizes the optimal Ct values and the level of agreement based on theminimum requirements for total sample size and resistant sample size and 5-fold CV. Theoptimal Ct for predicting the phenotypic AMR classification based on qPCR results wassufficiently validated for the lung samples containing MACr and/or TETr BRD pathogensand for the nasal samples containing TETr BRD pathogens. The optimal Ct values for thelung samples were 35.66 and 33.12 for TET and MAC resistance, respectively, with a goodlevel of agreement between the gold-standard and the qPCR approach. The optimal Ctvalue obtained for the nasal samples was 33.27 for TET resistance, with a moderate level ofagreement between the gold-standard and the qPCR approach.
Table 6. Optimal cycle threshold (Ct) cutoff value for lung and nasal samples.
Class AntibioticsLung Sample Nasal Sample
Optimal Cycle Threshold (Ct) Kappa (κ) Optimal Cycle Threshold (Ct) Kappa (κ)
Tetracycline Oxytetracycline 35.66 0.61 33.27 0.49Macrolide Tilmicosin 33.12 0.61 - -Macrolide Tulathromycin 32.64 0.63 - -
Macrolide Tilmicosin ortulathromycin 33.12 0.62 - -
3. Discussion
The method described in this study enables AMR gene detection in clinical samplesin a culture-independent manner and thus can rapidly provide clinicians, veterinarians,and cattle producers preliminary information on the presence of potential AMR in BRDcases. Previous examinations of AMR in BRD pathogens have relied on whole-genomesequencing (WGS) approaches to mine genomic sequences for resistance genes. Althoughthis approach is much more comprehensive, it is less practical for use with clinical samplesand in situations where a clinician may need rapid results for drug decisions. Comparedwith isolates, working with clinical samples from livestock environments poses a significantchallenge due to the large variations in sample types and quality, environment, andcollection requirements. Working with clinical samples requires a targeted and quantitativeapproach such as qPCR, which has been shown to increase the detection of pathogenscompared with culture-dependent methods such as WGS [13].
Pathogens 2021, 10, 64 13 of 21
In developing this assay for use in a rapid format with clinical samples, our goalwas to select robust gene targets with spatial and temporal consistency in BRD pathogenstrain genomes and that confer resistance to highly relevant drug classes. Consequently,the performance of the method for both TETs and MACs was evaluated using ATCC-and clinical sample-sourced strains that have been subjected to MIC testing and/or WGS.Overall, the developed multiplex qPCR method performed well with high specificity fordetecting the target AMR genes. In the initial validation, evaluation of the phenotypic–genotypic agreement using less comprehensive methods showed high levels of agreementfor M. haemolytica, P. multocida and B. trehalosi. By contrast, for H. somni, disagreementbetween the results of the multiplex qPCR assay and phenotypic AMR classification usingMIC was observed for 9 of 35 strains tested. Potential explanations for this discrepancyinclude alternative mechanisms of phenotypic resistance or inactive resistance genes inthese strains.
The results indicate that this method may be particularly useful for assessing thepresence of TET or MAC resistance in BRD pathogens in general or in M. haemolytica, oneof the most dominant bacterial pathogens. TETs and MACs were chosen as the targetdrug classes because they are often used as first-line treatments for BRD. More than 70%of drugs used for the treatment or prevention of BRD in the United States are MACs(including tulathromycin, tilmicosin, tildipirosin, and gamithromycin), followed by TETs(mainly oxytetracycline, ~9%) [9,17,18]. Determinants conferring resistance to MACs orTETs in the population of BRD pathogens are frequently carried on ICE elements, revealinga potential challenge in the use of these important drugs for BRD disease treatment and/orprevention [19,20]. The ability to rapidly identify AMR to these drugs would be criticallyuseful to veterinarians in the field, who could rapidly adjust their treatment or preventiontherapies in response to the detection of such resistance [19].
One of the largest challenges in developing our assay was ensuring the concordancebetween phenotypic AMR status and the detection of genes conferring resistance in com-plex clinical samples. Investigations of concordance between genotypic and phenotypicresistance based on WGS or selected genes are increasing [21,22], and like the presentstudy, most previous works have found substantial variation in the level of concordancedepending on the combination of bacterial species, resistance gene(s) and resistance type.To construct our assay, we selected genes conferring resistance to TETs and MACs thatare most commonly found in BRD pathogens and observed good agreement with corre-sponding phenotypic resistance for some combinations. However, discrepancies betweengenotypic and phenotypic resistance are not surprising, given the challenges of workingwith clinical samples outlined above and the large number of potential resistance genes.In one of the most comprehensive databases, ResFinder, more than 140 and 180 genesor gene variants encoding TET or MAC resistance, respectively, have been reported todate [23]. A more comprehensive gene panel may increase the predictive capability ofour proposed qPCR assay of resistance in BRD bacterial pathogens. Our in silico analysisshowed that the gene targets are potentially carried by other non-BRD pathogen bacteria,which might cause false-positive results if these bacteria were present in sufficient numbersin clinical samples.
The performance of the PCR-based rapid detection method was most optimal forpredicting collective phenotypic resistance among all coexisting BRD pathogens in a singlesample. In the MIC test, AMR classification is pathogen dependent, whereas qPCR detectsgenes in a culture-independent manner regardless of bacterial source. Therefore, a collectivephenotypic resistance status for a sample, defined as possessing at least one resistantbacterial pathogen, enables a more rational comparison between the results of MIC testingand qPCR. For predicting phenotypic resistance in individual pathogens, the assay showedthe most promise for M. haemolytica in lung tissues for both TETs and MACs. Loweragreement was observed for nasal swabs or for H. somni isolates, likely due to challengesin the use of the gold-standard method with nasal swab samples and the isolation ofH. somni from all sample types. Nasal swab samples are frequently contaminated with
Pathogens 2021, 10, 64 14 of 21
environmental bacteria, which makes recovery of BRD pathogens challenging. Additionally,because H. somni is sensitive to oxygen and a fastidious organism, recovery is low, and false-negative testing results are common. Overall, the results indicate that the newly developedPCR-based rapid detection method is valid for determining the potential likelihood ofresistance to TETs and MACs in at least one BRD pathogen or M. haemolytica, the mostprevalent BRD pathogen, isolated from bovine lung tissues.
The ROC approach used in our study is in essence a classification method. The gold-standard, culture-based MIC approach gives a dichotomous outcome of resistance or suscep-tibility to antimicrobials, while the qPCR assay uses a Ct cutoff to transpose the continuousvalues produced into a finding of resistance or susceptibility. If the purpose of the qPCRassay was to rule out the presence of resistance in a clinical sample for BRD diagnosis basedon a susceptible result, a higher Ct cutoff could be used to generate a “rule-out” test with ahigh Se or low false negatives in detecting resistance. Conversely, a lower Ct cutoff would bemore likely to identify infections with the resistance of interest; such a “rule-in” test wouldhave a higher Sp and lower false positives, resulting in higher confidence in the presenceof resistance in a sample when a resistant result is observed. In the present study, the ROCapproach was used to determine the optimal Ct cutoff by prioritizing a balance between Seand Sp. However, because the qPCR approach provides continuous information, it allows forflexibility in assay design for multiple purposes (such as a priority for “rule-in” or “rule-out”purpose) in real-world scenarios by varying the Ct cutoff.
Although the properties of diagnostic tests are generally expressed by Se and Sp, PPVand NPV are also considered important indicators of a test’s usefulness. Unlike Se and Sp,PPV and NPV depend heavily on prevalence, which in the present study was the prevalenceof resistant BRD pathogens determined using the gold-standard method. A low prevalenceof AMR would lead to a higher false-positive rate and imply lower PPV, whereas a highprevalence of AMR would lead to a higher false-negative rate and imply lower NPV. In thepresent study, AMR was more likely to be detected in lung samples than in nasal samples(Table 5), which is largely attributable to the fact that the prevalence of AMR in the samplesin this study was lower among nasal samples (Table 3). As a result, the nasal sampleshad a lower prevalence and PPV, which is the primary reason why the optimal Ct cutoffvalues obtained for nasal samples were not valid. By contrast, the prevalence of AMR wasconsiderably higher among the lung samples, providing a more balanced outcome in favorof the estimation of Se, Sp, PPV and NPV. Compared with the lung samples, the estimates ofSe and Sp for the nasal samples were similar, but PPV was much lower, resulting in invalidestimates of the optimal Ct cutoff values. These results suggest that the most effectiveapplication of the qPCR assay for phenotypic AMR classification is situations in which thepresence of AMR is not uncommon, such as during BRD outbreaks.
Although this novel application for predicting AMR phenotypes based on genotypicdata could potentially be translated into a rapid assay for use in a variety of platforms,including pen side or in veterinary clinics, several limitations remain to be addressed. First,the data on phenotypic resistance were recategorized into binary outcomes due to theinsufficient number of samples with intermediate resistance, and the ROC approach isless optimal for discriminating among more than two classifiers. Second, the classificationwas conducted for specific pathogen–sample–resistance type combinations in a series ofstratified analyses but did not include predictors other than the Ct value, such as historicalor clinical information like antimicrobial treatments, which might greatly influence thedevelopment of resistance. Third, to estimate the optimal Ct value, the ROC approachemployed area under the curve (AUC), which is a widely used methodology but may befurther improved because its use of a threshold of 50% for classification ignores the actualprobability. To potentially address these limitations and increase the accuracy of diagnosisof AMR among BRD infections using PCR-based rapid detection methods, alternativeclassification methods, such as the H measure approach, warrant investigation [24].
In conclusion, the rapid multiplex real time-based PCR detection assay reported here,which can estimate levels of AMR genes potentially associated with multiple species of
Pathogens 2021, 10, 64 15 of 21
BRD pathogens, holds promise for the rapid detection of these genes in complex samples.By combining this gene detection assay with a pathogen-specific assay that can quantifypathogen abundance in samples, veterinarians could rapidly assess the risk of BRD causedby a potentially resistant pathogen, thereby enabling judicious use of antimicrobials incattle production systems. Further expansion of the number of gene targets may enablemore robust AMR assessments of complex samples.
4. Materials and Methods4.1. Sample Collection and Distribution
Bovine lung tissue and nasal swab samples were collected over a one-year period in2018 from submissions, mainly for BRD diagnostic testing, to the University of Nebraska-Lincoln Veterinary Diagnostic Center and combined with an archived sample collectionthat had been stored at −80 ◦C from 2012 to 2017. Although detailed clinical informationwas not available for many submissions, most of these samples were likely collected fromnon-healthy, clinically ill animals since they were submitted to a veterinary diagnosticlab for BRD diagnosis. A total of 416 bovine clinical samples were collected, primarilyconsisting of lung tissues (n = 297) and nasal swabs (n = 111). Omitted samples thatwere excluded from further data analysis were either tissues less related to BRD diagnosis(n = 4, i.e., skin and liver samples) or lacked records about tissue type (n = 4). The sampleswere analyzed for the existence of target BRD bacterial pathogens. If the pathogens weredetected, phenotypic AMR characteristics were subsequently determined using the gold-standard culture-based method. In addition, target genes conferring AMR in the sampleswere quantified using the culture-independent qPCR rapid detection method developed inthis present study.
4.2. Reference Strains
ATCC-sourced strains, a collection of field isolates from diagnostic cases, and off-targetcontrols were used for a preliminary evaluation of the target specificity of the qPCR assay.M. haemolytica strains that had been previously subjected to WGS and with establishedpresence or absence of the AMR targets and ICE elements were used to capture the knowngenomic diversity of this pathogen (Table S3 [19,25]). H. somni, P. multocida, and B. trehalosistrains isolated from clinical cases that had been subjected to MIC testing were also usedfor evaluation purposes along with ATCC reference strains (Table S4). Bibersteinia trehalosiwas included in the reference set because it is occasionally isolated from BRD cases and hasshown AMR [26]. This collection of reference strains was employed only for evaluatingassay performance and specificity and was excluded from further data analysis of theclinical samples.
4.3. Molecular-Based Rapid Detection Assay
Nucleic acid extraction. For initial validation, nucleic acids were extracted fromreference strains in pure subculture, as described previously [13]. Briefly, a single purifiedcolony was resuspended in nuclease-free water, boiled at 100 ◦C for 10 min and clarifiedby centrifugation at 15,700 RCF for 2 min. Swabs, which were submitted to the laboratoryin various liquid transport media from referring veterinarians, were vortexed vigorously,and 100 µL of the transport medium was combined with lysis solution and extractedusing a MagMax Total Nucleic isolation kit (AM1840) on a Kingfisher flex instrument(Thermo Scientific) following the manufacturer’s instructions. Lung tissue samples wereadded to a filter Whirl-Pak (Nasco, Fort Atkinson, WI) with 1–5 mL of sterile phosphate-buffered saline (PBS) and placed in a stomacher for 30–60 s. Following stomaching, 2 mL ofsuspension was removed from the bag, centrifuged at 15,700 RCF for 2 min and extractedusing the MagMax procedure and kit, as described above.
qPCR assay. A multiplexed hydrolysis nucleic acid probe assay was designed basedon whole-genome sequences of M. haemolytica strains possessing ICE elements containingAMR genes. Four gene targets carried on the ICEs were selected, including three that
Pathogens 2021, 10, 64 16 of 21
confer resistance to MACs (msrE, mphE, and erm42) and one that is the repressor gene forTET class drug resistance (ICEtetR). The primer and probe sequences were designed byusing PrimerQuest software (IDT, Iowa City) using genomic sequences from a referencestrain of M. haemolytica [19] (Table 7). In silico analyses of the primer and probe sequenceswere conducted to evaluate the use of these targets in addition to M. haemolytica strainswith the ICEs and four AMR genes and in strains of P. multocida and H. somni.
Table 7. Oligonucleotide sequences for primers and probes used in the assay.
Target Primer/Probe Sequence (5′-3′) Size Reference
tetR ICEtetR-F TTTGGCTTTCTTGATGCTCTTG 71 This paperICEtetR-R GTGATGCTGGGTTTAGTCTATCTICEtetR-P
(CY5/TAO-IAB-RQ) CGCAATAGAGCTTAATGCATACACGGC
erm42 erm42-F GCCGTTAATGCTATTGAGTTCG 105 This papererm42-R CGGCTTCAATAATAGACACATTTGAerm42-P
(FAM/ZEN-IAB-FQ) AGTGTATTGGCTGATAAGTTGAGCCATGA
msrE msrE-F GGGTGGTTACTCGGATTACTTG 88 This papermsrE-R CTCCCGTTCCTTCATCATCAG
msrE-P (TexasRed/IAB-RQ) AGCGACAACACCAAGCCGTAGAAT
mphE mphE-F TTGGAAACCCGCTACAGAAA 113 This papermphE-R GCTCCATCCTTTGAAGCTAGTmphE-P
(JOE/ZEN-IAB-FQ) TGATGTTCTATGGGCAGATTTCACCCA
Following in silico analysis, primers and probes were purchased from IntegratedDNA Technologies (IDT) and used in a single 4-plex reaction in a rotary-based real-timePCR instrument (Qiagen Rotorgene Q). Protocols were optimized for primer and probeconcentrations and annealing temperatures. The PCR master mix had a total volume of25 µL comprising 12.5 µL of 2× Quantifast Multiplex PCR Master Mix (Qiagen), 1 µL ofeach primer probe mix (4 µL total) containing F (10 µM), R (10 µM), and P (10 µM), 6.5 µLof nuclease-free water and 2 µL of template DNA. The thermocycling conditions were asfollows: 95 ◦C for 5 min, followed by 45 cycles of 95 ◦C for 15 s, and 59 ◦C for 40 s. TheCt threshold was set at a fixed value of 0.1 for all detection channels following dynamictube normalization.
Following optimization, assay performance was tested using reference strains, andlimit of detection analysis was conducted using a reference M. haemolytica strain knownthrough WGS to have all four genes (Reference strain 1621 in Table S3) [19]. The assay wasfurther validated using a panel of M. haemolytica strains (Table S3) previously characterizedby WGS and representing all known major genotypes and subtypes of M. haemolytica anddifferent combinations of AMR genes [19]. The assay gene targets have also been reportedin strains of H. somni and P. multocida isolated from cattle, and therefore strains of H. somniand P. multocida with phenotypic resistance patterns similar to those of the M. haemolyticastrain collection were also included in this validation (Table S4). In addition, analyses ofnon-target closely related strains, including B. trehalosi, and other ATCC reference strainswere performed (Table S4).
4.4. Preliminary Assay Validation and Analytical Sensitivity
Assay performance was evaluated for all four targets using DNA extracted from M.haemolytica reference strain 1621. Briefly, the strain was grown in pure culture on tryptic soyagar with 5% sheep blood (BAP) (Remel, Lenexa, KS). Colonies were picked and culturedin 10 mL of brain heart infusion broth in a 100 mL flask shaken at 200 RPM for 12 h. Serialdilutions (1:10) of this culture were plated on BAP to enumerate colonies and estimatecolony forming units/mL, and the remaining portion of each dilution was used for nucleic
Pathogens 2021, 10, 64 17 of 21
acid extraction, as described above, to evaluate assay performance and limit of detection(Table 1). Following the determinations of limit of detection and dynamic range, the targetspecificity of the assay was evaluated using a diverse collection of reference strains andcontrols (Table S4).
4.5. Pathogen Isolation and Determination of Phenotypic Antimicrobial Resistance Characteristics
BRD pathogen isolation and confirmation. All clinical samples were processed forbacterial isolation and identification of the BRD pathogens M. haemolytica, P. multocida,and H. somni, as described previously [13]. Briefly, samples were documented, processed,and tested by trained personnel following validated and approved standard operatingprocedures in an American Association of Veterinary Laboratory Diagnosticians (AAVLD)-accredited diagnostic laboratory. For bacterial culture, diseased portions of fresh lungtissues were excised using flame-sterilized scissors and dipped in alcohol. After flamesterilizing the exterior, the sample was bisected, and the cut surface was used to inoculateculture media. Swabs were used directly to inoculate plates if submitted in liquid mediumor otherwise were resuspended in approximately 1.5 mL of PBS. Colonies were isolated bystreaking on culture media, including BAP, chocolate agar, and MacConkey agar (Remel,Lenexa, KS), incubated in 5% CO2 and examined at 24 and 48 h after inoculation. Colonieswith morphologies consistent with M. haemolytica, P. multocida, or H. somni were identi-fied by MALDI-TOF MS (Bruker Biotyper) testing using the manufacturer’s validatedprocedures for definitive identification of these organisms.
MIC determination. For each confirmed BRD pathogen strain, the presence of pheno-typic AMR was evaluated using oxytetracycline to represent the TET class and tilmicosinand tulathromycin to represent the MAC class. As the gold-standard approach, AMRto TETs and MACs was evaluated by MIC testing using the broth microdilution methodaccording to CLSI guidelines [27]. By comparing the MIC values with the correspondingbreakpoints for bovine respiratory pathogens (Thermo Sensititre using the BOPO6F panel),which are listed in Table 4, BRD pathogen isolates were classified as S, I or R to eachdrug [28]. In this study, intermediate and resistant were both re-defined as “resistant” (R+I)at the strain level. A sample was classified as containing “resistant” BRD pathogens ifat least one strain of antimicrobial-resistant BRD pathogens evaluated in this study wasdetected.
4.6. Predicting Phenotypic Antimicrobial Resistance
Statistical analysis was performed to optimize and validate the capability of thedeveloped qPCR assay to classify samples as either S or R+I to a given antimicrobial.First, optimal Ct cutoff values were determined using ROC analysis to maximize the assayaccuracy (both Se and Sp as the primary accuracy indices) compared to the gold-standardtest. Optimal cutoff values were determined for clinical samples containing M. haemolytica,P. multocida or H. somni resistant to OTC, tilmicosin or tulathromycin, as well as for samplesclassified as “possessing at least one resistant BRD pathogen”. Second, the diagnosticaccuracy and validity of the developed qPCR assay were assessed by determining thesufficiency of the sample size collected in this study for detecting MAC and TET resistancein samples possessing BRD pathogens and by using the cross-validation technique. Allstatistical analyses were performed in statistical software R version 3.5.1 [29].
4.6.1. Optimal Ct Cutoff Value Determination
Data preparation for ROC analysis. To determine the optimal Ct, ROC curves wereplotted by comparing the phenotypic AMR classification determined by the gold-standardtest with the continuous Ct value generated by the qPCR assay using the ‘pROC’ packagein statistical software R [30]. ROC curve analysis is a common method for evaluatingdiagnostic tests with a binary classifier [31], but this method does not work optimally ifthere is no detection or anomaly observed in either the qPCR assay or MIC test. In thisstudy, no detection by qPCR means that the target gene is either present in very small
Pathogens 2021, 10, 64 18 of 21
amounts or completely absent. Hence, samples recorded as “no gene copies detected” wereimputed with a Ct value of 40, the highest amplification cycle observed in this study. Forthe gold-standard test, it is not easy to reinvestigate missing results. Hence, another foursamples were further excluded from data analysis due to a lack of MIC records, resulting ina total of 404 samples (296 lung and 108 nasal) for inclusion in the following data analysis.
ROC analysis to determine the optimal Ct cutoff. In this study, ROC curves weregenerated by plotting the true-positive rate (i.e., Se) against the false-positive rate (i.e., 1–Sp)to determine the diagnostic equivalency between the qPCR assay and the gold-standard testover different cutoff values. Table 8 shows a schematic representation of the comparisonof the outcomes of the qPCR assay and the culture-based gold-standard test and thecalculation of Se and Sp. The optimal cutoff translating the continuous Ct value intoa binary classification of R+I or S was determined by optimizing the AUC [32]. AUC cantake values between 0.5 and 1, with values closer to 1 indicating high performance of theqPCR approach in predicting the resistance classification with minimum classification errorcompared with the gold-standard test.
Table 8. Schematic representation of the outcomes of the multiplex qPCR assay detecting antimicrobial resistance comparedto the gold standard.
Multiplex qPCR AssayCulture-Based Gold-Standard Test
“R” 1 S 2
“R” 1 True Positive (TP) False Positive (FP) PPV 3 = TP/(TP + FP)S 2 False Negative (FN) True Negative (TN) NPV 3 = T N/(TN + FN)
Se 3 = TP/(TP + FN) Sp 3 = TN/(TN + FP)1 “R” indicated by the gold-standard test refers to samples containing pathogens resistant (R) or intermediate resistant (I) to antibiotics tested(“resistant” or R+I); hence classification given qPCR results based on the comparison to the gold-standard test also refers to the redefined “resistant”in this study. 2 S indicated by both the gold-standard test and qPCR assay refers to samples containing pathogens susceptible to antibiotics tested.3 Se = sensitivity; Sp = specificity; PPV = positive predictive value; and NPV = negative predictive value.
Performance of qPCR. As a post-analysis statistic, the determined optimal Ct cutoffvalue was used to calculate Cohen’s Kappa (κ) in order to measure the agreement betweenthe two tests [33]. κ ranges from −1 to 1, with higher values implying greater concordancebetween the two tests. The following interpretations of κ were used: κ < 0.2, poor agree-ment; 0.2 < κ ≤ 0.4, fair agreement; 0.4 < κ ≤ 0.6, moderate agreement; 0.6 < κ ≤ 0.8, goodagreement; and κ > 0.8, very good agreement [34]. κ was calculated using Equation (1):
κ = Actual agreement beyond chancePotential agreement beyond chance = p0−pe
1−pe,
where p0 = proportion o f true agreement = TP+TNTP+FN+FP+TN and
pe = proportion o f random agreement = TPFN∗TPFP+FPTN∗FNTN(TP+FN+FP+TN)2 ,
TPFN = TP + FN, TPFP = TP + FP, FPTN = FP + TN and FNTN = FN + TN,TP, TN, FN and FP are reported in Table 8.
(1)
The PPV and NPV were also calculated to measure the true-positive and true-negativeresults of the multiplex qPCR assay, as shown in Table 8. In this study, PPV is the proportionof samples showing a test result of “resistant” based on the multiplex qPCR assay that wereactually identified as resistant using the gold-standard test, while NPV is the proportion ofsamples showing a test result of “susceptible” in the qPCR assay that were also identifiedas susceptible using the gold-standard test.
4.6.2. Diagnostic Accuracy Evaluation
Developing a multiplex qPCR assay with relatively high diagnostic accuracy forclassifying AMR status in clinical samples is contingent on a balance of samples withpositive and negative responses to the outcomes of interest, i.e., R+I and S [35]. To determinewhether this balance was reached, the minimum required sample size and the required
Pathogens 2021, 10, 64 19 of 21
proportion of resistant samples were estimated and compared with the sample sizes andthe proportions of resistant samples included in this study to validate the optimal Ct cutoffvalues determined using the ROC approach. Once the sufficiency of the sample size andrequired number of resistant samples were determined to be adequate, cross-validation(CV) was conducted to evaluate the computational approach used in ROC analysis todetermine the optimal Ct value. Cross-validation is one of the most common resamplingmethods to evaluate the performance of a diagnostic test [36]. Here, the 5-fold CV techniquewas used to validate the optimal Ct value of the multiplex qPCR assay for classifying AMRequivalent to the gold standard. Further details of the accuracy evaluation techniques areprovided in the Supplementary Materials, Text.
Supplementary Materials: The following are available online at https://www.mdpi.com/2076-0817/10/1/64/s1, Table S1: M. haemolytica in silico primer and probes analysis; Table S2: Primer bindingother species; Table S3: Isolates used in MALDI study (M. haemolytica WGS isolates); Table S4: Targetand non-target isolates used to validate assay specificity, with respective threshold cycle (Ct) valuesobtained from multiplex qPCR and MIC values for antimicrobial resistance determination; Table S5:Assessment of sufficiency of sample size for determining the optimal cycle threshold value; Table S6:Comparison of 5-fold cross-validation with the optimal threshold cycle (Ct) cutoff value obtainedusing ROC curves on the overall data; Text: Elaboration of accuracy evaluation techniques used inthe present study.
Author Contributions: Conceptualization, J.D.L. and B.W.; formal analysis, E.D. and J.D.L.; fundingacquisition, J.D.L. and B.W.; investigation, C.A.D.; methodology, E.D., J.D.L., J.C. and B.W.; projectadministration, J.D.L. and B.W.; resources, E.L.W. and M.L.C.; software, E.D.; visualization, E.D. andC.A.D.; writing—original draft, E.D., J.D.L. and B.W.; writing—review and editing, E.L.W., M.L.C.and J.C. All authors have read and agreed to the published version of the manuscript.
Funding: This work was supported by the Nebraska Beef Council (#109924). Partial support forJ.D.L. and C.A.D. was provided by the Nebraska Experiment Station with funds from the AnimalHealth and Disease Research (section 1433) and Hatch capacity funding programs (accessions#1002196, 1007070 and 1017646) and Multistate Research Project of Antimicrobial Resistance (NC 1206,accession# 1014035) through the USDA National Institute of Food and Agriculture. M.L.C. and E.L.W.received support from the United States Department of Agriculture (USDA)/Agricultural ResearchService (ARS) in support of the project “Genomic Intervention Strategies to Prevent and/or TreatRespiratory Diseases of Ruminants” (project# 3040-32000-034-00-D).
Institutional Review Board Statement: This use of animal derived materials and samples wasreviewed and approved by the Institutional Animal Care and Use Committee of the University ofNebraska-Lincoln, and AAALAC accredited institution. (ID # 1970, approval 26 May 2020).
Informed Consent Statement: Not applicable.
Data Availability Statement: All data are available in the main text or as electronic supplementary.
Conflicts of Interest: The authors declare no conflict of interest. The funders had no role in the designof the study; in the collection, analyses, or interpretation of data; in the writing of the manuscript,or in the decision to publish the results. The use of product and company names is necessary toaccurately report the methods and results; however, the United States Department of Agriculture(USDA) neither guarantees nor warrants the standard of the products, and the use of names by theUSDA implies no approval of the product to the exclusion of others that may also be suitable. TheUSDA is an equal opportunity provider and employer.
References1. Griffin, D.; Chengappa, M.M.; Kuszak, J.; McVey, D.S. Bacterial pathogens of the bovine respiratory disease complex. Vet. Clin.
North Am. Food Anim. Pr. 2010, 26, 381–394. [CrossRef] [PubMed]2. Amat, S. Bovine respiratory disease in feedlot cattle: Antimicrobial resistance in bovine respiratory bacterial pathogens and
alternative antimicrobial approaches. Bact. Cattle Dis. 2019. [CrossRef]3. Faber, R.; Hartwig, N.; Busby, D.; BreDahl, R. The Costs and Predictive Factors of Bovine Respiratory Disease in Standardized
Steer Tests. 2000. Available online: https://lib.dr.iastate.edu/beefreports_1999/24 (accessed on 23 September 2020).
Pathogens 2021, 10, 64 20 of 21
4. Campbell, J. Bovine Respiratory Disease Complex. Available online: https://www.merckvetmanual.com/respiratory-system/respiratory-diseases-of-cattle/bovine-respiratory-disease-complex (accessed on 30 November 2020).
5. D’Amours, G.H.; Ward, T.I.; Mulvey, M.R.; Read, R.R.; Morck, D.W. Genetic diversity and tetracycline resistance genes ofHistophilus somni. Vet. Microbiol. 2011, 150, 362–372. [CrossRef] [PubMed]
6. Arcangioli, M.A.; Duet, A.; Meyer, G.; Dernburg, A.; Bezille, P.; Poumarat, F.; Le Grand, D. The role of Mycoplasma bovis in bovinerespiratory disease outbreaks in veal calf feedlots. Vet. J. 2008, 177, 89–93. [CrossRef]
7. Anholt, R.M.; Klima, C.; Allan, N.; Matheson-Bird, H.; Schatz, C.; Ajitkumar, P.; Otto, S.J.G.; Peters, D.; Schmid, K.; Olson, M.;et al. Antimicrobial susceptibility of bacteria that cause bovine respiratory disease complex in Alberta, Canada. Front. Vet. Sci.2017, 4, 207. [CrossRef]
8. Portis, E.; Lindeman, C.; Johansen, L.; Stoltman, G. A ten-year (2000–2009) study of antimicrobial susceptibility of bacteria thatcause bovine respiratory disease complex—Mannheimia haemolytica, Pasteurella multocida, and Histophilus somni—in the UnitedStates and Canada. J. Vet. Diagn. Investig. 2012, 24, 932–944. [CrossRef]
9. USDA. Feedlot 2011 Part IV: Health and Health Management on U.S. Feedlots with a Capacity of 1000 or More Head. Avail-able online: https://www.aphis.usda.gov/animal_health/nahms/feedlot/downloads/feedlot2011/Feed11_dr_PartIV_1.pdf(accessed on 28 August 2020).
10. Klima, C.L.; Zaheer, R.; Cook, S.R.; Booker, C.W.; Hendrick, S.; Alexander, T.W.; McAllister, T.A. Pathogens of bovine respiratorydisease in North American feedlots conferring multidrug resistance via integrative conjugative elements. J. Clin. Microbiol. 2014,52, 438–448. [CrossRef]
11. Noyes, N.R.; Benedict, K.M.; Gow, S.P.; Booker, C.W.; Hannon, S.J.; McAllister, T.A.; Morley, P.S. Mannheimia haemolytica in feedlotcattle: Prevalence of recovery and associations with antimicrobial use, resistance, and health outcomes. J. Vet. Intern. Med. 2015,29, 705–713. [CrossRef]
12. Timsit, E.; Hallewell, J.; Booker, C.; Tison, N.; Amat, S.; Alexander, T.W. Prevalence and antimicrobial susceptibility of Mannheimiahaemolytica, Pasteurella multocida, and Histophilus somni isolated from the lower respiratory tract of healthy feedlot cattle and thosediagnosed with bovine respiratory disease. Vet. Microbiol. 2017, 208, 118–125. [CrossRef]
13. Loy, J.D.; Leger, L.; Workman, A.M.; Clawson, M.L.; Bulut, E.; Wang, B. Development of a multiplex real-time PCR assay usingtwo thermocycling platforms for detection of major bacterial pathogens associated with bovine respiratory disease complex fromclinical samples. J. Vet. Diagn. Investig. 2018, 30, 837–847. [CrossRef]
14. McLain, J.E.; Cytryn, E.; Durso, L.M.; Young, S. Culture-based methods for detection of antibiotic resistance in agroecosystems:Advantages, challenges, and gaps in knowledge. J. Environ. Qual. 2016, 45, 432–440. [CrossRef] [PubMed]
15. DeDonder, K.D.; Apley, M.D. A literature review of antimicrobial resistance in pathogens associated with bovine respiratorydisease. Anim. Health Res. Rev. 2015, 16, 125–134. [CrossRef] [PubMed]
16. Boolchandani, M.; D’Souza, A.W.; Dantas, G. Sequencing-based methods and resources to study antimicrobial resistance. Nat. Rev.Genet. 2019, 20, 356–370. [CrossRef] [PubMed]
17. Dennis, E.J. Antimicrobial Used for Metaphylaxis and Implications for Product Diversification in the Animal Health Sector.NebGuide G2319 Animal Agriculture/Beef. 2019. Available online: https://extensionpublications.unl.edu/assets/pdf/g2319.pdf(accessed on 28 August 2020).
18. USDA NAHMS. Antimicrobial Use and Stewardship on U.S. Feedlots, 2017. 2019. Available online: https://www.aphis.usda.gov/animal_health/nahms/amr/downloads/amu-feedlots_1.pdf (accessed on 28 August 2020).
19. Clawson, M.L.; Murray, R.W.; Sweeney, M.T.; Apley, M.D.; DeDonder, K.D.; Capik, S.F.; Larson, R.L.; Lubbers, B.V.; White, B.J.;Kalbfleisch, T.S.; et al. Genomic signatures of Mannheimia haemolytica that associate with the lungs of cattle with respiratorydisease, an integrative conjugative element, and antibiotic resistance genes. BMC Genom. 2016, 17, 982. [CrossRef]
20. Livermore, D.M.; Winstanley, T.G.; Shannon, K.P. Interpretative reading: Recognizing the unusual and inferring resistancemechanisms from resistance phenotypes. J. Antimicrob. Chemother. 2001, 48 (Suppl. S1), 87–102. [CrossRef]
21. Owen, J.R.; Noyes, N.; Young, A.E.; Prince, D.J.; Blanchard, P.C.; Lehenbauer, T.W.; Aly, S.S.; Davis, J.H.; O’Rourke, S.M.; Abdo,Z.; et al. Whole-genome sequencing and concordance between antimicrobial susceptibility genotypes and phenotypes of bacterialisolates associated with bovine respiratory disease. G3 Genes Genomes Genet. 2017, 7, 3059. [CrossRef]
22. Ruegg, P.L.; Oliveira, L.; Jin, W.; Okwumabua, O. Phenotypic antimicrobial susceptibility and occurrence of selected resistancegenes in gram-positive mastitis pathogens isolated from Wisconsin dairy cows. J. Dairy Sci. 2015, 98, 4521–4534. [CrossRef]
23. Bortolaia, V.; Kaas, R.S.; Ruppe, E.; Roberts, M.C.; Schwarz, S.; Cattoir, V.; Philippon, A.; Allesoe, R.L.; Rebelo, A.R.; Florensa, A.F.;et al. ResFinder 4.0 for predictions of phenotypes from genotypes. J. Antimicrob. Chemother. 2020, 75, 3491–3500. [CrossRef]
24. Hand, D.J. Measuring classifier performance: A coherent alternative to the area under the ROC curve. Mach. Learn. 2009, 77, 103–123.[CrossRef]
25. Loy, J.D.; Clawson, M.L. Rapid typing of Mannheimia haemolytica major genotypes 1 and 2 using MALDI-TOF mass spectrometry.J. Microbiol. Methods 2017, 136, 30–33. [CrossRef]
26. Narayanan, S.; Bates, H.; Confer, A.; Couger, B.; Ramachandran, A. Whole-genome sequence of multidrug-resistant Bibersteiniatrehalosi strain OADDL-BT1. Microbiol. Resour. Announc. 2019, 8, e01690-18. [CrossRef] [PubMed]
27. CLSI. VET01-A4 Performance Standards for Antimicrobial Disk and Dilution Susceptibility Test for Bacteria Isolated from Animals:Approved Standard-Fourth Edition; Watts, J.E.A., Ed.; CLSA: Wayne, PA, USA, 2013; Volume 33.
Pathogens 2021, 10, 64 21 of 21
28. CLSI. VET01-S2 Performance Standards for Antimicrobial Disk and Dilution Susceptibility Tests for Bacteria Isolated from Animals; SecondInformation Supplement; Watts, J.E.A., Ed.; CLSA: Wayne, PA, USA, 2013; Volume 33.
29. Team, R.C. R: A Language and Environment for Statistical Computing; R Foundation for Statistical Computing: Vienna, Austria, 2019.30. Robin, X.; Turck, N.; Hainard, A.; Tiberti, N.; Lisacek, F.; Sanchez, J.C.; Muller, M. pROC: An open-source package for R and S+ to
analyze and compare ROC curves. BMC Bioinform. 2011, 12, 77. [CrossRef] [PubMed]31. Zweig, M.H.; Campbell, G. Receiver-operating characteristic (ROC) plots: A fundamental evaluation tool in clinical medicine.
Clin. Chem. 1993, 39, 561–577. [CrossRef]32. Melo, F. Area under the ROC Curve. In Encyclopedia of Systems Biology; Dubitzky, W.W.O., Cho, K.H., Yokota, H., Eds.; Springer:
New York, NY, USA, 2013.33. Dohoo, I.R.; Martin, W.; Stryhn, H.E. Veterinary Epidemiologic Research, 2nd ed.; VER Inc.: Charlottetown, PEI, Canada, 2009;
pp. 97–98.34. Mabmud, S.M. Cohen’s Kappa. In Encyclopedia of Research Design; Salkind, N.J., Ed.; SAGE Publications, Inc.: Thousand Oaks,
CA, USA, 2010. [CrossRef]35. Steinberg, D.M.; Fine, J.; Chappell, R. Sample size for positive and negative predictive value in diagnostic research using
case-control designs. Biostatistics 2009, 10, 94–105. [CrossRef]36. Riley, R.D.; Ahmed, I.; Debray, T.P.A.; Willis, B.H.; Noordzij, J.P.; Higgins, J.P.; Deeks, J.J. Summarising and validating test accuracy
results across multiple studies for use in clinical practice. Stat. Med. 2015, 34, 2081–2103. [CrossRef]