Communication Protocol of PV Grid-Connected String Inverters
Upload
luigi-maria-di-nardoCategory
view
213download
0
Università degli Studi di Napoli “Federico II” Department of Electrical Engineering and Information Technology (DIETI)
Master’s Degree in Electronics Engineering
Supervisor Ch.mo Prof. Santolo Daliento
Assistant supervisor ing. Pierluigi Guerriero
Candidate Luigi Maria Di Nardo

L. M. Di Nardo
Growth of the PV market in Italy (fromG.S.E.)
failures
architectural shadows
Need for monitoring
Difficulty in locating
Need to estimate the efficiency of these plants
[2]

Failure or shadowing detection
06:00 09:00 12:00 15:00 18:00 21:000
1
2
3
4
5
6
7
8
Istr
ing
[A]
Time [h]
Quantification of yield loss due to failures and malfunctions
[3]
L. M. Di Nardo
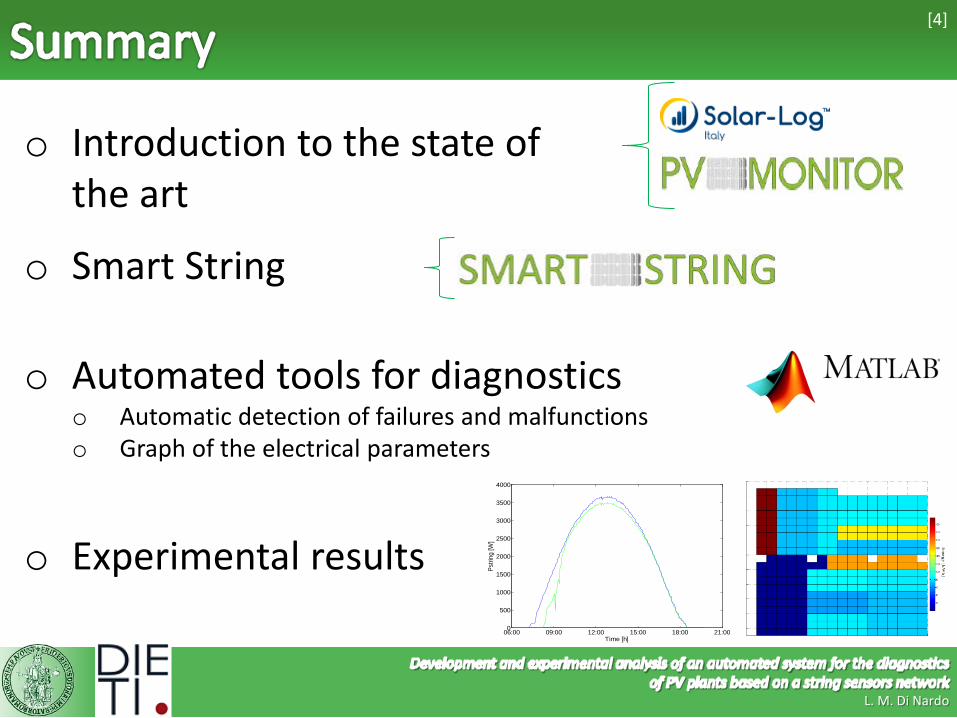
o Introduction to the state of the art
o Automated tools for diagnostics o Automatic detection of failures and malfunctions o Graph of the electrical parameters
o Smart String
o Experimental results 06:00 09:00 12:00 15:00 18:00 21:000
500
1000
1500
2000
2500
3000
3500
4000Ps
tring
[W]
Time [h]
[4]
L. M. Di Nardo

[5]
Monitoring at panel level
Monitoring at inverter level
sensor for the monitoring that operates at panel level and provides direct measurement data
device that connects to the inverter and provides production data
inverter
L. M. Di Nardo

Monitoring of PV plants – State of the art [6]
L. M. Di Nardo
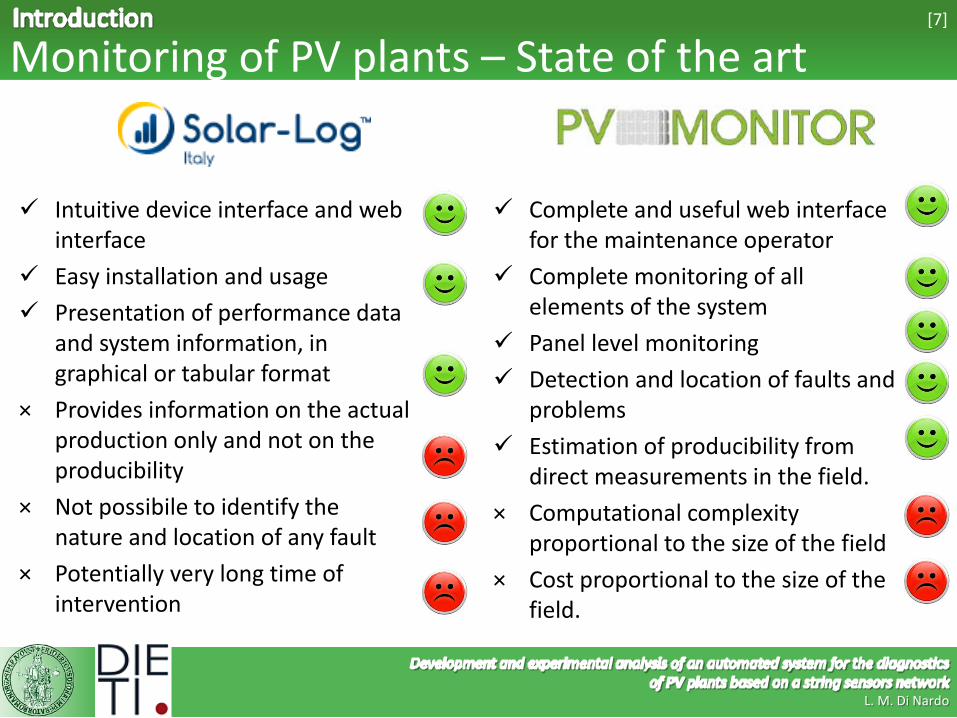
Intuitive device interface and web interface
Easy installation and usage Presentation of performance data
and system information, in graphical or tabular format
× Provides information on the actual production only and not on the producibility
× Not possibile to identify the nature and location of any fault
× Potentially very long time of intervention
Monitoring of PV plants – State of the art
Complete and useful web interface for the maintenance operator
Complete monitoring of all elements of the system
Panel level monitoring Detection and location of faults and
problems Estimation of producibility from
direct measurements in the field. × Computational complexity
proportional to the size of the field × Cost proportional to the size of the
field.
[7]
L. M. Di Nardo
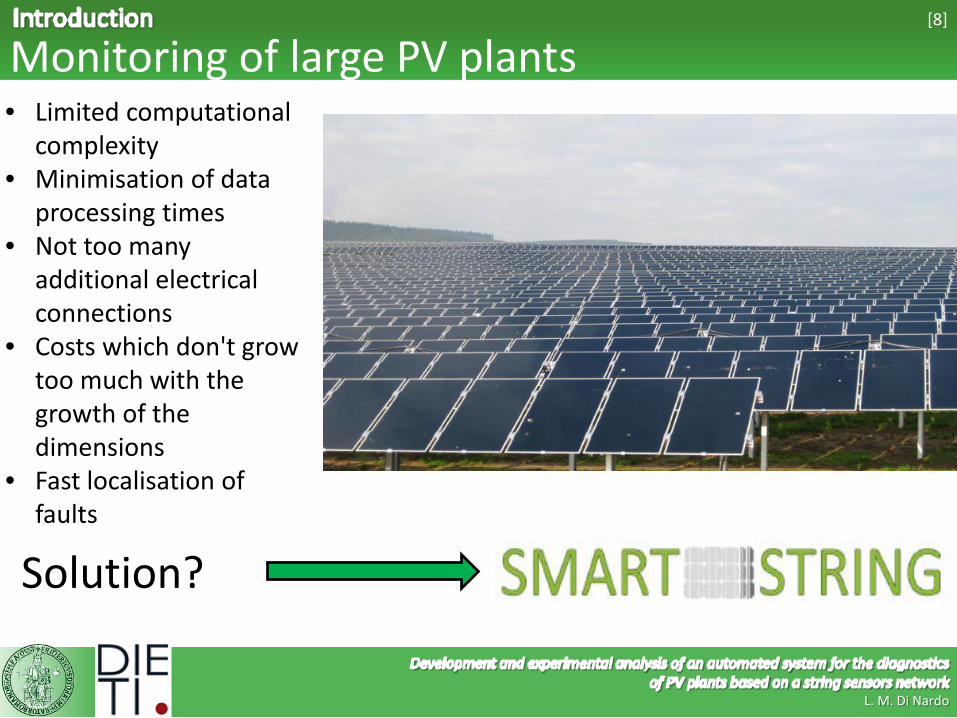
• Limited computational complexity
• Minimisation of data processing times
• Not too many additional electrical connections
• Costs which don't grow too much with the growth of the dimensions
• Fast localisation of faults
Solution?
Monitoring of large PV plants [8]
L. M. Di Nardo

Innovative system for the diagnostics and monitoring of large PV plants at string level. Two measurement boards for each string; Wireless communication to the String
Unit; Modbus communication to the remote
station; Web interface and configurable alarms
system.
Introducing the device Smart String 1/2
Design Production
[9]
L. M. Di Nardo
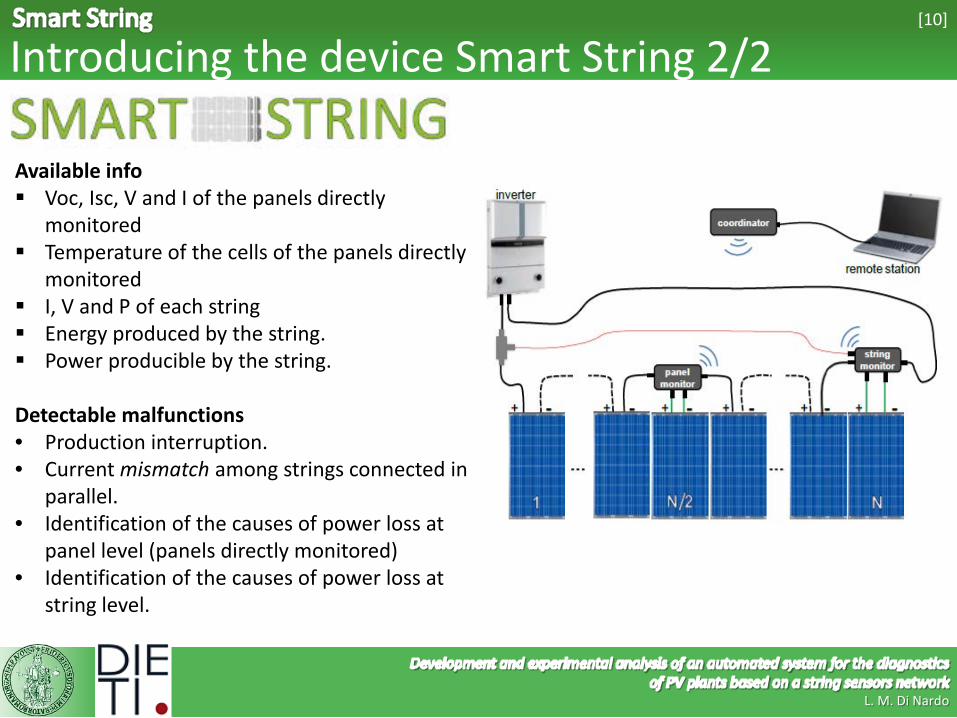
Introducing the device Smart String 2/2
Available info Voc, Isc, V and I of the panels directly
monitored Temperature of the cells of the panels directly
monitored I, V and P of each string Energy produced by the string. Power producible by the string. Detectable malfunctions • Production interruption. • Current mismatch among strings connected in
parallel. • Identification of the causes of power loss at
panel level (panels directly monitored) • Identification of the causes of power loss at
string level.
[10]
L. M. Di Nardo

Identification of power loss events
Development of a fully automated procedure for the detection of power loss events.
Reading measurement
data
Research and identification of power loss
events
Creation of the events
Grouping events by temporal contiguity and verification of
daily repetition
Estimation of the energy loss for each group
of events
Yield losses graph
generation
Detection methods: Bypass events; Power loss with respect to
the estimated power; Power loss with respect to
the maximum power detected.
[11]
L. M. Di Nardo

Graph of the electrical parameters
GUI to quickly show the electrical parameters of the PV strings. Graph of:
Isc and Voc of monitored panels
Operating I and V of monitored panels
Pstring of each string Highest instantaneous Pstring
of the entire field Ability to select strings for which
activate the display Ability to select the date and time. Ability to make the plot of different
days overlapped.
[12]
L. M. Di Nardo

PV plant under test Located in Maddaloni, southern Italy, on a flat roof.
Rated output PV plant 83,385 kWp
327 PV panels,rated output 255 W each
3 inverters, rated output 27,6 kWp each
15 strings with 18 panels
3 strings with 19 panels
South
[13]
L. M. Di Nardo

Bypass detection 1/5 Using the automated procedure is possible to search for bypass conditions .
06:00 09:00 12:00 15:00 18:00 21:000
1
2
3
4
5
6
7
8
Istri
ng [A
]
Time [h]
Isc panel n° 9 (string 1)
Isc panel n° 1 (string 1)
Istring (string 1) In standard conditions
Approximately at 9:00 a.m.
Presumed shadowing on
the plant
03 October 2013
[14]
𝐼𝐼𝐼𝐼𝐼𝐼𝐼𝐼𝐼𝐼𝐼𝐼𝐼𝐼 > 𝐼𝐼𝐼𝐼𝐼𝐼𝑝𝑝𝑝𝑝𝑝𝑝.9
𝐼𝐼𝐼𝐼𝐼𝐼𝐼𝐼𝐼𝐼𝐼𝐼𝐼𝐼 < 𝐼𝐼𝐼𝐼𝐼𝐼
L. M. Di Nardo

Bypass detection 2/5 Search for confirmation of the bypass observing the operating voltages of the monitored modules
06:00 09:00 12:00 15:00 18:00 21:000
5
10
15
20
25
30
35
40
Vst
r [V
]
Time [h]
Vstr panel n° 9 (string 1)
Vstr panel n° 1 (string 1)
03 October 2013 Lowering the operating voltage to 1/3 of the rated one.
2 sub-panels of the panel n°9 are
bypassed
[15]
L. M. Di Nardo

Bypass detection 3/5
06:00 09:00 12:00 15:00 18:00 21:000
100
200
300
400
500
600
Vst
ring
[V]
Time [h]
Vstring string1
03 October 2013
Vstring string1 07 October 2013
Monitoring for several days, it turns out that the 'malfunction' is repetitive.
Architectural shadows
[16]
L. M. Di Nardo

Bypass detection 4/5
06:00 09:00 12:00 15:00 18:00 21:000
0.1
0.2
0.3
0.4
0.5
0.6
0.7
0.8
0.9
1
Time [h]
Nor
mal
ized
Ene
rgy
Loss
bypass event string 1
02 October 2013
bypass event string 1
03 October 2013
The software automatically identifies the repetition of the bypass events. Discovers them, groups them together and estimates the energy lost.
The width of the bars indicates the duration of the event, the height is proportional to the energy lost.
[17]
L. M. Di Nardo

Bypass detection 5/5 The colours indicate the energy lost. Observation period of about two and a half months long.
The plot recalls the layout of the PV plant
[18]
The loss of energy is due to the bypass
events
L. M. Di Nardo
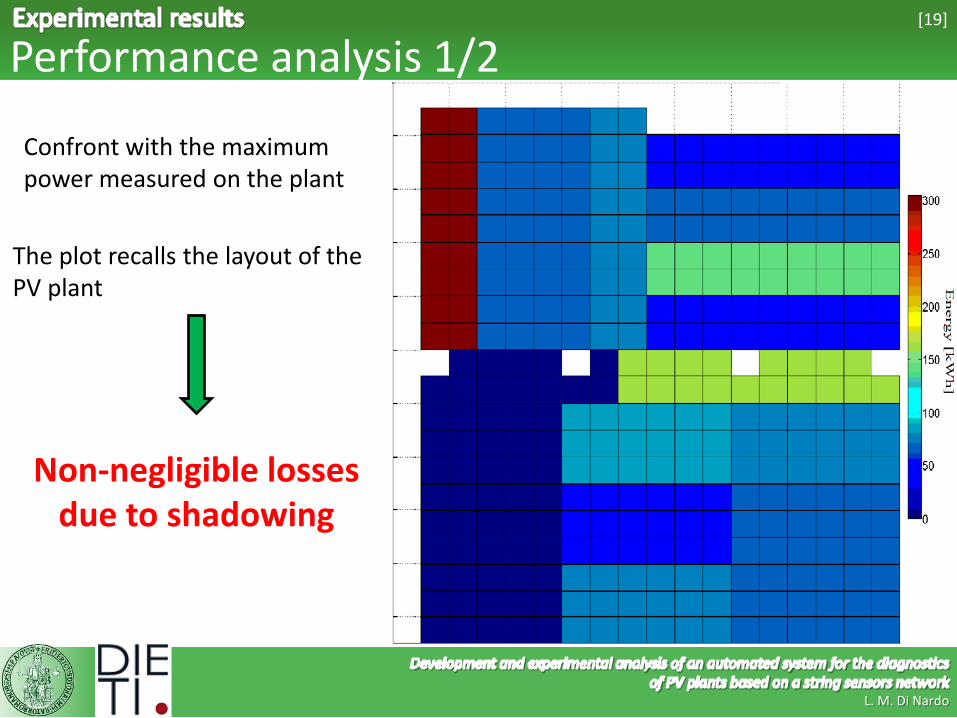
Performance analysis 1/2
The plot recalls the layout of the PV plant
Non-negligible losses due to shadowing
[19]
Confront with the maximum power measured on the plant
L. M. Di Nardo

Performance analysis 2/2
The plot recalls the layout of the PV plant
Non-negligible room for improvement on
some strings
Confront with the maximum theoretical power estimated by direct measures.
[20]
𝑃𝑃𝐼𝐼𝐼𝐼𝐼𝐼𝐼𝐼𝐼𝐼𝐼𝐼=𝐼𝐼𝐼𝐼𝐼𝐼∗𝑉𝑉𝑜𝑜𝐼𝐼∗𝐹𝐹𝐹𝐹∗𝐼𝐼
L. M. Di Nardo

Picture of the PV plant 1/2 Correspondence between the identified shadowing conditions and the surroundings.
[21]
Picture of the plant in S-W direction
L. M. Di Nardo
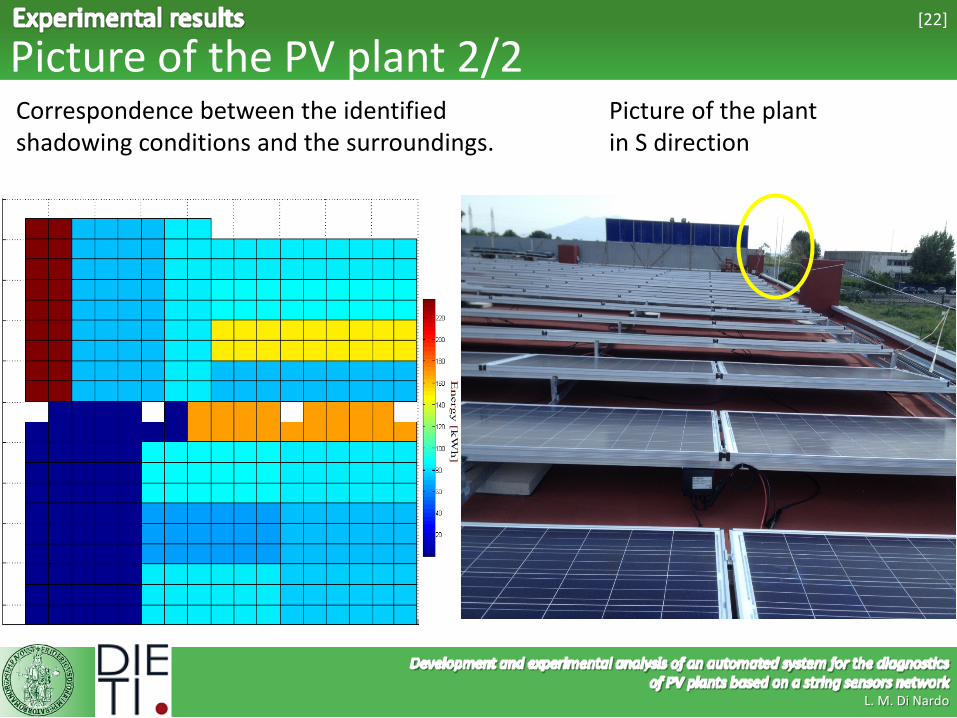
Picture of the PV plant 2/2 Correspondence between the identified shadowing conditions and the surroundings.
[22]
Picture of the plant in S direction
L. M. Di Nardo

Conclusions [23]
Step forward with respect to the state of the art, in particular for large PV plants
Ability to obtain information about the condition of the plant with knowledge of the plant layout only.
Quick individualisation of power loss events due to: bypass; lower power than the estimated one; lower power than the maximum detected one.
Quantification of the power loss Features of the developed software Innovative yield analysis obtained from direct measures
in the field.
L. M. Di Nardo