Development and Comparison of Dengue Vulnerability Indices ...
25
International Journal of Environmental Research and Public Health Article Development and Comparison of Dengue Vulnerability Indices Using GIS-Based Multi-Criteria Decision Analysis in Lao PDR and Thailand Sumaira Zafar 1, *, Oleg Shipin 1 , Richard E. Paul 2 , Joacim Rocklöv 3 , Ubydul Haque 4 , Md. Siddikur Rahman 5,6 , Mayfong Mayxay 7,8,9 , Chamsai Pientong 5 , Sirinart Aromseree 5 , Petchaboon Poolphol 10 , Tiengkham Pongvongsa 11 , Nanthasane Vannavong 12 and Hans J. Overgaard 5,13 Citation: Zafar, S.; Shipin, O.; Paul, R.E.; Rocklöv, J.; Haque, U.; Rahman, M.S.; Mayxay, M.; Pientong, C.; Aromseree, S.; Poolphol, P.; et al. Development and Comparison of Dengue Vulnerability Indices Using GIS-Based Multi-Criteria Decision Analysis in Lao PDR and Thailand. Int. J. Environ. Res. Public Health 2021, 18, 9421. https://doi.org/10.3390/ ijerph18179421 Academic Editor: Paul B. Tchounwou Received: 4 August 2021 Accepted: 31 August 2021 Published: 6 September 2021 Publisher’s Note: MDPI stays neutral with regard to jurisdictional claims in published maps and institutional affil- iations. Copyright: © 2021 by the authors. Licensee MDPI, Basel, Switzerland. This article is an open access article distributed under the terms and conditions of the Creative Commons Attribution (CC BY) license (https:// creativecommons.org/licenses/by/ 4.0/). 1 Department of Environmental Engineering and Management, Asian Institute of Technology; Pathumthani 12120, Thailand; [email protected] 2 Unité de la Génétique Fonctionnelle des Maladies Infectieuses, Institut Pasteur, CNRS UMR 2000, 75015 Paris, France; [email protected] 3 Department of Public Health and Clinical Medicine, Umeå University, 90187 Umeå, Sweden; [email protected] 4 Department of Biostatistics and Epidemiology, University of North Texas Health Science Center, North Texas, Fort Worth, TX 76107, USA; [email protected] 5 Department of Microbiology, Faculty of Medicine, Khon Kaen University, Khon Kaen 40002, Thailand; [email protected] (M.S.R.); [email protected] (C.P.); [email protected] (S.A.); [email protected] (H.J.O.) 6 Department of Statistics, Begum Rokeya University, Rangpur 5402, Bangladesh 7 Institute of Research and Education Development (IRED), University of Health Sciences, Ministry of Health, Vientiane 43130, Laos; [email protected] 8 Lao-Oxford-Mahosot Hospital-Welcome Trust Research Unit (LOMWRU), Microbiology Laboratory, Mahosot Hospital, Vientiane 43130, Laos 9 Centre for Tropical Medicine and Global Health, Nuffield Department of Clinical Medicine, Old Road Campus, University of Oxford, Oxford OX3 7LG, UK 10 The Office of Disease Prevention and Control Region 10(th), Ubon Ratchathani 34000, Thailand; [email protected] 11 Savannakhet Provincial Health Department, Savannakhet 13000, Laos; [email protected] 12 Champasak Provincial Health Office, Pakse 1600, Laos; [email protected] 13 Faculty of Science and Technology, Norwegian University of Life Sciences, P.O. Box 5003, 1430 Ås, Norway * Correspondence: [email protected] or [email protected] Abstract: Dengue is a continuous health burden in Laos and Thailand. We assessed and mapped dengue vulnerability in selected provinces of Laos and Thailand using multi-criteria decision ap- proaches. An ecohealth framework was used to develop dengue vulnerability indices (DVIs) that explain links between population, social and physical environments, and health to identify exposure, susceptibility, and adaptive capacity indicators. Three DVIs were constructed using two objective approaches, Shannon’s Entropy (SE) and the Water-Associated Disease Index (WADI), and one subjective approach, the Best-Worst Method (BWM). Each DVI was validated by correlating the index score with dengue incidence for each spatial unit (district and subdistrict) over time. A Pearson’s cor- relation coefficient (r) larger than 0.5 and a p-value less than 0.05 implied a good spatial and temporal performance. Spatially, DVI WADI was significantly correlated on average in 19% (4–40%) of districts in Laos (mean r = 0.5) and 27% (15–53%) of subdistricts in Thailand (mean r = 0.85). The DVI SE was validated in 22% (12–40%) of districts in Laos and in 13% (3–38%) of subdistricts in Thailand. The DVI BWM was only developed for Laos because of lack of data in Thailand and was significantly associated with dengue incidence on average in 14% (0–28%) of Lao districts. The DVI WADI indicated high vulnerability in urban centers and in areas with plantations and forests. In 2019, high DVI WADI values were observed in sparsely populated areas due to elevated exposure, possibly from changes in climate and land cover, including urbanization, plantations, and dam construction. Of the three indices, DVI WADI was the most suitable vulnerability index for the study area. The DVI WADI can also be applied to other water-associated diseases, such as Zika and chikungunya, to highlight priority areas for further investigation and as a tool for prevention and interventions. Int. J. Environ. Res. Public Health 2021, 18, 9421. https://doi.org/10.3390/ijerph18179421 https://www.mdpi.com/journal/ijerph
Transcript of Development and Comparison of Dengue Vulnerability Indices ...

International Journal of
Environmental Research
and Public Health
Article
Development and Comparison of Dengue Vulnerability IndicesUsing GIS-Based Multi-Criteria Decision Analysis in Lao PDRand Thailand
Sumaira Zafar 1,*, Oleg Shipin 1, Richard E. Paul 2 , Joacim Rocklöv 3 , Ubydul Haque 4 ,Md. Siddikur Rahman 5,6 , Mayfong Mayxay 7,8,9, Chamsai Pientong 5, Sirinart Aromseree 5,Petchaboon Poolphol 10, Tiengkham Pongvongsa 11, Nanthasane Vannavong 12 and Hans J. Overgaard 5,13
�����������������
Citation: Zafar, S.; Shipin, O.; Paul,
R.E.; Rocklöv, J.; Haque, U.; Rahman,
M.S.; Mayxay, M.; Pientong, C.;
Aromseree, S.; Poolphol, P.; et al.
Development and Comparison of
Dengue Vulnerability Indices Using
GIS-Based Multi-Criteria Decision
Analysis in Lao PDR and Thailand.
Int. J. Environ. Res. Public Health 2021,
18, 9421. https://doi.org/10.3390/
ijerph18179421
Academic Editor: Paul B. Tchounwou
Received: 4 August 2021
Accepted: 31 August 2021
Published: 6 September 2021
Publisher’s Note: MDPI stays neutral
with regard to jurisdictional claims in
published maps and institutional affil-
iations.
Copyright: © 2021 by the authors.
Licensee MDPI, Basel, Switzerland.
This article is an open access article
distributed under the terms and
conditions of the Creative Commons
Attribution (CC BY) license (https://
creativecommons.org/licenses/by/
4.0/).
1 Department of Environmental Engineering and Management, Asian Institute of Technology;Pathumthani 12120, Thailand; [email protected]
2 Unité de la Génétique Fonctionnelle des Maladies Infectieuses, Institut Pasteur, CNRS UMR 2000,75015 Paris, France; [email protected]
3 Department of Public Health and Clinical Medicine, Umeå University, 90187 Umeå, Sweden;[email protected]
4 Department of Biostatistics and Epidemiology, University of North Texas Health Science Center, North Texas,Fort Worth, TX 76107, USA; [email protected]
5 Department of Microbiology, Faculty of Medicine, Khon Kaen University, Khon Kaen 40002, Thailand;[email protected] (M.S.R.); [email protected] (C.P.); [email protected] (S.A.);[email protected] (H.J.O.)
6 Department of Statistics, Begum Rokeya University, Rangpur 5402, Bangladesh7 Institute of Research and Education Development (IRED), University of Health Sciences, Ministry of Health,
Vientiane 43130, Laos; [email protected] Lao-Oxford-Mahosot Hospital-Welcome Trust Research Unit (LOMWRU), Microbiology Laboratory, Mahosot
Hospital, Vientiane 43130, Laos9 Centre for Tropical Medicine and Global Health, Nuffield Department of Clinical Medicine,
Old Road Campus, University of Oxford, Oxford OX3 7LG, UK10 The Office of Disease Prevention and Control Region 10(th), Ubon Ratchathani 34000, Thailand;
[email protected] Savannakhet Provincial Health Department, Savannakhet 13000, Laos; [email protected] Champasak Provincial Health Office, Pakse 1600, Laos; [email protected] Faculty of Science and Technology, Norwegian University of Life Sciences, P.O. Box 5003, 1430 Ås, Norway* Correspondence: [email protected] or [email protected]
Abstract: Dengue is a continuous health burden in Laos and Thailand. We assessed and mappeddengue vulnerability in selected provinces of Laos and Thailand using multi-criteria decision ap-proaches. An ecohealth framework was used to develop dengue vulnerability indices (DVIs) thatexplain links between population, social and physical environments, and health to identify exposure,susceptibility, and adaptive capacity indicators. Three DVIs were constructed using two objectiveapproaches, Shannon’s Entropy (SE) and the Water-Associated Disease Index (WADI), and onesubjective approach, the Best-Worst Method (BWM). Each DVI was validated by correlating the indexscore with dengue incidence for each spatial unit (district and subdistrict) over time. A Pearson’s cor-relation coefficient (r) larger than 0.5 and a p-value less than 0.05 implied a good spatial and temporalperformance. Spatially, DVIWADI was significantly correlated on average in 19% (4–40%) of districtsin Laos (mean r = 0.5) and 27% (15–53%) of subdistricts in Thailand (mean r = 0.85). The DVISE
was validated in 22% (12–40%) of districts in Laos and in 13% (3–38%) of subdistricts in Thailand.The DVIBWM was only developed for Laos because of lack of data in Thailand and was significantlyassociated with dengue incidence on average in 14% (0–28%) of Lao districts. The DVIWADI indicatedhigh vulnerability in urban centers and in areas with plantations and forests. In 2019, high DVIWADI
values were observed in sparsely populated areas due to elevated exposure, possibly from changesin climate and land cover, including urbanization, plantations, and dam construction. Of the threeindices, DVIWADI was the most suitable vulnerability index for the study area. The DVIWADI can alsobe applied to other water-associated diseases, such as Zika and chikungunya, to highlight priorityareas for further investigation and as a tool for prevention and interventions.
Int. J. Environ. Res. Public Health 2021, 18, 9421. https://doi.org/10.3390/ijerph18179421 https://www.mdpi.com/journal/ijerph
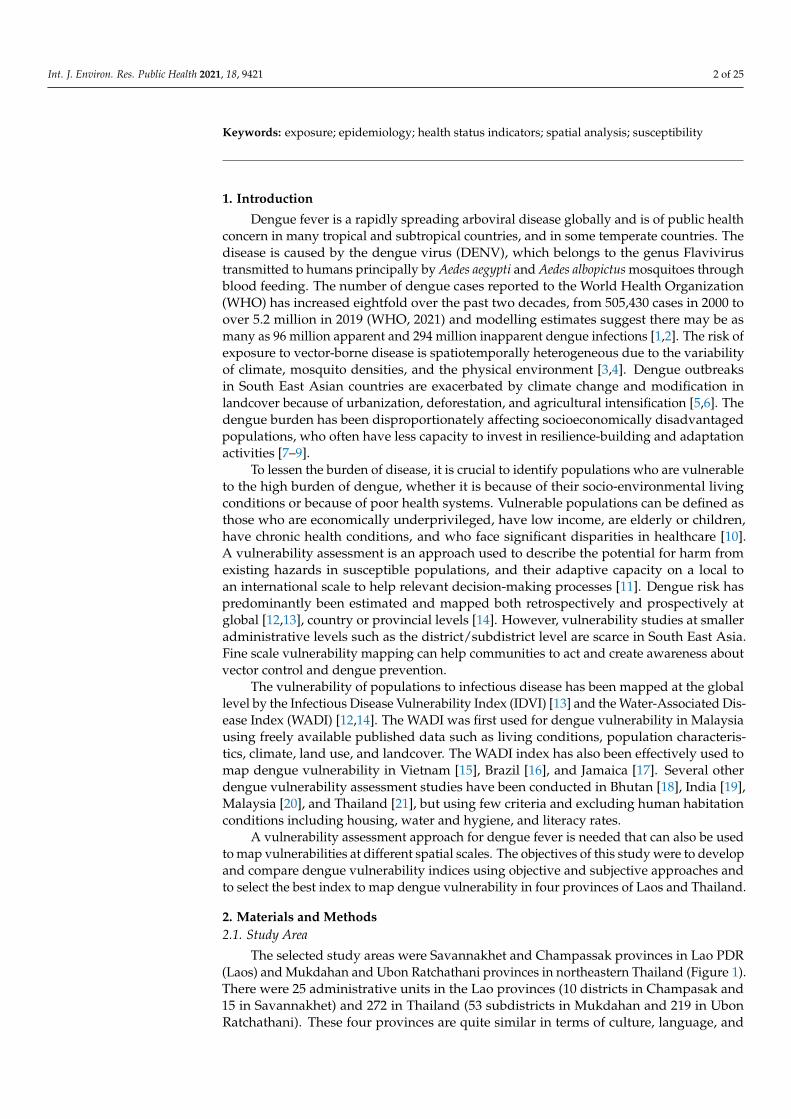
Int. J. Environ. Res. Public Health 2021, 18, 9421 2 of 25
Keywords: exposure; epidemiology; health status indicators; spatial analysis; susceptibility
1. Introduction
Dengue fever is a rapidly spreading arboviral disease globally and is of public healthconcern in many tropical and subtropical countries, and in some temperate countries. Thedisease is caused by the dengue virus (DENV), which belongs to the genus Flavivirustransmitted to humans principally by Aedes aegypti and Aedes albopictus mosquitoes throughblood feeding. The number of dengue cases reported to the World Health Organization(WHO) has increased eightfold over the past two decades, from 505,430 cases in 2000 toover 5.2 million in 2019 (WHO, 2021) and modelling estimates suggest there may be asmany as 96 million apparent and 294 million inapparent dengue infections [1,2]. The risk ofexposure to vector-borne disease is spatiotemporally heterogeneous due to the variabilityof climate, mosquito densities, and the physical environment [3,4]. Dengue outbreaksin South East Asian countries are exacerbated by climate change and modification inlandcover because of urbanization, deforestation, and agricultural intensification [5,6]. Thedengue burden has been disproportionately affecting socioeconomically disadvantagedpopulations, who often have less capacity to invest in resilience-building and adaptationactivities [7–9].
To lessen the burden of disease, it is crucial to identify populations who are vulnerableto the high burden of dengue, whether it is because of their socio-environmental livingconditions or because of poor health systems. Vulnerable populations can be defined asthose who are economically underprivileged, have low income, are elderly or children,have chronic health conditions, and who face significant disparities in healthcare [10].A vulnerability assessment is an approach used to describe the potential for harm fromexisting hazards in susceptible populations, and their adaptive capacity on a local toan international scale to help relevant decision-making processes [11]. Dengue risk haspredominantly been estimated and mapped both retrospectively and prospectively atglobal [12,13], country or provincial levels [14]. However, vulnerability studies at smalleradministrative levels such as the district/subdistrict level are scarce in South East Asia.Fine scale vulnerability mapping can help communities to act and create awareness aboutvector control and dengue prevention.
The vulnerability of populations to infectious disease has been mapped at the globallevel by the Infectious Disease Vulnerability Index (IDVI) [13] and the Water-Associated Dis-ease Index (WADI) [12,14]. The WADI was first used for dengue vulnerability in Malaysiausing freely available published data such as living conditions, population characteris-tics, climate, land use, and landcover. The WADI index has also been effectively used tomap dengue vulnerability in Vietnam [15], Brazil [16], and Jamaica [17]. Several otherdengue vulnerability assessment studies have been conducted in Bhutan [18], India [19],Malaysia [20], and Thailand [21], but using few criteria and excluding human habitationconditions including housing, water and hygiene, and literacy rates.
A vulnerability assessment approach for dengue fever is needed that can also be usedto map vulnerabilities at different spatial scales. The objectives of this study were to developand compare dengue vulnerability indices using objective and subjective approaches andto select the best index to map dengue vulnerability in four provinces of Laos and Thailand.
2. Materials and Methods2.1. Study Area
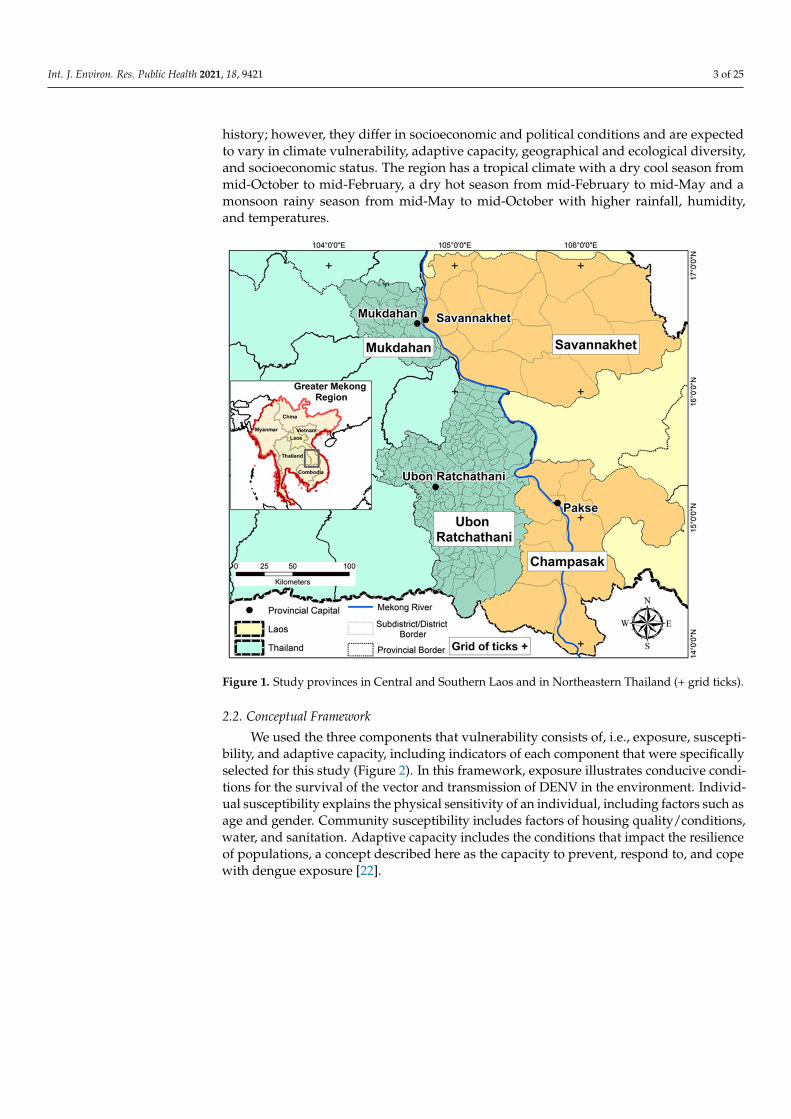
The selected study areas were Savannakhet and Champassak provinces in Lao PDR(Laos) and Mukdahan and Ubon Ratchathani provinces in northeastern Thailand (Figure 1).There were 25 administrative units in the Lao provinces (10 districts in Champasak and15 in Savannakhet) and 272 in Thailand (53 subdistricts in Mukdahan and 219 in UbonRatchathani). These four provinces are quite similar in terms of culture, language, and
Int. J. Environ. Res. Public Health 2021, 18, 9421 3 of 25
history; however, they differ in socioeconomic and political conditions and are expectedto vary in climate vulnerability, adaptive capacity, geographical and ecological diversity,and socioeconomic status. The region has a tropical climate with a dry cool season frommid-October to mid-February, a dry hot season from mid-February to mid-May and amonsoon rainy season from mid-May to mid-October with higher rainfall, humidity,and temperatures.
Figure 1. Study provinces in Central and Southern Laos and in Northeastern Thailand (+ grid ticks).
2.2. Conceptual Framework
We used the three components that vulnerability consists of, i.e., exposure, suscepti-bility, and adaptive capacity, including indicators of each component that were specificallyselected for this study (Figure 2). In this framework, exposure illustrates conducive condi-tions for the survival of the vector and transmission of DENV in the environment. Individ-ual susceptibility explains the physical sensitivity of an individual, including factors such asage and gender. Community susceptibility includes factors of housing quality/conditions,water, and sanitation. Adaptive capacity includes the conditions that impact the resilienceof populations, a concept described here as the capacity to prevent, respond to, and copewith dengue exposure [22].

Int. J. Environ. Res. Public Health 2021, 18, 9421 4 of 25
Figure 2. Conceptual framework for constructing the dengue vulnerability indices. Indicators of exposure, sensitivity, andadaptive capacity were combined using weights corresponding to the available evidence from the literature.
Two new dengue vulnerability indices were developed by applying different weight-ing systems (for the indicators) based on an objective approach (Shannon’s Entropy, SE,explained in Section 2.5.3) and a subjective approach (Best-Worst Method, BWM explainedin Section 2.5.2). These approaches were then compared with an existing dengue vulnerabil-ity index (WADI, explained in Section 2.5.1) that uses an objective equal-weighting system.To assess the effectiveness of the developed vulnerability indices (SE and BWM) to identifythe areas at risk and the existing WADI index, the Pearson correlation (p-value < 0.05)between the indices and dengue incidence was assessed.
2.3. Data Collection
Historical daily reported dengue case data were acquired from 2003 to 2019 fromprovincial health departments in the study provinces. For Thailand, subdistrict leveldengue cases were reported as dengue fever (DF), dengue hemorrhagic fever (DHF), anddengue shock syndrome (DSS). In Laos, dengue cases at the district-level were reported asDF, DHF, and DSS up to and including 2009 and thereafter followed the new classificationof dengue with or without warning signs and severe dengue [7]. District and subdistrictlevel population data from 2002 to 2019 for Laos and Thailand were acquired from officialweb portals of the national departments of statistics [23,24]. Monthly dengue incidence per100,000 persons was calculated for each spatial unit by dividing the number of cases byits total population and multiplying it by 100,000. Socioeconomic data for Laos includingtoilet type, living conditions or housing quality, mean distance to hospital (km), literacyrate (%), and poverty incidence (%) were acquired from census data available at officialweb portals of the national departments of statistics [23]. A detailed description of collecteddatasets for constructing dengue vulnerability indices is presented in Table 1.
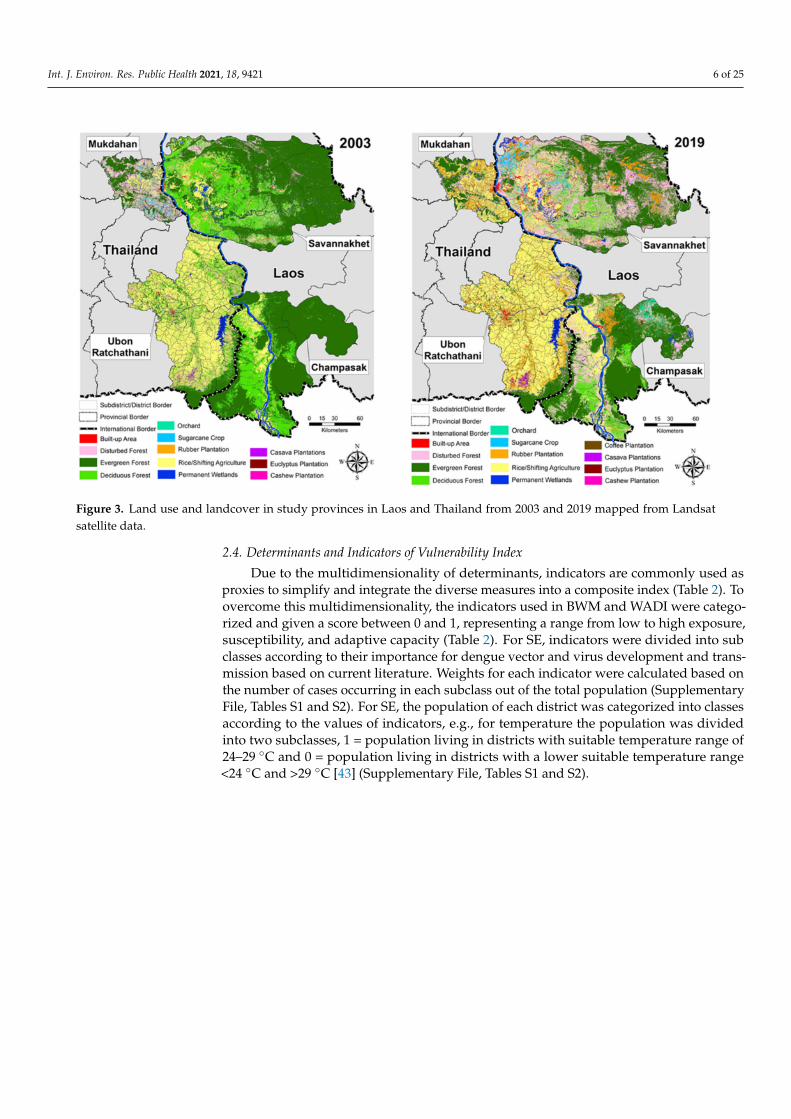
Monthly cumulative precipitation and mean temperature data were obtained fromthe fifth-generation European Centre for Medium-Range Weather Forecasts atmosphericreanalysis (ERA5) of the global climate and aggregated at the district/subdistrict level [42].Land use and land cover data were obtained from Landsat ETM+ for 2002–2003, LandsatTM for 2004–2011, and Optical Land Imager (OLI) and from Thermal Infrared (TIR) for2013–2015 [30] (Figure 3) (Supplementary File, Figure S2: Land use and landcover changein Champasak and Savannakhet provinces in Laos and Mukdahan and Ubon Ratchathaniprovinces in Thailand between 2002 and 2019).
Int. J. Environ. Res. Public Health 2021, 18, 9421 5 of 25
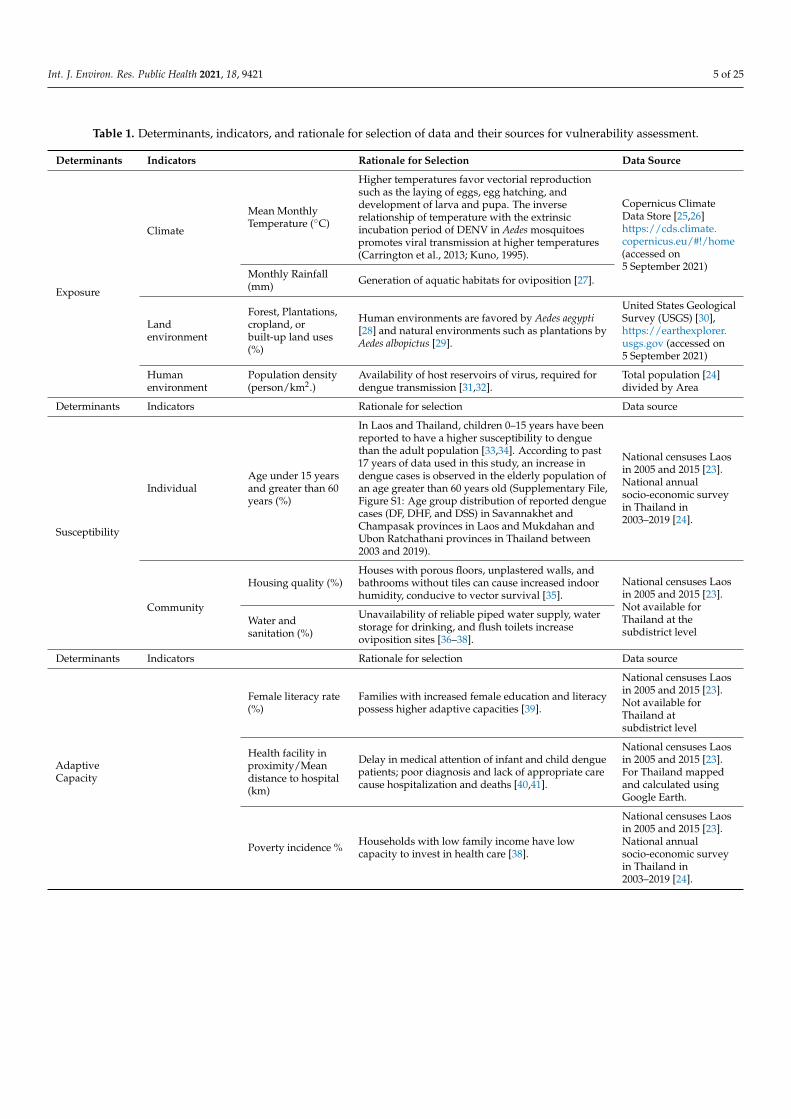
Table 1. Determinants, indicators, and rationale for selection of data and their sources for vulnerability assessment.
Determinants Indicators Rationale for Selection Data Source
Exposure
Climate
Mean MonthlyTemperature (◦C)
Higher temperatures favor vectorial reproductionsuch as the laying of eggs, egg hatching, anddevelopment of larva and pupa. The inverserelationship of temperature with the extrinsicincubation period of DENV in Aedes mosquitoespromotes viral transmission at higher temperatures(Carrington et al., 2013; Kuno, 1995).
Copernicus ClimateData Store [25,26]https://cds.climate.copernicus.eu/#!/home(accessed on5 September 2021)
Monthly Rainfall(mm) Generation of aquatic habitats for oviposition [27].
Landenvironment
Forest, Plantations,cropland, orbuilt-up land uses(%)
Human environments are favored by Aedes aegypti[28] and natural environments such as plantations byAedes albopictus [29].
United States GeologicalSurvey (USGS) [30],https://earthexplorer.usgs.gov (accessed on5 September 2021)
Humanenvironment
Population density(person/km2.)
Availability of host reservoirs of virus, required fordengue transmission [31,32].
Total population [24]divided by Area
Determinants Indicators Rationale for selection Data source
Susceptibility
IndividualAge under 15 yearsand greater than 60years (%)
In Laos and Thailand, children 0–15 years have beenreported to have a higher susceptibility to denguethan the adult population [33,34]. According to past17 years of data used in this study, an increase indengue cases is observed in the elderly population ofan age greater than 60 years old (Supplementary File,Figure S1: Age group distribution of reported denguecases (DF, DHF, and DSS) in Savannakhet andChampasak provinces in Laos and Mukdahan andUbon Ratchathani provinces in Thailand between2003 and 2019).
National censuses Laosin 2005 and 2015 [23].National annualsocio-economic surveyin Thailand in2003–2019 [24].
Community
Housing quality (%)Houses with porous floors, unplastered walls, andbathrooms without tiles can cause increased indoorhumidity, conducive to vector survival [35].
National censuses Laosin 2005 and 2015 [23].Not available forThailand at thesubdistrict level
Water andsanitation (%)
Unavailability of reliable piped water supply, waterstorage for drinking, and flush toilets increaseoviposition sites [36–38].
Determinants Indicators Rationale for selection Data source
AdaptiveCapacity
Female literacy rate(%)
Families with increased female education and literacypossess higher adaptive capacities [39].
National censuses Laosin 2005 and 2015 [23].Not available forThailand atsubdistrict level
Health facility inproximity/Meandistance to hospital(km)
Delay in medical attention of infant and child denguepatients; poor diagnosis and lack of appropriate carecause hospitalization and deaths [40,41].
National censuses Laosin 2005 and 2015 [23].For Thailand mappedand calculated usingGoogle Earth.
Poverty incidence % Households with low family income have lowcapacity to invest in health care [38].
National censuses Laosin 2005 and 2015 [23].National annualsocio-economic surveyin Thailand in2003–2019 [24].
Int. J. Environ. Res. Public Health 2021, 18, 9421 6 of 25
Figure 3. Land use and landcover in study provinces in Laos and Thailand from 2003 and 2019 mapped from Landsatsatellite data.
2.4. Determinants and Indicators of Vulnerability Index
Due to the multidimensionality of determinants, indicators are commonly used asproxies to simplify and integrate the diverse measures into a composite index (Table 2). Toovercome this multidimensionality, the indicators used in BWM and WADI were catego-rized and given a score between 0 and 1, representing a range from low to high exposure,susceptibility, and adaptive capacity (Table 2). For SE, indicators were divided into subclasses according to their importance for dengue vector and virus development and trans-mission based on current literature. Weights for each indicator were calculated based onthe number of cases occurring in each subclass out of the total population (SupplementaryFile, Tables S1 and S2). For SE, the population of each district was categorized into classesaccording to the values of indicators, e.g., for temperature the population was dividedinto two subclasses, 1 = population living in districts with suitable temperature range of24–29 ◦C and 0 = population living in districts with a lower suitable temperature range<24 ◦C and >29 ◦C [43] (Supplementary File, Tables S1 and S2).
Int. J. Environ. Res. Public Health 2021, 18, 9421 7 of 25
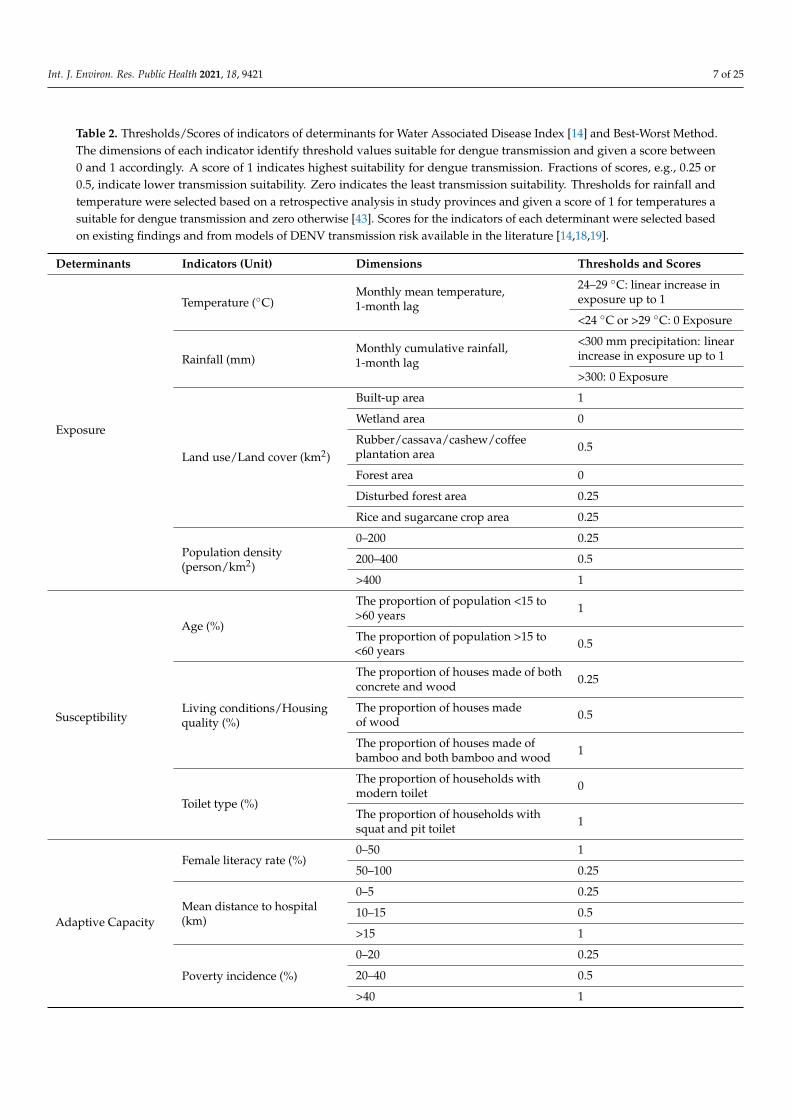
Table 2. Thresholds/Scores of indicators of determinants for Water Associated Disease Index [14] and Best-Worst Method.The dimensions of each indicator identify threshold values suitable for dengue transmission and given a score between0 and 1 accordingly. A score of 1 indicates highest suitability for dengue transmission. Fractions of scores, e.g., 0.25 or0.5, indicate lower transmission suitability. Zero indicates the least transmission suitability. Thresholds for rainfall andtemperature were selected based on a retrospective analysis in study provinces and given a score of 1 for temperatures asuitable for dengue transmission and zero otherwise [43]. Scores for the indicators of each determinant were selected basedon existing findings and from models of DENV transmission risk available in the literature [14,18,19].
Determinants Indicators (Unit) Dimensions Thresholds and Scores
Exposure
Temperature (◦C)Monthly mean temperature,1-month lag
24–29 ◦C: linear increase inexposure up to 1
<24 ◦C or >29 ◦C: 0 Exposure
Rainfall (mm)Monthly cumulative rainfall,1-month lag
<300 mm precipitation: linearincrease in exposure up to 1
>300: 0 Exposure
Land use/Land cover (km2)
Built-up area 1
Wetland area 0
Rubber/cassava/cashew/coffeeplantation area 0.5
Forest area 0
Disturbed forest area 0.25
Rice and sugarcane crop area 0.25
Population density(person/km2)
0–200 0.25
200–400 0.5
>400 1
Susceptibility
Age (%)
The proportion of population <15 to>60 years 1
The proportion of population >15 to<60 years 0.5
Living conditions/Housingquality (%)
The proportion of houses made of bothconcrete and wood 0.25
The proportion of houses madeof wood 0.5
The proportion of houses made ofbamboo and both bamboo and wood 1
Toilet type (%)
The proportion of households withmodern toilet 0
The proportion of households withsquat and pit toilet 1
Adaptive Capacity
Female literacy rate (%)0–50 1
50–100 0.25
Mean distance to hospital(km)
0–5 0.25
10–15 0.5
>15 1
Poverty incidence (%)
0–20 0.25
20–40 0.5
>40 1
Int. J. Environ. Res. Public Health 2021, 18, 9421 8 of 25
2.4.1. Exposure
We considered climate, land use/land cover, and the human environment and theirchange as the major exposure indicators from 2003 to 2019 (Table 2). Climatic variablesincluding temperature and rainfall are the major drivers of dengue infection and directlyaffect the vector life cycle, feeding activity, biting rates, and virus incubation period [44–47].Precipitation provides outdoor oviposition sites for vectors and humid conditions favormosquito survival. By contrast, heavy rainfall can flush breeding sites of mosquito imma-tures [48].
Mean temperatures between 24 ◦C and 29 ◦C and total precipitation between 0 mmand 300 mm were given a value of 1 and values outside of these specified ranges werecategorized as 0. A one-month lag time was used in the analysis due to the delayed effectof climatic parameters found in a retrospective study of dengue and environment that wecarried out in the same provinces [43].
Land use and landcover modified by humans, such as built-up areas, contribute toexposure by providing indoor oviposition sites in artificial containers for the primaryvector Aedes aegypti. Trees and other plantations provide oviposition sites for the secondaryvector Aedes albopictus. All land use and landcover determinants were ranked on thecontinuous scale from 0 to 1: built-up areas were considered highly vulnerable and ratedas “1”, agricultural lands/paddy fields were rated as “0.25”, rubber plantation as “0.5”,and deforested area as “0.25”, while forest and wetlands were considered not vulnerableto dengue and rated as “0” (Table 2) [14]. Densely populated human environments createideal conditions for dengue outbreaks [49,50]. The population density was calculated foreach district in selected provinces based on population census data [23,24], and classifiedinto zero, low (0–200 people per km2), moderate (200–400 people per km2), and highdensity (>400 people per km2). The geographical distribution of indicators of exposure arepresented as maps in Figure 2 and Supplementary File, Figure S3.
2.4.2. Susceptibility
In this study, we considered individual and collective factors of population susceptibil-ity to dengue and their change from 2003 to 2019 (Table 2). Socioeconomic and demographicfactors have been reported to affect dengue transmission [51]. Physiological parameterssuch as the individual’s immunity and previous exposure are also important, but suchdata are usually not published or easily accessible. Therefore, age was used as a proxy forimmunity and previous exposure. Age is related to serious forms of dengue; children lessthan 15 years and adolescents are relatively more susceptible to dengue hemorrhagic feverand dengue shock syndrome (DHF/DSS), independently of other factors [52]. Historically,dengue cases occurred in the age groups less than 15 years and over 60 years, as is shownin the Supplementary Figure S1. Dengue cases increase in the age group >60, suggestive ofdecreasing immune competence and higher frailty.
Living conditions such as poor housing quality, defined as the lack of window anddoor screens, commonly found in underprivileged areas, allows free passage for mosquitoesbetween the indoor and outdoor areas [2]. Houses built with bamboo and wood, porousfloors, unplastered walls, and bathrooms without tiles can cause increased indoor humidity,conducive to vector survival [35]. We calculated percentage housing categories for eachdistrict—the districts were assigned with the most abundant housing category value [35].Districts with most houses constructed with concrete and wood were given the lowest scoreof 0.25, a score for houses with wood 0.5, and houses with wood and bamboo were assignedthe highest score of 1. Dengue susceptibility is increased in urban areas, particularly inslums with inadequate waste disposal and toilets, and in peri-urban areas with slowereconomic development and poor housing quality [9,53,54]. The geographical distributionof susceptibility indicators in 2003 and 2019 are presented as maps in the SupplementaryFile, Figure S4.

Int. J. Environ. Res. Public Health 2021, 18, 9421 9 of 25
2.4.3. Adaptive Capacity
We considered women’s literacy rates, proximity to health care centers, and povertyand their change from 2003 to 2019 as collective factors of the population’s adaptive capacitytowards dengue. The adaptive capacity indicators reflect the ability of populations to copewith or prevent dengue outbreaks [22]. Women play important roles in households. Theycommonly manage house conditions, waste, water, the family’s health care management,etc. Households with low female literacy rate were associated with increased risk ofAedes oviposition sites around households [55]. Good access to healthcare can reducethe susceptibility especially to complications, and increase early diagnosis of disease andimmediate medical care to reduce morbidity and thus can reduce the susceptibility ofthe population; therefore, distance to a hospital was included as an indicator of adaptivecapacity [56]. The geographical distribution of adaptive capacity indicators in 2003 and2019 are presented as maps in Supplementary File, Figure S5.
Normalization of determinants was performed by standardizing the data to a valuefrom 0 to 1 based on an approach used for the human development index (HDI). TheHDI was developed to measure key dimensions of human development, including health,education, and standard of living [57].
The contribution in percent of each of the three determinants—exposure, susceptibility,and adaptive capacity—to the total vulnerability score (DVIWADI) in each country wascalculated by dividing their final average scores with the respective DVI average for Laosand Thailand.
2.5. Index Construction
An index was constructed using estimated weights for each indicator using the threedifferent approaches, i.e., WADI, BWM, and SE. The index was constructed using linearlyweighted averages (LWA) to combine the indicators of the determinants Equation (1) [58].The estimated weights of each index were used along with standardized criteria as inputfor the LWA. The total score was obtained as the product sum of each indicator and itsweight as follows:
DVIindexname =n
∑i=1
wixi (1)
where DVI is the Dengue Vulnerability Index, wi is the weight of factor i, and xi is thecriterion score [59]. Equation (1) is the common expression for all three indices, where theindex name represents either WADI, BWM, or SE.
2.5.1. Index Based on Water Associated Disease Index (DVIWADI)
We used the conceptual framework of WADI developed by Dickin et al. (2013). In theWADI framework, the vulnerability index was developed based on the exposure, suscepti-bility, and adaptive capacity indicators with weights of 3, 1, and 1, respectively [14]. Allthe indicators within exposure, susceptibility, and adaptive capacity were assumed to havean equal weight and aggregated to form a composite index using an arithmetic average.
2.5.2. Index Based on Best-Worst Method—BWM (DVIBWM)
Subjective approaches to map vulnerability have been criticized for two reasons. First,they can be subjectively biased by the decision makers’ opinions, and second, they compareindicators among different domains such as exposure and sensitivity, i.e., rubber plantationsversus female literacy rates. Similarly, objective-based approaches are criticized for notincluding expert knowledge in developing such indices, even though expert opinions canalso be biased. The BWM is an advanced form of the most frequently used subjectiveapproach, the analytical hierarchy process, which allows comparisons in specific domainsby reducing the comparisons of criteria and limiting subjectivity bias [60].
This method is used to solve different real-world problems and is comparable to theAnalytical Hierarchy Process that uses several evaluation criteria [60]. Weights calculated
Int. J. Environ. Res. Public Health 2021, 18, 9421 10 of 25
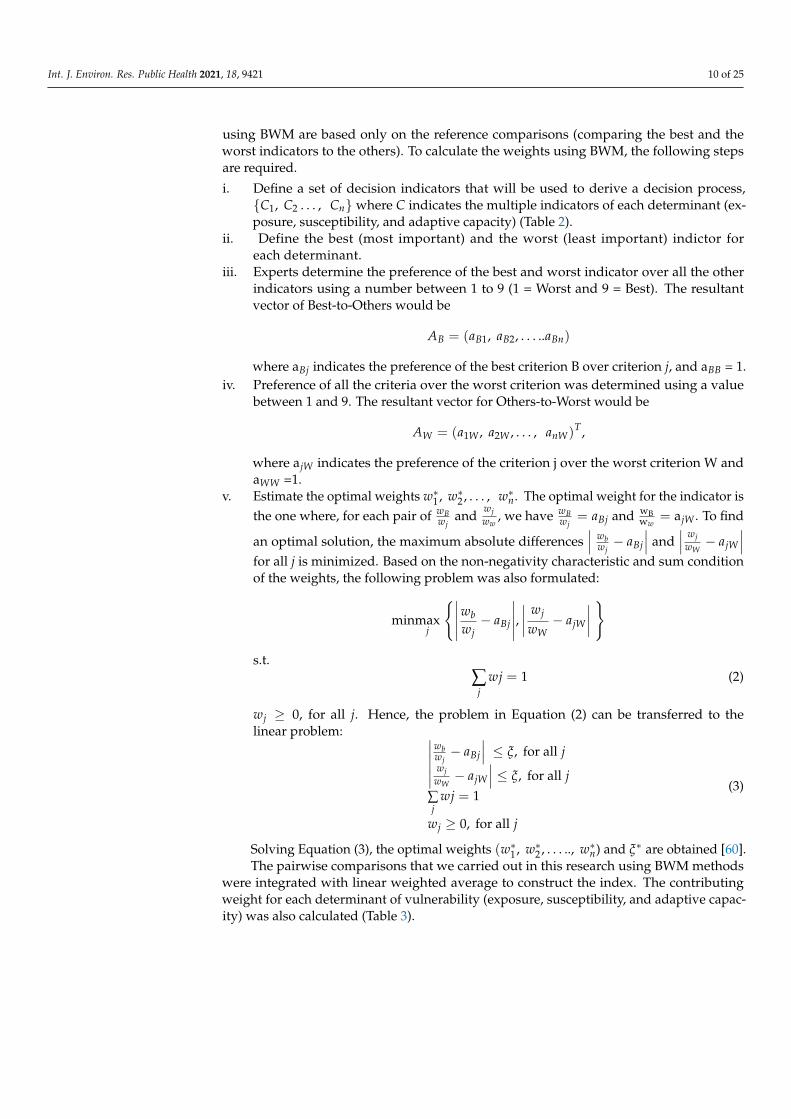
using BWM are based only on the reference comparisons (comparing the best and theworst indicators to the others). To calculate the weights using BWM, the following stepsare required.
i. Define a set of decision indicators that will be used to derive a decision process,{C1, C2 . . . , Cn} where C indicates the multiple indicators of each determinant (ex-posure, susceptibility, and adaptive capacity) (Table 2).
ii. Define the best (most important) and the worst (least important) indictor foreach determinant.
iii. Experts determine the preference of the best and worst indicator over all the otherindicators using a number between 1 to 9 (1 = Worst and 9 = Best). The resultantvector of Best-to-Others would be
AB = (aB1, aB2, . . . ..aBn)
where aBj indicates the preference of the best criterion B over criterion j, and aBB = 1.iv. Preference of all the criteria over the worst criterion was determined using a value
between 1 and 9. The resultant vector for Others-to-Worst would be
AW = (a1W , a2W , . . . , anW)T ,
where ajW indicates the preference of the criterion j over the worst criterion W andaWW =1.
v. Estimate the optimal weights w∗1 , w∗2 , . . . , w∗n. The optimal weight for the indicator isthe one where, for each pair of wB
wjand
wjww
, we have wBwj
= aBj and wBww
= ajW . To find
an optimal solution, the maximum absolute differences∣∣∣ wb
wj− aBj
∣∣∣ and∣∣∣ wj
wW− ajW
∣∣∣for all j is minimized. Based on the non-negativity characteristic and sum conditionof the weights, the following problem was also formulated:
minmaxj
{∣∣∣∣∣wbwj− aBj
∣∣∣∣∣,∣∣∣∣ wj
wW− ajW
∣∣∣∣}
s.t.∑
jwj = 1 (2)
wj ≥ 0, for all j. Hence, the problem in Equation (2) can be transferred to thelinear problem: ∣∣∣wb
wj− aBj
∣∣∣ ≤ ξ, for all j∣∣∣ wjwW− ajW
∣∣∣ ≤ ξ, for all j
∑j
wj = 1
wj ≥ 0, for all j
(3)
Solving Equation (3), the optimal weights (w∗1 , w∗2 , . . . .., w∗n) and ξ∗ are obtained [60].The pairwise comparisons that we carried out in this research using BWM methods
were integrated with linear weighted average to construct the index. The contributingweight for each determinant of vulnerability (exposure, susceptibility, and adaptive capac-ity) was also calculated (Table 3).

Int. J. Environ. Res. Public Health 2021, 18, 9421 11 of 25
Table 3. Weight calculations of indicators using the Best-Worst Method (BWM).
Exposure
Best to others: Temperature (◦C) Others to the Worst: Landcover (km2) Weights Consistency Index
Temperature (◦C) 1 Temperature (◦C) 2 0.39
0.07
Rainfall (mm) 2 Rainfall (mm) 2 0.23
Landcover (km2) 2 Landcover (km2) 2 0.15
Population density(person/km2) 2 Population density
(person/km2) 1 0.23
Susceptibility
Best to others: Population(Density person/km2) Others to the Worst: Age
0.04Living conditions 2 Living conditions 2 0.54
Toilet type 3 Toilet type 2 0.29
Age <15 and >60 4 Age <15 and >60 1 0.17
Adaptivecapacity
Best to others: Literacy Rate (%) Others to the Worst: Mean Distanceto Hospital (km2)
0.04
Female literacy rate(%) 1 Female literacy rate
(%) 3 0.54
Poverty incidence(%) 2 Poverty incidence
(%) 2 0.29
Mean distance tohospital (km2) 3 Mean distance to
hospital (km2) 1 0.17
Vulnerability
Best to others: Exposure Others to the Worst: AdaptiveCapacity
0.04Exposure 1 Exposure 3 0.54
Susceptibility 2 Susceptibility 3 0.32
Adaptive capacity 3 Adaptive capacity 1 0.17
The BWM method was not used for Thailand due to the unavailability of the data forcomparisons to calculate indicator weights.
2.5.3. Index Based on Shannon’s Entropy—SE (DVISE)
Shannon’s Entropy has recently been used to map the susceptibility of dengue inChicago, IL, USA [61]. SE relies on objective base information that can be used to determinethe disorder degree of the information in the decision space of the variables for a particulardecision problem and can minimize the subjective bias of decision maker opinion. Shan-non’s Entropy is a measure of the amount of information held in data using probabilitytheory. It indicates that a broader distribution contains more uncertainty than a sharplypeaked one does. In other words, the most important factor is the discriminating densitydij of the subclasses among all indicators (Supplementary File, Tables S1 and S2). Thedetermination of weight for each indicator was objectively assessed because it was decidedby the distribution of dengue cases and not by personal opinions, as in the BWM method.According to entropy theory, the dengue case densities (dij) in each class were calculatedby Equation (4).
dij =DPij
TPiji = (1, 2, . . . ., m), j = 1, 2, . . . ., n) (4)
where DPij is the number of dengue cases in jth class of indicator i and TPij is the averagepopulation in subclass ij.
Int. J. Environ. Res. Public Health 2021, 18, 9421 12 of 25
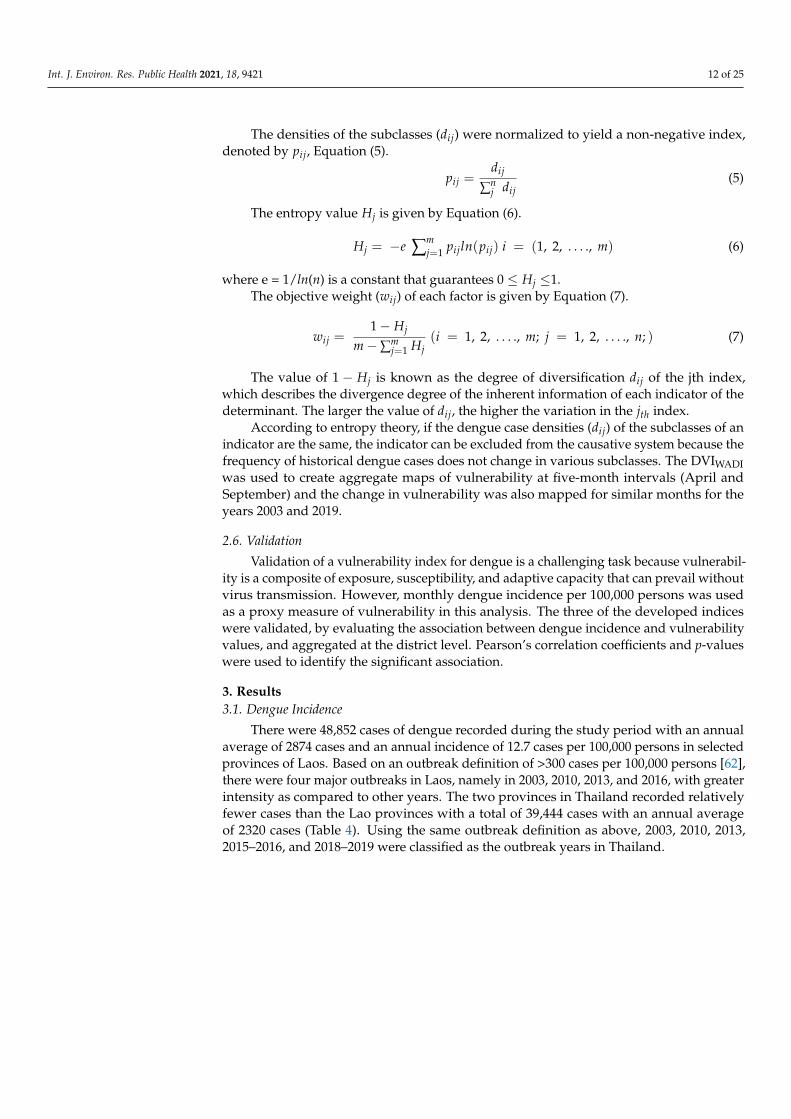
The densities of the subclasses (dij) were normalized to yield a non-negative index,denoted by pij, Equation (5).
pij =dij
∑nj dij
(5)
The entropy value Hj is given by Equation (6).
Hj = −e ∑mj=1 pijln(pij) i = (1, 2, . . . ., m) (6)
where e = 1/ln(n) is a constant that guarantees 0 ≤ Hj ≤1.The objective weight (wij) of each factor is given by Equation (7).
wij =1− Hj
m−∑mj=1 Hj
(i = 1, 2, . . . ., m; j = 1, 2, . . . ., n; ) (7)
The value of 1 − Hj is known as the degree of diversification dij of the jth index,which describes the divergence degree of the inherent information of each indicator of thedeterminant. The larger the value of dij, the higher the variation in the jth index.
According to entropy theory, if the dengue case densities (dij) of the subclasses of anindicator are the same, the indicator can be excluded from the causative system because thefrequency of historical dengue cases does not change in various subclasses. The DVIWADIwas used to create aggregate maps of vulnerability at five-month intervals (April andSeptember) and the change in vulnerability was also mapped for similar months for theyears 2003 and 2019.
2.6. Validation
Validation of a vulnerability index for dengue is a challenging task because vulnerabil-ity is a composite of exposure, susceptibility, and adaptive capacity that can prevail withoutvirus transmission. However, monthly dengue incidence per 100,000 persons was usedas a proxy measure of vulnerability in this analysis. The three of the developed indiceswere validated, by evaluating the association between dengue incidence and vulnerabilityvalues, and aggregated at the district level. Pearson’s correlation coefficients and p-valueswere used to identify the significant association.
3. Results3.1. Dengue Incidence
There were 48,852 cases of dengue recorded during the study period with an annualaverage of 2874 cases and an annual incidence of 12.7 cases per 100,000 persons in selectedprovinces of Laos. Based on an outbreak definition of >300 cases per 100,000 persons [62],there were four major outbreaks in Laos, namely in 2003, 2010, 2013, and 2016, with greaterintensity as compared to other years. The two provinces in Thailand recorded relativelyfewer cases than the Lao provinces with a total of 39,444 cases with an annual averageof 2320 cases (Table 4). Using the same outbreak definition as above, 2003, 2010, 2013,2015–2016, and 2018–2019 were classified as the outbreak years in Thailand.
Int. J. Environ. Res. Public Health 2021, 18, 9421 13 of 25
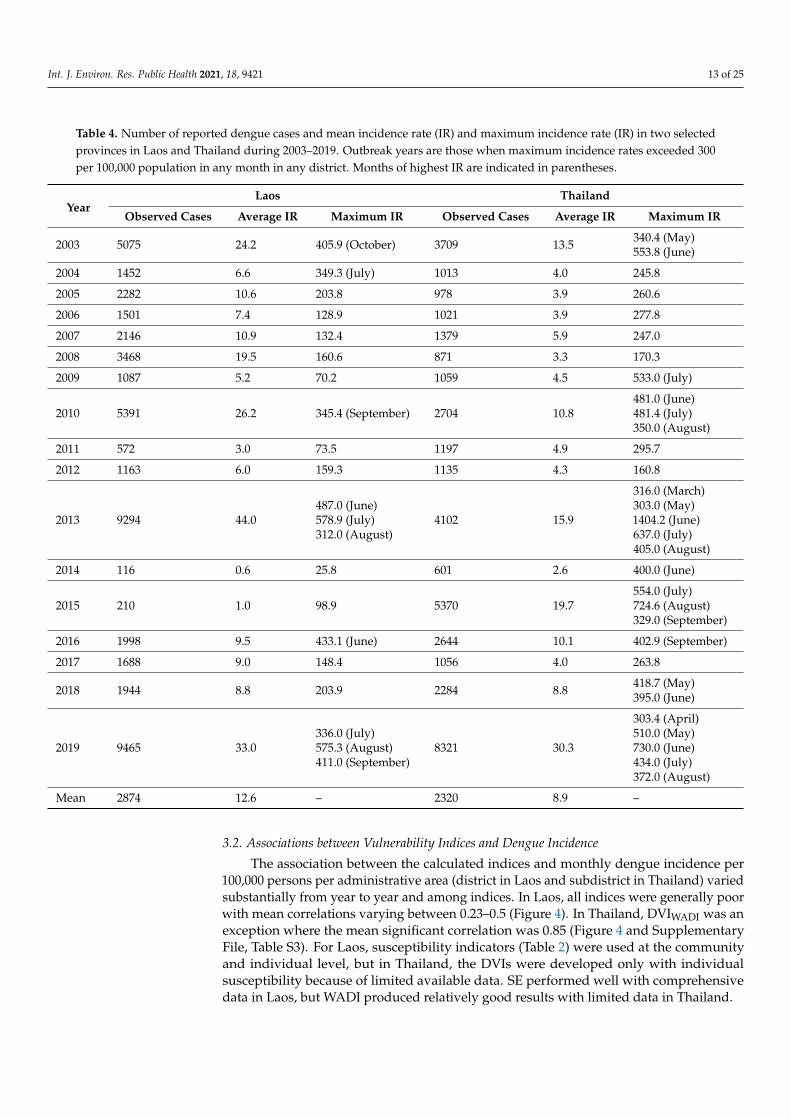
Table 4. Number of reported dengue cases and mean incidence rate (IR) and maximum incidence rate (IR) in two selectedprovinces in Laos and Thailand during 2003–2019. Outbreak years are those when maximum incidence rates exceeded 300per 100,000 population in any month in any district. Months of highest IR are indicated in parentheses.
YearLaos Thailand
Observed Cases Average IR Maximum IR Observed Cases Average IR Maximum IR
2003 5075 24.2 405.9 (October) 3709 13.5 340.4 (May)553.8 (June)
2004 1452 6.6 349.3 (July) 1013 4.0 245.8
2005 2282 10.6 203.8 978 3.9 260.6
2006 1501 7.4 128.9 1021 3.9 277.8
2007 2146 10.9 132.4 1379 5.9 247.0
2008 3468 19.5 160.6 871 3.3 170.3
2009 1087 5.2 70.2 1059 4.5 533.0 (July)
2010 5391 26.2 345.4 (September) 2704 10.8481.0 (June)481.4 (July)350.0 (August)
2011 572 3.0 73.5 1197 4.9 295.7
2012 1163 6.0 159.3 1135 4.3 160.8
2013 9294 44.0487.0 (June)578.9 (July)312.0 (August)
4102 15.9
316.0 (March)303.0 (May)1404.2 (June)637.0 (July)405.0 (August)
2014 116 0.6 25.8 601 2.6 400.0 (June)
2015 210 1.0 98.9 5370 19.7554.0 (July)724.6 (August)329.0 (September)
2016 1998 9.5 433.1 (June) 2644 10.1 402.9 (September)
2017 1688 9.0 148.4 1056 4.0 263.8
2018 1944 8.8 203.9 2284 8.8 418.7 (May)395.0 (June)
2019 9465 33.0336.0 (July)575.3 (August)411.0 (September)
8321 30.3
303.4 (April)510.0 (May)730.0 (June)434.0 (July)372.0 (August)
Mean 2874 12.6 – 2320 8.9 –
3.2. Associations between Vulnerability Indices and Dengue Incidence
The association between the calculated indices and monthly dengue incidence per100,000 persons per administrative area (district in Laos and subdistrict in Thailand) variedsubstantially from year to year and among indices. In Laos, all indices were generally poorwith mean correlations varying between 0.23–0.5 (Figure 4). In Thailand, DVIWADI was anexception where the mean significant correlation was 0.85 (Figure 4 and SupplementaryFile, Table S3). For Laos, susceptibility indicators (Table 2) were used at the communityand individual level, but in Thailand, the DVIs were developed only with individualsusceptibility because of limited available data. SE performed well with comprehensivedata in Laos, but WADI produced relatively good results with limited data in Thailand.

Int. J. Environ. Res. Public Health 2021, 18, 9421 14 of 25
Figure 4. Scatter plot of average monthly dengue vulnerability indices and dengue incidence rate per 100,000 personsand (a) Dengue Vulnerability Index–Water Associated Disease Index (DVIWADI) and (b) Dengue Vulnerability Index–Shannon’s Entropy (DVISE), (c) Dengue Vulnerability Index–Best-Worst Method (DVIBWM), in Laos (first row) and Thailand(second row).
3.2.1. Laos
In Laos, on average, annually 19% (6 out of 25) and 22% (6 out of 25) of the districtshad significant correlations (p-value < 0.05) when applying the DVIWADI and DVISE, re-spectively (Supplementary File, Table S4) and respective percentages out of the 25 districtsof Savannakhet and Champasak in Laos and the 272 sub-districts of Mukdahan and UbonRatchathani in Thailand during 2003–2019. These two indices were also good in associatingdengue incidence during outbreak years in Laos (2003, 2010, 2013, and 2019) as assessed bythe percentage of districts with a significant association, which were 21% for DVISE and14% for DVIWADI (Supplementary File, Table S4). The DVISE was significantly associatedwith dengue incidence during all the outbreak years except in 2010 (Figure 4a, and Supple-mentary File, Table S3). In contrast, DVIBWM and DVIWADI showed significant associationin 2010 (outbreak year) and years other than outbreak (Supplementary File, Table S3).
3.2.2. Thailand
In Thailand, on average 27% (73 out of 272) and 13% (35 out of 272) of the subdistrictshad significant correlations (p-value < 0.05) when applying the DVIWADI and DVISE, re-spectively (Supplementary File, Table S4). Only DVIWADI was found to be significantlyassociated with dengue incidence during outbreak years in Thailand (2003, 2010, 2013,2015, 2016, 2018, and 2019) (Supplementary File, Table S3). For Thailand, DVIWADI wasdeveloped with only individual susceptibility indicators due to lack of data at the commu-nity level (living conditions and water and hygiene) and with two indicators of adaptivecapacity (mean distance to hospital and poverty). However, even when the DVIWADI wasdeveloped with limited data, it showed a significant association with dengue incidence inall years (Figure 4 and Supplementary File, Table S3).

Int. J. Environ. Res. Public Health 2021, 18, 9421 15 of 25
3.3. Spatiotemporal Variation of Dengue Vulnerability3.3.1. Spatial Differences
Dengue vulnerability varied temporally and spatially over the study period (Figures 5–7).Generally, the highest vulnerability clusters were observed in administrative units with a highproportion of built-up areas and those undergoing new developments, such as establishingnew settlements, improved road networks, and dam constructions in forests with associatedresettlement of workers and inhabitants in remote areas. There was moderate to low vulnera-bility observed in sparsely populated areas mostly covered with forest and crops (compareFigures 2 and 5b).
Figure 5. (a) Average dengue incidence rate per 100,000 persons and (b) Average Dengue Vulnerability Index–Water Associ-ated Disease Index (DVIWADI) and (c) Average Dengue Vulnerability Index–Shannon’s Entropy (DVISE), and (d) AverageDengue Vulnerability Index–Best-Worst Method (DVIBWM), in Laos and in Thailand from 2003–2019.

Int. J. Environ. Res. Public Health 2021, 18, 9421 16 of 25
Figure 6. Average monthly vulnerability based on Water Associated Disease Index (DVIWADI) and incidence rate per100,000 persons per month in selected provinces during 2003–2019.
In Laos, the highest vulnerabilities were observed in the provincial capitals of Savan-nakhet and Pakse. The western district of Champasak and southern districts of Savannakhetshowed significant changes in vulnerability due to the recent development activities inthese areas reducing forest cover (Figures 2 and 7). In Thailand, the highest vulnerabilitieswere also observed in the provincial capitals of Mukdahan and Ubon Ratchathani. Centralparts of Mukdahan that underwent extensive deforestation and creation of rubber planta-tions and a shift in agriculture from crops to rubber or other tree plantations also showedhigh dengue vulnerability. The impact of land cover change was not visible in the overallvulnerability of Ubon Ratchathani, but there was an increase in exposure over the studyperiod due to changes in temperature and rainfall indicators (Figures S3 and S6).
Int. J. Environ. Res. Public Health 2021, 18, 9421 17 of 25
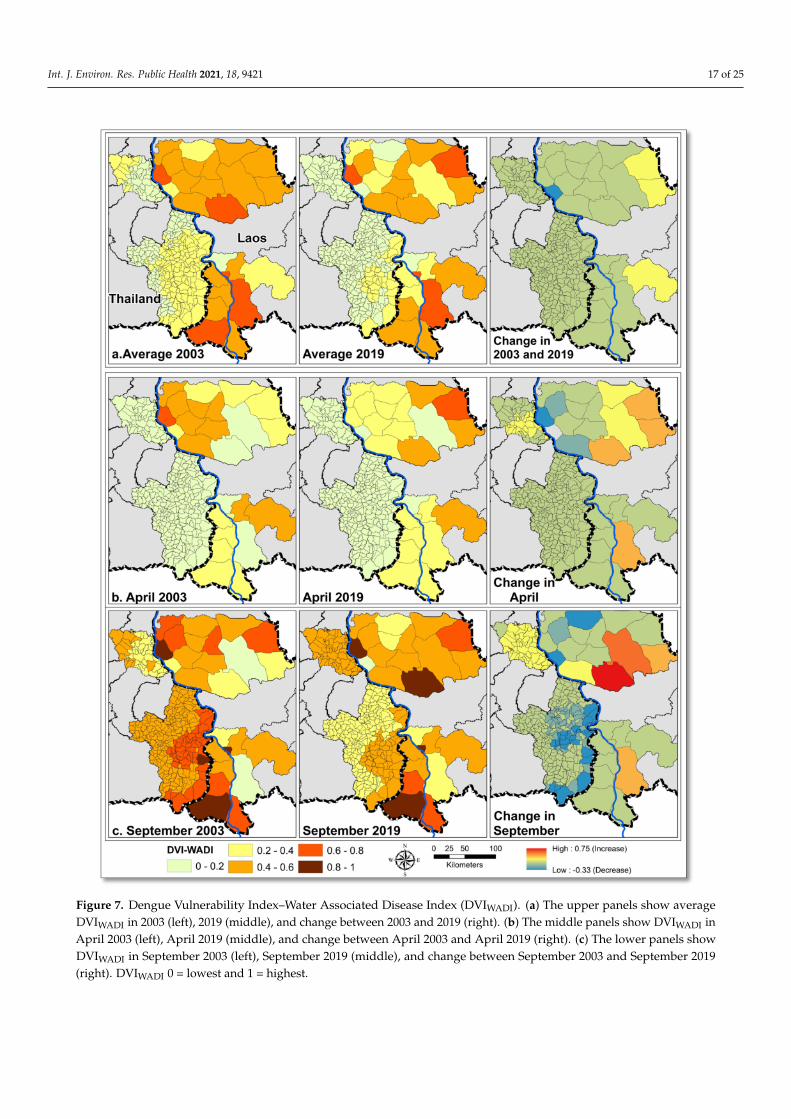
Figure 7. Dengue Vulnerability Index–Water Associated Disease Index (DVIWADI). (a) The upper panels show averageDVIWADI in 2003 (left), 2019 (middle), and change between 2003 and 2019 (right). (b) The middle panels show DVIWADI inApril 2003 (left), April 2019 (middle), and change between April 2003 and April 2019 (right). (c) The lower panels showDVIWADI in September 2003 (left), September 2019 (middle), and change between September 2003 and September 2019(right). DVIWADI 0 = lowest and 1 = highest.
Int. J. Environ. Res. Public Health 2021, 18, 9421 18 of 25
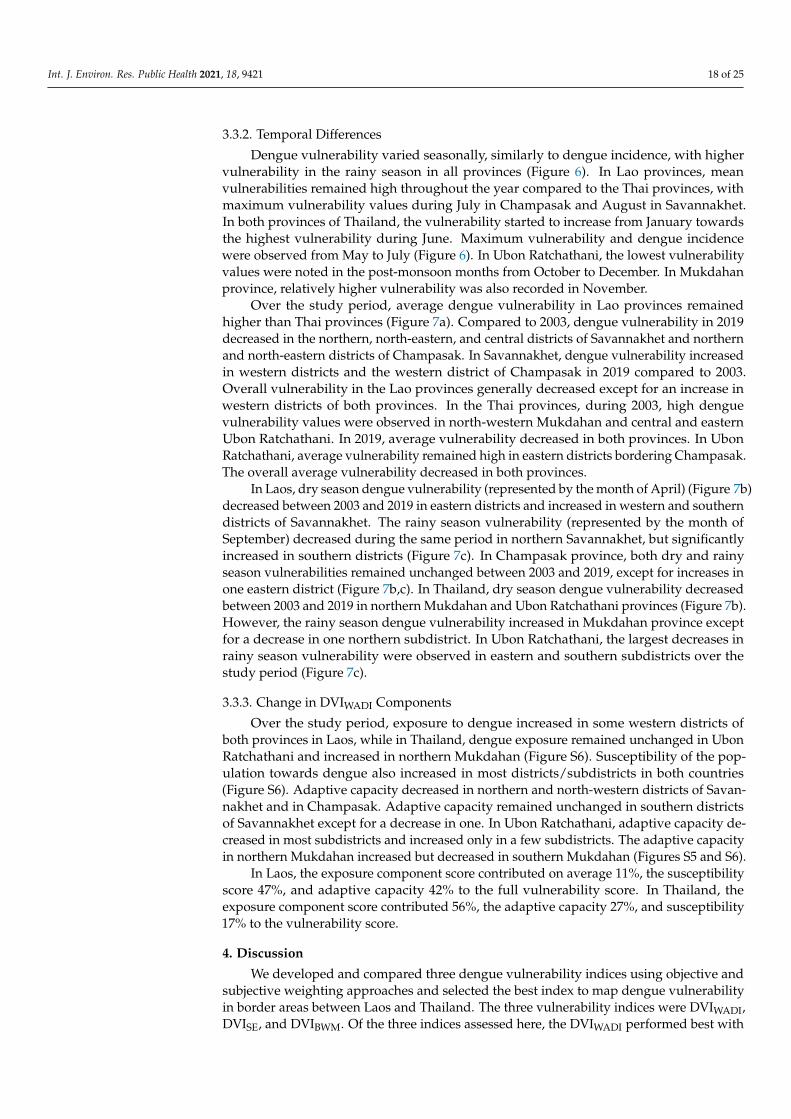
3.3.2. Temporal Differences
Dengue vulnerability varied seasonally, similarly to dengue incidence, with highervulnerability in the rainy season in all provinces (Figure 6). In Lao provinces, meanvulnerabilities remained high throughout the year compared to the Thai provinces, withmaximum vulnerability values during July in Champasak and August in Savannakhet.In both provinces of Thailand, the vulnerability started to increase from January towardsthe highest vulnerability during June. Maximum vulnerability and dengue incidencewere observed from May to July (Figure 6). In Ubon Ratchathani, the lowest vulnerabilityvalues were noted in the post-monsoon months from October to December. In Mukdahanprovince, relatively higher vulnerability was also recorded in November.
Over the study period, average dengue vulnerability in Lao provinces remainedhigher than Thai provinces (Figure 7a). Compared to 2003, dengue vulnerability in 2019decreased in the northern, north-eastern, and central districts of Savannakhet and northernand north-eastern districts of Champasak. In Savannakhet, dengue vulnerability increasedin western districts and the western district of Champasak in 2019 compared to 2003.Overall vulnerability in the Lao provinces generally decreased except for an increase inwestern districts of both provinces. In the Thai provinces, during 2003, high denguevulnerability values were observed in north-western Mukdahan and central and easternUbon Ratchathani. In 2019, average vulnerability decreased in both provinces. In UbonRatchathani, average vulnerability remained high in eastern districts bordering Champasak.The overall average vulnerability decreased in both provinces.
In Laos, dry season dengue vulnerability (represented by the month of April) (Figure 7b)decreased between 2003 and 2019 in eastern districts and increased in western and southerndistricts of Savannakhet. The rainy season vulnerability (represented by the month ofSeptember) decreased during the same period in northern Savannakhet, but significantlyincreased in southern districts (Figure 7c). In Champasak province, both dry and rainyseason vulnerabilities remained unchanged between 2003 and 2019, except for increases inone eastern district (Figure 7b,c). In Thailand, dry season dengue vulnerability decreasedbetween 2003 and 2019 in northern Mukdahan and Ubon Ratchathani provinces (Figure 7b).However, the rainy season dengue vulnerability increased in Mukdahan province exceptfor a decrease in one northern subdistrict. In Ubon Ratchathani, the largest decreases inrainy season vulnerability were observed in eastern and southern subdistricts over thestudy period (Figure 7c).
3.3.3. Change in DVIWADI Components
Over the study period, exposure to dengue increased in some western districts ofboth provinces in Laos, while in Thailand, dengue exposure remained unchanged in UbonRatchathani and increased in northern Mukdahan (Figure S6). Susceptibility of the pop-ulation towards dengue also increased in most districts/subdistricts in both countries(Figure S6). Adaptive capacity decreased in northern and north-western districts of Savan-nakhet and in Champasak. Adaptive capacity remained unchanged in southern districtsof Savannakhet except for a decrease in one. In Ubon Ratchathani, adaptive capacity de-creased in most subdistricts and increased only in a few subdistricts. The adaptive capacityin northern Mukdahan increased but decreased in southern Mukdahan (Figures S5 and S6).
In Laos, the exposure component score contributed on average 11%, the susceptibilityscore 47%, and adaptive capacity 42% to the full vulnerability score. In Thailand, theexposure component score contributed 56%, the adaptive capacity 27%, and susceptibility17% to the vulnerability score.
4. Discussion
We developed and compared three dengue vulnerability indices using objective andsubjective weighting approaches and selected the best index to map dengue vulnerabilityin border areas between Laos and Thailand. The three vulnerability indices were DVIWADI,DVISE, and DVIBWM. Of the three indices assessed here, the DVIWADI performed best with
Int. J. Environ. Res. Public Health 2021, 18, 9421 19 of 25
a significant correlation with dengue incidence (Pearson correlation coefficient, r > 0.5 andp < 0.05) in areas with high dengue incidence during outbreak and non-outbreak years.The DVISE performed better than DVIBWM, but not in the highly vulnerable provincialcapitals of Laos (Figure 5). The DVIBWM overestimated vulnerability in administrativeunits that experienced very low dengue incidence and underestimated in highly vulner-able provincial capitals with high dengue incidences (Figure 5). However, DVI includesconditions of exposure, susceptibility, and adaptive capacity that can also occur withoutDENV transmission [50,63].
The DVIWADI was a better index compared to DVISE and DVIBWM to map vulnerabil-ities because it presented higher spatio-temporally significant correlations with dengueincidences (r> 0.5 and p < 0.05) in the study areas in both countries. The validation ofDVIWADI results showed better performance in Thailand than in Laos with a significantpositive correlation between vulnerability and dengue incidence in 16 out of 17 years in27% (15–53%) of the subdistricts on average in non-outbreak years and 36% (22–53%) inoutbreak years.
4.1. DVIWADI Spatial Variations
The highest annual average DVIWADI was observed in districts with major urbancenters and high population densities (Figure 5). In the Thai provinces, clusters of highlyvulnerable districts were in and around the provincial capitals, and in districts that mostlyconsisted of forest and tree plantations of cashew and rubber. In Laos, the provincialcapitals were highly vulnerable, and the rest of the districts were moderately to highlyvulnerable. The temporal variations during 2003–2019 in vulnerability (Figure 7) alsohighlighted the impact of land covers and their change.
4.2. Change in DVIWADI during 2003–2019
The combination of socioeconomic and environmental indicators affect dengue vul-nerability [64,65]. Environmental indicators of exposure including climate and land coverplay a role at a larger scale, while socioeconomic indicators of susceptibility and adaptivecapacity define the risk of communities toward dengue infection.
In the selected provinces, vulnerability decreased in 67% of districts in Laos and in87% of the subdistricts in Thailand between 2003 and 2019 (Figure 7). This likely reflects thegeneral improvement in indicators of susceptibility, specifically hygiene facilities, and anincrease in adaptive capacity with a decrease in poverty incidence because of better socioe-conomic status and increased female literacy rates (Supplementary File, Figures S3 and S4).A study from southern Mexico [55] also indicated that the households with poor socioeco-nomic conditions and low educated mothers tend to have high risk for dengue with morelarval breeding containers.
Dengue vulnerability increased in the remaining areas, i.e., in 33% of the Lao districtsand 13% of the Thai subdistricts (Figure 7). This increase in dengue vulnerabilities wasmainly linked with the increase in exposure in the eastern districts of Savannakhet andChampasak and in the whole of Mukdahan.
In Laos, the significant land cover modification included forest clearing, forest andagriculture land conversion to rubber plantations, dams, settlements, and road construction(Figures 2 and 7) [66]. In 2003, the southern district of Savannakhet province consisted offorest and experienced low vulnerability in the dry season and high vulnerability in themonsoon season. In 2019, these forests were cleared mainly for dams construction andother land-uses [67], which ultimately increased the human population density, causingan increase in vulnerability in this district. The increase in vulnerability in the southerndistricts of Savannakhet was pronounced when comparing the rainy season in 2003 to thatof 2019 (Figure 7c). Similarly in Malaysia [68], deforestation was found to be associatedwith increased dengue cases.
In Thailand, Mukdahan province was the least affected by dengue, although the rainyseason vulnerability increased between 2003 and 2019 while remaining unchanged in the
Int. J. Environ. Res. Public Health 2021, 18, 9421 20 of 25
dry season. Changes in dengue vulnerability in Mukdahan were associated with climaticchanges and extreme climatic events (Figure S3), especially flooding in the rainy seasonfrom 2011 onwards (Table S5b). Land cover in Mukdahan also changed, for example, withincreased deforestation and conversion to agriculture and rubber plantations (Figure 2) [69].
4.3. DVIWADI Temporal Variations
DVIWADI presented strong seasonal variations in dengue vulnerability, driven by theclimate variation in both countries across the year. In both countries, high vulnerabilitywas related to the rainy season that spans from May to October; this seasonal cycle differsamong selected provinces (Figure 6). This seasonality of dengue is widely reported inSouth East Asian countries [12,70,71].
4.4. Change in Determinants of DVIWADI
The three determinants of dengue vulnerability independently changed over thestudy period.
i. Exposure: All four indicators of exposure including land cover, temperature, rainfall,and population density changed over the study period. An increase in exposure/riskwith landcover and climate is also reported in other South East Asian countries suchas Malaysia [68], Vietnam [72], Indonesia [73], and Timor-Leste [74]. The increasingrisk with climate is also well reported for different parts of Thailand [21,51,75–78].On average, exposure contributed 56% to the DVIWADI score in Thailand and only11% in Laos. The relatively higher contribution of exposure to dengue vulnerabilityin Thailand could be a reason for the overall high correlation between DVIWADI anddengue incidence (R2 = 0.73 and r = 0.85), even if data for susceptibility and adaptivecapacity determinants were limited (Figure 4). On average, exposure contributed56% to the DVIWADI score in Thailand and 11% in Laos. Both countries went throughsimilar environmental changes, but there were marked differences in populationdensity; for example, population densities remained low in Savannakhet (below100 person/km2 between 2003–2019). The low exposure in Laos can be an artifactbecause of larger spatial units considered as compared to Thailand where subdistrictsare much smaller than districts in Laos.
ii. Susceptibility: People’s susceptibility to dengue decreased in both countries withimproved water and hygiene facilities (Supplementary File, Figure S5). In Laos, thepopulation with improved access to water and sanitation increased by 18% between2005 and 2010 alone and from 45% to 63% nationwide, exceeding the MillenniumDevelopment Goals target of 54% [79]. Similarly, in Thailand, nearly 93% of thepopulation has access to improved hygiene and 96% to drinking water [80]. In Laos,susceptibility on average contributed 47% and in Thailand, only 17% to the DVIWADIscore, which underlines the different living conditions and vulnerable population agegroups in the study sites of these two countries. The relatively higher contribution ofsusceptibility and limited data (censuses in 2005 and 2015) in Laos might be the reasonfor an overall lower correlation between DVIWADI and dengue incidence (R2 = 0.22and r = 0.5) (Figure 4).
iii. Adaptive capacity: In Laos, the adaptive capacity on average contributed 42% to totalDVIWADI score and in Thailand only 27%. Poverty and female literacy rates were themost critical indicators of adaptive capacity that can effectively help to reduce thedengue burden. Research from southern Brazil [81] reported 23–32% reduction indengue cases with an increase in mean income from approximately USD 100–200 toUSD 200–300. Poverty incidence rates decreased in Laos provinces between 2005 and2015 (Supplementary File, Figure S5). In Champasak, poverty incidence dropped to21% from 28% and in Savannakhet from 49.3% to 32.2%. In Thailand, the povertyincidence rate also decreased between 2003 and 2019, from 8% to 1.3% in Mukdahanand from 2.5% to 1.1% in Ubon Ratchathani [24]. The average female literacy ratebetween 2005–2015 increased from 44.6% to 48.7% in Champasak province and from
Int. J. Environ. Res. Public Health 2021, 18, 9421 21 of 25
38.8% to 42.6% in Savannakhet province [23]. The average female literacy ratesin Mukdahan and Ubon Ratchathani in 2000 were 86% and 90%, respectively, andincreased to 95% in both provinces in 2019 [24]. The average distance to a hospital orhealth care facility is a crucial indicator of community adaptive capacity. However,this distance remained unchanged in Laos between the 2005 and 2015 censuses [23].In Laos, except for urban centers, the minimum average distance to the nearesthealth facility was 10–20 kilometers. The lack of geographical coverage of the healthsystem was due to a sparse population in the country, with approximately 80% of thepopulation living in rural areas and engaged in agriculture [82]. The current healthfacility network in Thailand showed good coverage, with the nearest health carefacility between 1 and 10 kilometers.
Vulnerability indices simplify the complex real-world information and provide ascience–policy interface for decision makers. The DVI maps developed in this study(Figure 7) identified areas needing vector control and communities with deprived healthservices. Such maps could inform the health department on areas in most need of pre-vention and intervention activities. Along with previous studies [12,15,16], this studyemphasizes the role of the WADI as a holistic tool to highlight key factors and linkages thatplay a role in DENV transmission.
Interpretation of the results from our study highlights the need for intersectoralcollaboration, especially among health, urban planning, water, and agriculture/forestrysectors. Deforestation for city development, crops, and dams should be accompanied bythe health and environment sectors to conduct the impact assessments, considering theanticipated detrimental impacts on public health. Moreover, these interconnected sectorsshould work together to define mitigation and adaptation strategies to reduce the effectof damage already inflicted. This is already part of the Constitution of the Kingdom ofThailand (2007), Article 672 [83,84], and also needs to be developed in Laos.
Vulnerability index development depends on spatiotemporal socio-economic dataand their quality. This study was limited by lack of spatial details since dengue casedata used for validation were aggregated at the district and subdistrict levels and a finerscale georeferencing of individual patients’ households was not possible. The continuousspatio-temporal availability of climate and earth observation records from satellites im-proved the reliability of data for eco-environmental factors. However, fine scale temporalsocioeconomic and demographic data remain challenging to access in endemic regionsof South East Asia. A detailed annual socioeconomic and living conditions database wasavailable for Thailand, but only for municipal and non-municipal areas without furtherdivision into subdistricts or villages. The performance of DVIWADI could be improved byincluding detailed socioeconomic data for more time steps in Laos and Thailand at thevillage, subdistrict, and district levels.
5. Conclusions
Despite vector control and dengue prevention activities, dengue represents a signifi-cant disease burden in Laos and Thailand, indicating the need for further improvementof centralized national databases, understanding relevant environmental processes, anddisseminating dengue-related knowledge in different socioeconomic settings. The vulnera-bility assessment using multiple approaches improves understanding of crucial denguedeterminants and facilitates communication of complex interactions. The DVIWADI ap-proach in this study described changing conditions at a regional scale. It provided a visualtool that can support public health sectors and decision makers in allocating resources forinterventions and prevention measures to reduce population susceptibility and enhanceresilience. Further development of an interactive web-based platform of the WADI wouldbe a practical step to facilitate communication of vulnerability trends to decision makerslocally and globally.
Int. J. Environ. Res. Public Health 2021, 18, 9421 22 of 25
Supplementary Materials: The following are available online at https://www.mdpi.com/article/10.3390/ijerph18179421/s1, Figure S1: Age group distribution of reported dengue cases (DF, DHF,and DSS) in Savannakhet and Champasak provinces in Laos and Mukdahan and Ubon Ratchathaniprovinces in Thailand between 2002 and 2019, Figure S2: Landuse and landcover change in Cham-pasak and Savannakhet provinces in Laos and Mukdahan and Ubon Ratchathani provinces inThailand between 2002 and 2019, Figure S3: Change in three of the four exposure indicators; pop-ulation density, mean annual rainfall, and mean annual temperature in selected provinces in Laosand Thailand between 2003 and 2019, Figure 4: Change in the three susceptibility indicators, hous-ing quality (left panels), toilet type (middle panels) and vulnerable populations (right panels) inSavannakhet and Champasak provinces in Laos in 2003 and in Mukdahan and Ubon Ratchathaniprovinces in Thailand in 2019 (Lao Statistics Bureau 2019; National Statistical Office of Thailand2019), Figure S5: Change in indicators of adaptive capacity in selected provinces in Laos and Thai-land between 2003 and 2019. Female literacy rate was not available for Thailand at subdistrictlevel (Lao Statistics Bureau 2019; National Statistical Office of Thailand 2019), Figure S6: Changein exposure (left panel), susceptibility (middle panel) and adaptive capacity (right panel) basedon the Water Associated Disease Index (DVIWADI) in Savannakhet and Champasak provinces inLaos and Mukdahan and Ubon Ratchathani provinces in Thailand between 2003 and 2019. Table S1:Indicator weight calculation using Shannon’s Entropy (SE) for Laos, Table S2: Indicators weightcalculation using Shannon’s Entropy (SE) for Thailand, Table S3: Pearson’s correlation coefficientsbetween each of three vulnerability indices and monthly dengue incidence per 100,000 persons peryear in Laos and Thailand during 2003-2019, Table S4: Number of districts and percentage of withsignificant correlation coefficients (p-value < 0.05) and respective percentages out of the 25 districts ofSavannakhet and Champasak in Laos and the 272 sub-districts of Mukdahan and Ubon Ratchathaniin Thailand during 2003-2019, Table S5. The extent of inundated areas for annual flooding events inSavannakhet and Champasak provinces in Laos and Mukdahan and Ubon Ratchathani provinces inThailand between 2002 and 2019.
Author Contributions: Conceptualization, S.Z., O.S. and H.J.O.; Data curation, S.Z., S.A., M.M.,M.S.R., P.P., T.P., N.V. and H.J.O.; Formal analysis, S.Z. and H.J.O.; Funding acquisition, O.S., U.H.,M.M. and H.J.O.; Investigation, O.S., R.E.P., J.R. and H.J.O.; Methodology, S.Z. and H.J.O.; Projectadministration, O.S., U.H., M.M. and H.J.O.; Resources, S.Z., O.S. and H.J.O.; Software, S.Z.; Su-pervision, O.S., R.E.P., J.R. and H.J.O.; Validation, J.R. and H.J.O.; Visualization, S.Z. and H.J.O.;Writing—original draft, S.Z.; Writing—review and editing, O.S., R.E.P., J.R., U.H., M.M., M.S.R., C.P.and H.J.O. All authors have read and agreed to the published version of the manuscript.
Funding: This research was supported by the Research Council of Norway [DENCLIM project, grantnumber 281077].
Institutional Review Board Statement: Not applicable.
Informed Consent Statement: Not applicable.
Conflicts of Interest: The authors declare no conflict of interest.
References1. Bhatt, S.; Gething, P.W.; Brady, O.J.; Messina, J.P.; Farlow, A.W.; Moyes, C.L.; Drake, J.M.; Brownstein, J.S.; Hoen, A.G.; Sankoh, O.;
et al. The global distribution and burden of dengue. Nature 2013, 496, 504–507. [CrossRef] [PubMed]2. World Health Organization (WHO). Dengue and Severe Dengue. Available online: www.who.int/mediacentre/factsheets/fs117
/en/index.html (accessed on 12 June 2018).3. Acharya, B.K.; Cao, C.X.; Lakes, T.; Chen, W.; Naeem, S.; Pandit, S. Modeling the spatially varying risk factors of dengue fever in
Jhapa district, Nepal, using the semi-parametric geographically weighted regression model. Int. J. Biometeorol. 2018, 62, 1973–1986.[CrossRef]
4. Khormi, H.M.; Kumar, L.; Elzahrany, R.A. Modeling spatio-temporal risk changes in the incidence of dengue fever in SaudiArabia: A geographical information system case study. Geospat. Health 2011, 6, 77–84. [CrossRef] [PubMed]
5. Misslin, R.; Telle, O.; Daudé, E.; Vaguet, A.; Paul, R.E. Urban climate versus global climate change—What makes the differencefor dengue? Ann. N. Y. Acad. Sci. 2016, 1382, 56–72. [CrossRef] [PubMed]
6. Wu, P.C.; Lay, J.G.; Guo, H.R.; Lin, C.Y.; Lung, S.C.; Su, H.J. Higher temperature and urbanization affect the spatial patterns ofdengue fever transmission in subtropical Taiwan. Sci. Total Environ. 2009, 407, 2224–2233. [CrossRef]
Int. J. Environ. Res. Public Health 2021, 18, 9421 23 of 25
7. WHO. Dengue Guidelines for Diagnosis, Treatment, Prevention and Control; World Health Organization (WHO) and the SpecialProgramme for Research and Training in Tropical Diseases (TDR): Lyon, France, 2009; Volume 409, ISBN 9789241547. Availableonline: https://www.who.int/tdr/publications/documents/dengue-diagnosis.pdf (accessed on 5 September 2021).
8. Bedran-Martins, A.M.; Lemos, M.C.; Philippi, A. Relationship between subjective well-being and material quality of life in face ofclimate vulnerability in NE Brazil. Clim. Chang. 2018, 147, 283–297. [CrossRef]
9. Lippi, C.A.; Stewart-Ibarra, A.M.; Muñoz, Á.G.; Borbor-Cordova, M.J.; Mejía, R.; Rivero, K.; Castillo, K.; Cárdenas, W.B.; Ryan, S.J.The social and spatial ecology of dengue presence and burden during an outbreak in Guayaquil, Ecuador, 2012. Int. J. Environ.Res. Public Health 2018, 15, 827. [CrossRef]
10. Chen, B.; Yang, J.; Luo, L.; Yang, Z.; Liu, Q. Who is vulnerable to dengue fever? A community survey of the 2014 outbreak inGuangzhou, China. Int. J. Environ. Res. Public Health 2016, 13, 712. [CrossRef] [PubMed]
11. Füssel, H.M. Vulnerability: A generally applicable conceptual framework for climate change research. Glob. Environ. Chang. 2007,17, 155–167. [CrossRef]
12. Fullerton, L.; Dickin, S.; Schuster-Wallace, C.J. Mapping Global Vulnerability to Dengue Using the Water Associated Disease Index Wasteto Wealth View Project; United Nations University: Hamilton, ON, Canada, 2014; ISBN 9789280860450.
13. Moore, M.; Gelfeld, B.; Okunogbe, A.; Paul, C. Identifying Future Disease Hot Spots: Infectious Disease Vulnerability Index; RANDCorporation: Santa Monica, CA, USA, 2017; Volume 6, ISBN 9780833095749.
14. Dickin, S.K.; Schuster-Wallace, C.J.; Elliott, S.J. Developing a Vulnerability Mapping Methodology: Applying the Water-AssociatedDisease Index to Dengue in Malaysia. PLoS ONE 2013, 8, e63584. [CrossRef]
15. Pham, N.T.T.; Nguyen, C.T.; Vu, H.H. Assessing and modelling vulnerability to dengue in the Mekong Delta of Vietnam bygeospatial and time-series approaches. Environ. Res. 2020, 186, 109545. [CrossRef] [PubMed]
16. Dickin, S.K.; Schuster-Wallace, C.J. Assessing changing vulnerability to dengue in northeastern Brazil using a water-associateddisease index approach. Glob. Environ. Chang. 2014, 29, 155–164. [CrossRef]
17. Henry, S.; Mendonça, F.d.A. Past, present, and future vulnerability to dengue in jamaica: A spatial analysis of monthly variations.Int. J. Environ. Res. Public Health 2020, 17, 3156. [CrossRef] [PubMed]
18. Tsheten, T.; Clements, A.C.A.; Gray, D.J.; Wangdi, K. Dengue risk assessment using multicriteria decision analysis: A case studyof Bhutan. PLoS Negl. Trop. Dis. 2021, 15, e0009021. [CrossRef]
19. Ali, S.A.; Ahmad, A. Mapping of mosquito-borne diseases in Kolkata Municipal Corporation using GIS and AHP based decisionmaking approach. Spat. Inf. Res. 2019, 27, 351–372. [CrossRef]
20. Dom, N.C.; Ahmad, A.H.; Latif, Z.A.; Ismail, R. Application of geographical information system-based analytical hierarchyprocess as a tool for dengue risk assessment. Asian Pac. J. Trop. Dis. 2016, 6, 928–935. [CrossRef]
21. Jeefoo, P.; Tripathi, K.N. Dengue risk zone index (DRZI) for mapping dengue risk areas. Int. J. Geoinform. 2011, 7, 53–62.22. Cardona, O.D.; Van Aalst, M.K.; Birkmann, J.; Fordham, M.; Mc Gregor, G.; Rosa, P.; Pulwarty, R.S.; Schipper, E.L.F.; Sinh, B.T.;
Décamps, H.; et al. Determinants of risk: Exposure and vulnerability. In Managing the Risks of Extreme Events and Disasters toAdvance Climate Change Adaptation; A Special Report of Working Groups I and II of the Intergovernmental Panel on ClimateChange (IPCC); Cambridge University Press: Cambridge, UK, 2012; pp. 65–108. ISBN 9781107025066. [CrossRef]
23. Lao Statistics Bureau Lao Decide Info. Available online: http://www.decide.la/%0A (accessed on 15 January 2019).24. National Statistical Office of Thailand Registration Statistics System Official Statistics Registration Systems (Thailand). Available
online: https://stat.bora.dopa.go.th/new_stat/webPage/statByYear.php (accessed on 15 January 2020).25. Dee, D.P.; Uppala, S.M.; Simmons, A.J.; Berrisford, P.; Poli, P.; Kobayashi, S.; Andrae, U.; Balmaseda, M.A.; Balsamo, G.; Bauer, P.;
et al. The ERA-Interim reanalysis: Configuration and performance of the data assimilation system. Q. J. R. Meteorol. Soc. 2011,137, 553–597. [CrossRef]
26. European Centre for Medium-Range Weather Forecasts Copernicus Climate Data Store. Available online: cds.climate.copernicus.eu (accessed on 15 December 2020).
27. Wong, J.; Stoddard, S.T.; Astete, H.; Morrison, A.C.; Scott, T.W. Oviposition site selection by the dengue vector Aedes aegypti andits implications for dengue control. PLoS Negl. Trop. Dis. 2011, 5, e1015. [CrossRef]
28. Carvalho, F.D.; Moreira, L.A. Why is Aedes aegypti Linnaeus so Successful as a Species? Neotrop. Entomol. 2017, 46, 243–255.[CrossRef]
29. Gratz, N.G. Critical review of the vector status of Aedes albopictus. Med. Vet. Entomol. 2004, 18, 215–227. [CrossRef]30. United States Geological Survey Landsat 5–8 Satellite Images. Available online: https://earthexplorer.usgs.gov/ (accessed on
5 January 2019).31. Umor, S.M.; Mokhtar, M.B.; Surip, N.; Ahmad, A. Generating a dengue risk map (DRM) based on environmental factors using
remote sensing and GIS technologies. In Proceedings of the Asian Association on Remote Sensing, 28th Asian Conference onRemote Sensing, Kuala Lumpur, Malaysia, 12–16 November 2007; Volume 2, pp. 867–881.
32. Struchiner, C.J.; Rockloev, J.; Wilder-Smith, A.; Massad, E. Increasing dengue incidence in Singapore over the past 40 years:Population growth, climate and mobility. PLoS ONE 2015, 10, e0136286. [CrossRef] [PubMed]
33. Berman, T.; Zohary, T.; Nishri, A.; Sukenik, A.; Kusçu Simsek, Ç.; Ödül, H.; Food and Agriculture Organization of the UnitedNations; Ford, J.D.; Pearce, T.; McDowell, G.; et al. Epidemiological Trends of Dengue Disease in Thailand (2000–2011): ASystematic Literature Review. PLoS Negl. Trop. Dis. 2014, 8, 1–11. [CrossRef]
Int. J. Environ. Res. Public Health 2021, 18, 9421 24 of 25
34. Khampapongpane, B.; Lewis, H.C.; Ketmayoon, P.; Phonekeo, D.; Somoulay, V.; Khamsing, A.; Phengxay, M.; Sisouk, T.; Vong-phrachanh, P.; Bryant, J.E. National dengue surveillance in the Lao People’s Democratic Republic, 2006–2012: Epidemiologicaland laboratory findings. West. Pacific Surveill. Response J. WPSAR 2014, 5, 7–13. [CrossRef]
35. Reiter, P.; Lathrop, S.; Bunning, M.; Biggerstaff, B.; Singer, D.; Tiwari, T.; Baber, L.; Amador, M.; Thirion, J.; Hayes, J.; et al. Texaslifestyle limits transmission of dengue virus. Emerg. Infect. Dis. 2003, 9, 86. [CrossRef] [PubMed]
36. Vannavong, N.; Seidu, R.; Stenström, T.A.; Dada, N.; Overgaard, H.J. Effects of socio-demographic characteristics and householdwater management on Aedes aegypti production in suburban and rural villages in Laos and Thailand. Parasites Vectors 2017, 10,1–14. [CrossRef] [PubMed]
37. Telle, O.; Nikolay, B.; Kumar, V.; Benkimoun, S.; Pal, R.; Nagpal, B.; Paul, R.E. Social and environmental risk factors for dengue inDelhi city: A retrospective study. PLoS Negl. Trop. Dis. 2021, 15, e0009024. [CrossRef]
38. Mulligan, K.; Dixon, J.; Sinn, C.L.J.; Elliott, S.J. Is dengue a disease of poverty? A systematic review. Pathog. Glob. Health 2015, 109,10–18. [CrossRef]
39. Laddey, R.; Kumamoto, M.; Treichel, P. Africa Adaptation Programme Experiences Gender and Climate Change: Advancing DevelopmentThrough an Integrated Gender Perspective; Discussion Paper Series; United Nations Development Programme: New York, NY, USA,2011; Volume 1.
40. Gesler, W. The uses of spatial analysis in medical geography: A review. Soc. Sci. Med. 1986, 23, 963–973. [CrossRef]41. Khun, S.; Manderson, L. Community and school-based health education for dengue control in rural Cambodia: A process
evaluation. PLoS Negl. Trop. Dis. 2007, 1, e143. [CrossRef]42. Hersbach, H.; Bell, B.; Berrisford, P.; Hirahara, S.; Horányi, A.; Muñoz-Sabater, J.; Nicolas, J.; Peubey, C.; Radu, R.; Schepers, D.;
et al. The ERA5 global reanalysis. Q. J. R. Meteorol. Soc. 2020, 146, 1999–2049. [CrossRef]43. Zafar, S.; Overgaard, H.J.; Shipin, O.; Paul, R.E.; Mayxay, M.; Pientong, C.; Aromseree, S.; Poolphol, P.; Pongvongsa, T.; Vannavong,
N.; et al. Environmental and climatic drivers of dengue fever in Lao People’s Democratic. Int. J. Environ. Res. Public Health2021. (submitted).
44. Siraj, A.S.; Oidtman, R.J.; Huber, J.H.; Kraemer, M.U.G.; Brady, O.J.; Johansson, M.A.; Perkins, T.A. Temperature modulatesdengue virus epidemic growth rates through its effects on reproduction numbers and generation intervals. PLoS Negl. Trop. Dis.2017, 11, 1–19. [CrossRef]
45. Liu-Helmersson, J.; Stenlund, H.; Wilder-Smith, A.; Rocklöv, J. Vectorial capacity of Aedes aegypti: Effects of temperature andimplications for global dengue epidemic potential. PLoS ONE 2014, 9, e89783. [CrossRef]
46. Carrington, L.B.; Armijos, M.V.; Lambrechts, L.; Scott, T.W. Fluctuations at a Low Mean Temperature Accelerate Dengue VirusTransmission by Aedes aegypti. PLoS Negl. Trop. Dis. 2013, 7, e2190. [CrossRef] [PubMed]
47. Kuno, G. Review of the Factors Modulating Dengue Transmission. Epidemiol. Rev. 1995, 17, 321–335. [CrossRef]48. Ehelepola, N.D.B.; Ariyaratne, K.; Buddhadasa, W.M.N.P.; Ratnayake, S.; Wickramasinghe, M. A study of the correlation between
dengue and weather in Kandy City, Sri Lanka (2003–2012) and lessons learned. Infect. Dis. Poverty 2015, 4, 1–15. [CrossRef]49. Castillo, K.C.; Körbl, B.; Stewart, A.; Gonzalez, J.F.; Poncec, F.; Cordeiro, R.; Donalisio, M.R.; Andrade, V.R.; Mafra, A.C.N.; Nucci,
L.B.; et al. Dengue fever occurrence and vector detection by larval survey, ovitrap and mosquiTRAP: A space-time clustersanalysis. Sci. Total Environ. 2011, 7, 1–11. [CrossRef]
50. Gubler, D.J. Dengue, Urbanization and globalization: The unholy trinity of the 21 st century. Trop. Med. Health 2011, 39, 3–11.[CrossRef] [PubMed]
51. Thammapalo, S.; Chongsuwiwatwong, V.; Geater, A.; Lim, A.; Choomalee, K. Socio-demographic and environmental factorsassociated with Aedes breeding places in Phuket, Thailand. Southeast Asian J. Trop. Med. Public Health 2005, 36, 426–433. [PubMed]
52. De Mattos Almeida, M.C.; Caiaffa, W.T.; Assunção, R.M.; Proietti, F.A. Spatial vulnerability to dengue in a Brazilian urban areaduring a 7-year surveillance. J. Urban Health 2007, 84, 334–345. [CrossRef]
53. Daudé, É.; Mazumdar, S.; Solanki, V. Widespread fear of dengue transmission but poor practices of dengue prevention: A studyin the slums of Delhi, India. PLoS ONE 2017, 12, 1–12. [CrossRef]
54. Mayxay, M.; Cui, W.; Thammavong, S.; Khensakhou, K.; Vongxay, V.; Inthasoum, L.; Sychareun, V.; Armstrong, G. Dengue inperi-urban Pak-Ngum district, Vientiane capital of Laos: A community survey on knowledge, attitudes and practices. BMC PublicHealth 2013, 13, 1–8. [CrossRef]
55. Danis-Lozano, R.; Rodríguez, M.H.; Hernández-Avila, M. Gender-related family head schooling and Aedes aegypti larvalbreeding risk in Southern Mexico. Salud Publica Mex. 2002, 44, 237–242. [CrossRef]
56. Ali, M.; Wagatsuma, Y.; Emch, M.; Breiman, R.F. Use of a geographic information system for defining spatial risk for denguetransmission in Bangladesh: Role for Aedes albopictus in an urban outbreak. Am. J. Trop. Med. Hyg. 2003, 69, 634–640. [CrossRef][PubMed]
57. McNicoll, G. Human Development Report 1995; United Nations Development Programme: New York, NY, USA, 1995; Volume 21,ISBN 9780230284456.
58. Drobne, S.; Lisec, A. Multi-attribute decision analysis in GIS: Weighted linear combination and ordered weighted averaging.Informatica 2009, 33, 459–474.
59. Al-Abadi, A.M.; Pourghasemi, H.R.; Shahid, S.; Ghalib, H.B. Spatial Mapping of Groundwater Potential Using Entropy WeightedLinear Aggregate Novel Approach and GIS. Arab. J. Sci. Eng. 2017, 42, 1185–1199. [CrossRef]
60. Rezaei, J. Best-worst multi-criteria decision-making method. Omega 2015, 53, 49–57. [CrossRef]
Int. J. Environ. Res. Public Health 2021, 18, 9421 25 of 25
61. Devarakonda, P.; Sadasivuni, R.; Nobrega, R.A.A.; Wu, J. Application of spatial multicriteria decision analysis in healthcare:Identifying drivers and triggers of infectious disease outbreaks using ensemble learning. J. Multi-Criteria Decis. Anal. 2021, 1–14.[CrossRef]
62. WHO. Technical Handbook for Dengue Surveillance, Dengue Outbreak Prediction/Detection and Outbreak Response (“Model ContingencyPlan”); WHO Library Cataloguing-in-Publication Data; World Health Organisation: Geneva, Switzerland, 2016; Volume 92.
63. Hasnan, S.N.A.; Che-Dom, N.; Abd-Latif, Z.; Madzlan, F. Surveillance of Aedes mosquitoes in different residential types incentral zone of Shah Alam, Selangor. Asian Pac. J. Trop. Dis 2017, 7, 332–340. [CrossRef]
64. Lin, H.; Liu, T.; Song, T.; Lin, L.; Xiao, J.; Lin, J.; He, J.; Zhong, H.; Hu, W.; Deng, A.; et al. Community Involvement in DengueOutbreak Control: An Integrated Rigorous Intervention Strategy. PLoS Negl. Trop. Dis. 2016, 10, 1–10. [CrossRef]
65. Zahir, A. Community Participation, Dengue Fever Prevention and Practices for Control in Swat, Pakistan. Int. J. MCH AIDS 2016,5, 39–45. [CrossRef]
66. Morris, J.; Fiorino, F. Power Surge—The Impacts of Rapid Dam Development in Laos; International Rivers: Berkeley, CA, USA, 2008;Volume 169, ISBN 9780971885875.
67. Thomas, I.L. Drivers of Forest Change in the Greater Mekong Subregion, Vientiane, Laos. 2015. Available online: https://www.leafasia.org/library/drivers-forest-change-greater-mekong-subregion-vietnam (accessed on 5 September 2021).
68. Husnina, Z.; Clements, A.C.A.; Wangdi, K. Forest cover and climate as potential drivers for dengue fever in Sumatra andKalimantan 2006–2016: A spatiotemporal analysis. Trop. Med. Int. Health 2019, 24, 888–898. [CrossRef]
69. Hurni, K.; Fox, J. The expansion of tree-based boom crops in mainland Southeast Asia: 2001 to 2014. J. Land Use Sci. 2018, 13,198–219. [CrossRef]
70. Ramachandran, V.G.; Roy, P.; Das, S.; Mogha, N.S.; Bansal, A.K. Empirical model for estimating dengue incidence usingtemperature, rainfall, and relative humidity: A 19-year retrospective analysis in East Delhi. Epidemiol. Health 2016, 38, e2016052.[CrossRef] [PubMed]
71. Jain, R.; Sontisirikit, S.; Iamsirithaworn, S.; Prendinger, H. Prediction of dengue outbreaks based on disease surveillance,meteorological and socio-economic data. BMC Infect. Dis. 2019, 19, 272. [CrossRef] [PubMed]
72. Raghwani, J.; Rambaut, A.; Holmes, E.C.; Hang, V.T.; Hien, T.T.; Farrar, J.; Wills, B.; Lennon, N.J.; Birren, B.W.; Henn, M.R.; et al.Endemic dengue associated with the co-circulation of multiple viral lineages and localized density-dependent transmission. PLoSPathog. 2011, 7, 1–10. [CrossRef] [PubMed]
73. Tosepu, R.; Tantrakarnapa, K.; Worakhunpiset, S.; Nakhapakorn, K. Climatic factors influencing dengue hemorrhagic fever inKolaka district, Indonesia. Environ. Nat. Resour. J. 2018, 16, 1–10. [CrossRef]
74. Wangdi, K.; Clements, A.C.A.; Du, T.; Nery, S.V. Spatial and temporal patterns of dengue infections in Timor-Leste, 2005–2013.Parasites Vectors 2018, 11, 1–9. [CrossRef]
75. Wongkoon, S.; Jaroensutasinee, M.; Jaroensutasinee, K. Climatic Variability and Dengue Virus Transmission in Chiang Rai,Thailand. Biomedica 2011, 27, 5.
76. Wongkoon, S.; Jaroensutasinee, M.; Jaroensutasinee, K. Spatio-temporal climate-based model of dengue infection in Southern,Thailand. Trop. Biomed. 2016, 33, 55–70. [PubMed]
77. Phanitchat, T.; Zhao, B.; Haque, U.; Pientong, C.; Ekalaksananan, T.; Aromseree, S.; Thaewnongiew, K.; Fustec, B.; Bangs, M.J.;Alexander, N.; et al. Spatial and temporal patterns of dengue incidence in northeastern Thailand 2006–2016. BMC Infect. Dis.2019, 19, 743. [CrossRef] [PubMed]
78. Rahman, M.S.; Ekalaksananan, T.; Zafar, S.; Poolphol, P.; Shipin, O.; Haque, U.; Paul, R.; Rocklöv, J.; Pientong, C.; Overgaard, H.J.Ecological, social and other environmental determinants of dengue vector abundance in urban and rural areas of NortheasternThailand. Int. J. Environ. Res. Public Health 2021, 18, 5971. [CrossRef]
79. The World Bank. Economic Assessment of Sanitation Interventions in Lao People’s Democratic Republic; The World Bank: Jakarta,Indonesia, 2012.
80. WHO. Thailand: Sanitation, Drinking-Water and Hygiene Status Overview; World Health Organization: Geneva, Switzerland, 2015.81. Bavia, L.; Melanda, F.N.; de Arruda, T.B.; Mosimann, A.L.P.; Silveira, G.F.; Aoki, M.N.; Kuczera, D.; Sarzi, M.L.; Junior, W.L.C.;
Conchon-Costa, I.; et al. Epidemiological study on dengue in southern Brazil under the perspective of climate and poverty. Sci.Rep. 2020, 10, 1–16. [CrossRef] [PubMed]
82. Pacific Bridge Medical Healthcare in Laos. Available online: https://www.pacificbridgemedical.com/publication/healthcare-in-laos/ (accessed on 14 July 2021).
83. WHO. Coordinated, intersectoral action to improve public health. In Advancing the Right to Health: The Vital Role of Law; WorldHealth Organization: Geneva, Switzerland, 2016; pp. 79–101.
84. Thailand Office of the Council of State. Constitution of the Kingdom of Thailand, Unofficial Translation, Thailand. 2007. Availableonline: http://www.ilo.org/wcmsp5/groups/public/@ed_protect/@protrav/@ilo_aids/documents/legaldocument/wcms_117898.pdf (accessed on 5 September 2021).