Developing densely: Estimating the effect of subway … · subway system and only directly...
14
http://jtlu.org . 4 . 2 [Summer 2011] pp. 19–32 doi: 10.5198/jtlu.v4i2.185 Developing densely Estimating the effect of subway growth on New York City land uses David King Columbia University a Abstract: In the early twentieth century, New York City’s population, developed land area, and subway network size all increased dramati- cally. e rapid expansion of the transit system and land development present intriguing questions as to whether land development led subway growth or if subway expansion was a precursor to real estate development. e research described in this article uses Granger causality models based on parcel-level data to explore the co-development of the subway system and residential and commercial land uses, and attempts to de- termine whether subway stations were a leading indicator of residential and commercial development or if subway station expansion followed residential and commercial construction. e results of this study suggest that the subway network developed in an orderly fashion and grew densest in areas where there was growth in commercial development. ere is no evidence that subway growth preceded residential devel- opment throughout the city. ese results suggest that subway stations opened in areas already well-served by the system and that network growth oen followed residential and commercial development. e subway network acted as an agent of decentralization away from lower Manhattan as routes and stations were sought in areas with established ridership demand. Keywords: Subways; land use; density; New York City; Granger causality 1 Introduction Transportation infrastructure provides access to locations. As infrastructure improves, access improves and land becomes desirable for development or redevelopment. Conversely, the development of urban areas contributes to the value of trans- portation systems. In this way, transportation infrastructure and land development are dependent on each other. Trans- portation infrastructure is designed and built to serve eco- nomic and social needs, and land development is dependent on access to transportation (and therefore on economic and social opportunities). In order to improve our understanding of the complex interdependence of transportation and land use, this research explores the development of New York City during the era of subway growth. e New York City subway system developed rapidly in the rst half of the twentieth century. Multiple private compa- nies competed for contracts to provide new transit service to the growing metropolis, creating a system of fast, affordable rail transit centered on lower Manhattan and extending into the outer boroughs. is paper uses historical data on subway construction and parcel-level land use to explore the relation- [email protected] ships between residential development, commercial develop- ment, and subway system expansion. e data are analyzed using Granger causality methods to estimate whether subway growth is a leading indicator of land development or if land development led subway expansion in the boroughs of Man- hattan, Brooklyn, ueens, and the Bronx in New York City during the twentieth century.Ʋ is research focuses on the interdependent development of the city’s subway network with residential and commercial land uses. Unlike many previous studies of urban growth, this research considers subway expansion as part of the land devel- opment process. In many cities, such as Los Angeles, streetcar systems were built by land developers who needed to provide access to new residential areas. New York was unique in that the transit systems dating to the early elevated rail lines were built by transit companies with no formal connection to the land development market. e subway system followed this model, under which the city assisted with construction but the costs of operations were recovered through fares. Ʋ Staten Island was omitted from this analysis because of its geographic isolation relative to the other boroughs. e island is not connected to the subway system and only directly accessible from Manhattan by ferry and from Brooklyn by the Verrazano-Narrows Bridge. Copyright 2011 David King. Licensed under the Creative Commons Attribution – NonCommercial License 3.0.
Transcript of Developing densely: Estimating the effect of subway … · subway system and only directly...

http://jtlu.org. 4 . 2 [Summer 2011] pp. 19–32 doi: 10.5198/jtlu.v4i2.185
Developing densely
Estimating the effect of subway growth on New York City land uses
David King
Columbia Universitya
Abstract: In the early twentieth century, New York City’s population, developed land area, and subway network size all increased dramati-cally. e rapid expansion of the transit system and land development present intriguing questions as to whether land development led subwaygrowth or if subway expansion was a precursor to real estate development. e research described in this article uses Granger causality modelsbased on parcel-level data to explore the co-development of the subway system and residential and commercial land uses, and attempts to de-termine whether subway stations were a leading indicator of residential and commercial development or if subway station expansion followedresidential and commercial construction. e results of this study suggest that the subway network developed in an orderly fashion and grewdensest in areas where there was growth in commercial development. ere is no evidence that subway growth preceded residential devel-opment throughout the city. ese results suggest that subway stations opened in areas already well-served by the system and that networkgrowth o en followed residential and commercial development. e subway network acted as an agent of decentralization away from lowerManhattan as routes and stations were sought in areas with established ridership demand.
Keywords: Subways; land use; density; New York City; Granger causality
1 Introduction
Transportation infrastructure provides access to locations. Asinfrastructure improves, access improves and land becomesdesirable for development or redevelopment. Conversely, thedevelopment of urban areas contributes to the value of trans-portation systems. In this way, transportation infrastructureand land development are dependent on each other. Trans-portation infrastructure is designed and built to serve eco-nomic and social needs, and land development is dependenton access to transportation (and therefore on economic andsocial opportunities). In order to improve our understandingof the complex interdependence of transportation and landuse, this research explores the development of New York Cityduring the era of subway growth.
eNewYorkCity subway systemdeveloped rapidly in therst half of the twentieth century. Multiple private compa-
nies competed for contracts to provide new transit service tothe growing metropolis, creating a system of fast, affordablerail transit centered on lower Manhattan and extending intothe outer boroughs. is paper uses historical data on subwayconstruction and parcel-level land use to explore the relation-
ships between residential development, commercial develop-ment, and subway system expansion. e data are analyzedusing Granger causality methods to estimate whether subwaygrowth is a leading indicator of land development or if landdevelopment led subway expansion in the boroughs of Man-hattan, Brooklyn, ueens, and the Bronx in New York Cityduring the twentieth century.
is research focuses on the interdependent developmentof the city’s subway network with residential and commercialland uses. Unlike many previous studies of urban growth, thisresearch considers subway expansion as part of the land devel-opment process. In many cities, such as Los Angeles, streetcarsystems were built by land developers who needed to provideaccess to new residential areas. New York was unique in thatthe transit systems dating to the early elevated rail lines werebuilt by transit companies with no formal connection to theland development market. e subway system followed thismodel, underwhich the city assistedwith constructionbut thecosts of operations were recovered through fares.
Staten Island was omitted from this analysis because of its geographicisolation relative to the other boroughs. e island is not connected to thesubway system and only directly accessible from Manhattan by ferry andfrom Brooklyn by the Verrazano-Narrows Bridge.
Copyright 2011 David King.Licensed under the Creative Commons Attribution – NonCommercial License 3.0.
.
In the rst decade of the twentieth century, much of NewYork City’s population was crowded into tenement districts,with 80 percent of the population living on 25 percent of thecity’s land area in 1910 (Jablonski 2006). e largest tenementdistricts were in lower Manhattan. City leaders sought newsubway service to help disperse the extremely high residentialdensities in lower Manhattan and to separate commercial de-velopment from residential areas, goals supported by the zon-ing code of 1916. However, the subway was built under par-tially competitive circumstances and much of the growth ofthe network occurred in areas where the subway already ex-isted rather than in undeveloped areas.
New York offers a valuable lesson in transportation andland use development. ree important factors that affectedthe spatial development of the city are highlighted in this ar-ticle. e rst is that three transit companies (consolidatedby the city in 1940) built the subways privately through pub-lic concessions with the aid of public nancing. e transitoperators were not land developers and relied solely on faresto pay their operating costs. Under these competitive condi-tions, transit companies sought pro table routes rather thanextensive coverage and reach into the outer boroughs. ishas implications for the co-development hypothesis, in thatcompanies seeking pro table routes are likely to follow exist-ing development rather than lead new development. e endresult is a dense network of transit that can support very highresidential and commercial densities.
e second factor is that zoning in New York City waslargely unrestricted outside of lower Manhattan between therst zoning code in 1916 and the rst comprehensive zoning
map in 1961. e 1916 code restricted the height and bulkof buildings throughout the city and restricted uses in someareas. For most of the city, developers and land speculatorswere able to build structures and uses that held the greatestvalue, and where zoning controls did prescribe speci c usesor densities, such as single-family residential, developers regu-larly requested and received variances inorder todevelopmoredensely (Revell 2002)
e third factor considered here is that the nature of in-dustry in New York was rapidly changing during the periodof subway growth. Offices were pushing blue-collar manu-facturing out of Manhattan and into the surrounding subur-ban areas of the outer boroughs (Harris 1993). Transit accesssupported thischange. omas Jablonski (2006, p. 6) explainsthis process: “In Manhattan, as land became more expensive,new office building developments grew denser and taller to
Tenement reform was addressed separately from the zoning code andfocused on building design, ensuring light and air to reach all units.
sustain pro tability. is necessitated more subways, increas-ing the land values of commercial development sites adjacentto the new subway stations.” Commercial displacement fromthe core, in which workers and business shi ed towards lessdeveloped (but not necessarily undeveloped) areas, was madepossible by the high quality of transit service provided by thesubways. ese three factors suggest novel insights into theeffects of transit network density on the intensity of land usedevelopment.
2 Hypotheses
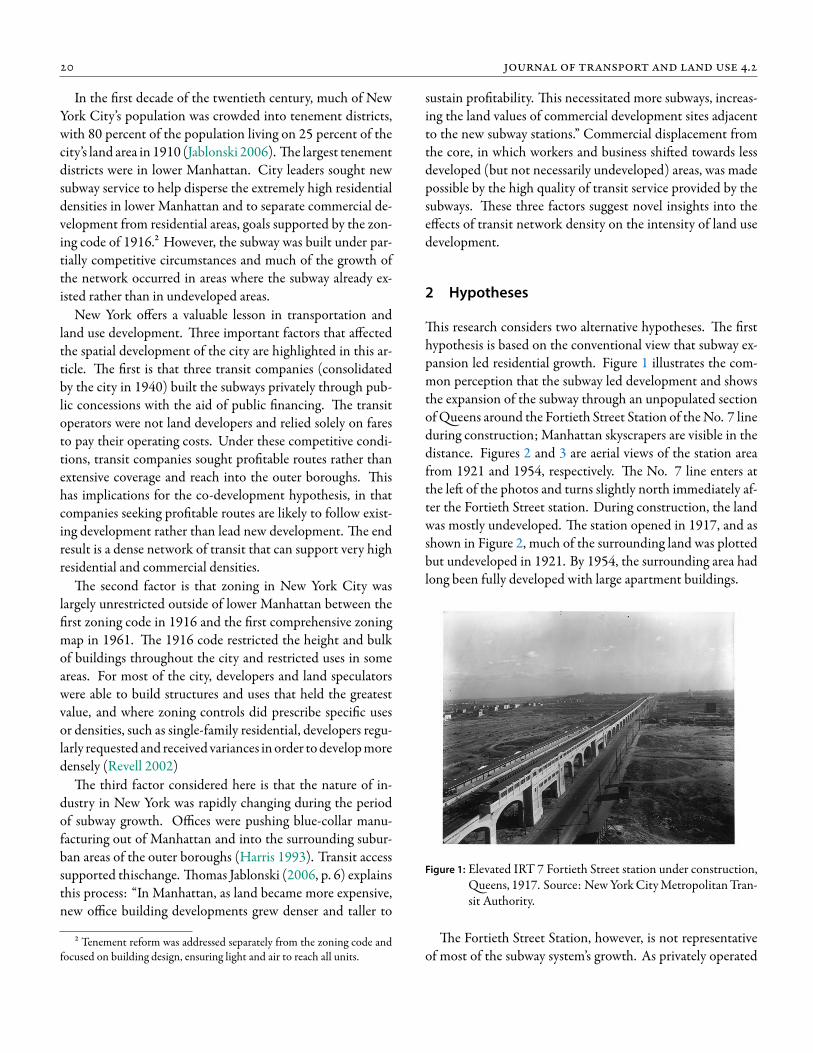
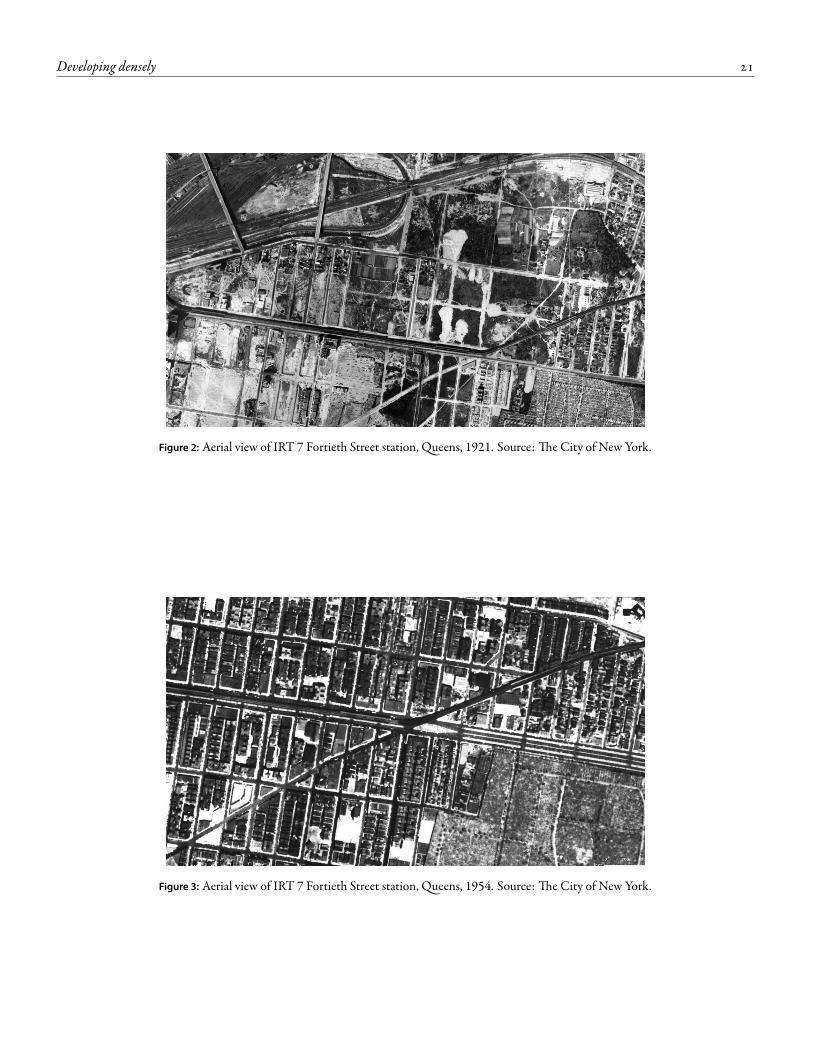
is research considers two alternative hypotheses. e rsthypothesis is based on the conventional view that subway ex-pansion led residential growth. Figure 1 illustrates the com-mon perception that the subway led development and showsthe expansion of the subway through an unpopulated sectionof ueens around the Fortieth Street Station of theNo. 7 lineduring construction; Manhattan skyscrapers are visible in thedistance. Figures 2 and 3 are aerial views of the station areafrom 1921 and 1954, respectively. e No. 7 line enters atthe le of the photos and turns slightly north immediately af-ter the Fortieth Street station. During construction, the landwas mostly undeveloped. e station opened in 1917, and asshown in Figure 2, much of the surrounding land was plottedbut undeveloped in 1921. By 1954, the surrounding area hadlong been fully developed with large apartment buildings.
Figure 1: Elevated IRT 7 Fortieth Street station under construction,ueens, 1917. Source: NewYorkCityMetropolitanTran-
sit Authority.
e Fortieth Street Station, however, is not representativeof most of the subway system’s growth. As privately operated
Developing densely
Figure 2: Aerial view of IRT 7 Fortieth Street station, ueens, 1921. Source: e City of New York.
Figure 3: Aerial view of IRT 7 Fortieth Street station, ueens, 1954. Source: e City of New York.
.
transit providers, the transit companies bid on the rights to de-velop routes they expected to be pro table. Competing com-panies sought routes where density was already relatively high,rather than routes in undeveloped areas. A new route thatextended far into the boroughs was riskier to develop than aroute with an established rider base. ese conditions madeit less likely that new subway construction always led land de-velopment, as transit operators preferred routes that would beimmediately pro table upon opening.
e second hypothesis tested is that land development ledsubway growth, as measured by station openings. New YorkCity already had a large population when the rst subway ser-vice was launched, and private operation of the transit linesreinforced the importance of building the network in areaswhere ridership and fare revenue would be high immediatelyuponopening. Unlike transit systemsbuilt by land speculatorswho invested in transit to provide access to undeveloped land,the New York system was built in an established and growingcity.
To test these hypotheses multiple methods are used. Cor-relation coefficients are calculated to examine the potentialconnections between subway growth and residential and com-mercial land development. Parcel-level data is then mergedwith subway station data and analyzed using Granger causal-ity methods in order to estimate how well the presence ofsubway stations predicts land development or, alternatively,whether land development is a better predictor of subwaygrowth. esemethods and data are described in detail below.
3 Background
Untangling the relationship between transportation and landuse is a major concern to planners, officials, and researchers.Historically, many American cities developed streetcar andrail transit systems in the late 1800s and early decades of the1900s. ese systems provided access to early suburbs for themiddle class. Most of these systems were operated privately,like the famous Red Line streetcars of Los Angeles. e sys-tems in Los Angeles, Philadelphia, Minneapolis, and Boston,among others, were promoted by real estate interests inter-ested in creating access to new land for residential develop-ment. In New York City, however, the subway system was op-erated as a transit business and there were no real estate hold-ings to offset capital costs. e new subway systemhad to gen-erate enough revenues through fare collection to pay for theservice.
For additional detail about early suburbanization in Philadelphia andBoston see (Jackson 1985; Warner 1968, 1978).
e primary mechanisms local governments have to con-trol land use are zoning, other regulatory measures, and -nancial incentives that are used to guide development (Frugand Barron 2008). ese are crude tools for integrating trans-portation and land use development. Looking historically athow cities have developed around privately built transit sys-tems in the absence of strong land use regulations providesreal-world examples of how developers value access. In areaswith high accessibility and land costs, developers maximizethe economic return from their land by building as denselyas possible. Such incentives limited the potential for the sub-way to “suburbanize” New York City as subway technologiesdispersed the population. New construction where the tran-sit network is most highly developed is a countervailing forcethat concentrates residents and businesses, though at a lowerintensity than had existed previously.
ere are multiple ways to think about how transporta-tion affects the built environment and vice versa. is pa-per is concerned with the intensity of development at the par-cel level near subway stations. A common refrain heard fromcontemporary transit advocates is that rail investment leadsto denser land development than would otherwise be the case(Calthorpe and Fulton 2001; Litman 2005). is is a difficultcausal relationship to model for a number of reasons. First,in order to densify, cities must have population and economicgrowth. If density increases near stations during a period of nogrowth, then decline will be evident in other areas. Increasedresidential and commercial densities re ect redistributive ef-forts, in which people and rms locate in closer proximity toeach other than they otherwise would.
Proponents of rapid transit in New York were primarilyconcerned with maintaining the economic vitality of the cityin the face of crushing residential and commercial buildingdensities. Residential densities exceeded 38000 persons persquare kilometer in parts of lower Manhattan during the earlyyears of the century, and Wall Street skyscrapers were plac-ing tremendous strain on the narrow streets below. Sidewalkswere shielded fromdaylight; crowds of peopleand horses, pro-duced severe congestion; and disease was rampant (DerrickandHistory ofNewYorkCity Project 2001). To address theseconcerns, the city enacted tenement reform legislation and thelandmark 1916 zoning code that limited building bulk, anduse. In these conditions, rapid transit was seen as a decentral-izing force that would lower densities and promote develop-ment elsewhere (New York Times 1922).
e role of transit in suburbanizing New York is quite dif-ferent than the expected urban transformations led by transitdevelopment in the twenty- rst century. By the time the bor-
Developing densely
oughs consolidated into one city in 1898, it was clear that theexisting transit system of elevated trains, horse-drawn streetcars, and electric trolleys was inadequate for dispersing thepopulation of lower Manhattan. ese early transit technolo-gies had encouraged some land speculation and developmenton the island as far north asHarlem, but business interests andpoliticians were adamant that the city needed faster transitservice in order to shi the pattern of development (Cheape1980).
By the late 1910s, public transit was competing with au-tomobiles for personal travel (Schrag 2000). Streetcar linesin the city were losing ridership to subways and automobiles.Automobile registrations in New York City jumped from justover 39000 in 1915 to more than 610000 in 1927 (Schrag2000). Although the subway system was expanding quicklyduring this period, the meteoric rise in auto registrations sug-gests that New York was not destined for a transit-orientedfuture and that there was potential for the outer boroughsto grow around the automobile. is future came to pass inmany areas, such as eastern ueens and Brooklyn, and cer-tainly, Staten Island. But the subways and their nickel fareswere viable competitors with the private automobile so longas development in the city supported transit use.
4 Subway history
In 1900, NewYorkCity had a large central business district inlower Manhattan and a smaller business district in downtownBrooklyn. ese districts were served by a network of elevatedtrains and surface rail built in the decades following the CivilWar, and most of the lines and services of these transit sys-tems were in Manhattan. ree elevated lines ran north fromSouth Ferry at the southern tip of theManhattan, and one rannorth from City Hall at the foot of the Brooklyn Bridge. Insome cases, these elevated lines were simply replaced by sub-way lines decades later: the line that ran north into the Bronxand terminated at Bronx Park (now home to the Bronx Zoo)was replaced by the No. 6 subway line. ere were very feweast-west lines crossingManhattan, andmuch of the island re-mained underserved by transit. ere was no service in Man-hattan north of 155th Street in Harlem (Derrick and His-tory of New York City Project 2001). A er a few decades ofoperation, the elevated lines declined in popularity and rid-ership and were increasingly criticized for ruining neighbor-hoods through noise, blocked sunlight, and other problems(Divall and Bond 2003). At the same time, most of the outerboroughs ( ueens, Staten Island, and the Bronx) were largelysemi-rural and underdeveloped, though Brooklyn did have an
established employment center and shipping related indus-tries.⁴ Civic leaders were eager to develop a mass transit sys-tem that promoted decentralization and encouraged develop-ment of the outer boroughs. In 1894, the New York state leg-islature authorized a new Rapid Transit Commission (RTC)charged with administering a new rail system for New YorkCity (Hood 1995).
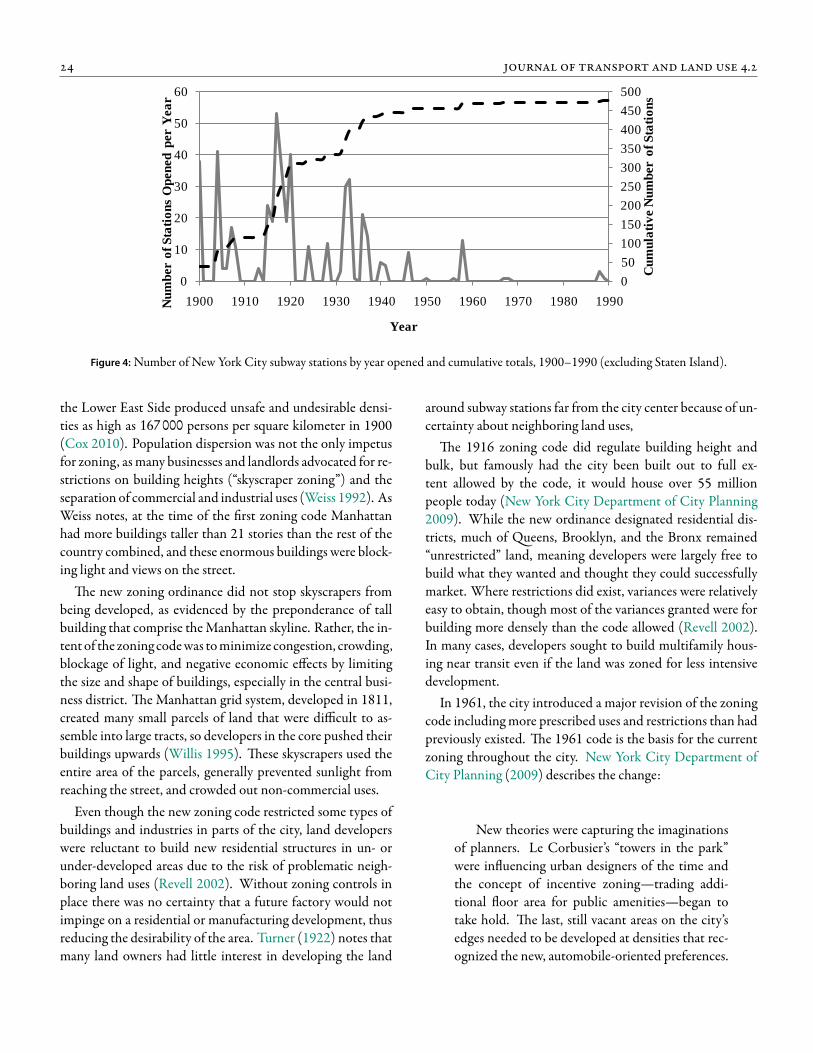
In 1903, the elevated rail system was transferred via a 99-year lease to the InterboroughRapidTransitCompany (IRT),whichwas contracted to build the rst subways in the city (Di-vall and Bond 2003). e New York subway officially openedin 1904 and grew rapidly in the years therea er. e ini-tial concessions were difficult to sell, though subway opera-tions were highly pro table once the systems opened (Lavis1915). According to a contemporary account, “the new lineswill be built underground in the more thickly populated sec-tions of Manhattan and Brooklyn and elevated in the outly-ing districts,” (Lavis 1915, p. 3). Figure 4 shows the numberof stations opened per year and the cumulative number of sta-tions. Stations that have been closed are not included in thesedata, though very few stations have been closed without be-ing replaced or consolidated with other nearby stations. ecurrent system has approximately 470 stations. e numberof stations does not grow consistently over time, in part be-cause stations along individual subway lines tend to open all atonce rather than sequentially. e rapid growth of the systemwas over by 1940, though quite a few stations have opened inthe years since. e last new station (in terms of new service,rather than serving as a replacement for a previously existingstation) opened in 1989. Currently, the T Line is under con-struction on the east side of Manhattan along Second Avenuebetween 125th Street to the north and irteenth Street tothe south; it is expected to open in 2017, but the project hasbeen plagued by cost and time overruns.
5 Zoning controls
Between the rst zoning code in 1916 and zoning reform in1961, the outer boroughs had limited zoning regulations. ezoning code regulated building bulk but did not restrict usesin most areas of the city outside of Manhattan and parts ofBrooklyn. In some ways, the New York zoning code was cre-ated in order to help disperse the concentrated developmentin lower Manhattan (Fischler 1998). Tenement housing on
⁴ e Brooklyn Bridge opened in 1883 and greatly improved access tolower Manhattan. e Brooklyn waterfront was also busy with shipbuild-ing. However, the eastern andnorthern sections of the boroughwere largelyundeveloped or agricultural.
.
0
50
100
150
200
250
300
350
400
450
500
0
10
20
30
40
50
60
1900 1910 1920 1930 1940 1950 1960 1970 1980 1990
Cu
mu
lati
ve N
um
ber o
f S
tati
on
s
Nu
mb
er o
f S
tati
on
s O
pen
ed
per Y
ea
r
Year
Figure 4: Number of New York City subway stations by year opened and cumulative totals, 1900–1990 (excluding Staten Island).
the Lower East Side produced unsafe and undesirable densi-ties as high as 167000 persons per square kilometer in 1900(Cox 2010). Population dispersion was not the only impetusfor zoning, asmany businesses and landlords advocated for re-strictions on building heights (“skyscraper zoning”) and theseparation of commercial and industrial uses (Weiss 1992). AsWeiss notes, at the time of the rst zoning code Manhattanhad more buildings taller than 21 stories than the rest of thecountry combined, and these enormous buildings were block-ing light and views on the street.
e new zoning ordinance did not stop skyscrapers frombeing developed, as evidenced by the preponderance of tallbuilding that comprise the Manhattan skyline. Rather, the in-tent of the zoning codewas tominimize congestion, crowding,blockage of light, and negative economic effects by limitingthe size and shape of buildings, especially in the central busi-ness district. e Manhattan grid system, developed in 1811,created many small parcels of land that were difficult to as-semble into large tracts, so developers in the core pushed theirbuildings upwards (Willis 1995). ese skyscrapers used theentire area of the parcels, generally prevented sunlight fromreaching the street, and crowded out non-commercial uses.
Even though the new zoning code restricted some types ofbuildings and industries in parts of the city, land developerswere reluctant to build new residential structures in un- orunder-developed areas due to the risk of problematic neigh-boring land uses (Revell 2002). Without zoning controls inplace there was no certainty that a future factory would notimpinge on a residential or manufacturing development, thusreducing the desirability of the area. Turner (1922) notes thatmany land owners had little interest in developing the land
around subway stations far from the city center because of un-certainty about neighboring land uses,
e 1916 zoning code did regulate building height andbulk, but famously had the city been built out to full ex-tent allowed by the code, it would house over 55 millionpeople today (New York City Department of City Planning2009). While the new ordinance designated residential dis-tricts, much of ueens, Brooklyn, and the Bronx remained“unrestricted” land, meaning developers were largely free tobuild what they wanted and thought they could successfullymarket. Where restrictions did exist, variances were relativelyeasy to obtain, though most of the variances granted were forbuilding more densely than the code allowed (Revell 2002).In many cases, developers sought to build multifamily hous-ing near transit even if the land was zoned for less intensivedevelopment.
In 1961, the city introduced a major revision of the zoningcode includingmore prescribed uses and restrictions than hadpreviously existed. e 1961 code is the basis for the currentzoning throughout the city. New York City Department ofCity Planning (2009) describes the change:
New theories were capturing the imaginationsof planners. Le Corbusier’s “towers in the park”were in uencing urban designers of the time andthe concept of incentive zoning—trading addi-tional oor area for public amenities—began totake hold. e last, still vacant areas on the city’sedges needed to be developed at densities that rec-ognized the new, automobile-oriented preferences.
Developing densely
And demands to make zoning approvals simpler,swi er and more comprehensible were a constant.
e new zoning code was the end of the line for transit sup-porting densities as a guiding factor for subway expansion.
6 Data andMethodology
e analysis presented here usesNewYorkCity Primary LandUse Tax Output (PLUTO) data for Manhattan, ueens,Brooklyn, and the Bronx, combined with datasets of subwaystations and lines. Staten Island was omitted from the analysisdue to geographic isolation from the transit system. PLUTOprovides parcel-level data that includes the square footage ofeach parcel, size of building area, year constructed, and squarefootage devoted to each use, among other information. edataset was developed by the New York City Department ofCity Planning. e subway dataset includes data on each sta-tion in the existing New York system in the four boroughsstudied. e year each station opened was determined, mak-ing it possible to estimate line effects and station effects.
e data presented organizational challenges. e parcel-level nature of the PLUTO dataset results in hundreds ofthousands of individual data points. While this level of dis-aggregation provides a wealth of detail, it is impractical andundesirable to estimate the co-development of transportationand landuse at such a small scale. In this analysis, the datawereaggregated to 2.6 km2 (one square mile) cells. Hawth’s Toolsin ArcGIS 9.3 were used to create a new shape le of grids tojoin the parcel data and subway data. Even though each gridpotential is larger than the 800-meter (roughly one-half-mile)radius around stations that is conventionally used for planningtransit-oriented land use, the grids allow for more robust sta-tistical analysis. e cells that did not have any subway stationswhen the system had reached its greatest extent were omittedfrom the analysis.
Lot densitieswere calculated usingPLUTOdata and aggre-gated by decade. In most of the study area, the original struc-tures are still in place, though a great number of them havebeen modi ed. e median age of buildings in the city is 70years. While these newer and larger buildings may introducesome bias into the data, they represent a very small componentof the total density calculation, and it is only the marginal in-crease in density that may have a distorting effect. is dimin-ishes the potential bias in the results.
7 Subway Growth
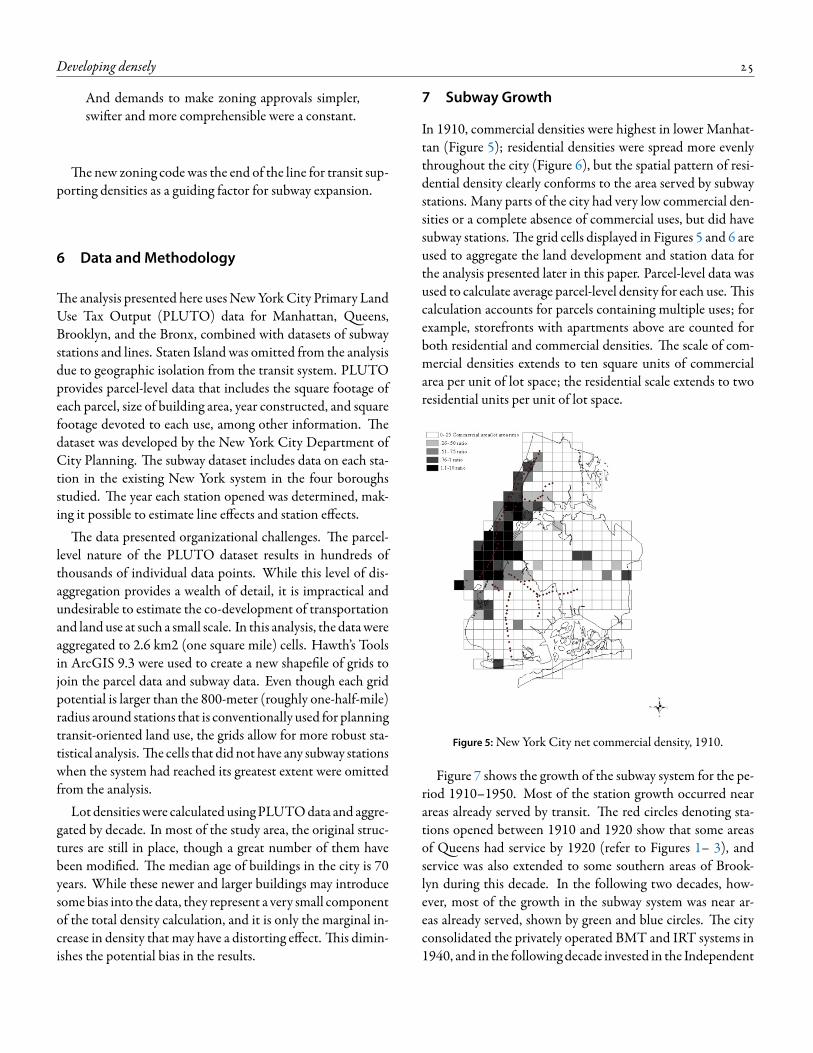
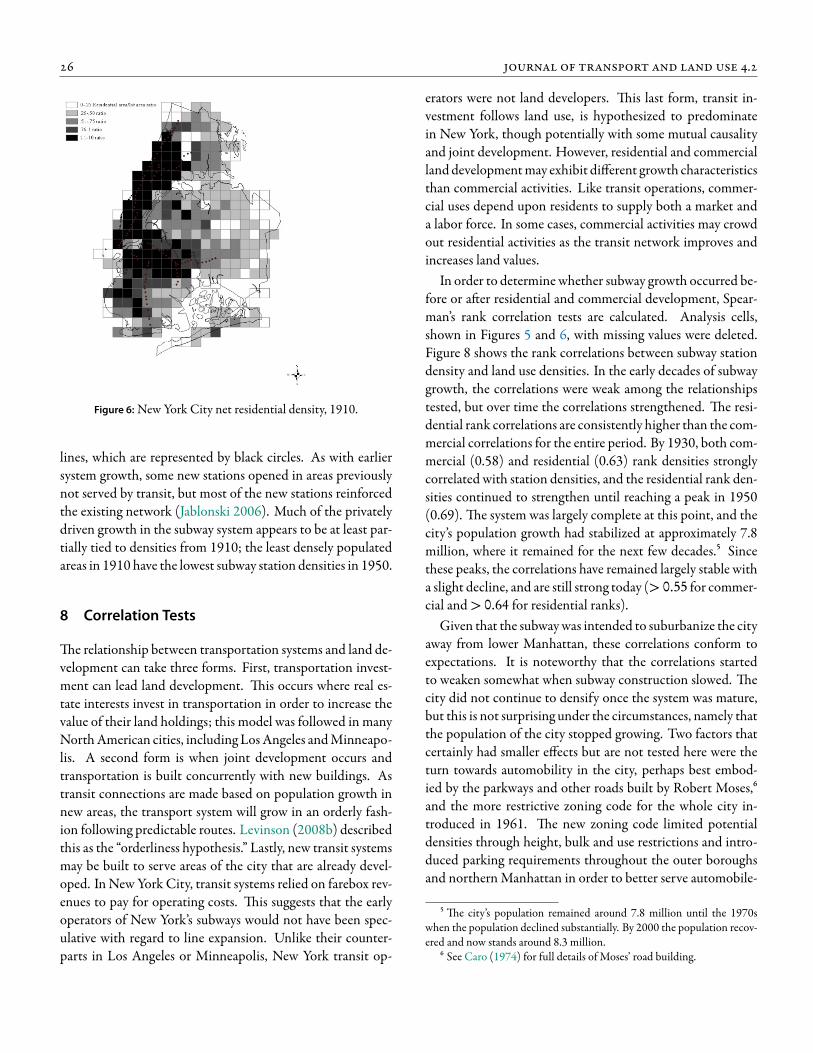
In 1910, commercial densities were highest in lower Manhat-tan (Figure 5); residential densities were spread more evenlythroughout the city (Figure 6), but the spatial pattern of resi-dential density clearly conforms to the area served by subwaystations. Many parts of the city had very low commercial den-sities or a complete absence of commercial uses, but did havesubway stations. e grid cells displayed in Figures 5 and 6 areused to aggregate the land development and station data forthe analysis presented later in this paper. Parcel-level data wasused to calculate average parcel-level density for each use. iscalculation accounts for parcels containing multiple uses; forexample, storefronts with apartments above are counted forboth residential and commercial densities. e scale of com-mercial densities extends to ten square units of commercialarea per unit of lot space; the residential scale extends to tworesidential units per unit of lot space.
Figure 5: New York City net commercial density, 1910.
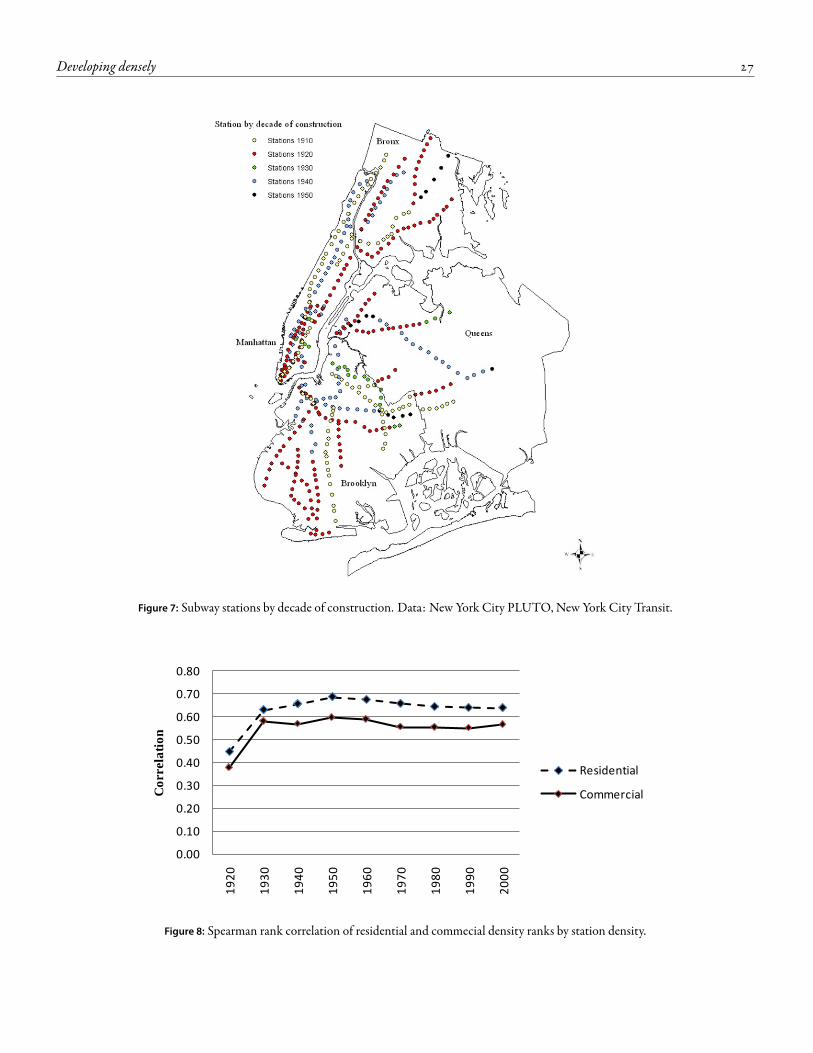
Figure 7 shows the growth of the subway system for the pe-riod 1910–1950. Most of the station growth occurred nearareas already served by transit. e red circles denoting sta-tions opened between 1910 and 1920 show that some areasof ueens had service by 1920 (refer to Figures 1– 3), andservice was also extended to some southern areas of Brook-lyn during this decade. In the following two decades, how-ever, most of the growth in the subway system was near ar-eas already served, shown by green and blue circles. e cityconsolidated the privately operated BMT and IRT systems in1940, and in the following decade invested in the Independent
.
Figure 6: New York City net residential density, 1910.
lines, which are represented by black circles. As with earliersystem growth, some new stations opened in areas previouslynot served by transit, but most of the new stations reinforcedthe existing network (Jablonski 2006). Much of the privatelydriven growth in the subway system appears to be at least par-tially tied to densities from 1910; the least densely populatedareas in 1910 have the lowest subway station densities in 1950.
8 Correlation Tests
e relationship between transportation systems and land de-velopment can take three forms. First, transportation invest-ment can lead land development. is occurs where real es-tate interests invest in transportation in order to increase thevalue of their land holdings; this model was followed in manyNorthAmerican cities, including LosAngeles andMinneapo-lis. A second form is when joint development occurs andtransportation is built concurrently with new buildings. Astransit connections are made based on population growth innew areas, the transport system will grow in an orderly fash-ion following predictable routes. Levinson (2008b) describedthis as the “orderliness hypothesis.” Lastly, new transit systemsmay be built to serve areas of the city that are already devel-oped. InNew York City, transit systems relied on farebox rev-enues to pay for operating costs. is suggests that the earlyoperators of New York’s subways would not have been spec-ulative with regard to line expansion. Unlike their counter-parts in Los Angeles or Minneapolis, New York transit op-
erators were not land developers. is last form, transit in-vestment follows land use, is hypothesized to predominatein New York, though potentially with some mutual causalityand joint development. However, residential and commercialland developmentmay exhibit different growth characteristicsthan commercial activities. Like transit operations, commer-cial uses depend upon residents to supply both a market anda labor force. In some cases, commercial activities may crowdout residential activities as the transit network improves andincreases land values.
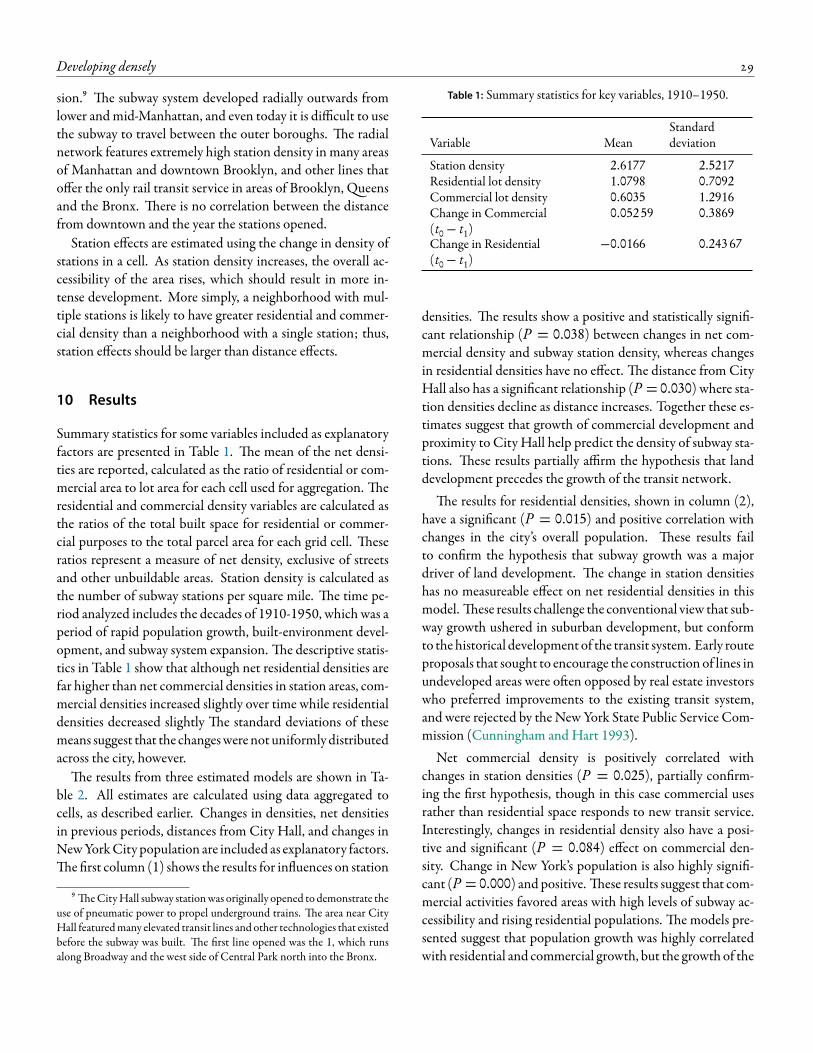
In order to determine whether subway growth occurred be-fore or a er residential and commercial development, Spear-man’s rank correlation tests are calculated. Analysis cells,shown in Figures 5 and 6, with missing values were deleted.Figure 8 shows the rank correlations between subway stationdensity and land use densities. In the early decades of subwaygrowth, the correlations were weak among the relationshipstested, but over time the correlations strengthened. e resi-dential rank correlations are consistently higher than the com-mercial correlations for the entire period. By 1930, both com-mercial (0.58) and residential (0.63) rank densities stronglycorrelated with station densities, and the residential rank den-sities continued to strengthen until reaching a peak in 1950(0.69). e system was largely complete at this point, and thecity’s population growth had stabilized at approximately 7.8million, where it remained for the next few decades.⁵ Sincethese peaks, the correlations have remained largely stable witha slight decline, and are still strong today (> 0.55 for commer-cial and> 0.64 for residential ranks).
Given that the subwaywas intended to suburbanize the cityaway from lower Manhattan, these correlations conform toexpectations. It is noteworthy that the correlations startedto weaken somewhat when subway construction slowed. ecity did not continue to densify once the system was mature,but this is not surprising under the circumstances, namely thatthe population of the city stopped growing. Two factors thatcertainly had smaller effects but are not tested here were theturn towards automobility in the city, perhaps best embod-ied by the parkways and other roads built by Robert Moses,⁶and the more restrictive zoning code for the whole city in-troduced in 1961. e new zoning code limited potentialdensities through height, bulk and use restrictions and intro-duced parking requirements throughout the outer boroughsand northern Manhattan in order to better serve automobile-
⁵ e city’s population remained around 7.8 million until the 1970swhen the population declined substantially. By 2000 the population recov-ered and now stands around 8.3 million.
⁶ See Caro (1974) for full details of Moses’ road building.
Developing densely
Figure 7: Subway stations by decade of construction. Data: New York City PLUTO, New York City Transit.
0.00
0.10
0.20
0.30
0.40
0.50
0.60
0.70
0.80
19
20
19
30
19
40
19
50
19
60
19
70
19
80
19
90
20
00
Correla
tion
Residential
Commercial
Figure 8: Spearman rank correlation of residential and commecial density ranks by station density.

.
oriented development. Parking requirements o en reduce thebuildable size of lots to levels below what is allowed (Shoup2005), and reduce the likelihood of achieving densities thatsupport transit.
e strong correlations between land use densities and sta-tions partially re ect the durability of the built environment.While subway stations are moved occasionally, there havebeen few closures since the 1940s when redundant stationswere shut down. ere are few areas of the city where subwayservice has declined since it was introduced, at least as mea-sured by access to the system.⁷ However, it should be notedthat these correlations are limited to the intensity of devel-opment and do not re ect actual population or employment.
is caveat does not diminish the usefulness of the data, butdoes limit the generalizable lessons.
9 Models
Granger causality models are used to estimate leading indica-tors of subway and land use development. Sets of time-seriesdata are compared to see if one set of variables Granger causesa change in another set, suggesting that one lagged variableat least partially predicts the present value of another. esemodels are based on the work of Clive Granger, who devel-oped these techniques for econometric modeling in order todetermine the direction of causality among related variables(Granger 1969). A limitation of these methods is that causal-ity is not explicitly tested; rather, the estimated coefficients de-scribe the strength of the relationship between variables acrosstime and help predict if certain phenomena are leading indi-cators of the dependent variable. e models do not test forcausality in the conventional sense, and the results should notbe interpreted as a statement of conventional causality. It ismore accurate to describe Granger causality as estimating thestrength of a relationship between the presence of one phe-nomenon and the subsequent measurement of another phe-nomenon.
In the case of this research, I compare the estimatedGranger causality of land use types and development den-sities on subway development, and of subway developmenton changes in land development. e data series are com-pared to see if land development preceded subway develop-ment, or if subway development preceded land development.Other transportation researchers have used similar methods
⁷ e most tragic loss of subway access is at the site of the World TradeCenter, which has not had a subway station since the terrorist attacks in2001. ere is a new transit complex slated to open in 2015 at the site.Other nearby subway stations on different lines serve the area.
to estimate the effect of road expansion on vehicle-miles trav-eled (Cervero and Hansen 2002; Fulton et al. 2000). Othershave looked at municipal competition (Binet 2003). Morerecently, scholars have applied these techniques to the co-evolution of transit and land development in Minneapolis-Saint Paul (Xie and Levinson 2009) and London (Levinson2008a).
e Granger causality models presented here are not in-tended to be fully predictive of development for New YorkCity. Intentionally le out of the models are factors that in-uence urban growth including population changes, employ-
ment, and industrial shi s; other transportation technologiessuch as cars and buses; and zoning regulations. While thesefactors are certainly important to a full understanding of NewYorkCity’s development during the twentieth century, it is as-sumed that exogenous aspatial factors are also in play. ismeans that growth and change occur across the region, andthere is no reason to expect that one area will have an advan-tage over others. Since transit development does improve ac-cessibility and increase the value of land, growth is to be ex-pected in areas where accessibility is high.
reemodels were estimated conventionally using the “cor-related panels corrected time series” (xtpcse) command inStata 11 with subway station density, residential net densityand commercial net density for the period 1910–1950 as thedependent variables. e explanatory variables in the modelsincluded lagged variables representing the changes in densityfor building uses and subway stations across the previous pe-riod. ese models estimate to what extent the change in sub-way growth and/or land development affect the dependentvariable. For instance, residential densities in 1930may have alarger impact on residential densities in 1940 thannew subwayconstruction between 1930 and 1940. Conversely, if the sub-way was built in response to residential demand, new subwayconstruction (and increased station densities) will be moredependent on residential densities from the previous periodthan on the presence (or absence) of stations in the previousperiod. e relationships tested here are used to determinewhich came rst—land use densities or subway construction.
e distance (in kilometers) fromCityHall of each grid cellcentroid is included as an explanatory variable under the as-sumption that the subway continued to grow outward to servepopulation growth.⁸ CityHall sits at the base of the BrooklynBridge and was the site of the rst subway station, making it asuitable proxy for the center of the city during subway expan-
⁸ e grid cells are shown in Figures 5 and 6.
Developing densely
sion.⁹ e subway system developed radially outwards fromlower and mid-Manhattan, and even today it is difficult to usethe subway to travel between the outer boroughs. e radialnetwork features extremely high station density in many areasof Manhattan and downtown Brooklyn, and other lines thatoffer the only rail transit service in areas of Brooklyn, ueensand the Bronx. ere is no correlation between the distancefrom downtown and the year the stations opened.
Station effects are estimated using the change in density ofstations in a cell. As station density increases, the overall ac-cessibility of the area rises, which should result in more in-tense development. More simply, a neighborhood with mul-tiple stations is likely to have greater residential and commer-cial density than a neighborhood with a single station; thus,station effects should be larger than distance effects.
10 Results
Summary statistics for some variables included as explanatoryfactors are presented in Table 1. e mean of the net densi-ties are reported, calculated as the ratio of residential or com-mercial area to lot area for each cell used for aggregation. eresidential and commercial density variables are calculated asthe ratios of the total built space for residential or commer-cial purposes to the total parcel area for each grid cell. eseratios represent a measure of net density, exclusive of streetsand other unbuildable areas. Station density is calculated asthe number of subway stations per square mile. e time pe-riod analyzed includes the decades of 1910-1950, which was aperiod of rapid population growth, built-environment devel-opment, and subway system expansion. e descriptive statis-tics in Table 1 show that although net residential densities arefar higher than net commercial densities in station areas, com-mercial densities increased slightly over time while residentialdensities decreased slightly e standard deviations of thesemeans suggest that the changeswerenot uniformlydistributedacross the city, however.
e results from three estimated models are shown in Ta-ble 2. All estimates are calculated using data aggregated tocells, as described earlier. Changes in densities, net densitiesin previous periods, distances from City Hall, and changes inNewYorkCity population are included as explanatory factors.
e rst column (1) shows the results for in uences on station
⁹ eCityHall subway stationwas originally opened to demonstrate theuse of pneumatic power to propel underground trains. e area near CityHall featuredmany elevated transit lines andother technologies that existedbefore the subway was built. e rst line opened was the 1, which runsalong Broadway and the west side of Central Park north into the Bronx.
Table 1: Summary statistics for key variables, 1910–1950.
Variable MeanStandarddeviation
Station density 2.6177 2.5217Residential lot density 1.0798 0.7092Commercial lot density 0.6035 1.2916Change in Commercial(t0− t1)
0.05259 0.3869
Change in Residential(t0− t1)
−0.0166 0.24367
densities. e results show a positive and statistically signi -cant relationship (P = 0.038) between changes in net com-mercial density and subway station density, whereas changesin residential densities have no effect. e distance from CityHall also has a signi cant relationship (P = 0.030) where sta-tion densities decline as distance increases. Together these es-timates suggest that growth of commercial development andproximity to City Hall help predict the density of subway sta-tions. ese results partially affirm the hypothesis that landdevelopment precedes the growth of the transit network.
e results for residential densities, shown in column (2),have a signi cant (P = 0.015) and positive correlation withchanges in the city’s overall population. ese results failto con rm the hypothesis that subway growth was a majordriver of land development. e change in station densitieshas no measureable effect on net residential densities in thismodel. ese results challenge the conventional view that sub-way growth ushered in suburban development, but conformto thehistorical development of the transit system. Early routeproposals that sought to encourage the construction of lines inundeveloped areas were o en opposed by real estate investorswho preferred improvements to the existing transit system,and were rejected by the New York State Public Service Com-mission (Cunningham and Hart 1993).
Net commercial density is positively correlated withchanges in station densities (P = 0.025), partially con rm-ing the rst hypothesis, though in this case commercial usesrather than residential space responds to new transit service.Interestingly, changes in residential density also have a posi-tive and signi cant (P = 0.084) effect on commercial den-sity. Change in New York’s population is also highly signi -cant (P = 0.000) and positive. ese results suggest that com-mercial activities favored areas with high levels of subway ac-cessibility and rising residential populations. e models pre-sented suggest that population growth was highly correlatedwith residential and commercial growth, but the growth of the

.
Table 2: Lagged estimators on station, residential and commercial densities, New York City 1910–1950 (std. errors in parentheses).
Dependent Variable
Station Density m, t(1)
Residential Density m, t(2)
Commercial Density m, t(3)
Change in station density (t0− t1) −0.0012 (−0.0129) 0.0594** (−0.0265)Change in net commercial density (t0− t1) 0.5981* (−0.2876) 0.0372 (−0.0304)Change in net residential density (t0− t1) −0.0643 (−0.2952) 0.0743* (−0.0429)Station density (t1) 0.9062*** (−0.1583)Residential density (t1) 0.9586*** (−0.0739)Commercial density (t1) 1.0326*** (−0.1076)Distance from City Hall (km) −0.0369* (−0.017) 0.0006 (−0.0048) −0.0045 (−0.0046)Change in city population (t0− t1) −0.0543 (−3.345) 0.7120** (−0.2932) 0.6889*** (−0.1803)Constant 1.3129* (−0.7759) −0.0814 (−0.1387) −0.0336 (−0.1217)r 2 0.76 0.87 0.91n 496 496 496* signi cant at 10 percent level**signi cant at 5 percent level***signi cant at 1 percent level
subway system was not signi cantly correlated with the city’sgrowth.
11 Conclusion
Two hypotheses about the development of New York City’stransit system along with residential and commercial densi-ties were tested. e rst hypothesis is that subway develop-ment preceded residential development throughout the city.While it is certain that subway construction preceded residen-tial development in some areas (Figure 1), analysis performedin this research does not con rm any correlation between sub-way growth and residential densities, suggesting that placeswhere the subway system was built rst were uncommon.
e second hypothesis tested is the converse of the rst,namely that land development was a leading indicator of sub-way growth. e analysis in this research suggests that thishypothesis is partially con rmed, but rather than residentialgrowth, it is commercial land use that is correlated with thedensity of subway stations. e conventional narrative of tran-sit development o en assumes that transit growth precededland development. is paper argues that the conventionalnarrative is incomplete in the context of New York City, andthat the growth of the subway system was partially dependenton land uses, and in particular that transit network growthlargely followed land development. is is especially true forcommercial land uses, the growth of which is associated withthe increasing density of subway stations. While residentialdensities were not found to be signi cantly correlated with
subway growth, they were found to be positively associatedwith commercial densities.
Two additional issues may have affected subway networkgrowth and land development. First, the subway system waslargely completed in the absence of substantial competitionfrom automobiles. In fact, because of the underground andelevated characteristics of the New York system, the trains didnot compete for road space with automobiles, as was the casein Los Angeles and in most other streetcar cities. Private au-tomobile ownership did ourish in New York, but not at theexpense of rapid rail transit. Second, land development wasloosely regulated through the zoning code inmost parts of thecity. Developers were largely able to pursue speculative activi-ties and could relatively easily receive variances to build moredensely or more intensively than allowed under law in areaswhere they saw demand. is allowed developers to pursuecommercial activities in areas where they perceived demand.
One generalizable implication from this research is thattransportation networks are in uenced by developed land.While transportation improvements increase the value of landby enhancing accessibility, under the right circumstances ex-isting land development enhances the value of transportationinvestments. In New York, the subway was built partly as aresponse to existing demand, and the result is a dense subwaynetwork that continues to be a symbol of the city.
Developing densely
About the author
David King ([email protected]) is Assistant Professorof Urban Planning in the Graduate School of Architecture,Planning andPreservation atColumbiaUniversity,NewYork.
References
Binet, M.-E. 2003. Testing for scal competition amongFrench municipalities: Granger causality evidence in adynamic panel data model. Papers in Regional Science,82(2):277–289. doi: 10.1007/s101100200143.
Calthorpe, P. and W. B. Fulton. 2001. e Regional City:Planning for the End of Sprawl. Washington: Island Press.ISBN 1559637838.
Caro, R. A. 1974. e power broker: Robert Moses and thefall of New York, volume 1. New York: Knopf. ISBN0394480767.
Cervero, R. and M. Hansen. 2002. Induced travel de-mand and induced road investment: A simultaneous equa-tion analysis. Journal of Transport Economics and Policy,36(3):469–490. ISSN 00225258. URL http://www.jstor.org/stable/20053915.
Cheape, C. W. 1980. Mo ing the Masses: Urban Public Tran-sit inNewYork, Boston, andPhiladelphia, 1880–1912. Har-vard studies in business history. Cambridge, MA: HarvardUniversity Press. ISBN 0674588274.
Cox, W. 2010. New York (Manhattan) wards: Pop-ulation & density 1800–1910, U.S. census data.http://www.demographia.com/db-nyc-ward1800.htm.URL http://www.demographia.com/db-nyc-ward1800.htm.
Cunningham, J. and L.D.Hart. 1993. History of theNewYorkSubway System: Revised Edition. New York: John Schmidt,Robert Giglio and Katherine Lang. 3.
Derrick, P. andHistory ofNewYorkCity Project. 2001. Tun-neling to the Future: e Story of the Great Subway Expan-sion that Saved New York. New York: New York UniversityPress. ISBN 0814719104.
Divall, C. and W. Bond. 2003. Suburbanizing the Masses:Public Transport and Urban Development in Historical Per-spective. Aldershot,Hants, England ; Burlington, VT,USA:Ashgate. ISBN 0754607755.
Fischler, R. 1998. e metropolitan dimension of early zon-ing: Revisiting the 1916 New York ordinance. Journal ofthe American Planning Association, 64(2):170–189.
Frug, G. E. and D. J. Barron. 2008. City Bound: How StatesSti e Urban Inno ation. Ithaca: Cornell University Press.
ISBN 9780801445149.Fulton, L., R.Noland, D.Meszler, and J. omas. 2000. A sta-
tistical analysis of induced travel effects inUSMid-Atlanticregion. Journal of Transportation and Statistics, 3(1):1–14.
Granger, C. W. J. 1969. Investigating causal relations byeconometric models and cross-spectral methods. Econo-metrica, 37(3):424–438. ISSN 00129682. URL http://www.jstor.org/stable/1912791.
Harris, R. 1993. Industry and residence: e decentraliza-tion of New York City, 1900–1940. Journal of Histori-cal Geography, 19(2):169–190. ISSN 0305-7488. doi:10.1006/jhge.1993.1012.
Hood, C. 1995. 722 Miles: e Building of the Subways andHow they Transformed New York. Johns Hopkins paper-backs. Baltimore: Johns Hopkins University Press. ISBN0801852447.
Jablonski, T. R. 2006. New York City’s subway century. TRNews, 242.
Jackson, K. T. 1985. Crabgrass Frontier: e Suburbanizationof the United States. New York: Oxford University Press.ISBN 0195036107.
Lavis, F. 1915. Building the New Rapid Transit System of NewYork City: AnHistorical Reprint of the Engineering Accountsin Building theDual Contract Lines for the City of NewYork.Belleville: Xplorer Press.
Levinson, D. 2008a. Density and dispersion: e co-development of land use and rail in London. Journal of Eco-nomic Geography, 8(1):55–78.
Levinson, D. 2008b. e orderliness hypothesis: e correla-tion of rail and housing development in London. e Jour-nal of Transport History, 29(1):98–114.
Litman, T. 2005. Efficient vehicles versus efficient transporta-tion. URL http://www.vtpi.org/cafe.pdf.
New York City Department of City Planning. 2009. AboutNew York City zoning. URL http://www.nyc.gov/html/dcp/html/zone/zonehis.shtml.
New York Times. 1922. Population density reduced by sub-way. May 1, 1922.
Revell, K. D. 2002. Building Gotham: Civic Culture andPublic Policy in New York City, 1898–1938. Baltimore,MD; London: Johns Hopkins University Press. ISBN0801870739.
Schrag, Z. M. 2000. ” e bus is young and honest”: Trans-portation politics, technical choice, and the motorizationof Manhattan surface transit, 1919–1936. Technology andCulture, 41:51–79. doi: 10.1353/tech.2000.0033.
Shoup, D. C. 2005. e High Cost of Free Parking. Chicago:Planners Press, American Planning Association. ISBN

.
1884829988.Turner, D. 1922. How can the New York transit problem be
solved? Electric Rail way Journal, 59(7):281–284.Warner, S. B. 1968. e Private City: Philadelphia in reePeriods of Its Growth. Philadelphia,: University of Pennsyl-vania Press.
Warner, S. B. 1978. Streetcar Suburbs: e Process of Growth inBoston, 1870–1900. Cambridge, MA: Harvard UniversityPress, 2 edition.
Weiss, M. A. 1992. Skyscraper zoning: New York’s pi-oneering role. Journal of the American Planning As-sociation, 58(2):201 – 212. ISSN 0194-4363. doi:10.1080/01944369208975794.
Willis, C. 1995. Form Follows Finance: Skyscrapers and Sky-lines inNewYork andChicago, volume1. NewYork: Prince-ton Architectural Press. ISBN 1568980442.
Xie, F. and D. Levinson. 2009. How streetcars shaped sub-urbanization: A Granger causality analysis of land use andtransit in the Twin Cities. Journal of Economic Geography,pp. 453–470. doi: 10.1093/jeg/lbp031.