Deutsche Bank Global Consumer Conference - …s1.q4cdn.com/122517005/files/doc_presentations/... ·...
43
live. learn. work. play. Deutsche Bank Global Consumer Conference June 15, 2017 Michael B. Polk - Chief Executive Officer
Transcript of Deutsche Bank Global Consumer Conference - …s1.q4cdn.com/122517005/files/doc_presentations/... ·...

1live. learn. work. play.
Deutsche Bank Global Consumer Conference
June 15, 2017
Michael B. Polk - Chief Executive Officer
2
Forward-looking statements in this presentation are made in reliance upon the safe harbor provisions of the Private Securities Litigation Reform Act of 1995. Such forward-looking statements may relate to, but are not limited to, information or assumptions about the effects of sales (including pricing), income/(loss), earnings per share, return on equity, return on invested capital, operating income, operating margin or gross margin improvements or declines, Project Renewal, capital and other expenditures, working capital, cash flow, dividends, capital structure, debt to capitalization ratios, debt ratings, availability of financing, interest rates, restructuring and other project costs, impairment and other charges, potential losses on divestitures, impacts of changes in accounting standards, pending legal proceedings and claims (including environmental matters), future economic performance, costs and cost savings, inflation or deflation with respect to raw materials and sourced products, productivity and streamlining, synergies, changes in foreign exchange rates, product recalls, expected benefits, synergies and financial results from recently completed acquisitions and planned acquisitions and divestitures, and management’s plans, goals and objectives for future operations, performance and growth or the assumptions relating to any of the forward-looking statements. These statements generally are accompanied by words such as “intend,” “anticipate,” “believe,” “estimate,” “project,” “target,” “plan,” “expect,” “will,” “should,” “would” or similar statements. The Company cautions that forward-looking statements are not guarantees because there are inherent difficulties in predicting future results. Actual results could differ materially from those expressed or implied in the forward-looking statements. Important factors that could cause actual results to differ materially from those suggested by the forward-looking statements include, but are not limited to, the Company’s dependence on the strength of retail, commercial and industrial sectors of the economy in light of the continuation of challenging economic conditions, particularly outside of the United States; competition with other manufacturers and distributors of consumer products; major retailers’ strong bargaining power and consolidation of the Company’s customers; the Company’s ability to improve productivity, reduce complexity and streamline operations; the Company’s ability to develop innovative new products and to develop, maintain and strengthen its end-user brands, including the ability to realize anticipated benefits of increased advertising and promotion spend; risks related to the substantial indebtedness that the Company incurred in connection with the Jarden Acquisition; risks related to a potential increase in interest rates; the Company’s ability to complete planned acquisitions and divestitures; difficulties integrating Jarden and other acquisitions and unexpected costs or expenses associated with acquisitions; changes in the prices of raw materials and sourced products and the Company’s ability to obtain raw materials and sourced products in a timely manner from suppliers; the risks inherent in the Company’s foreign operations, including currency fluctuations, exchange controls and pricing restrictions; a failure of one of the Company’s key information technology systems or related controls; future events that could adversely affect the value of the Company’s assets and require impairment chargers; United States and foreign regulatory impact on the Company’s operations including environmental remediation costs; the potential inability to attract, retain and motivate key employees; the imposition of tax liabilities greater than the Company’s provisions for such matters; product liability, product recalls or regulatory actions; the Company’s ability to protect its intellectual property rights; changes to the Company’s credit ratings; significant increases in the funding obligations related to the Company’s pension plans due to declining asset values, declining interest rates or otherwise; and those factors listed in our filings with the Securities and Exchange Commission (including the information set forth under the action “Risk Factors” in the Company’s most recently filed Annual Report on Form 10-K and Quarterly Report on Form 10-Q) . The information contained in this presentation is as of the date indicated. The Company assumes no obligation to update any forward-looking statements contained in this presentation as a result of new information or future events or developments. In addition, there can be no assurance that the Company has correctly identified and assessed all of the factors affecting the Company or that the publicly available and other information the Company receives with respect to these factors is complete or correct. This presentation contains non-GAAP financial measures within the meaning of Regulation G promulgated by the Securities and Exchange Commission and includes a reconciliation of these non-GAAP financial measures to the most directly comparable financial measures calculated in accordance with GAAP. While the Company believes that these non-GAAP financial measures are useful in evaluating the Company’s performance, this information should be considered as supplemental in nature and not as a substitute for or superior to the related financial information prepared in accordance with GAAP. Additionally, these non-GAAP financial measures may differ from similar measures presented by other companies.
Forward-looking Statements

3
Newell Brands vision
Newell Brands makes life better every day for hundreds of millions of consumers where they live, learn, work and play.

4
Leading portfolio of strong brands
5
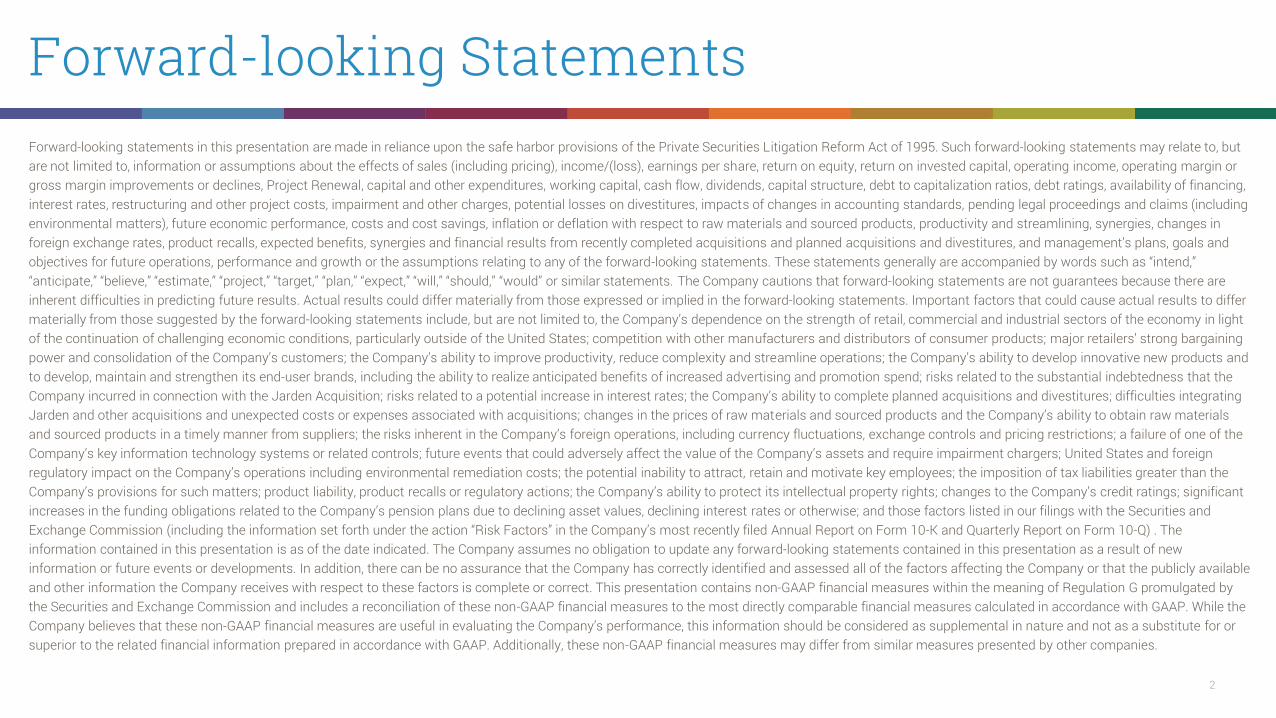
One company with one corporate strategy
Diversified, global branded consumer products company with sales of about
$15bnLeading brands in large, growing, unconsolidated
global categories
Scale and capabilities toout-spend and
out-grow competition
Margin and cash flow expansion underpinned by
consistent, competitive growth
Proven operating model delivering
above-market value creation
6
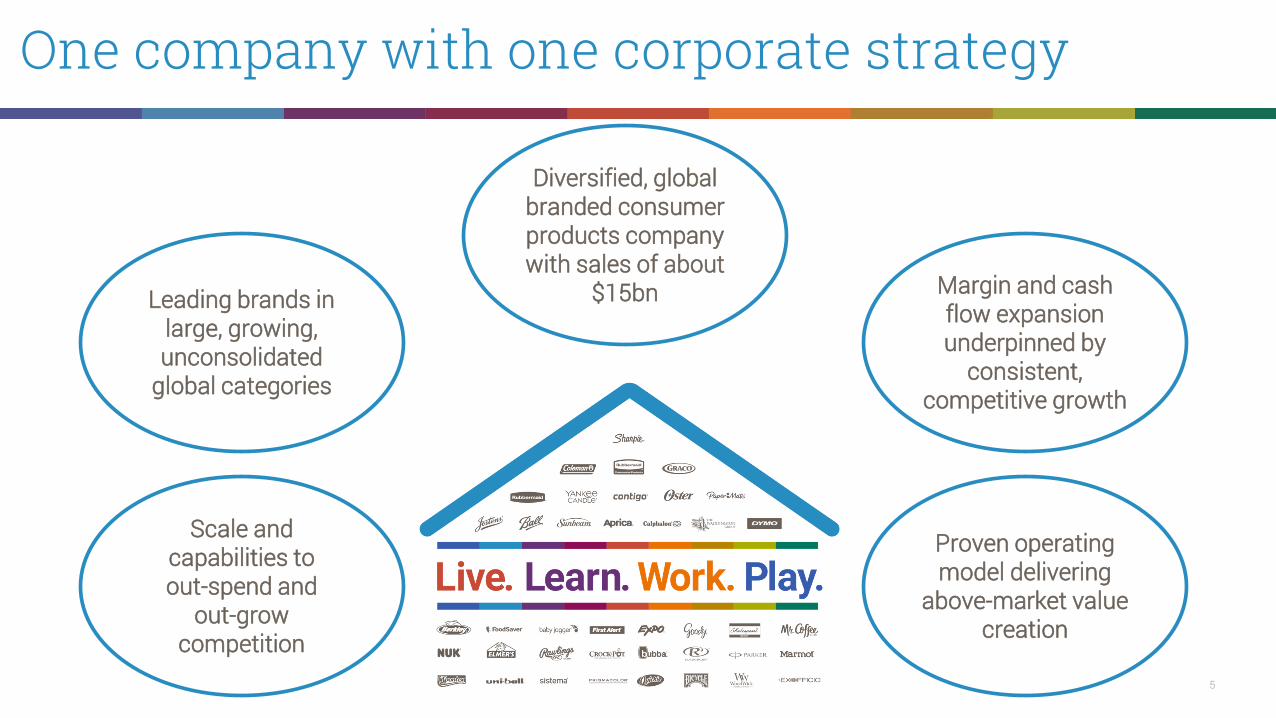
Robust fundamentals, unique opportunity
Brands that touch over
half a billion consumers
everyday
Large addressable categories of
~$100 billion in top 9 countries
Opportunity to expand into geographies
with categories of ~$50 billion
Advantaged capabilities and
scale tooutperform competition
$1.3 billion in savings
(2016 to 2021)
Consistent competitive growthImproving operating margin
Operating cash flow expansion

7
Leveraging a proven model
0.8%
8.0%
17.6%
25.1%
2011 2016
-5.5%
8.5%7.6%
13.3%
2011 2016
Core Sales Growth and Normalized Operating Income Margin
Writing Baby
Core sales growth Normalized operating margin
1.8%
3.7%
12.5%
15.6%
2011 2016
Newell Brands
Note: 2011 represents Newell Rubbermaid results; 2016 Newell Brands results; Newell Rubbermaid legacy core sales growth for 2016 was 4.7%.

8
And a track record of superior returns
25.8%
21.3%19.2%
Last 5 Years Last 3 Years Since Closing
Annualized Total Shareholder Returns
Peers 15.0% 13.6% 12.3%
S&P 500 12.9% 7.6% 14.5%Source: FactSet, data through 6/9/17; peers PG, CL. KMB, CLX, UL, RB, CHD

9
Yielding strong investment case
Leading brands that compete in large, growing, unconsolidated markets
Reapplying a proven model across a new broader portfolio
Scale and capabilities to outgrow, out-spend and out-execute the competition
$1.3 billion synergies and savings fuel investments and expand margins and cash
10%+ normalized EPS CAGR thru 2021; $2bn+ operating cash per annum by 2019
Strong capacity to complement organic agenda with M&A in the core
10
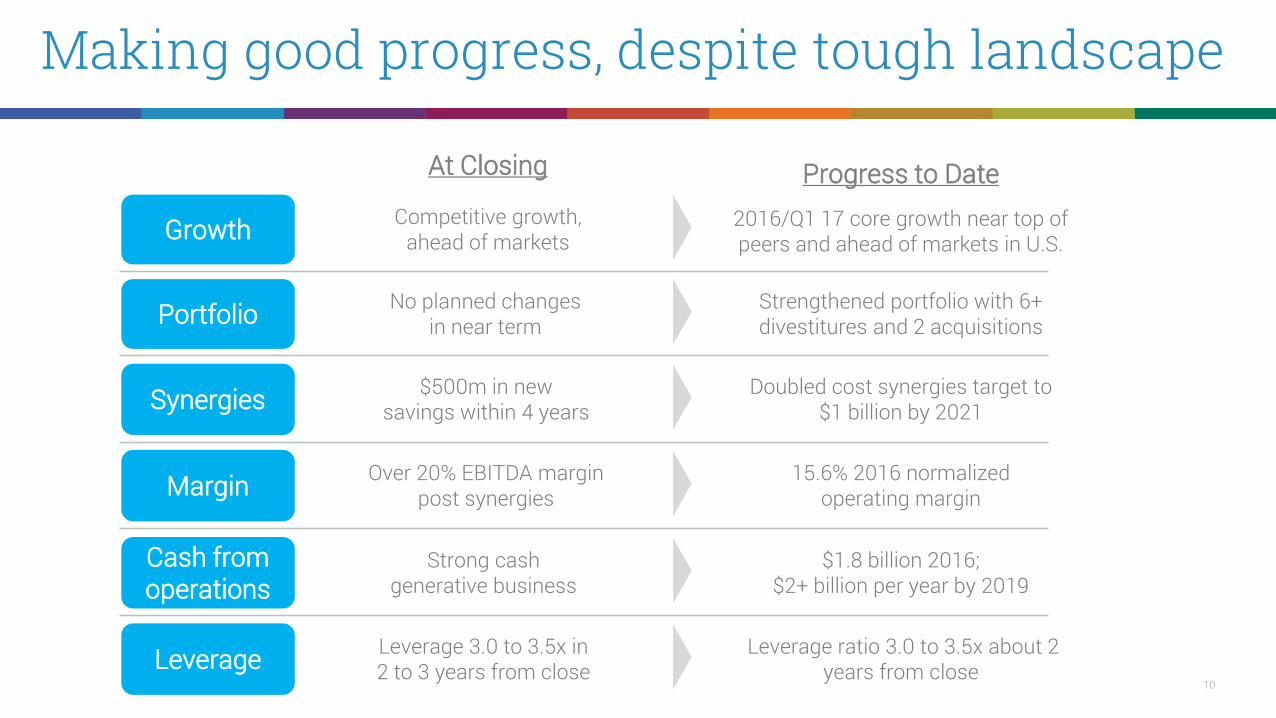
Making good progress, despite tough landscape
Portfolio
Synergies
Margin
Cash from operations
At Closing
No planned changesin near term
Growth Competitive growth,ahead of markets
$500m in new savings within 4 years
Over 20% EBITDA margin post synergies
Strong cash generative business
Leverage Leverage 3.0 to 3.5x in 2 to 3 years from close
Progress to Date2016/Q1 17 core growth near top of peers and ahead of markets in U.S.
Strengthened portfolio with 6+ divestitures and 2 acquisitions
Doubled cost synergies target to $1 billion by 2021
15.6% 2016 normalized operating margin
$1.8 billion 2016; $2+ billion per year by 2019
Leverage ratio 3.0 to 3.5x about 2 years from close
11
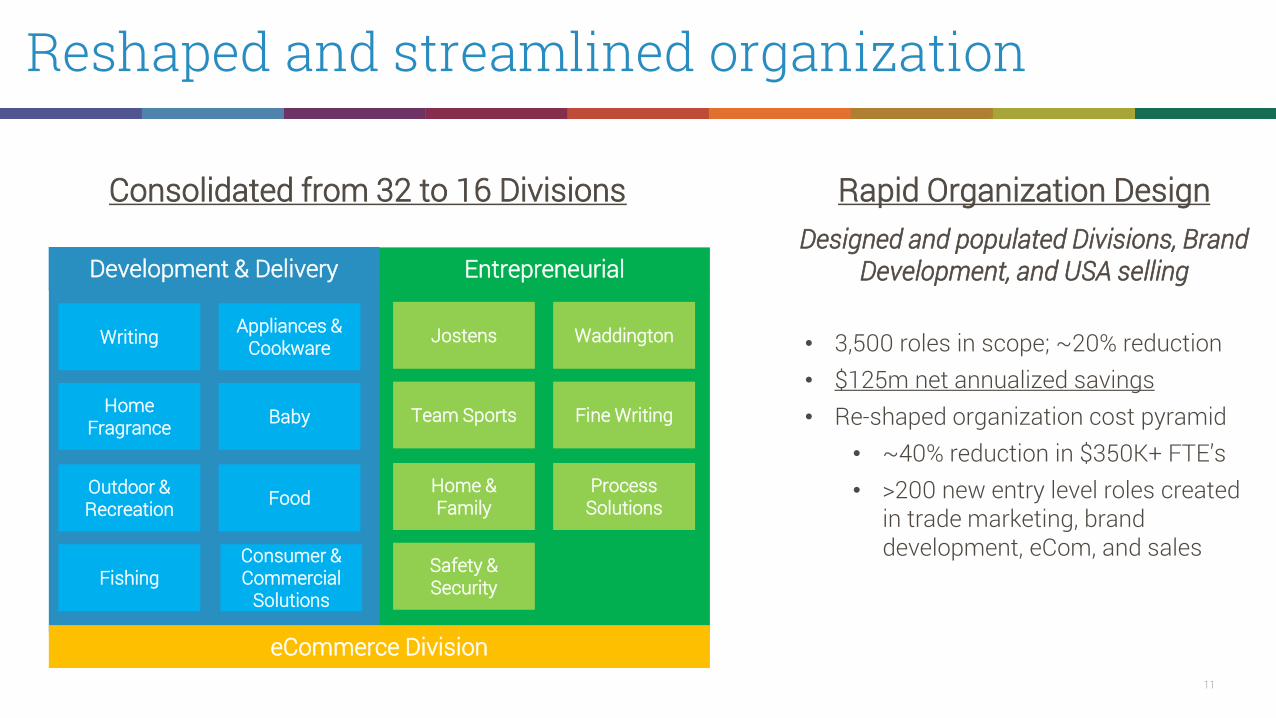
Reshaped and streamlined organization
Rapid Organization Design
• 3,500 roles in scope; ~20% reduction• $125m net annualized savings• Re-shaped organization cost pyramid
• ~40% reduction in $350K+ FTE’s• >200 new entry level roles created
in trade marketing, brand development, eCom, and sales
Consolidated from 32 to 16 DivisionsDesigned and populated Divisions, Brand
Development, and USA sellingDevelopment & Delivery Entrepreneurial
Writing Appliances & Cookware
Home Fragrance
Consumer & Commercial
Solutions
Baby
FoodOutdoor & Recreation
Fishing
Jostens Waddington
Team Sports Fine Writing
Process Solutions
Home & Family
Safety & Security
eCommerce Division

12
Aligned reporting to strategic pillars
Team Sports
Outdoor & RecreationConsumer & Commercial
Jostens
WritingAppliances & Cookware
Baby
Home Fragrance
Safety & Security
FishingFine WritingFood Waddington
13
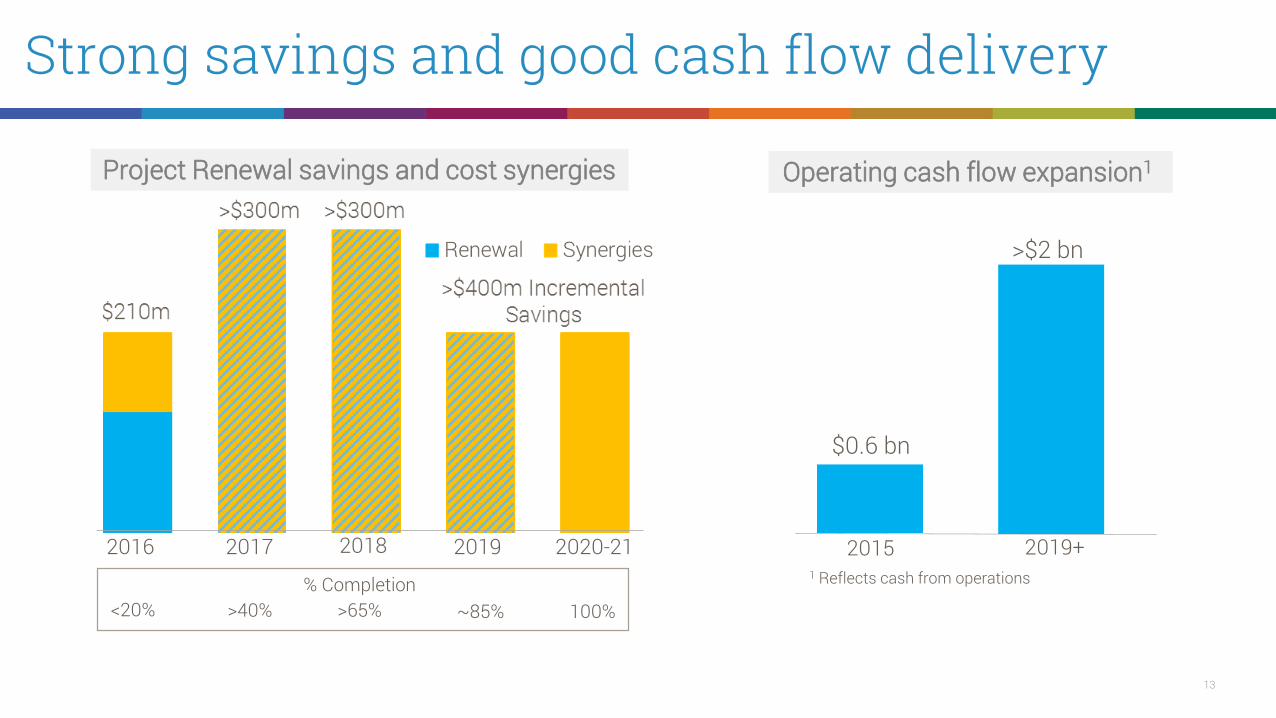
Strong savings and good cash flow delivery
2016 2017 2018 2019 2020-21
Project Renewal savings and cost synergies
% Completion<20% >40% >65% ~85% 100%
Operating cash flow expansion1
2015
$0.6 bn
$1.8 bn
1 Reflects cash from operations
>$2 bn
2019+

14
Investing to strengthen innovation funnel
Only charter+ projects includedExcludes divestures | D&D businesses only
2012 funnel2013+
<$1m
$1- 5m
$5 -10m
$10m and above
2016 funnel2017+
number of projects,annualized iRev
2015 funnel2016+
2014 funnel2015+
2013 funnel2014+
68
118
140
27
26
52
82
37
12
34
108
41
39
89
104
14
Innovation Funnel Composition – Number of Projects
8
8
64
207
Q1’17 funnel2017+
73
112
251
309
Now includes Jarden

15
New concept test results very promising
Concept tests YTD
570new concepts
95%cleared action
standard
77%high
relevance
45%high
differentiation
Legacy Jarden test results to date
16
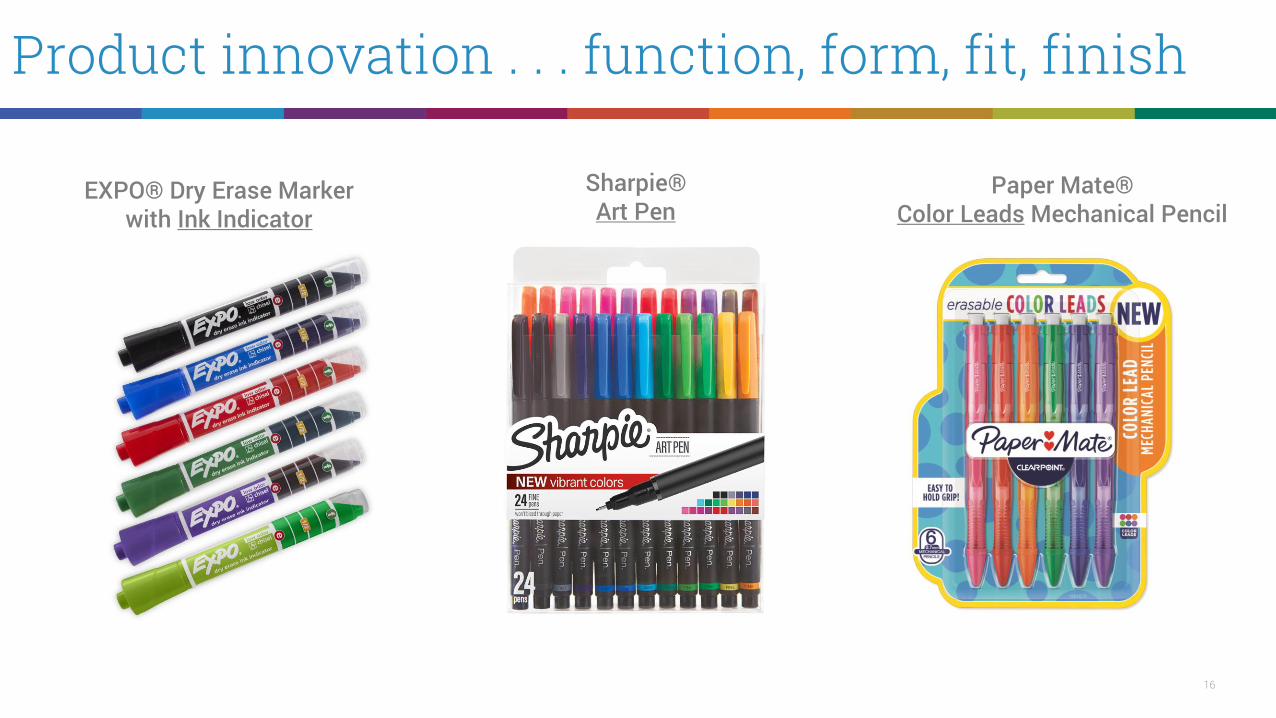
Product innovation . . . function, form, fit, finish
EXPO® Dry Erase Markerwith Ink Indicator
Paper Mate®Color Leads Mechanical Pencil
Sharpie® Art Pen

17
Marketing innovation. . . social listening
Elmer’s strong double-digit POS growth in the USA
18
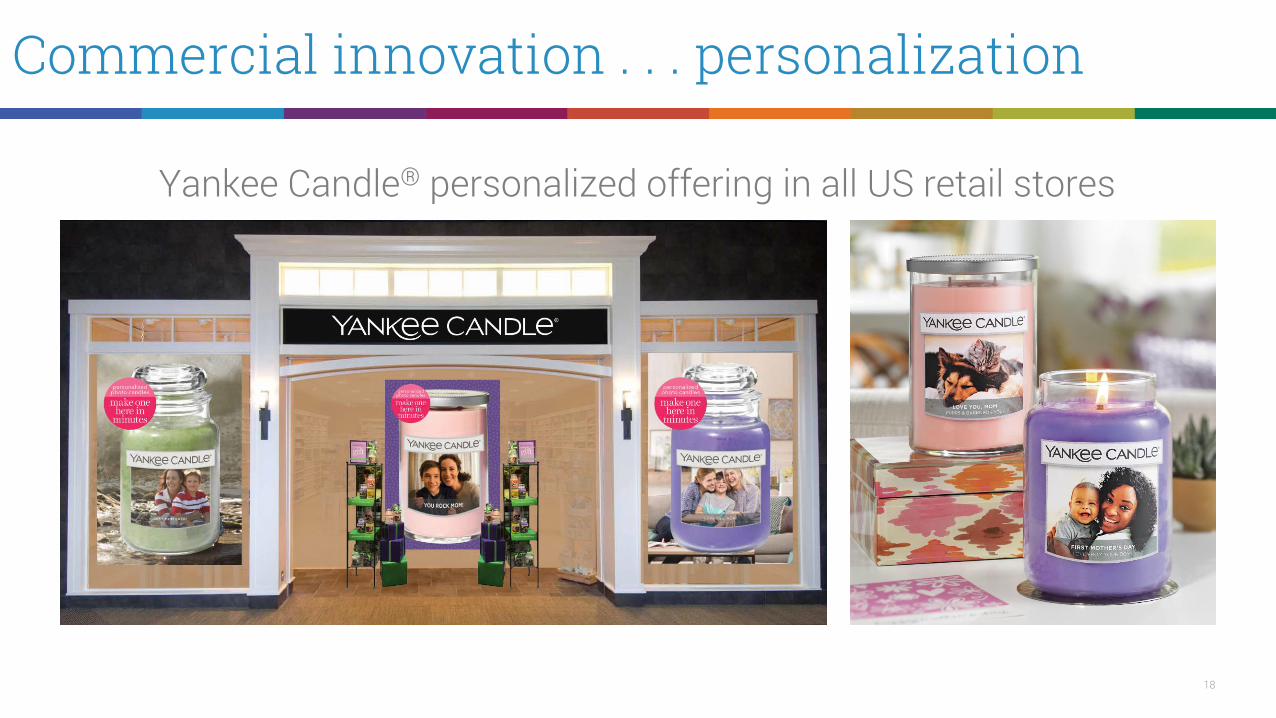
Commercial innovation . . . personalization
Yankee Candle® personalized offering in all US retail stores
19
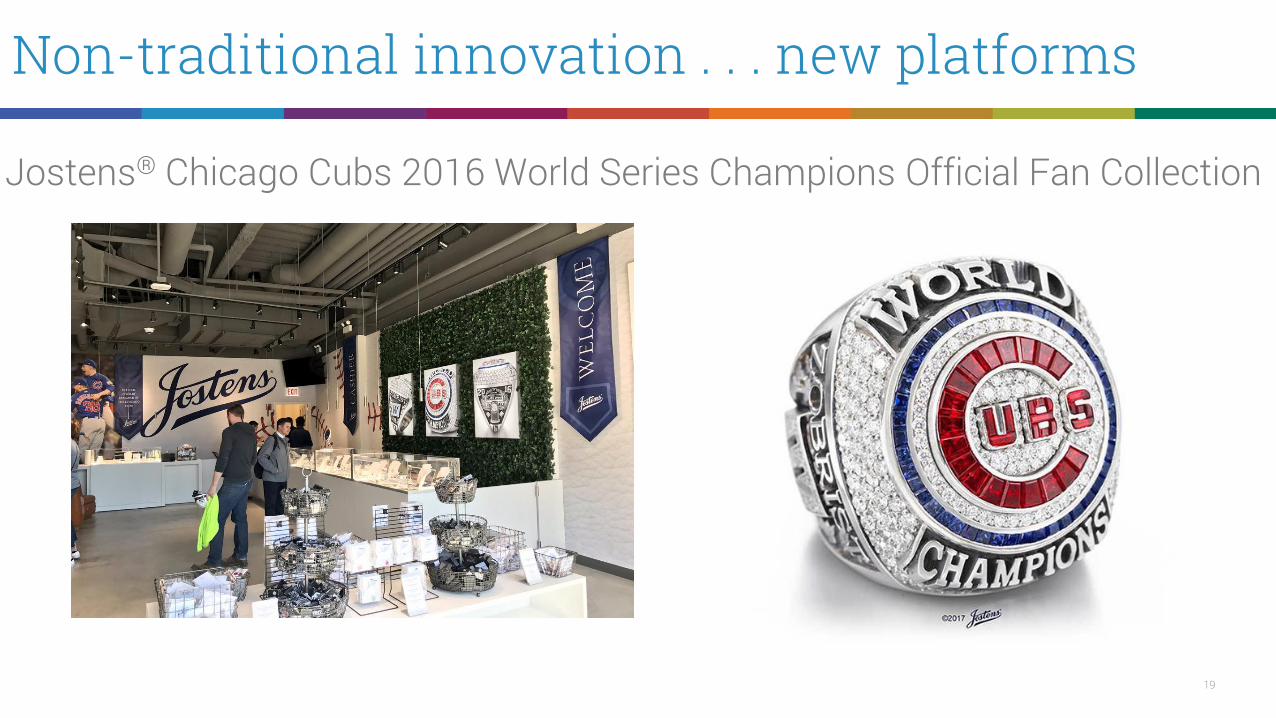
Non-traditional innovation . . . new platforms
Jostens® Chicago Cubs 2016 World Series Champions Official Fan Collection

20
Extending advantaged capability in eCommerce
Legacy Newell Rubbermaid Legacy Jarden2014 2015 2016
44% CAGR 35%
CAGR
Heritage eCom POS – leading retailer
Source: Newell Brands POS tracker based on customer transaction database; growth for e-tail portion of leading retailer POS 2014 to 2016; bar size represents actual POS value

21
Expect to deliver over 50% of total company growth

22
Competitive growth algorithm
Growth levers 2016 core sales growth relative to peers
Source: Public press releases of the respective companies. Please note data represents 2016 calendar results; coresales are calculated differently among the companies and may be referred to as a metric other than core sales. Insome cases the calculation methods used by the various companies may vary substantially from those used by theCompany. Therefore the presentation is not necessarily reflective of core sales growth as calculated on a consistentbasis among the companies identified above.
Brands & Innovation
International deployment
eCommerce
Entrepreneurial Opportunities
Core sales growth %

23
Creates very competitive results roadmap
2017 Full YR Guidance1 2018 to 20212
Core Sales Growth 2.5% to 4.0% 3.0% to 5.0%
Normalized EPS $3.00 to $3.20 double digit CAGR
Net Sales ($bn) $14.52 to $14.72 ~3.0% CAGR
1 Reflects outlook communicated in the May 8, 2017 Q1 2017 Earnings Release and Earnings Call. The Company has presented forward-looking statements regarding normalized earnings per share for 2017, which is a non-GAAP financial measure. This non–GAAP financial measure is derived by excluding certain amounts, expenses or income and/or certain impacts, including the impact of foreign exchange or business portfolio determinations, from the corresponding financial measure determined in accordancewith GAAP. The determination of the amounts that are excluded from this non-GAAP financial measure is a matter of management judgment and depends upon, among other factors, the nature of the underlying expense or income amounts recognized in agiven period. We are unable to present a quantitative reconciliation of the aforementioned forward-looking non-GAAP financial measure to its most directly comparable forward-looking GAAP financial measure because such information is not available andmanagement cannot reliably predict all of the necessary components of such GAAP measure without unreasonable effort or expense. The unavailable information could have a significant impact on the Company's full-year 2017 GAAP financial results.
2 2018 to 2021 outlook reflects no acquisitions or divestitures beyond those previously announced. The Company’s 2018 to 2021 outlook for core sales growth is a non-GAAP financial measure that is adjusted for items impacting comparability, including theeffect of foreign currency exchange rate fluctuations and acquisitions and divestitures. The Company is not able to reconcile this forward-looking non-GAAP financial measure to its most directly comparable forward-looking GAAP financial measure withoutunreasonable efforts because it is unable to predict with a reasonable degree of certainty the actual impact of changes in foreign currency exchange rates or the timing of acquisitions and divestitures throughout the relevant period. The unavailableinformation could have a significant impact on the Company’s 2018 -2021 GAAP financial results.

24
Cash flow and divestitures; rapid deleveraging
Expect to achieve leverage ratio target in about 2 years
2016/2017debt repayment
~$3.9 bn
2017 exitleverage ratio
~3.6x
2018+leverage ratio target
3.0 to 3.5x

25
Cash generation creates unique opportunity
Source: Newell Brands Financial Model 2017 through 2021; assumes no M&A beyond the divestitures and acquisitions already announced; dividend increased steadily to stated pay out ratio range of 30 to 35%; share repurchase from 2018 to 2021 to offset equity dilution associated with annual share grants; standalone debt capacity excludes incremental acquisition borrowing capacity associated with acquisition EBITDA and synergies calculated at 3.25x leverage ratio
Newell Brands2017 to 2019
Capital Allocation Priorities
Sustain 30 to 35% dividend pay out ratio
Capex for growth and productivity
M&A in our core categories
Capex ~$1.4bn
Dividends ~$1.5bn
2019 available cash and standalone debt capacity
@ 3.25x ~ $3bn
Debt repayment ~$2.6bn (~$1bn from divestiture proceeds)
Newell Brands2017 to 2021
Capex ~$2.4bn
Dividends ~$2.6bn
2021 available cash and standalone debt capacity
@ 3.25x ~$7.5bn
Debt repayment ~$4.0bn(leverage well below 3x to 3.5x target)
Share Repurchase ~$0.2bn Share Repurchase ~$0.5bn
Modest repurchase to manage equity dilution

26
Value creating M&A in our core categories
Base Year Year 1 Year 2 Year 3
Revenue
Base Year Year 1 Year 2 Year 3
Adjusted EBITDA+41%
Sales+69%AdjustedEBITDA
Note: Blend of actual and expected results built into latest 2017 guidance and 2017 through 2021 financial model. Information reconciling forward-looking, or Year 3, adjusted EBITDA to GAAP financial measures isunavailable to the Company without unreasonable effort. The unavailable information could have a significant impact on the Company’s GAAP financial results. The Company is not able to provide reconciliations ofadjusted EBITDA to GAAP financial measures because certain items required for such reconciliations are outside of the Company’s control and/or cannot be reasonably predicted, such as the provision for incometaxes. Preparation of such reconciliations would require a forward-looking balance sheet, statement of income and statement of cash flow, prepared in accordance with GAAP, and such forward-looking financialstatements are unavailable to the Company without unreasonable effort. The Company provides a combined target for its Year 3 adjusted EBITDA for the identified businesses that it believes will be achieved,however it cannot accurately predict all the components of the adjusted EBITDA calculation.

27
Expect newest additions to strengthen core

28
Solid 2016 delivery through change
Core sales growth +3.0% to +4.0% +3.7%
Normalized EPS $2.75 to $2.90 $2.89
Savings $150m to $180m $210m
Debt Repayment ~$2.4bn by 2018 ~$2.1bn1
1 Debt pay down since closing of the Jarden transaction.

29
Delivered competitive growth in Q1 2017
NA+1.4%
EMEA+5.1%
LATAM+11.8%
APAC+4.0 %
Q1 growth rank
2.9 2.5 2.3
1.0 0.5 -
(1.0)
UL
NW
L
CHD PG CL RB
KMB
Q1 2017 Core Sales Growth Relative to Peers
Source: Public press releases of the respective companies. Core sales are calculated differently among the companies and may be referred to as a metric other than core sales. In some cases the calculationmethods used by the various companies may vary substantially from those used by the Company. Therefore the presentation is not necessarily reflective of core sales growth as calculated on a consistent basisamong the companies identified above.

30
Broad based across all regions
NA+1.4%
EMEA+5.1%
LATAM+11.8%
APAC+4.0 %

31
Reaffirm 2017 guidance, despite turbulence in U.S.
Net sales $14.52bn to $14.72bn
Net sales growth +9.5 to +11.0 percent
Core sales growth +2.5 to +4.0 percent
Normalized EPS $3.00 to $3.20
Reflects outlook communicated in the May 8, 2017 Q1 2017 Earnings Release and Earnings Call. The company has presented forward-looking statementsregarding normalized earnings per share for 2017, which is a non-GAAP financial measure. This non–GAAP financial measure is derived by excluding certainamounts, expenses or income from the corresponding financial measure determined in accordance with GAAP. The determination of the amounts that areexcluded from this non-GAAP financial measures is a matter of management judgment and depends upon, among other factors, the nature of the underlyingexpense or income amounts recognized in a given period. We are unable to present a quantitative reconciliation of the aforementioned forward-looking non-GAAP financial measure to its most directly comparable forward-looking GAAP financial measure because such information is not available and managementcannot reliably predict all of the necessary components of such GAAP measure without unreasonable effort or expense. The unavailable information couldhave a significant impact on the company's full year 2017 GAAP financial results.

32
Newell Brands investment case
Leading brands that compete in large, growing, unconsolidated markets
Reapplying a proven model across a new broader portfolio
Scale and capabilities to outgrow, out-spend and out-execute the competition
$1.3 billion synergies and savings fuel investments and expand margins and cash
10%+ normalized EPS CAGR thru 2021; $2bn+ operating cash per annum by 2019
Strong capacity to complement organic agenda with M&A in the core

33live. learn. work. play.
Deutsche Bank Global Consumer Conference
June 15, 2017
Michael B. Polk - Chief Executive Officer

34
FY 2011 Core Sales Growth ReconciliationNewell Brands Inc.
Non-GAAP ReconciliationCore Sales Growth for Legacy Newell Rubbermaid by Segment
Year Ended December 31, 2011
Net Sales
Growth
(GAAP)
Foreign
Currency
Core Sales
Growth
WRITING 3.2 % (2.4)% 0.8 %HOME SOLUTIONS 1.9 % (0.7)% 1.2 %TOOLS 13.4 % (3.1)% 10.3 %COMMERCIAL PRODUCTS 8.5 % (1.1)% 7.4 %BABY AND PARENTING (2.8)% (2.7)% (5.5)%SPECIALTY BUSINESS ─ (2.1)% (2.1)%
LEGACY NEWELL RUBBERMAID 3.6 % (1.8)% 1.8 %
The above amounts represent the amounts reported and have not been restated for any discontinued operations that occurred subsequent to the year ended December 31, 2011.
35
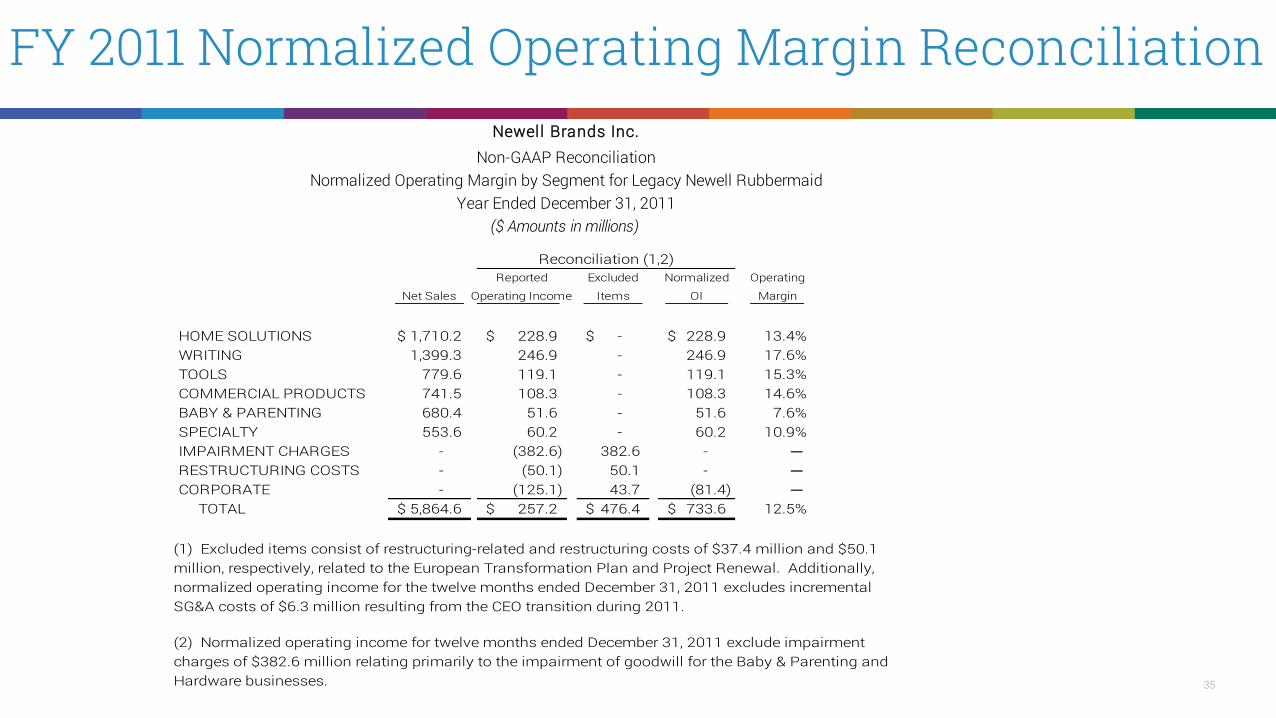
FY 2011 Normalized Operating Margin ReconciliationNewell Brands Inc.
Non-GAAP ReconciliationNormalized Operating Margin by Segment for Legacy Newell Rubbermaid
Year Ended December 31, 2011($ Amounts in millions)
Reported Excluded Normalized Operating
Net Sales Operating Income Items OI Margin
HOME SOLUTIONS 1,710.2$ 228.9$ -$ 228.9$ 13.4%WRITING 1,399.3 246.9 - 246.9 17.6%TOOLS 779.6 119.1 - 119.1 15.3%COMMERCIAL PRODUCTS 741.5 108.3 - 108.3 14.6%BABY & PARENTING 680.4 51.6 - 51.6 7.6%SPECIALTY 553.6 60.2 - 60.2 10.9%IMPAIRMENT CHARGES - (382.6) 382.6 - ─ RESTRUCTURING COSTS - (50.1) 50.1 - ─ CORPORATE - (125.1) 43.7 (81.4) ─ TOTAL 5,864.6$ 257.2$ 476.4$ 733.6$ 12.5%
(1) Excluded items consist of restructuring-related and restructuring costs of $37.4 million and $50.1 million, respectively, related to the European Transformation Plan and Project Renewal. Additionally, normalized operating income for the twelve months ended December 31, 2011 excludes incremental SG&A costs of $6.3 million resulting from the CEO transition during 2011.
(2) Normalized operating income for twelve months ended December 31, 2011 exclude impairment charges of $382.6 million relating primarily to the impairment of goodwill for the Baby & Parenting and Hardware businesses.
Reconciliation (1,2)

36
FY 2016 Core Sales Reconciliation For Newell Brands
Newell Brands Inc.Non-GAAP Reconciliation
Core Sales for Newell BrandsYears Ended December 31, 2015 and 2016
($ Amounts in millions)Increase/(Decrease)
2016 Net Sales
(Reported) (1) Acquisitions/
Divestitures (3) Net Sales
Base Business Currency Impact 2016
Core Sales (2)
2015 Net Sales
(Pro forma) (1) Divestitures
(3) Net Sales
Base Business Currency Impact 2015
Core Sales (2) Core Sales (2)
$ %
WRITING 1,941.9 (204.9) 1,737.0 32.9 1,769.9 1,763.5 (128.6) 1,634.9 4.2 1,639.1 130.8 8.0 %HOME SOLUTIONS 1,568.4 (181.6) 1,386.8 8.4 1,395.2 1,704.2 (344.7) 1,359.5 0.7 1,360.2 35.0 2.6 %TOOLS 760.7 (372.2) 388.5 8.4 396.9 790.0 (397.4) 392.6 3.6 396.2 0.7 0.2 %COMMERCIAL PRODUCTS 776.6 ─ 776.6 4.0 780.6 809.7 (26.4) 783.3 0.4 783.7 (3.1) (0.4)%BABY AND PARENTING 919.5 0.7 920.2 (8.3) 911.9 848.3 (8.3) 840.0 0.6 840.6 71.3 8.5 %BRANDED CONSUMABLES 2,839.2 (306.5) 2,532.7 67.8 2,600.5 2,583.6 (65.5) 2,518.1 8.7 2,526.8 73.7 2.9 %CONSUMER SOLUTIONS 1,766.3 (149.7) 1,616.6 48.7 1,665.3 1,701.9 (132.6) 1,569.3 13.4 1,582.7 82.6 5.2 %OUTDOOR SOLUTIONS 2,415.9 (732.4) 1,683.5 (2.6) 1,680.9 1,977.3 (305.2) 1,672.1 6.8 1,678.9 2.0 0.1 %PROCESS SOLUTIONS 275.5 ─ 275.5 2.3 277.8 265.4 ─ 265.4 ─ 265.4 12.4 4.7 %
TOTAL COMPANY PRO FORMA $ 13,264.0 $ (1,946.6) $ 11,317.4 $ 161.6 $ 11,479.0 $ 12,443.9 $ (1,408.7) $ 11,035.2 $ 38.4 $ 11,073.6 $ 405.4 3.7 %
LESS: JARDEN ACQUISITION (6,528.2)
2015 AS REPORTED $ 5,915.7
(1) Includes Jarden segment and consolidated sales from April 16, 2016 and 2015, respectively.
(2) "Core Sales" is determined by applying a fixed exchange rate, calculated as the 12-month average in 2015, to the current and prior year local currency sales amounts, with the difference between the change in "As Reported" sales and the change in "Core Sales" reported in the table as "Currency Impact". Core Sales Growth excludes the impact of currency, acquisitions and divestitures.
(3) Actual and planned divestitures represent the Rubbermaid medical cart business, which the Company divested in August 2015; the Levolor and Kirsch window coverings brands ("Décor"), which the Company divested in June 2016; and, the Company's Venezuela operations, which the Company deconsolidated as of December 31, 2015, as well as the planned divestituresof businesses held for sale commencing in the third quarter including its Tools business (excluding Dymo® industrial labeling), the Rubbermaid® Consumer Storage business within the Home Solutions segment,Teutonia in the Baby and Parenting segment, two winter sports units, Völkl® and K2®, within the Outdoor Solutions segment, its Heaters, Humidifiers, Fans business within the Consumer Solutions segment and Lehigh in the Branded Consumables segment. During the fourth quarter, planned divestitures includes the Firebuilding business in Branded Consumables segment and the working capital impact of sales returns associated with exiting a distributor-led model to a direct selling model in Canada in the Baby and Parenting segment.
37
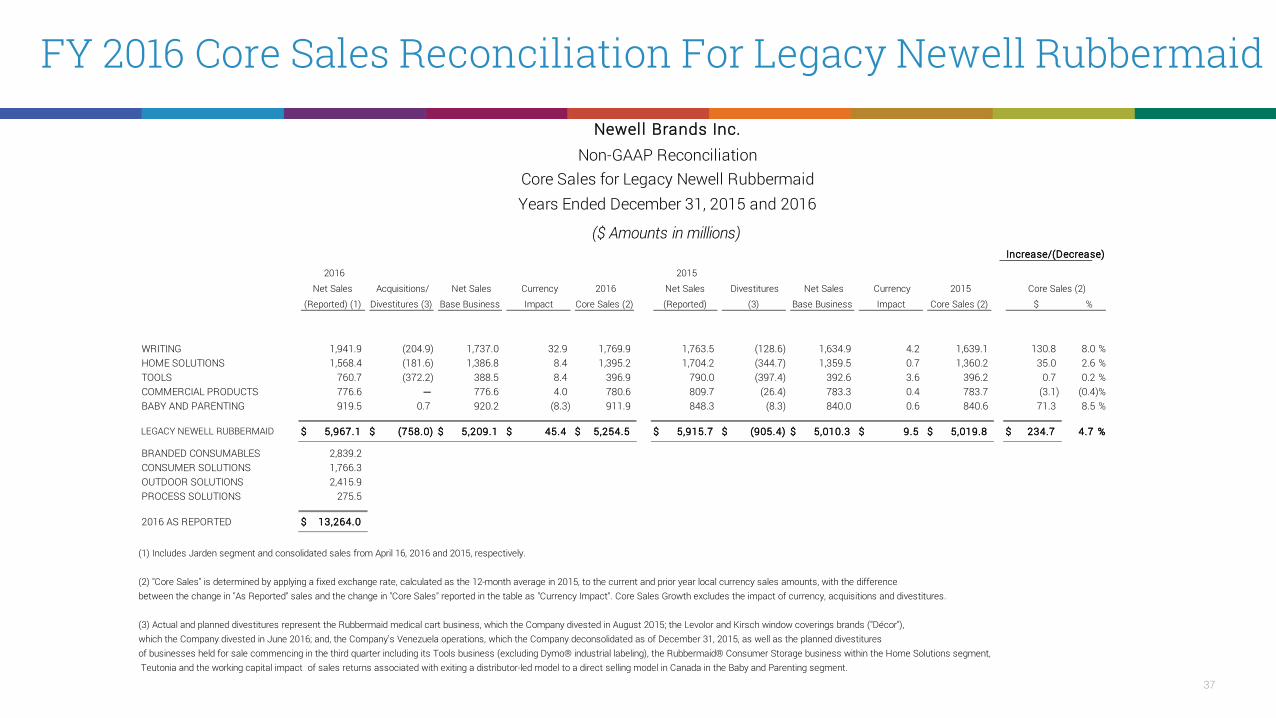
FY 2016 Core Sales Reconciliation For Legacy Newell Rubbermaid
Newell Brands Inc.Non-GAAP Reconciliation
Core Sales for Legacy Newell RubbermaidYears Ended December 31, 2015 and 2016
($ Amounts in millions)Increase/(Decrease)
2016
Net Sales
(Reported) (1)
Acquisitions/
Divestitures (3)
Net Sales
Base Business
Currency
Impact
2016
Core Sales (2)
2015
Net Sales
(Reported)
Divestitures
(3)
Net Sales
Base Business
Currency
Impact
2015
Core Sales (2)
Core Sales (2)
$ %
WRITING 1,941.9 (204.9) 1,737.0 32.9 1,769.9 1,763.5 (128.6) 1,634.9 4.2 1,639.1 130.8 8.0 %HOME SOLUTIONS 1,568.4 (181.6) 1,386.8 8.4 1,395.2 1,704.2 (344.7) 1,359.5 0.7 1,360.2 35.0 2.6 %TOOLS 760.7 (372.2) 388.5 8.4 396.9 790.0 (397.4) 392.6 3.6 396.2 0.7 0.2 %COMMERCIAL PRODUCTS 776.6 ─ 776.6 4.0 780.6 809.7 (26.4) 783.3 0.4 783.7 (3.1) (0.4)%BABY AND PARENTING 919.5 0.7 920.2 (8.3) 911.9 848.3 (8.3) 840.0 0.6 840.6 71.3 8.5 %
LEGACY NEWELL RUBBERMAID 5,967.1$ (758.0)$ 5,209.1$ 45.4$ 5,254.5$ 5,915.7$ (905.4)$ 5,010.3$ 9.5$ 5,019.8$ 234.7$ 4.7 %
BRANDED CONSUMABLES 2,839.2CONSUMER SOLUTIONS 1,766.3OUTDOOR SOLUTIONS 2,415.9PROCESS SOLUTIONS 275.5
2016 AS REPORTED 13,264.0$
(1) Includes Jarden segment and consolidated sales from April 16, 2016 and 2015, respectively.
(2) "Core Sales" is determined by applying a fixed exchange rate, calculated as the 12-month average in 2015, to the current and prior year local currency sales amounts, with the difference between the change in "As Reported" sales and the change in "Core Sales" reported in the table as "Currency Impact". Core Sales Growth excludes the impact of currency, acquisitions and divestitures.
(3) Actual and planned divestitures represent the Rubbermaid medical cart business, which the Company divested in August 2015; the Levolor and Kirsch window coverings brands ("Décor"), which the Company divested in June 2016; and, the Company's Venezuela operations, which the Company deconsolidated as of December 31, 2015, as well as the planned divestituresof businesses held for sale commencing in the third quarter including its Tools business (excluding Dymo® industrial labeling), the Rubbermaid® Consumer Storage business within the Home Solutions segment,Teutonia and the working capital impact of sales returns associated with exiting a distributor-led model to a direct selling model in Canada in the Baby and Parenting segment.
38
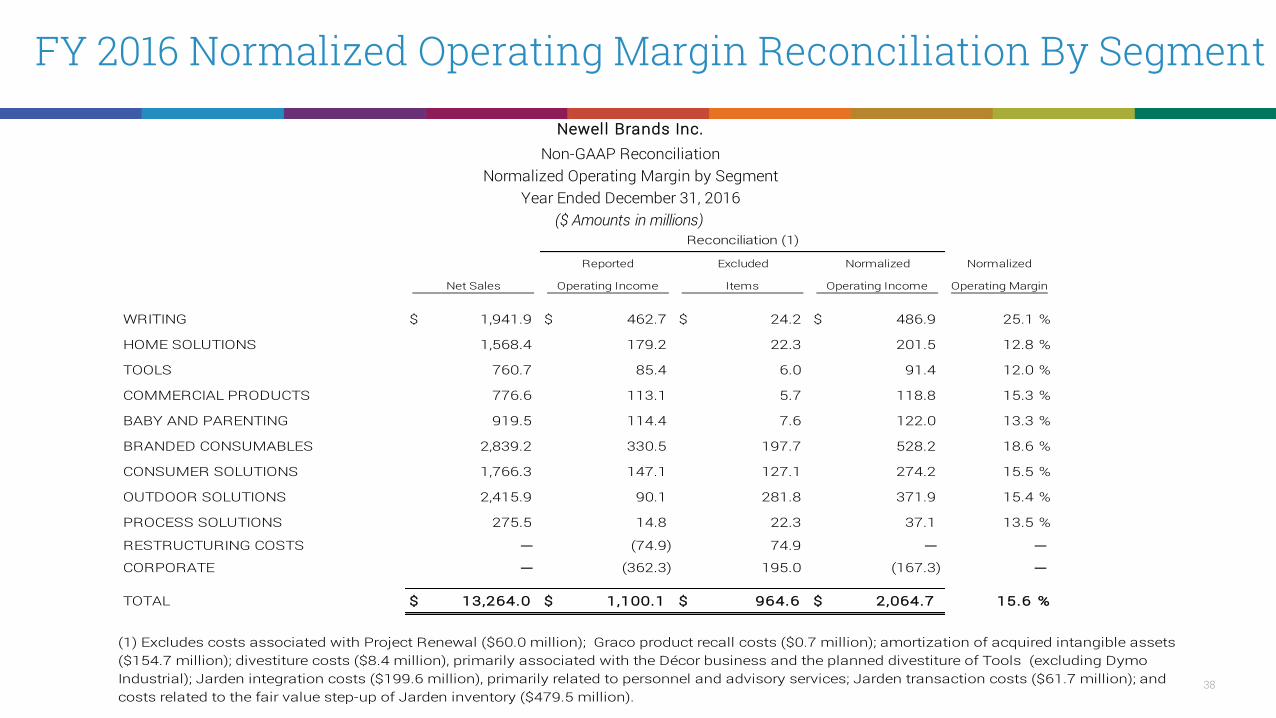
FY 2016 Normalized Operating Margin Reconciliation By Segment
Newell Brands Inc.Non-GAAP Reconciliation
Normalized Operating Margin by SegmentYear Ended December 31, 2016
($ Amounts in millions)Reconciliation (1)
Reported Excluded Normalized Normalized
Net Sales Operating Income Items Operating Income Operating Margin
WRITING 1,941.9$ 462.7$ 24.2$ 486.9$ 25.1 %
HOME SOLUTIONS 1,568.4 179.2 22.3 201.5 12.8 %
TOOLS 760.7 85.4 6.0 91.4 12.0 %
COMMERCIAL PRODUCTS 776.6 113.1 5.7 118.8 15.3 %
BABY AND PARENTING 919.5 114.4 7.6 122.0 13.3 %
BRANDED CONSUMABLES 2,839.2 330.5 197.7 528.2 18.6 %
CONSUMER SOLUTIONS 1,766.3 147.1 127.1 274.2 15.5 %
OUTDOOR SOLUTIONS 2,415.9 90.1 281.8 371.9 15.4 %
PROCESS SOLUTIONS 275.5 14.8 22.3 37.1 13.5 %
RESTRUCTURING COSTS ─ (74.9) 74.9 ─ ─
CORPORATE ─ (362.3) 195.0 (167.3) ─
TOTAL 13,264.0$ 1,100.1$ 964.6$ 2,064.7$ 15.6 %
(1) Excludes costs associated with Project Renewal ($60.0 million); Graco product recall costs ($0.7 million); amortization of acquired intangible assets ($154.7 million); divestiture costs ($8.4 million), primarily associated with the Décor business and the planned divestiture of Tools (excluding Dymo Industrial); Jarden integration costs ($199.6 million), primarily related to personnel and advisory services; Jarden transaction costs ($61.7 million); and costs related to the fair value step-up of Jarden inventory ($479.5 million).

39
FY 2016 Reconciliation of Normalized EPS
Twelve Months Ended December 31, 2016
GAAP Measure Project Renewal Costs (1) Acquisition Jarden Jarden
transaction Décor Loss on Non-GAAP Measure Advisory Personnel Other Restructuring Product Integration amortization inventory and Interest costs gain Divestiture extinguishment Discontinued Non-recurring Percentage
Reported costs costs costs costs recall costs (2) costs (3) costs (4) step-up (5) related costs (6) Jarden-related
(7) on sale (8) costs (9) of debt (10) operations (11) tax items (12) Normalized* of Sales
Cost of products sold $ 8,865.2 $ (0.2) $ (6.3) $ (7.1) $ - $ - $ (5.1) $ (8.9) $ (479.5) $ - $ - $ - $ - $ - $ - $ - $ 8,358.1 63.0%
Gross profit 4,398.8 0.2 6.3 7.1 - - 5.1 8.9 479.5 - - - - - - - 4,905.9 37.0%
Selling, general & administrative expenses 3,223.8 (9.3) (20.0) (7.2) - (0.7) (129.5) (145.8) - (61.7) - - (8.4) - - - 2,841.2 21.4%
Operating income 1,100.1 9.5 26.3 14.3 9.9 0.7 199.6 154.7 479.5 61.7 - - 8.4 - - - 2,064.7 15.6%
Non-operating expenses 285.6 - - - - - - - - - (16.8) 160.2 - (47.6) - - 381.4
Income before income taxes 814.5 9.5 26.3 14.3 9.9 0.7 199.6 154.7 479.5 61.7 16.8 (160.2) 8.4 47.6 - - 1,683.3
Income taxes (13) 286.0 3.6 10.0 5.4 3.8 0.3 75.6 52.6 168.1 32.9 6.7 (59.3) 3.2 13.9 - (143.2) 459.6
Net income from continuing operations 528.5 5.9 16.3 8.9 6.1 0.4 124.0 102.1 311.4 28.8 10.1 (100.9) 5.2 33.7 - 143.2 1,223.7
Net income 527.8 5.9 16.3 8.9 6.1 0.4 124.0 102.1 311.4 28.8 10.1 (100.9) 5.2 33.7 0.7 143.2 1,223.7
Diluted earnings per share** $ 1.25 $ 0.01 $ 0.04 $ 0.02 $ 0.01 $ - $ 0.29 $ 0.24 $ 0.74 $ 0.07 $ 0.02 $ (0.24) $ 0.01 $ 0.08 $ - $ 0.34 $ 2.89
Newell Brands Inc.
Non-GAAP Reconciliation
Normalized Earnings Per Share
Year Ended December 31, 2016
(Amounts in millions, except per share data)
40
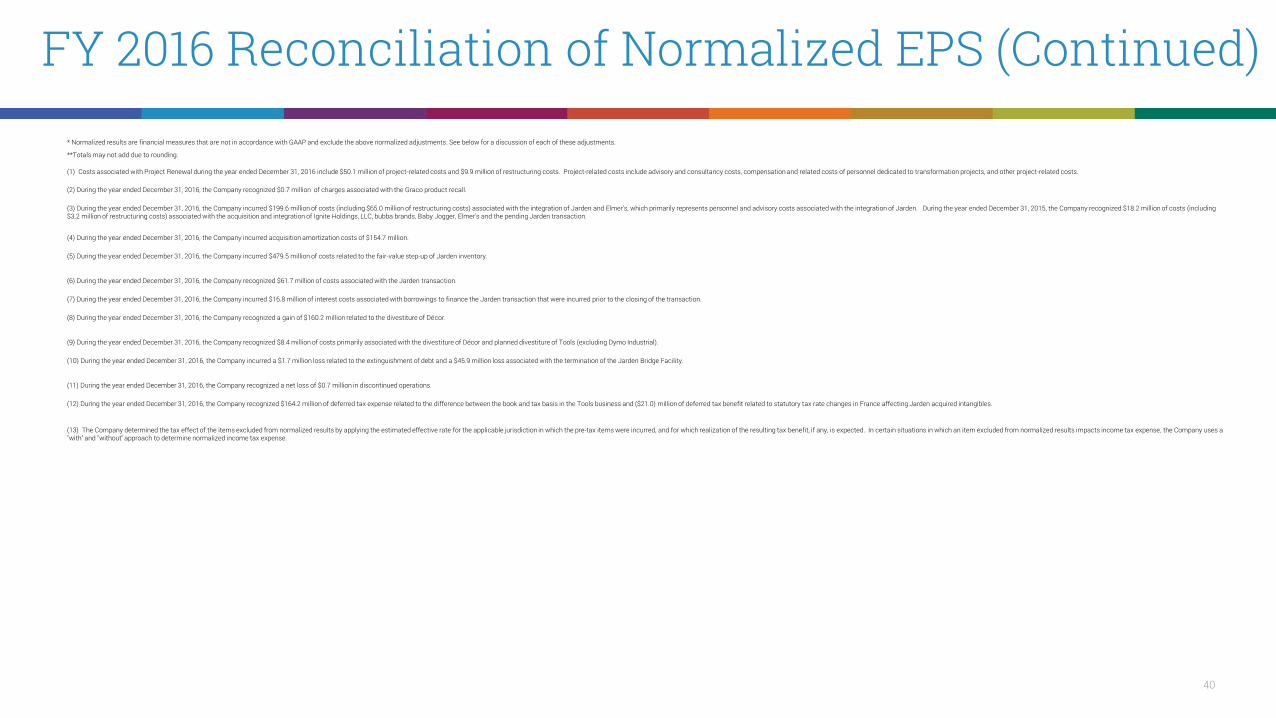
FY 2016 Reconciliation of Normalized EPS (Continued) * Normalized results are financial measures that are not in accordance with GAAP and exclude the above normalized adjustments. See below for a discussion of each of these adjustments.
**Totals may not add due to rounding.
(1) Costs associated with Project Renewal during the year ended December 31, 2016 include $50.1 million of project-related costs and $9.9 million of restructuring costs. Project-related costs include advisory and consultancy costs, compensation and related costs of personnel dedicated to transformation projects, and other project-related costs.
(2) During the year ended December 31, 2016, the Company recognized $0.7 million of charges associated with the Graco product recall.
(3) During the year ended December 31, 2016, the Company incurred $199.6 million of costs (including $65.0 million of restructuring costs) associated with the integration of Jarden and Elmer's, which primarily represents personnel and advisory costs associated with the integration of Jarden. During the year ended December 31, 2015, the Company recognized $18.2 million of costs (including $3.2 million of restructuring costs) associated with the acquisition and integration of Ignite Holdings, LLC, bubba brands, Baby Jogger, Elmer's and the pending Jarden transaction.
(4) During the year ended December 31, 2016, the Company incurred acquisition amortization costs of $154.7 million.
(5) During the year ended December 31, 2016, the Company incurred $479.5 million of costs related to the fair-value step-up of Jarden inventory.
(6) During the year ended December 31, 2016, the Company recognized $61.7 million of costs associated with the Jarden transaction.
(7) During the year ended December 31, 2016, the Company incurred $16.8 million of interest costs associated with borrowings to finance the Jarden transaction that were incurred prior to the closing of the transaction.
(8) During the year ended December 31, 2016, the Company recognized a gain of $160.2 million related to the divestiture of Décor.
(9) During the year ended December 31, 2016, the Company recognized $8.4 million of costs primarily associated with the divestiture of Décor and planned divestiture of Tools (excluding Dymo Industrial).
(10) During the year ended December 31, 2016, the Company incurred a $1.7 million loss related to the extinguishment of debt and a $45.9 million loss associated with the termination of the Jarden Bridge Facility.
(11) During the year ended December 31, 2016, the Company recognized a net loss of $0.7 million in discontinued operations.
(12) During the year ended December 31, 2016, the Company recognized $164.2 million of deferred tax expense related to the difference between the book and tax basis in the Tools business and ($21.0) million of deferred tax benefit related to statutory tax rate changes in France affecting Jarden acquired intangibles.
(13) The Company determined the tax effect of the items excluded from normalized results by applying the estimated effective rate for the applicable jurisdiction in which the pre-tax items were incurred, and for which realization of the resulting tax benefit, if any, is expected. In certain situations in which an item excluded from normalized results impacts income tax expense, the Company uses a "with" and "without" approach to determine normalized income tax expense.

41
Q1 2017 Reconciliation of Core Sales by Segment NEWELL BRANDS INC.
Core Sales Analysis by Segment - Actual and Adjusted Pro Forma Basis (Unaudited)For the three months ended March 31, 2017 and 2016
in Millions
March 31, 2017 March 31, 2016
2017Net Sales
(Reported) Acquisitions/Divestitures [3]
Net SalesBase Business
Currency Impact
2017Core Sales [2]
2016Net Sales
(Pro forma) [1] Divestitures
[3] Net Sales
Base Business Currency
Impact 2016
Core Sales [2]
LIVE 1,067.8 (71.2) 996.6 8.7 1,005.3 1,028.3 (50.4) 977.9 1.0 978.9 26.4 2.7 %LEARN 569.1 (1.1) 568.0 5.5 573.5 532.4 ─ 532.4 0.5 532.9 40.6 7.6 %WORK 613.7 (20.9) 592.8 5.2 598.0 637.6 (23.6) 614.0 2.0 616.0 (18.0) (2.9)%PLAY 628.0 (0.1) 627.9 4.5 632.4 625.9 (0.8) 625.1 3.9 629.0 3.4 0.5 %OTHER 387.7 (189.8) 197.9 2.1 200.0 508.6 (332.6) 176.0 2.6 178.6 21.4 12.0 %
TOTAL COMPANY 3,266.3$ (283.1)$ 2,983.2$ 26.0$ 3,009.2$ 3,332.8$ (407.4)$ 2,925.4$ 10.0$ 2,935.4$ 73.8$ 2.5 %
Less: Jarden Acquisition (2,017.9)$
2016 Net Sales (Reported) 1,314.9$
Increase (Decrease)Core Sales
$ %
[1] Includes pre-acquisition Jarden net sales from January 1, 2016.
[2] "Core Sales" is determined by applying a fixed exchange rate, calculated as the 12-month average in 2016, to the current and prior year local currency sales amounts, with the difference between the change in "As Reported" sales and the change in "Core Sales" reported in the table as "Currency Impact". Core Sales Growth excludes the impact of currency, acquisitions and divestitures.
[3] Acquisitions exclude sales until the one year anniversary of their respective dates of acquisition, and are comprised of Smith Mountain Industries and GUD each included in the Live segment, Bond in the Learn segment, and Touch Industries in the Work segment. Divestitures include both actual and planned divestitures comprised of the Levolor and Kirsch window coverings brands ("Décor"), which the Company divested in June 2016, the Tools (excluding Dymo® industrial labeling) and Rubbermaid® Consumer Storage businesses, which the Company divested in March 2017; and the Lehigh, Fire Building and Teutonia businesses, which the Company completed in the second quarter 2017; as well as the planned divestitures of businesses currently held for sale including two winter sports units, Völkl® and K2®, and the Humidifiers and Fans business, and the planned exit of a distribution agreement with Sprue Aegis.

42
Q1 2017 Reconciliation of Core Sales By Geography NEWELL BRANDS INC.
Core Sales Analysis by Geography - Actual and Adjusted Pro Forma Basis (Unaudited)For the three months ended March 31, 2017 and 2016
March 31, 2017 March 31, 2016
2017Net Sales(Reported)
Acquisitions/Divestitures [3]
Net SalesBase Business Currency Impact
2017Core Sales [2]
2016Net Sales
(Pro forma) [1] Divestitures
[3] Net Sales
Base Business Currency Impact 2016
Core Sales [2]
Increase (Decrease)Core Sales$ %
NORTH AMERICA 2,458.4 (179.5) 2,278.9 (0.2) 2,278.7 2,533.2 (291.1) 2,242.1 5.8 2,247.9 30.8 1.4 %
EUROPE, MIDDLE EAST, AFRICA 454.7 (55.7) 399.0 24.1 423.1 477.4 (68.4) 409.0 (6.4) 402.6 20.5 5.1 %
LATIN AMERICA 169.7 (10.7) 159.0 (1.2) 157.8 156.7 (20.7) 136.0 5.1 141.1 16.7 11.8 %
ASIA PACIFIC 183.5 (37.2) 146.3 3.3 149.6 165.5 (27.2) 138.3 5.5 143.8 5.8 4.0 %
TOTAL COMPANY $ 3,266.3 $ (283.1) $ 2,983.2 $ 26.0 $ 3,009.2 $ 3,332.8 $ (407.4) $ 2,925.4 $ 10.0 $ 2,935.4 $ 73.8 2.5 %
Less: Jarden Acquisition $ (2,017.9)2016 Net Sales (Reported) $ 1,314.9
[1] Includes pre-acquisition Jarden net sales from January 1, 2016.
[2] "Core Sales" is determined by applying a fixed exchange rate, calculated as the 12-month average in 2016, to the current and prior year local currency sales amounts, with the difference between the change in "As Reported" sales and the change in "Core Sales" reported in the table as "Currency Impact". Core Sales Growth excludes the impact of currency, acquisitions and divestitures.
[3] Acquisitions exclude sales until the one year anniversary of their respective dates of acquisition, and are comprised of Smith Mountain Industries and GUD each included in the Live segment, Bond in the Learn segment, and Touch Industries in the Work segment. Divestitures include both actual and planned divestitures comprised of the Levolor and Kirsch window coverings brands ("Décor"), which the Company divested in June 2016, the Tools (excluding Dymo® industrial labeling) and Rubbermaid® Consumer Storage businesses, which the Company divested in March 2017; and the Lehigh, Fire Building and Teutonia businesses, which the Company completed in the second quarter 2017; as well as the planned divestitures of businesses currently held for sale including two winter sports units, Völkl® and K2®, and the Humidifiers and Fans business, and the planned exit of a distribution agreement with Sprue Aegis.

43
FY 2017 Core Sales Growth Guidance Reconciliation
NEWELL BRANDS INC.Reconciliation of Non-GAAP Measure
Core Sales Growth OutlookYear Ending
December 31, 2017Estimated net sales growth (GAAP) 9.5% to 11.0%Less: Pre-closing Jarden sales included in pro forma base [1] -18.1%Add: Unfavorable foreign exchange 1.5% to 2.0%Add: Divestitures, net of acquisitions [2] 9.6% to 9.1%Core Sales Growth, Adjusted Pro Forma 2.5% to 4.0%
[1] Adjusted pro forma reflects Jarden sales from January 1, 2016 to April 15, 2016.
[2] Acquisitions exclude net sales until the one year anniversary of their respective dates of acquisition, and are comprised of Sistema, Smith Mountain Industries, GUD, Bond, and Touch Industries. Divestitures include both actual and planned divestitures comprised of the Levolor and Kirsch window coverings brands ("Décor"), which the Company divested in June 2016, the Tools (excluding Dymo® industrial labeling) and Rubbermaid® Consumer Storage businesses, which the Company divested in March 2017; and the Lehigh, Fire Building and Teutonia businesses, which the Company completed in the second quarter 2017; as well as the planned divestitures of businesses currently held for sale including two winter sports units, Völkl® and K2®, and the Humidifiers and Fans business, and the planned exit of a distribution agreement with Sprue Aegis.