Determinants of Performance of Monitoring and Evaluation ...
59
DETERMINANTS OF PERFORMANCE OF MONITORING AND EVALUATION SYSTEMS FOR COUNTY GOVERNMENT PROJECTS: A CASE OF MAKUENI COUNTY) BONARERI JANET ONSOMU (“A Research Project Report Submitted in Partial Fulfilment of the Requirements for the Award of the Degree of Master of Arts in Project Planning and Management of the University of Nairobi”) 2020
Transcript of Determinants of Performance of Monitoring and Evaluation ...
DETERMINANTS OF PERFORMANCE OF MONITORING AND EVALUATION
SYSTEMS FOR COUNTY GOVERNMENT PROJECTS: A CASE OF MAKUENI
COUNTY)
BONARERI JANET ONSOMU
(“A Research Project Report Submitted in Partial Fulfilment of the Requirements for
the Award of the Degree of Master of Arts in Project Planning and Management of the
University of Nairobi”)
2020

ii
DECLARATION
This research project report is my original work and has never been submitted for an award of
a degree in any other university.
Signed…………………………..……… Date ………………………………
BONARERI JANET ONSOMU
Reg. No: L50/86324/2016
This research project report has been submitted for examination with my approval as the
university supervisor.
Signed…………………………..……… Date ………………………………
DR. KISIMBII JOHNBOSCO (PhD)
Lecturer, School of Open and Distance Learning
University of Nairobi

iii
DEDICATION
I dedicate this work to my parents Mr and Mrs Onsomu Kebiro who have been a constant
source of encouragement and guidance for me in the pursuit of my dreams, and my beloved
sisters Nelius and Sophia in recognition of their unwavering support and love.
iv
ACKNOWLEDGMENT
First, I would like to acknowledge my supervisor Dr. Kisimbii for his guidance and patience
during the preparation of this research project. I would also like to acknowledge my lecturers
Professor Rambo, Mr. Nyaoro, and Mr. Luketero for their input and guidance during my study
for the Degree of Master of Arts in Project Planning and Management. I am greatly indebted
to them and thankful and for their time. I also acknowledge the University of Nairobi for
granting me the opportunity to pursue my degree of Master of Arts in Project Planning and
Management. I wish to thank my employer, Zenko Kenya Ltd, for according me the necessary
time and chance to conduct this study. Lastly, I would wish to acknowledge my fellow students
and colleagues for their encouragement, support and useful contribution to this study.
v
TABLE OF CONTENTS
DECLARATION ....................................................................................................................... ii
DEDICATION .......................................................................................................................... iii
ACKNOWLEDGMENT........................................................................................................... iv
TABLE OF CONTENTS ........................................................................................................... v
LIST OF TABLES .................................................................................................................... ix
LIST OF FIGURES ................................................................................................................... x
ABBREVIATIONS AND ACRONYMS ................................................................................. xi
ABSTRACT ............................................................................................................................. xii
CHAPTER ONE: INTRODUCTION ........................................................................................ 1
1.1 Background of the Study ..................................................................................................... 1
1.2 Statement of the Problem ..................................................................................................... 2
1.3 Purpose of the Study ............................................................................................................ 3
1.4 Objectives of the Study ........................................................................................................ 3
1.5 Research Questions .............................................................................................................. 3
1.6 Research Hypothesis ............................................................................................................ 4
1.7 Significance of the Study ..................................................................................................... 4
1.8 Delimitation of the Study ..................................................................................................... 4
1.9 Limitations of the Study....................................................................................................... 5
1.10 Basic Assumptions of the Study ........................................................................................ 5
1.11 Definitions of the Significant Terms.................................................................................. 5
1.12 Organization of the Study .................................................................................................. 6
CHAPTER TWO: LITERATURE REVIEW ............................................................................ 7
2.1 Introduction .......................................................................................................................... 7
2.2 Concept of Monitoring and Evaluation System ................................................................... 7
2.3 Role of Management Influence on Monitoring and Evaluation .......................................... 8
2.4 Staff Capacity Influence on Monitoring and Evaluation ..................................................... 9
2.5 Availability of Funds Influence on Monitoring and Evaluation ........................................ 10
2.6 Stakeholder Participation and Influence on Monitoring and Evaluation ........................... 11
2.7 Theoretical Framework ...................................................................................................... 12
2.7.1 Dynamic Capabilities Theory ......................................................................................... 12
2.7.2 Theory of Change ........................................................................................................... 13
2.7.3 Program Theory of Evaluation........................................................................................ 13
vi
2.8 Conceptual Framework ...................................................................................................... 13
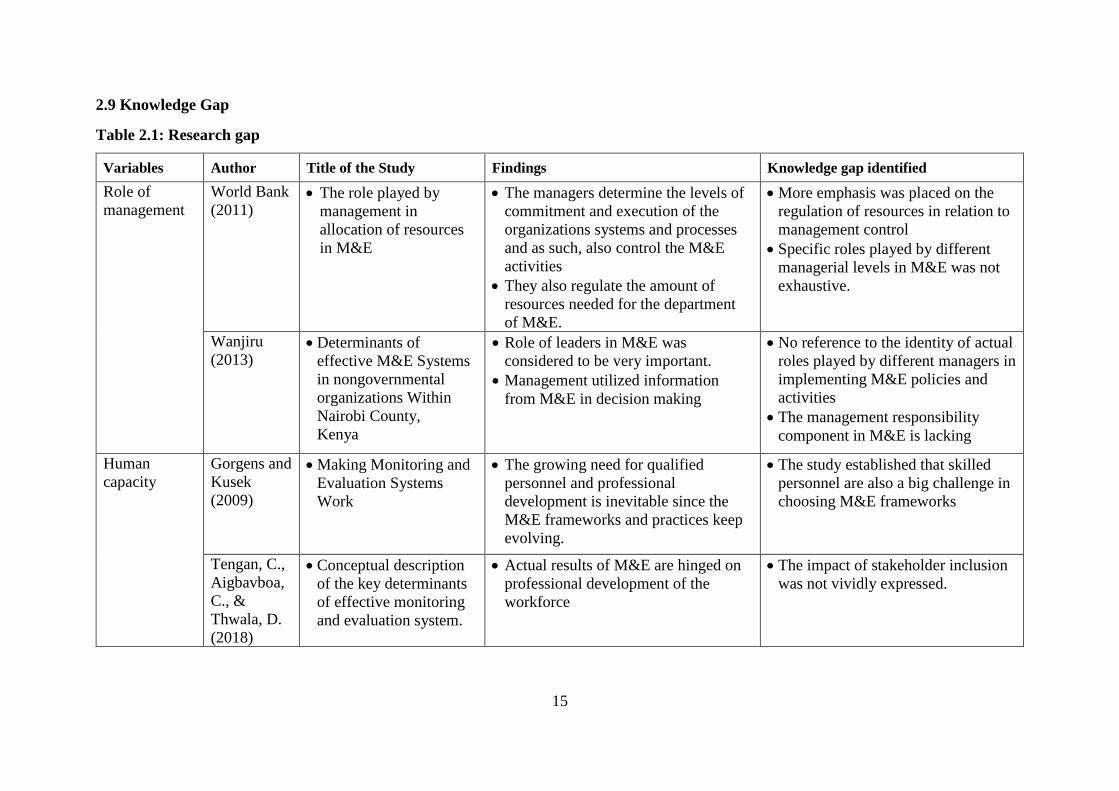
2.9 Knowledge Gap ................................................................................................................. 15
2.10 Summary of Chapter ........................................................................................................ 17
CHAPTER THREE: RESEARCH METHODOLOGY. ......................................................... 18
3.1 Introduction. ....................................................................................................................... 18
3.2 Research Design................................................................................................................. 18
3.3 Target Population ............................................................................................................... 18
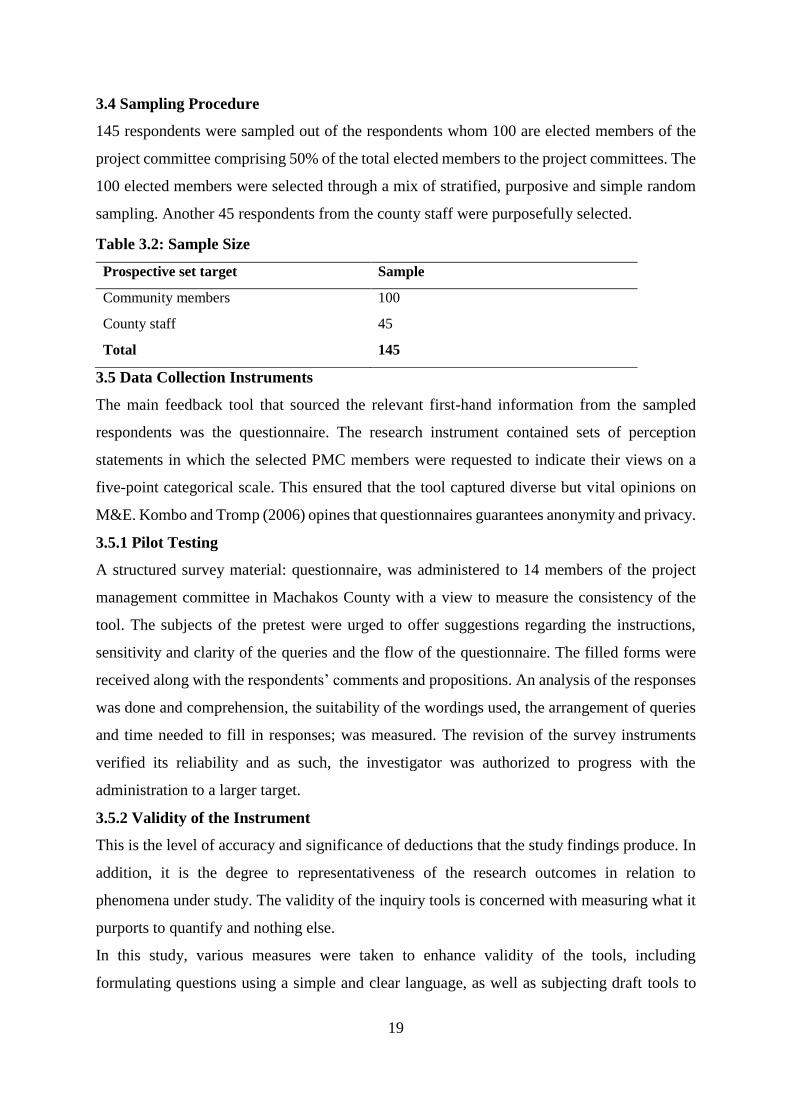
3.4 Sampling Procedure ........................................................................................................... 19
3.5 Data Collection Instruments .............................................................................................. 19
3.5.1 Pilot Testing .................................................................................................................... 19
3.5.2 Validity of the Instrument ............................................................................................... 19
3.5.3 Reliability of the Instrument ........................................................................................... 20
3.6 Data Collection Procedure ................................................................................................. 20
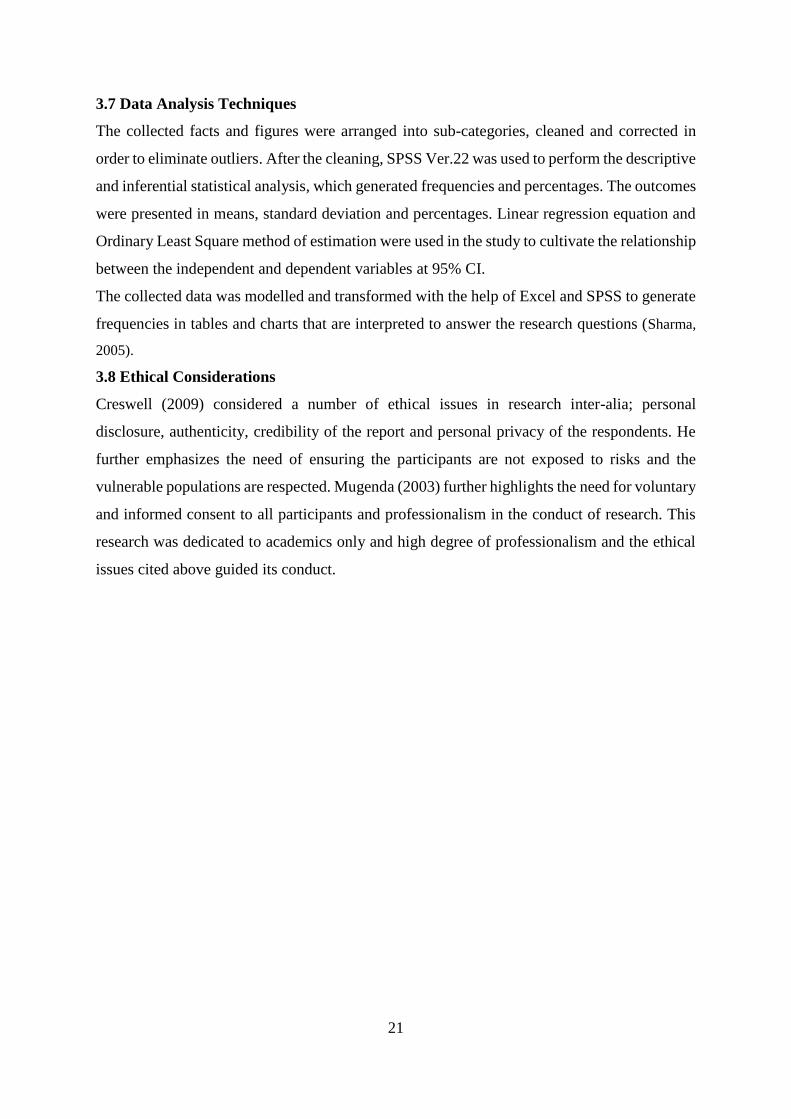
3.7 Data Analysis Techniques .................................................................................................. 21
3.8 Ethical Considerations ....................................................................................................... 21
3.9 Operational Definition of Variables ................................................................................... 22
CHAPTER FOUR DATA ANALYSIS, PRESENTATION AND INTERPRETATION ...... 23
4.1 Introduction ........................................................................................................................ 23
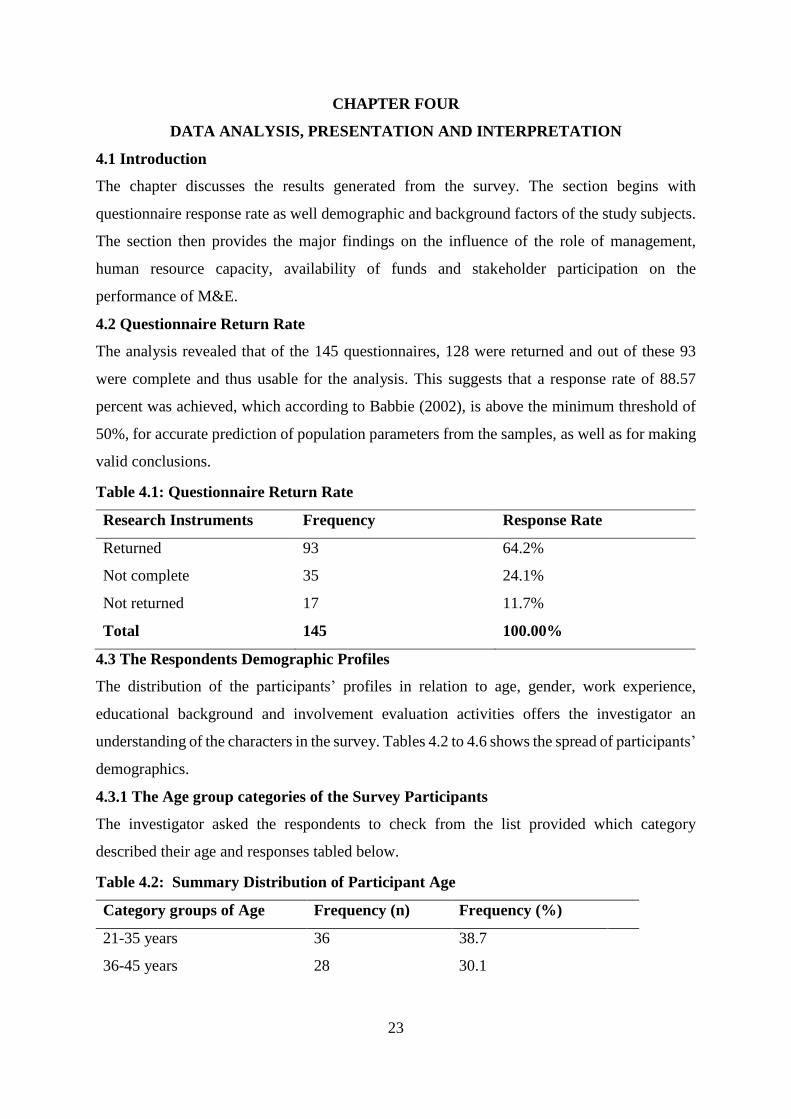
4.2 Questionnaire Return Rate ................................................................................................. 23
4.3 The Respondents Demographic Profiles ............................................................................ 23
4.3.1 The Age group categories of the Survey Participants ..................................................... 23
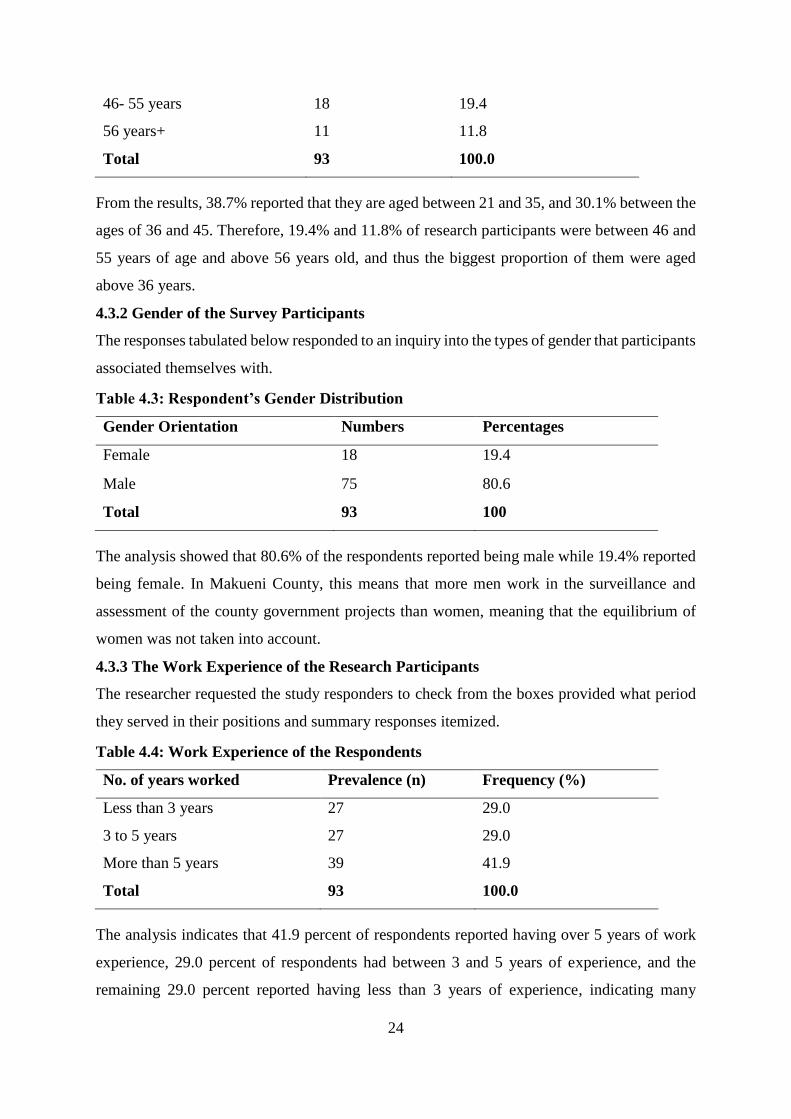
4.3.2 Gender of the Survey Participants .................................................................................. 24
4.3.3 The Work Experience of the Research Participants ....................................................... 24
4.3.4 Education Background of the Respondents .................................................................... 25
4.3.5 Involvement of the Research Respondents in Conducting M&E ................................... 25
4.4 The Role of Management in the Performance of M&E processes in County Government
Projects. ......................................................................................................................... 26
4.4.1 Presence of County Management in the tracking arrangements ..................................... 26
4.4.2 Perceptions on Managers Commitment to M&E Structures and Performance .............. 26
4.5 Workforce Capabilities in Influencing the M&E Systems Performance in Devolved
Projects .......................................................................................................................... 27
4.5.1 The Skilled Human Resource Capacity .......................................................................... 27
4.5.2 Extent of Influence on Effective Implementation of M&E System ............................... 27
vii
4.5.3 Statements on Human Resource Capacity Influence on Performance of M&E ............. 28
4.6 Resource Allocation for the Performance of M&E System of County Government Projects
....................................................................................................................................... 29
4.6.1 Main Source of Funding ................................................................................................. 29
4.6.2 Perception Statements on Finance Availability Influence on Performance of M&E
System Associated Projects ......................................................................................... 29
4.7 Stakeholder Participation Influence on Performance of M&E System of County
Government Projects ..................................................................................................... 30
4.7.1 Extent of Involving Stakeholders to Participate in M&E ............................................... 30
4.7.2 Involvement of External Stakeholders in M&E.............................................................. 31
4.7.3 Perception Statements on the Presence of Stakeholder in relation to Efficacy of M&E
Course ......................................................................................................................... 31
4.8 Measurement of Monitoring and Evaluation System Performance ................................... 32
4.8.1 Level of Achievement ..................................................................................................... 32
4.8.2 Aspects of Effective Monitoring and Evaluation............................................................ 32
4.9 Inferential Statistics of Performance of Monitoring and Evaluation System .................... 33
CHAPTER FIVE SUMMARY OF FINDINGS, DISCUSSIONS, CONCLUSIONS AND
RECOMMENDATIONS ......................................................................................................... 35
5.1 Introduction ........................................................................................................................ 35
5.2 Summary of the Findings ................................................................................................... 35
5.2.1 Findings on the Role of Management ............................................................................. 35
5.2.2 Findings on Human Resource Capacity .......................................................................... 35
5.2.3 Findings on Availability of Funds .................................................................................. 36
5.2.4 Findings on Stakeholder Participation ............................................................................ 36
5.3 Discussion of Findings ....................................................................................................... 36
5.3.1 Role of Management in Performance of Monitoring and Evaluation ............................. 36
5.3.2 Human Resource Capacity .............................................................................................. 37
5.3.3 Availability of Funds ...................................................................................................... 37
5.3.4 Stakeholder Participation on Performance of Monitoring and Evaluation ..................... 37
5.4 Conclusions ........................................................................................................................ 38
5.5 Recommendations .............................................................................................................. 38
5.6 Suggestions for Further Research ...................................................................................... 39
REFERENCES ........................................................................................................................ 40

viii
APPENDICES ......................................................................................................................... 43
Appendix I: Letter of Introduction ........................................................................................... 43
Appendix II: Questionnaire for Project Committee Members and County Officials .............. 44

ix
LIST OF TABLES
Table 2.1: Research gap ........................................................................................................... 15
Table 3.1: Target Population.................................................................................................... 18
Table 3.2: Sample Size ............................................................................................................ 19
Table 3.3: Variable Operationalization .................................................................................... 22
Table 4.1: Questionnaire Return Rate ...................................................................................... 23
Table 4.2: Summary Distribution of Participant Age ............................................................. 23
Table 4.3: Respondent’s Gender Distribution ......................................................................... 24
Table 4.4: Work Experience of the Respondents) ................................................................... 24
Table 4.5: Education Background of the Survey Participants ................................................. 25
Table 4.6: Involvement in Steering Evaluations ...................................................................... 25
Table 4.7: Presence of County Management for M&E System ............................................... 26
Table 4.8: Statements on Managers Obligations in Driving the M&E Outputs ...................... 26
Table 4.9: The Adequacy of Skilled Human Resource Capacity) .......................................... 27
Table 4.10: The Extent of Capacity Influence on M&E System Performance ........................ 27
Table 4.11: Statements on Human Resource Capacity Influence on Performance of M&E
System 28
Table 4.12: The Funding Contributors..................................................................................... 29
Table 4.13: Statements on Financial Commitments on Performance of M&E Schemes ........ 29
Table 4.14: Inclusion of External Stakeholders in M&E processes ........................................ 30
Table 4.15: Involvement of External Stakeholders in M&E ................................................... 31
Table 4.16: Stakeholder Participation Influence on Performance of M&E System ................ 31
Table 4.17: Monitoring and Evaluation Level of Achievement .............................................. 32
Table 4.18: Aspects of Effective Monitoring and Evaluation ................................................. 32
Table 4.19: Model Summary of Influence of Independent Variables on Dependent Variable 33
Table 4.20: Analysis of Variance of Independent and Dependent Variables .......................... 33
Table 4.21: Regression Coefficients of Independent Variables............................................... 34

x
LIST OF FIGURES
Figure 1: Conceptual Framework ............................................ Error! Bookmark not defined.
xi
ABBREVIATIONS AND ACRONYMS
AU: African Union
CDF: Constituency Development Fund
GDP: Gross Domestic Product
GoK: Government of Kenya
KNBS: Kenya National Bureau of Statistics
M&E: Monitoring and Evaluation
MoE: Ministry of Education
NGO’s: Non-Governmental Organizations
SOPs: Standard Operating Procedures
SPSS: Statistical Package for Social Science
SWOT: Strengths, Weaknesses, Opportunities, and Threats
UNDP: United Nations Development Programme
UNESCO: United Nations Educational, Scientific and Cultural Organization
WB: World Bank
xii
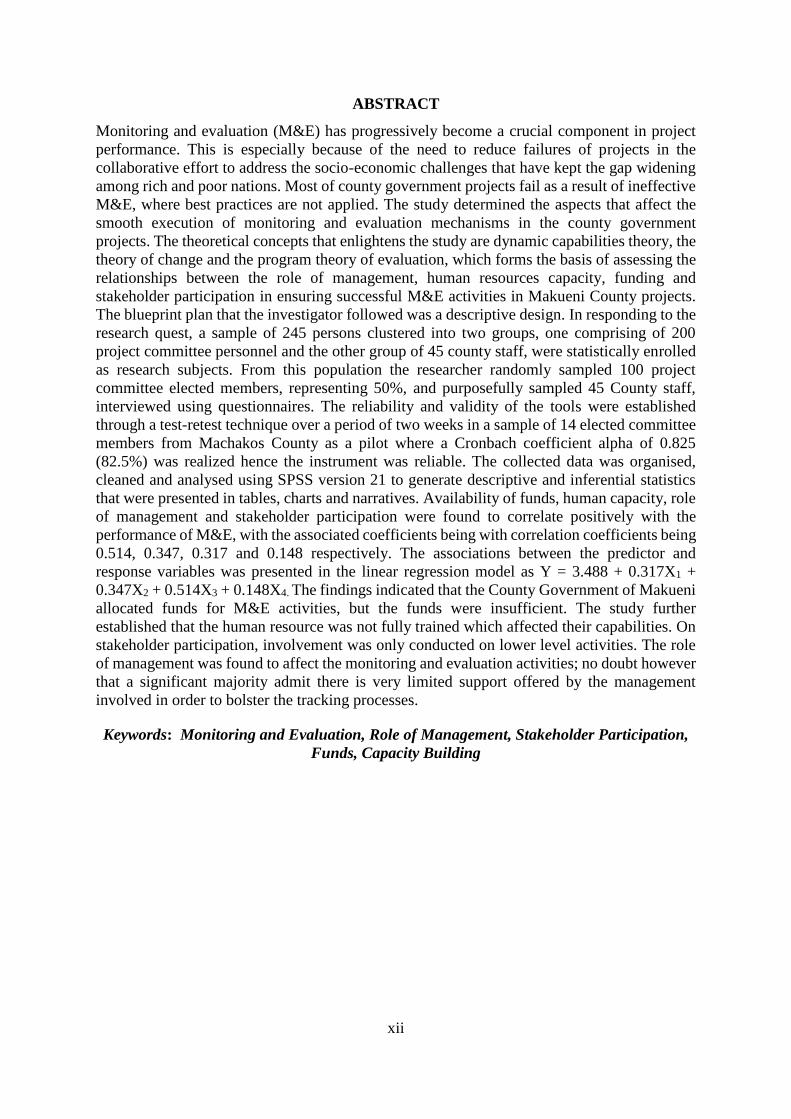
ABSTRACT
Monitoring and evaluation (M&E) has progressively become a crucial component in project
performance. This is especially because of the need to reduce failures of projects in the
collaborative effort to address the socio-economic challenges that have kept the gap widening
among rich and poor nations. Most of county government projects fail as a result of ineffective
M&E, where best practices are not applied. The study determined the aspects that affect the
smooth execution of monitoring and evaluation mechanisms in the county government
projects. The theoretical concepts that enlightens the study are dynamic capabilities theory, the
theory of change and the program theory of evaluation, which forms the basis of assessing the
relationships between the role of management, human resources capacity, funding and
stakeholder participation in ensuring successful M&E activities in Makueni County projects.
The blueprint plan that the investigator followed was a descriptive design. In responding to the
research quest, a sample of 245 persons clustered into two groups, one comprising of 200
project committee personnel and the other group of 45 county staff, were statistically enrolled
as research subjects. From this population the researcher randomly sampled 100 project
committee elected members, representing 50%, and purposefully sampled 45 County staff,
interviewed using questionnaires. The reliability and validity of the tools were established
through a test-retest technique over a period of two weeks in a sample of 14 elected committee
members from Machakos County as a pilot where a Cronbach coefficient alpha of 0.825
(82.5%) was realized hence the instrument was reliable. The collected data was organised,
cleaned and analysed using SPSS version 21 to generate descriptive and inferential statistics
that were presented in tables, charts and narratives. Availability of funds, human capacity, role
of management and stakeholder participation were found to correlate positively with the
performance of M&E, with the associated coefficients being with correlation coefficients being
0.514, 0.347, 0.317 and 0.148 respectively. The associations between the predictor and
response variables was presented in the linear regression model as Y = 3.488 + 0.317X1 +
0.347X2 + 0.514X3 + 0.148X4. The findings indicated that the County Government of Makueni
allocated funds for M&E activities, but the funds were insufficient. The study further
established that the human resource was not fully trained which affected their capabilities. On
stakeholder participation, involvement was only conducted on lower level activities. The role
of management was found to affect the monitoring and evaluation activities; no doubt however
that a significant majority admit there is very limited support offered by the management
involved in order to bolster the tracking processes.
Keywords: Monitoring and Evaluation, Role of Management, Stakeholder Participation,
Funds, Capacity Building
1
CHAPTER ONE
INTRODUCTION
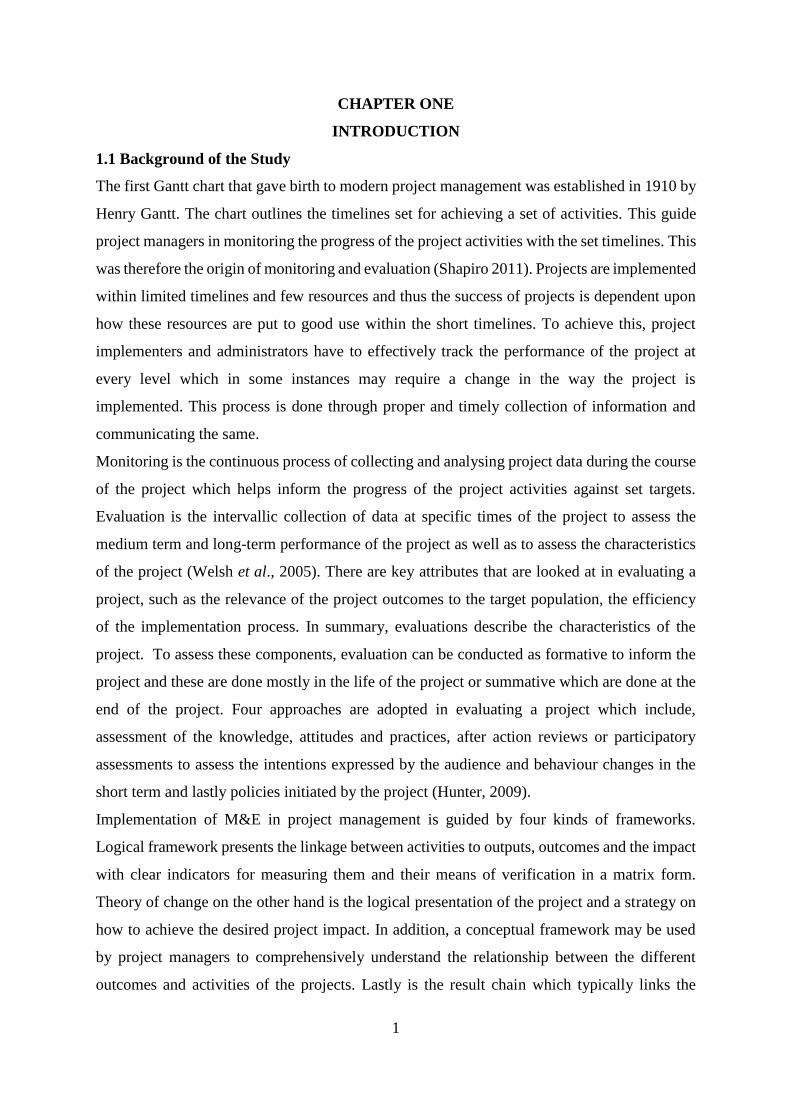
1.1 Background of the Study
The first Gantt chart that gave birth to modern project management was established in 1910 by
Henry Gantt. The chart outlines the timelines set for achieving a set of activities. This guide
project managers in monitoring the progress of the project activities with the set timelines. This
was therefore the origin of monitoring and evaluation (Shapiro 2011). Projects are implemented
within limited timelines and few resources and thus the success of projects is dependent upon
how these resources are put to good use within the short timelines. To achieve this, project
implementers and administrators have to effectively track the performance of the project at
every level which in some instances may require a change in the way the project is
implemented. This process is done through proper and timely collection of information and
communicating the same.
Monitoring is the continuous process of collecting and analysing project data during the course
of the project which helps inform the progress of the project activities against set targets.
Evaluation is the intervallic collection of data at specific times of the project to assess the
medium term and long-term performance of the project as well as to assess the characteristics
of the project (Welsh et al., 2005). There are key attributes that are looked at in evaluating a
project, such as the relevance of the project outcomes to the target population, the efficiency
of the implementation process. In summary, evaluations describe the characteristics of the
project. To assess these components, evaluation can be conducted as formative to inform the
project and these are done mostly in the life of the project or summative which are done at the
end of the project. Four approaches are adopted in evaluating a project which include,
assessment of the knowledge, attitudes and practices, after action reviews or participatory
assessments to assess the intentions expressed by the audience and behaviour changes in the
short term and lastly policies initiated by the project (Hunter, 2009).
Implementation of M&E in project management is guided by four kinds of frameworks.
Logical framework presents the linkage between activities to outputs, outcomes and the impact
with clear indicators for measuring them and their means of verification in a matrix form.
Theory of change on the other hand is the logical presentation of the project and a strategy on
how to achieve the desired project impact. In addition, a conceptual framework may be used
by project managers to comprehensively understand the relationship between the different
outcomes and activities of the projects. Lastly is the result chain which typically links the
2
different result levels in a matrix form (Hunter, 2009). Therefore, such a system that shares
info and integrates outcomes with a view of enhancing prevention and response plan, is a
combination of these tools and the resources needed to implement them including the human
resource, ICT materials, logistics and the buildings to accommodate the M&E team (Chaplowe,
2008).
Governments, cooperate business and non-governmental organizations around the world
endeavour to support the nations achieve sustainable socioeconomic development. This calls
for greater accountability through evidenced based programming through rigorous M&E.
Countries like USA, China, and Germany have employed policies to standardize result-based
programs for sustainable development through building robust M&E systems (Koffi-Tessio,
2012).
The constitution of Kenya decentralizes activities and responsibilities to the Counties. This
included allocation of funds to implement development projects. These counties have
implemented several development projects with huge investments. However, the success of
these projects in achieving the desired goals have not come out clearly pegging the question on
whether evidence of the project performance is tracked and documented. This has seen cases
of misappropriation of funds and subsequent court cases on corruption in the counties with
unfinished or substandard projects. In order to clearly understand implementation of result-
based programs in the counties, the present study sought to assess the influence of M&E on the
performance of county government projects, with a focus in the devolved public offices in
Makueni.
1.2 Statement of the Problem
According to Kusek & Rist (2004), a number of establishments view the component of M&E
as a donor prerequisite and not as a vital factor in their internal control systems. As a result, the
design and implementation of the overview schemes are merely formal and intended to meet
financiers demands and not to improve the current and future productivities and subsequent
influences on beneficiary targets. A study by Nyonje, Ndunge & Mulwa (2012) also supports
this position by noting that in spite of several studies providing evidence on the positive impact
of monitoring and evaluation in program performance, a number of institutions have not
adopted the same. This slow uptake is attributed to low confidence in M&Es impact in project
performance. Equally, the information dearth in regard to the critical components of M&E: the
role of management, stakeholder participation, availability of funds and capacity building
influence project performance.
3
Functions were decentralized to the counties so that the counties can implement socioeconomic
and development programs to improve the wellbeing of the residents of those counties (GoK,
2012). The two levels of county government including the executive and legislature provide
leadership and strategic steps to ensure these programs succeed in achieving the desired
objective. Through the county integrated development plans, the counties outline the objectives
and strategies to achieve those objectives in the form of a logical framework and it also captures
the M&E approach for these programs. Despite all these interventions, and plans, ten years
down the line there are a multiple inactive/incomplete project that have been launched by the
governors and devolved leadership with allegations resulting in prosecution of some county
leaders as a result of misappropriation of funds meant for these projects. This exposes the gaps
in the impacts of M&E on the utilization of these county projects, which the study sought to
assess.
1.3 Purpose of the Study
The investigator intends to inspect the aspects that determine the performance of M&E
activities on county government projects in Makueni.
1.4 Objectives of the Study
The themes to be investigated were;
i. To establish the role of management in performance of M&E systems for Makueni
County Government projects
ii. To evaluate the influence of human resource capacity on performance of M&E systems
for Makueni County Government projects
iii. To examine the effect of financial resources on the mechanisms of monitoring and
evaluation in Makueni County Government projects
iv. To assess the influence of stakeholder participation on performance of M&E systems
for Makueni County Government projects
1.5 Research Questions
The researcher addressed the following study questions;
i. What is the influence of the role of management on performance of M&E systems for
Makueni County Government projects?
ii. Do the workforce capacity impact M&E operations and outputs in the realisation of
projects in Makueni County?
iii. Do the financial resources affect the performance of monitoring and evaluation systems
in the Makueni county government projects?
4
iv. What is the influence of stakeholder participation on performance of M&E systems for
Makueni County Government projects?
1.6 Research Hypothesis
H11: There is significant relationship between the role of management and performance of
M&E systems for Makueni County Government projects.
H12: There is significant relationship between human resource capacity and performance of
M&E Systems for Makueni County Government projects.
H13: There is significant relationship between availability of funds and performance of M&E
system for Makueni County Government projects.
H14: There is significant relationship between stakeholder participation and performance of
M&E systems for Makueni County Government projects.
1.7 Significance of the Study
The discoveries from the thesis investigations may provide relevant evidence and information
for enhancing the design of M&E policies and systems in the county. The results may also
provide proof of relevance of such a tool that is necessary for organizational accountability and
transparency.
The study will help in understanding the need to have budget allocation of funds meant for
M&E process and purposefully use it for effective operation of the projects. It will also help
promote capacity building of the staff involved, ensuring they are well equipped with the
necessary skills through training.
Finally, this study will be an important contribution to knowledge on the four factors studied
and how they influence performance of M&E systems for county government projects. This
information would be available for reference and further research by future scholars in the same
area.
1.8 Delimitation of the Study
The investigations was restricted to the County Government projects in Makueni County. It
sought to establish the role of management, human resource capacity, availability of funds and
stakeholder participation in effecting the efficacy of M&E systems on projects. The study was
further restricted to seeking answers to specific research questions hence a questionnaire was
deployed in sourcing data and information.
5
1.9 Limitations of the Study
This research was conducted in Makueni County for projects in Kathonzweni Ward. These
projects may not allow generalization to other county projects. However, the study may be
applied to other county projects with similar characteristics.
During the data collection process, some of the participants had tight schedules hence being
unavailable, while others lacked enough time to fill the questionnaires. This made it difficult
to ensure effectiveness in data collection process. Nevertheless, the researcher addressed these
limitations by enabling the respondents to fill in the necessary responses at own time. In this
regard, a drop then later pick method was used. Afterwards the researcher made follow-up to
ensure the tools were correctly filled.
Another limitation was the reluctance of some of the respondents to disclose information
concerning county government projects. This prompted an in-depth explanation of the study
purpose and potential benefits by the investigator. Moreover, an assurance on subject
confidentiality was also done in order to mitigate this limitation.
1.10 Basic Assumptions of the Study
The investigations made assumption with regards to the ability of the respondents to factually
and reliably provide valuable information was to be used to generate the research project report,
sufficed. The respondents demonstrated a clear understanding of managing projects and the
importance of monitoring though their level of comprehension on the technicalities with M&E
are not advanced and as such they presented different perceptions and understanding of the
M&E processes with inspection taking the centre stage.
1.11 Definitions of the Significant Terms
Management: Is the process of administering and controlling the affairs of the organization,
irrespective of its nature, type, structure and size
Human resource capacity: A measure to ensure that an organization has enough qualified
people in the right place at the right time to achieve its objectives
Stakeholder participation: This refers to the act of ensuring all the parties affected by a
project, both directly and indirectly, are involved to give views in the process of
decision making.
Evaluation: This is the periodic and objective collection of data and analysing them to assess
the characteristics of a project and its bearing on human livelihood.
M&E System: A set of tools, resources and procedures working jointly to ensure
accountability in project implementation
6
Monitoring: Is the continuous structured collection of data to assess the progress of the project
against set targets and timelines
Funds: an amount of money that is collected or saved for a unique goal
1.12 Organization of the Study
The structure of this thesis consists of five independent chapters, with the first presenting the
background of the study as well as the statement of the problem which brought out the
knowledge gap that the study was expected to address. Chapter one further describes various
elements including the intentions, goals and queries that the investigator wishes to address. The
premises and relevance of the investigations, together with limitations, basic assumptions, and
definition of noteworthy footings is also discussed in the episode.
The succeeding chapter explores the existing evidence, both in experimental and theoretical
terms, and their relevance in informing the investigator on his background. The chapter further
builds the academic foundation upon which the findings and conclusions are drawn. Finally,
the section discusses the knowledge gap in related extant knowledge.
The third episode describes the philosophical framework that informs the choice of design,
approaches, methods, processes and procedures applied to source, process and analyse data.
Also, the type of population, sampling procedures and quality inspections such as validity and
reliability are discussed.
The fourth chapter presents the findings, which have been aligned according to the aims of the
investigations. The final section provides a detailed summary of results, conclusions and
recommendations for policy and programming interventions; contributions in the field of
monitoring and evaluation and possible gaps that need further academic research.
7
CHAPTER TWO
LITERATURE REVIEW
2.1 Introduction
The relevance of an in-depth evaluation of extant knowledge is captured in this episode.
Specifically, the inter-related sub-themes discussed include; the role of management, human
capacity, availability of funds and stakeholder participation.
2.2 Concept of Monitoring and Evaluation System
The notion of monitoring is a continuing process of information collection and analysis
enabling comparison on effectiveness of a project, policy or program implementation against
projected outcomes. This is aimed at providing stakeholders and project coordinators with
constant feedback and early signals of advancement or their absence towards achieving
envisioned outcomes (Adra, 2007).
According to Uitto (2004), evaluation is a structured methodical approach for assessing a
project that is in progress with a view of realising the intended goals. M&E should offer
comprehensive and related data that will be of great significance in decision making (Jody &
Ray, 2004). Evaluation serves several functions such as providing information that informs the
design and execution of processes of decision making, setting targets, budgeting, facilitation,
workforce and (Mulwa, 2008). In addition, the project managers are in a position to learn from
the past, thereby helping them to develop new skills and improve on future plans.
M&E system just like any other system is constituted by tools, techniques, resources and ideas
working together to ensure that projects and programs are adequately monitored and results
documented to inform their implementation (Kerzner, 2013). Documenting performance of the
projects/programs are essential elements to ensure accountability and as a learning process for
implementation of similar projects. This involves understanding the strength, weakness,
opportunities and threats of the project (Spaulding, 2014).
Resources are therefore allocated to acquire materials in terms of information technology,
vehicles, stationary, staffing and even to facilitate movement. Project managers will develop
tools, policies, guidelines and techniques that will use the allocated resources to objectively
monitor and evaluate the projects with evidence (Nyonje, Kyalo & Mulwa, 2015). Some of
these strategies are inculcated in the organizational policies, structures and SOPs informing
allocation of resources, staffing and the communication structure. These components will work
in tandem to form a system for ensuring project accountability. And effectiveness of this system
8
will be evaluated by its ability to provide reliable information for project managers to make
informed decisions regarding performance of the project (Briceno, 2010).
There has been evidence from previous studies that quite a few programs in Kenya have had
successful M&E systems with as low as 39% having documented and published M&E results.
The recommended funding allocation for M&E processes and activities per each project
globally is 3%-5% which is not the case with many projects in Kenya including county and
national government projects with quite a few, if any, having dedicated M&E staff/department.
M&E systems and policies should be integrated into the project management cycle and should
remain in place even after the completion of the program. The constant streaming of vital data
in the stages of design to implementation of the project by M&E systems provides valuable
feedback to the management and as such, the impact of the program remains in check.
2.3 Role of Management Influence on Monitoring and Evaluation
Management influence is categorized in two forms. The first level is the top organizational or
county management that is mandated to set up structures, policies and the funding strategies
for the different sections and departments in the organization. They set the data needs and the
data required as they are going to use that information (Care, 2012). They are thus the
paramount strategists and policy makers with ability to influence assessment processes. In
addition, this is the team mandated to approve M&E plans, SOPs, Policies and even reports for
wider sharing and publishing. They inculcate the M&E culture in the organization among staff.
For example, the director or chief executive officer of an organization is solely responsible for
ensuring credible information about the organization projects is shared with evidence of the
performance and lessons learnt and this has to be done efficiently through competent and well-
resourced M&E (World Bank, 2011).
Secondly is the project implementation management team that puts the resources, structure,
policies and procedures into play. This management does the regular and period collection of
M&E data and information and analyses it to generate reliable and viable reports that that top
organizational management can rely upon to make informed decisions (Gaitano, 2011). At
some point, they are also the consumers of regular monitoring reports that informs them on the
performance of the project in terms with the set work plan, budget and project performance
targets. They entice the M&E staff through motivation, coaching and capacity building to
effectively deliver their role. So project managers are like the heart of the M&E system that
has to make it function.
9
Chaplowe (2008) opines that during the project cycle, the involvement of the management is
akin to guaranteeing ownership, awareness and sustenance of results and thus gaps that may
arise are duly settled. The close partnership between the program managers and stakeholders
promotes the frequent sharing of progress reports and thus the bottlenecks effectively sorted
out. Moreover, it is the responsibility of senior managers, supported by project managers, to
communicate results and information (Nyonje, Kyalo and Mulwa, 2015).
Management should ensure the existence of strategic frameworks that incorporate viable
oversight, cooperation in creating the rules, accountability and commitment to the design of
the system. Bloom, Standing and Joshi (2006) urges that accountability is a fundamental
component of governance that concerns the relationships between management and different
stakeholders who are responsible for the monitoring, financing and delivery of different
services.
In addition, the integrity of the program results is largely dependent on the M&E systems that
assess their life cycle (Ben, 2002). According to UNDP (2000), good leadership puts emphasis
on results and follow-up. It tracks the progress and records the report, and recommends and
follows up with decisions and action.
2.4 Staff Capacity Influence on Monitoring and Evaluation
The project personnel who are rich in qualifications and management expertise are central for
the generation of credible results. The World Bank (2011) supports this view by recommending
that organizations need to build an efficient monitoring system together with evaluation
approaches around qualified personnel. This is because the efficacy of such a scheme is largely
influenced by the quality of the management workforce.
The capacity of staff employed to undertake M&E activities should match the desired
objectives of the system (Iravo, 2013). At the minimum, the staff need to have background
knowledge, skills and attitudes to implement the M&E processes set out in the system. At the
minimum, these are set out in the recruitment job description of the staff and the human
resource and recruiting team look for these qualities during recruitment. Once employed, the
staff is taken through an induction process of the company policies, procedures and systems
for them to understand their obligations.
Ngatia (2015) claims that for sustainability of M&E systems, building human capacity is
paramount. In addition, M&E training and development both formal and informal is critical for
objective monitoring and evaluation of programs because trainings lead to attitude change,
knowledge and capacity to do a SWOT analysis of the project. An extensive training and
10
induction are vital in building necessary skills that are essential for carrying out M&E. There
are no quick fixes in training, it is long term and continuous. In addition, a number of
administrative resources such as training manuals have been developed for NGOs staff so as
to strengthen their awareness level in M&E (Hunter, 2009). These instructive resources have
practical examples of ideal M&E settings and thus are useful in inculcating an efficient and
effective culture that promotes positive impacts of projects undertaken (Shapiro, 2011).
After induction development needs of the staff are identified and a plan is drafted between the
employee and the supervisor on how these needs are to be achieved. In line with the
development needs a participatory work plan between the employee and the supervisor is
developed with periodic review to ensure the desires of the system are achieved.
To support the staff to achieve the set work and development plans, there are aspects that have
to be checked and must work in harmony. The working environment is the first setup that
allows the staff to actively deliver effectively and efficiently. For example, is there a well-
equipped office for the M&E staff to operate from? Is the project implementation area safe for
collection of M&E data? Is there support from the project implementation team for M&E staff?
The second aspect is staff motivation. It is evident that well-motivated staff go an extra mile to
deliver on what is expected of them (Irvo, 2013). In effect, when all these aspects come into
play and qualified staff are employed, their delivery of M&E activities will be effective.
2.5 Availability of Funds Influence on Monitoring and Evaluation
According to Magongo (2004), M&E activities are independent to program happenings and as
such, a separately clear budget line is needed to overseer the assessment events. Kelly and
Magongo (2004) estimates that a proportion of about 5 to 10 percent of the program funds
should be steered towards the establishment of an effective monitoring and evaluation unit.
However, Gitonga (2012) points out that there is no explicit fraction that should be allocated
for M&E but, depending on the project and the overall budget, it varies between 2.5% to 10%.
In essence, a fairly proportionate amount of project resources should be enough for credible
M&E system, since the undertakings of monitoring should not jeopardise program goals in
terms of resources. The cost of evaluation activities should be properly estimated and planned
at the project design phase Chaplowe (2008). Mugambi and Kanda (2013) suggest that the
allocation of resources for M&E activities should be undertaken in a controlled manner to
ensure that it poses no challenge to the implementation of an organization’s strategy.
With the devolution of activities to the counties, the counties enjoy some autonomy in
managing their budgets and sourcing for funds. The counties are at liberty to impose charges
11
as a means of collecting revenues they can use to implement projects (Gitonga, 2012).
Availability of these funds will allow the organization to not only hire qualified M&E staff,
but also source for supporting devices like computers, phones as well as procure office
materials that will support M&E activities.
The Kenya Ministry of Finance’s Public Finance Management Reform Coordinating Unit
(PFMR, 2008), describes various tracking systems to be part of the overall administration
toolkit. Every public department should have the three inter-related tier systems in charge of
finance, human resource and accountability and should be tied to a proper feedback processing
unit. A results-based M&E evaluation system is fundamentally a special public management
tool that allows governments to measure and evaluate outcomes, and use this information for
decision making and governance. In conclusion, it provides information on progress toward
achieving the stated goals and targets to public sector managers. It also provides substantial
evidence that may inform mid-way adjustments in policies and processes.
The global recommendation is for projects to allocate at least 3% of the project funding to
support M&E activities (Mugambi and Kanda, 2013). However, over the years, concerns have
been raised regarding the constraint funding for M&E activities with as low as 0% funding for
M&E activities in the projects (Mushori, 2015).
2.6 Stakeholder Participation and Influence on Monitoring and Evaluation
Stakeholders can be internal or external who influence or are influenced by the project. They
have direct or indirect influence on the performance of the project (UNDP, 2009). First, they
are key in determining the needs of the beneficiaries that informs how the project is designed
(Patton, 2008). This is a key activity for M&E in formulating the project. Secondly, they
influence uptake of the project in the project area (Askari, 2014). In this implementation phase,
M&E staff will be able to carry out their duties with ease and even gather information from
these stakeholders in a participatory manner to triangulate the reports. As part of accountability,
M&E will seek to have beneficiaries mobilized for regular interviews or even to respond to
emerging compliments, complaints and issues, and this will solely be supported by the
stakeholders.
External stakeholders will heavily contribute to the quality of surveys them being key
informants and consumers of the reports for their references. Therefore, it is a prudent and
cardinal call for project implementers to involve all the stakeholders at all levels of the project
to have a successful project (Askari, 2014).
12
It was found out that stakeholder participation improves the quality of the programme and
offers the opportunity to address local development needs. This creates a sense of ownership
that promotes the likelihood of programmes and their impact sustainability. However, the
involvement stakeholders vary depending on the design of evaluation systems as well as the
established participatory approaches. UNDP (1997) states that in each instance, program
managers are responsible for deciding which set of stakeholders should be involved in a given
project, to what extent, and how. Nevertheless, the participation of stakeholders in evaluation
of projects is determined by the evaluation questions and the circumstances. Stakeholder
involvement in evaluations is mainly useful in coming up with solutions relating to
implementation difficulties.
Different stakeholders are involved at different stages of the M&E process. Some of them may
be involved making decisions while others only need to be informed on the process.
Stakeholder involvement in the entire M&E process promotes the transfer of skills,
development of skills and creation of shared knowledge and learning.
2.7 Theoretical Framework
The theoretical base for the research was the dynamic capabilities theory; theory of change;
and programme evaluation theories.
2.7.1 Dynamic Capabilities Theory
Teece, Pisano and Shuen (1997) define dynamic capability as the ability of organisations to
incorporate, reconfigure and build upon functional competencies and resources available to
them internally and externally, so as to deal with the constantly evolving environment. Barreto
(2010) equally describes the concept as the capacity to efficiently unravel issues based on risk
and gap analysis, and make objective decisions that are progressive and sustainable without
realigning project resources. Generally, core competencies of dynamic capability should be
applied in modifying short-term competitive positions that can then be applied in building
longer-term competitive advantage.
Building dynamic capabilities has a relationship with the organization’s ability to strategize,
its choice of organizational form and its established environmental and technological sensing
apparatus. Big companies in size and assets normally remain afloat beyond crises as compared
to smaller ones because of the tenets of stability that are considerable high.
The unity and streamlined alignment of the several components of the system influences its
effectiveness (Wang et al., 2007). This theory was deemed fit to guide this study in
13
understanding the importance of adequate budgetary allocations for M&E schemes for
operations and integration in the implementation of county projects.
2.7.2 Theory of Change
This theoretical model describes the strategies to achieve an anticipated impact (Perls, 2005).
It described the steps required for a change to be realized. For instance, in implementation of
county projects, the desired change is usually social and economic growth of the county
residents. The theory of change, critically and objectively, outlines the set of processes and
assumptions that will come into play to ensure the change is achieved. This includes
implementation of M&E activities and the required resources.
Rogers (2008) defines the concept as a set of abstract projections and assumptions about the
program output by the stakeholders, based on the scrutiny of the present settings in regard to
financial capacity, audit, community participation, decision making and tracing mechanisms.
The model also forestalls the likelihood of unforeseen risks during the project phases and
outline measures on how to address them amicably. This therefore makes the theory relevant
for this study as it informs the program drivers the prospects and uncertainties that characterises
the design, administration and implementation of project goals.
2.7.3 Program Theory of Evaluation
Program theory of evaluation was postulated by Donaldson in 2012. It evaluates the capacity
of the program to attain its goals. The philosophical concept guides the validation processes of
the projects cycle and highlights the crucial gaps that must be addresses in order to realise the
projected impacts and outcomes. Equally, it also summarises the key management components
that need focused attention during the course of evaluation.
The theory looks at the outcome of an M&E process in terms of providing valuable information
that guides decision making in project implementation. It presents the importance of data
gathering in decision making process (McClinttock, 1990). The theory in its form does not
however look at the allocation of resources to carry out the evaluations since it requires a lot
of dependence on data collection to direct the assessment process, and this may be costly for
projects working under tight budget.
2.8 Conceptual Framework
The independent variables were looked at in terms of the management’s role in M&E where
their role as organizational decision makers and validators of project reports, budgeters and
system designers were studied in depth. The second independent variable to be looked at is the
human resources capacity where the qualification of staff, staff motivation and capacity

14
building were looked at. Thirdly, availability of funds was looked at in terms of the amount of
funds, the M&E budget management and M&E finance monitoring. The last independent
variable looked at was stakeholders’ engagement where external and internal stakeholder were
looked at and their influence in the allocation of resources to M&E and the consumption of
M&E reports outcomes with implementation of recommendations from the reports. The
response indicators looked at the efficacy of M&E on county projects in Makueni where the
reliability of results, timeliness of reports, and achievement of set objectives were assessed.
This relationship was moderated by the organizational policy.
Moderating Variable Independent Variables Dependent Variable
Role of Management
Decision making
Resource allocation
System design
Human Capacity
Knowledge skills
Equipped office
M&E training
Availability of Funds
Separate budget
allocation
Adequacy/sufficiency
Timely allocation
Effective M&E of
projects
Relevant and useful
results
Achievement of
objectives
Economical use of
resources
Stakeholder Participation
Data collection
Planning design of
system
Use of feedback
Organization Policy
Figure 1: Conceptual Framework
15
2.9 Knowledge Gap
Table 2.1: Research gap
Variables Author Title of the Study Findings Knowledge gap identified”)
Role of
management
World Bank
(2011)
The role played by
management in
allocation of resources
in M&E”)
The managers determine the levels of
commitment and execution of the
organizations systems and processes
and as such, also control the M&E
activities
They also regulate the amount of
resources needed for the department
of M&E.
More emphasis was placed on the
regulation of resources in relation to
management control
Specific roles played by different
managerial levels in M&E was not
exhaustive.
Wanjiru
(2013) Determinants of
effective M&E Systems
in nongovernmental
organizations Within
Nairobi County,
Kenya”)
Role of leaders in M&E was
considered to be very important.
Management utilized information
from M&E in decision making
No reference to the identity of actual
roles played by different managers in
implementing M&E policies and
activities
The management responsibility
component in M&E is lacking
Human
capacity
Gorgens and
Kusek
(2009)
Making Monitoring and
Evaluation Systems
Work”)
The growing need for qualified
personnel and professional
development is inevitable since the
M&E frameworks and practices keep
evolving.
The study established that skilled
personnel are also a big challenge in
choosing M&E frameworks
Tengan, C.,
Aigbavboa,
C., &
Thwala, D.
(2018)
Conceptual description
of the key determinants
of effective monitoring
and evaluation system.
Actual results of M&E are hinged on
professional development of the
workforce
The impact of stakeholder inclusion
was not vividly expressed.
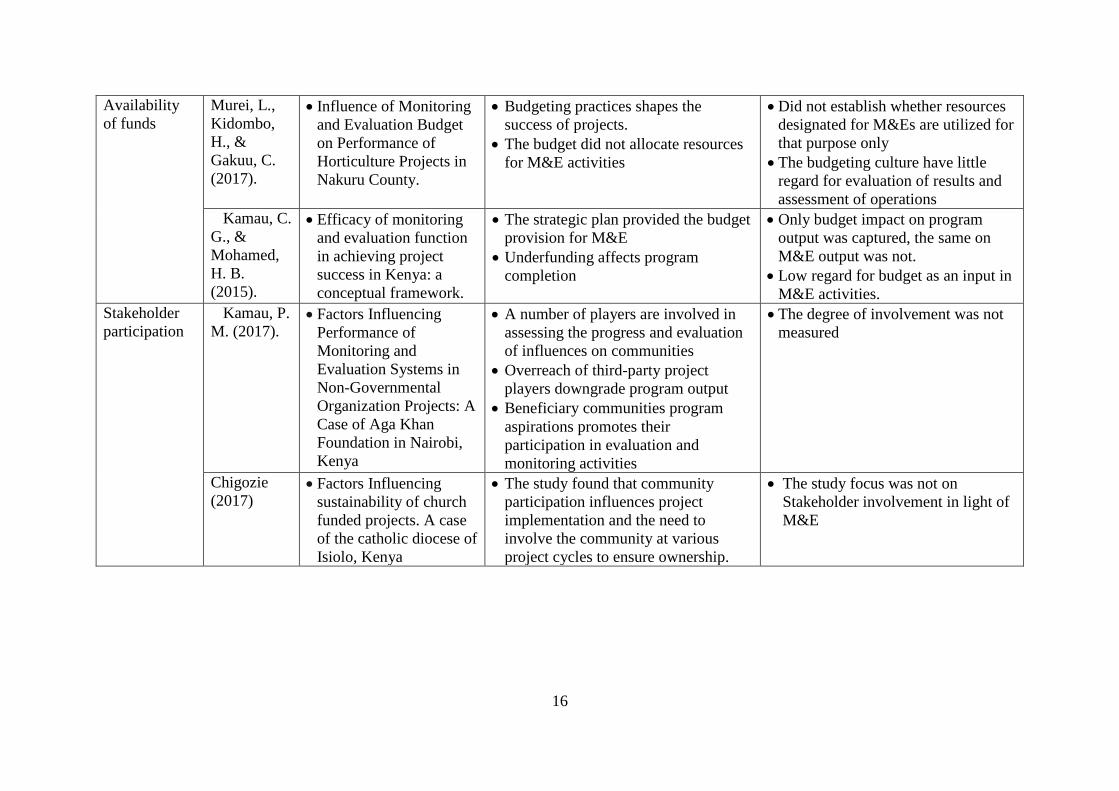
16
Availability
of funds
Murei, L.,
Kidombo,
H., &
Gakuu, C.
(2017).
Influence of Monitoring
and Evaluation Budget
on Performance of
Horticulture Projects in
Nakuru County.
Budgeting practices shapes the
success of projects.
The budget did not allocate resources
for M&E activities
Did not establish whether resources
designated for M&Es are utilized for
that purpose only
The budgeting culture have little
regard for evaluation of results and
assessment of operations
(“Kamau, C.
G., &
Mohamed,
H. B.
(2015).”)
Efficacy of monitoring
and evaluation function
in achieving project
success in Kenya: a
conceptual framework.
The strategic plan provided the budget
provision for M&E
Underfunding affects program
completion
Only budget impact on program
output was captured, the same on
M&E output was not.
Low regard for budget as an input in
M&E activities.
Stakeholder
participation
(“Kamau, P.
M. (2017).
Factors Influencing
Performance of
Monitoring and
Evaluation Systems in
Non-Governmental
Organization Projects: A
Case of Aga Khan
Foundation in Nairobi,
Kenya
A number of players are involved in
assessing the progress and evaluation
of influences on communities
Overreach of third-party project
players downgrade program output
Beneficiary communities program
aspirations promotes their
participation in evaluation and
monitoring activities
The degree of involvement was not
measured
Chigozie
(2017) Factors Influencing
sustainability of church
funded projects. A case
of the catholic diocese of
Isiolo, Kenya”)
The study found that community
participation influences project
implementation and the need to
involve the community at various
project cycles to ensure ownership.
The study focus was not on
Stakeholder involvement in light of
M&E
17
2.10 Summary of Chapter
The chapter discuss the various components and frameworks of theoretical and empirical bases
that underpins the study. A review of empirical literature on the elements that shape the
operations of assessment and evaluation activities in various devolved subdivisions in charge
of public projects, illustrated that a number of strategies are embedded in the policies, structures
and SOPs that inform the allocation of resources, staffing and the subsequent communication.
The components work in tandem to form a system for ensuring project accountability. The
system is evaluated by its ability to provide reliable information for project managers to make
informed decisions regarding performance of the project (Briceno, 2010).
It was evident from previous studies that quite a few programs in Kenya have had successful
M&E systems with, as low as 39% having documented and published M&E results. The
recommended funding allocation for M&E processes and activities per project globally is 3%-
5% which is not the case with many projects in Kenya, including county and national
government projects, with quite a few, if any, having dedicated M&E staff.
Theory of change looked at the organisational internal and external integration to solve
emerging and existing problems. It helped in understanding the importance of adequate
budgeting and funding for M&E activities and incorporation into county projects. Moreover,
this theory aided in conceptualizing how the organization handled external issues like
regulations and compliance in improving its M&E frameworks.
According to McClinttock (1990), program theory looks at the outcome of an M&E process in
terms of providing valuable information that helps in decision making by presenting the
importance of data. However, the theory does not look at the allocation of resources to carry
out the evaluation exercises that require a system to constantly collect information for
processing and analysis. The establishment of such mechanisms may not be possible in
initiatives that survive on a thin budget line.
18
CHAPTER THREE
RESEARCH METHODOLOGY.
3.1 Introduction.
The design and methodology that was adopted in performing the research is outlined in this
chapter. In addition, the scope of the research in terms of population, sample and the process
of gathering information as well as the ethics considered are also described.
3.2 Research Design.
This is a survey blueprint which informs the type of investigation processes in sourcing,
processing and analysing data (Gorald, 2013). It describes the procedure and plans that is
adhered to in responding to investigative queries. The investigator adopted descriptive research
model. This type of model of data collection from respondents was convenient since it did not
change the environment or manipulate any data or findings. It involved describing the subject
of the study without influencing the conclusion. Hence, descriptive design focused on getting
and giving accurate qualitatively and quantitatively evidenced information which was readily
available for analysis.
3.3 Target Population
The entire group of elements under query makes up the target population. It may include
individuals, objects, places and elements that may be the interests of investigations. Mugenda
& Mugenda (2009) opines that they offer materials necessary for addresses the aspirations of
the research.
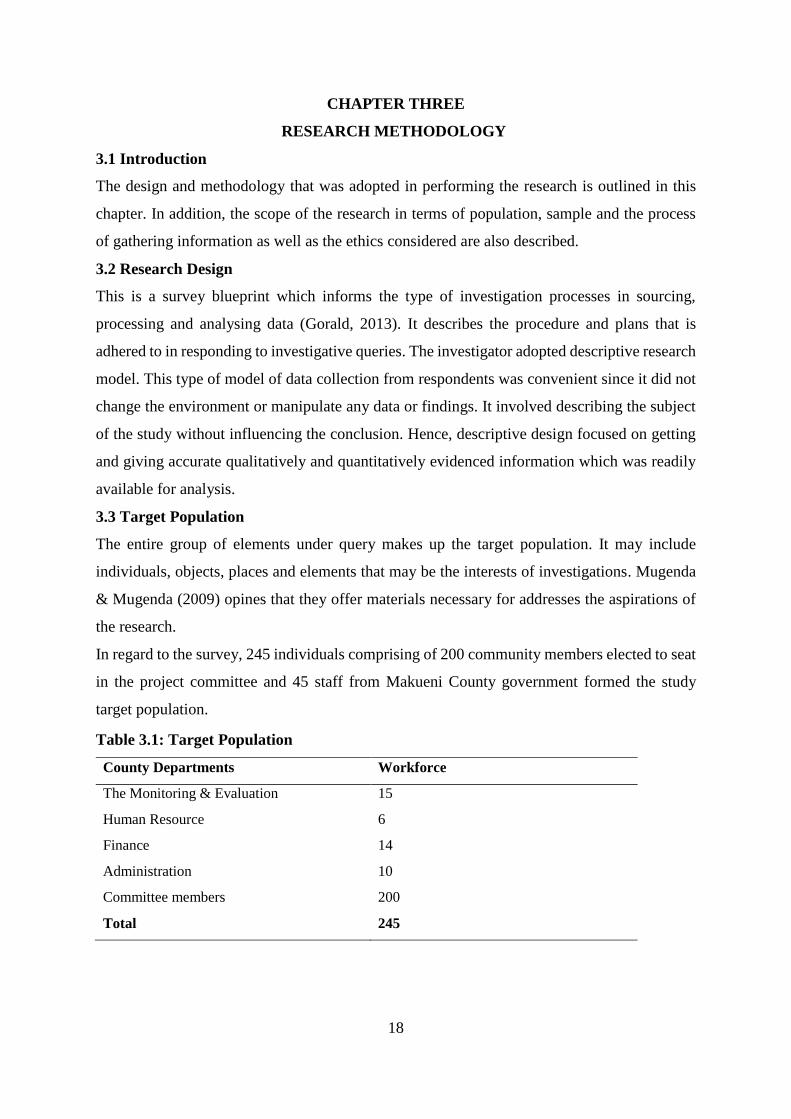
In regard to the survey, 245 individuals comprising of 200 community members elected to seat
in the project committee and 45 staff from Makueni County government formed the study
target population.
Table 3.1: Target Population
County Departments Workforce
The Monitoring & Evaluation 15
Human Resource 6
Finance 14
Administration 10
Committee members 200
Total 245
19
3.4 Sampling Procedure
145 respondents were sampled out of the respondents whom 100 are elected members of the
project committee comprising 50% of the total elected members to the project committees. The
100 elected members were selected through a mix of stratified, purposive and simple random
sampling. Another 45 respondents from the county staff were purposefully selected.
Table 3.2: Sample Size
Prospective set target Sample
Community members 100
County staff 45
Total 145
3.5 Data Collection Instruments
The main feedback tool that sourced the relevant first-hand information from the sampled
respondents was the questionnaire. The research instrument contained sets of perception
statements in which the selected PMC members were requested to indicate their views on a
five-point categorical scale. This ensured that the tool captured diverse but vital opinions on
M&E. Kombo and Tromp (2006) opines that questionnaires guarantees anonymity and privacy.
3.5.1 Pilot Testing
A structured survey material: questionnaire, was administered to 14 members of the project
management committee in Machakos County with a view to measure the consistency of the
tool. The subjects of the pretest were urged to offer suggestions regarding the instructions,
sensitivity and clarity of the queries and the flow of the questionnaire. The filled forms were
received along with the respondents’ comments and propositions. An analysis of the responses
was done and comprehension, the suitability of the wordings used, the arrangement of queries
and time needed to fill in responses; was measured. The revision of the survey instruments
verified its reliability and as such, the investigator was authorized to progress with the
administration to a larger target.
3.5.2 Validity of the Instrument
This is the level of accuracy and significance of deductions that the study findings produce. In
addition, it is the degree to representativeness of the research outcomes in relation to
phenomena under study. The validity of the inquiry tools is concerned with measuring what it
purports to quantify and nothing else.
In this study, various measures were taken to enhance validity of the tools, including
formulating questions using a simple and clear language, as well as subjecting draft tools to

20
scrutiny by the supervisors, other lecturers in the Department and colleagues. The comments
and suggestions provided by such reviewers were used to improve various aspects of the tools,
including clarity, content, language, instructions, and relevance of the questions to objectives
of the study, among others.
Kothari (2004) opines that the range to which a tool captures what it purports to measure is
what constitutes validity. A test-re-test was conducted over a period of 2 weeks to check the
ability of the content and construction of the data collection tools to measure what it was desired
to measure (Cherry, 2015).
3.5.3 Reliability of the Instrument
This is characterised as the degree to which am investigative tool produces unswerving
outcomes on several attempts. A test-retest technique was conducted on 14 respondents
selected for the pilot test. The researcher administered a structured questionnaire recurrently
on identical respondents over a time-gap of two weeks. The test scores of the two tests were
entered into SPSS and Cronbach’s Coefficient Alpha calculated to establish the correlation
amongst them. The Cronbach’s reliability coefficient of the research instrument was 0.825.
This output shows that the instruments of investigation were above the average threshold for
internal consistency.
3.6 Data Collection Procedure
The basis of establishing the validity and reliability of the data collection tools was to correct
and refine the tools as per the findings from the pilot study. Thereafter, the researcher recruited
and trained two research assistants who helped with administration of the tools to the
respondents. The assistants were introduced to the county officials during a courtesy call to
seek permission to conduct the survey and where the permits and introduction letters from the
Ministry of Education and University of Nairobi were presented and linkages established to
trace the targeted respondents. Thereafter, the data collectors were issued with temporary
identification documents and copies of the research permits for presentation in the event they
are requested in the field while collecting data. During the actual data collection, the researcher
dispatched the assistants to the field with periodic remote monitoring to ensure that the
assistants collected data and any emerging issues were dealt with in time. The filled
questionnaires were collected on a daily basis and a briefing done with the assistants to
establish any challenges and or emerging issues.
21
3.7 Data Analysis Techniques
The collected facts and figures were arranged into sub-categories, cleaned and corrected in
order to eliminate outliers. After the cleaning, SPSS Ver.22 was used to perform the descriptive
and inferential statistical analysis, which generated frequencies and percentages. The outcomes
were presented in means, standard deviation and percentages. Linear regression equation and
Ordinary Least Square method of estimation were used in the study to cultivate the relationship
between the independent and dependent variables at 95% CI.
The collected data was modelled and transformed with the help of Excel and SPSS to generate
frequencies in tables and charts that are interpreted to answer the research questions (Sharma,
2005).
3.8 Ethical Considerations
Creswell (2009) considered a number of ethical issues in research inter-alia; personal
disclosure, authenticity, credibility of the report and personal privacy of the respondents. He
further emphasizes the need of ensuring the participants are not exposed to risks and the
vulnerable populations are respected. Mugenda (2003) further highlights the need for voluntary
and informed consent to all participants and professionalism in the conduct of research. This
research was dedicated to academics only and high degree of professionalism and the ethical
issues cited above guided its conduct.

22
3.9 Operational Definition of Variables
Table 3.3: Variable Operationalization
Objectives Types of
variables
Indicators Measureme
nt scales
Methods of data
collection
Data collection
tools
Data analysis
technique
To establish the extent to
which role of management
influences performance of the
M&E system in County
Government project
Role of
management
(Independent
variable)
Decision making
Resource allocation
Ordinal Administering
questionnaire
Questionnaire Descriptive analysis and
Linear regression
analysis
To evaluate how human
resource capacity influences
performance of M&E Systems
in County Government
projects
Human resource
capacity
(Independent
variable)
Knowledge skills
Training
Ordinal Administering
questionnaire
Questionnaire Descriptive analysis and
Linear regression
analysis
To assess the impact of
budgeting models in the
efficacy of M&E for County
Government projects
Availability of
funds)
Timely allocation
Adequacy /sufficiency
Ordinal Administering
questionnaire
Questionnaire Descriptive analysis and
Linear regression
analysis
To assess how stakeholder
participation influences
performance of M&E
Stakeholder
participation
(Independent
variable)
Data collection
Planning design of
system
Ordinal Administering
questionnaire
Questionnaire Descriptive analysis and
Linear regression
analysis
Performance of
the M&E system
Relevant and useful
results
Achievement of
objectives
Economical use of
resources
Ordinal Administering
questionnaire
Questionnaire Descriptive analysis and
Linear regression
analysis
23
CHAPTER FOUR
DATA ANALYSIS, PRESENTATION AND INTERPRETATION
4.1 Introduction
The chapter discusses the results generated from the survey. The section begins with
questionnaire response rate as well demographic and background factors of the study subjects.
The section then provides the major findings on the influence of the role of management,
human resource capacity, availability of funds and stakeholder participation on the
performance of M&E.
4.2 Questionnaire Return Rate
The analysis revealed that of the 145 questionnaires, 128 were returned and out of these 93
were complete and thus usable for the analysis. This suggests that a response rate of 88.57
percent was achieved, which according to Babbie (2002), is above the minimum threshold of
50%, for accurate prediction of population parameters from the samples, as well as for making
valid conclusions.
Table 4.1: Questionnaire Return Rate
Research Instruments Frequency Response Rate
Returned 93 64.2%
Not complete 35 24.1%
Not returned 17 11.7%
Total 145 100.00%
4.3 The Respondents Demographic Profiles
The distribution of the participants’ profiles in relation to age, gender, work experience,
educational background and involvement evaluation activities offers the investigator an
understanding of the characters in the survey. Tables 4.2 to 4.6 shows the spread of participants’
demographics.
4.3.1 The Age group categories of the Survey Participants
The investigator asked the respondents to check from the list provided which category
described their age and responses tabled below.
Table 4.2: Summary Distribution of Participant Age
Category groups of Age Frequency (n) Frequency (%)
21-35 years 36 38.7
36-45 years 28 30.1
24
46- 55 years 18 19.4
56 years+ 11 11.8
Total 93 100.0
From the results, 38.7% reported that they are aged between 21 and 35, and 30.1% between the
ages of 36 and 45. Therefore, 19.4% and 11.8% of research participants were between 46 and
55 years of age and above 56 years old, and thus the biggest proportion of them were aged
above 36 years.
4.3.2 Gender of the Survey Participants
The responses tabulated below responded to an inquiry into the types of gender that participants
associated themselves with.
Table 4.3: Respondent’s Gender Distribution
Gender Orientation Numbers Percentages
Female 18 19.4
Male 75 80.6
Total 93 100
The analysis showed that 80.6% of the respondents reported being male while 19.4% reported
being female. In Makueni County, this means that more men work in the surveillance and
assessment of the county government projects than women, meaning that the equilibrium of
women was not taken into account.
4.3.3 The Work Experience of the Research Participants
The researcher requested the study responders to check from the boxes provided what period
they served in their positions and summary responses itemized.
Table 4.4: Work Experience of the Respondents)
No. of years worked Prevalence (n) Frequency (%)
Less than 3 years 27 29.0
3 to 5 years 27 29.0
More than 5 years 39 41.9
Total 93 100.0
The analysis indicates that 41.9 percent of respondents reported having over 5 years of work
experience, 29.0 percent of respondents had between 3 and 5 years of experience, and the
remaining 29.0 percent reported having less than 3 years of experience, indicating many
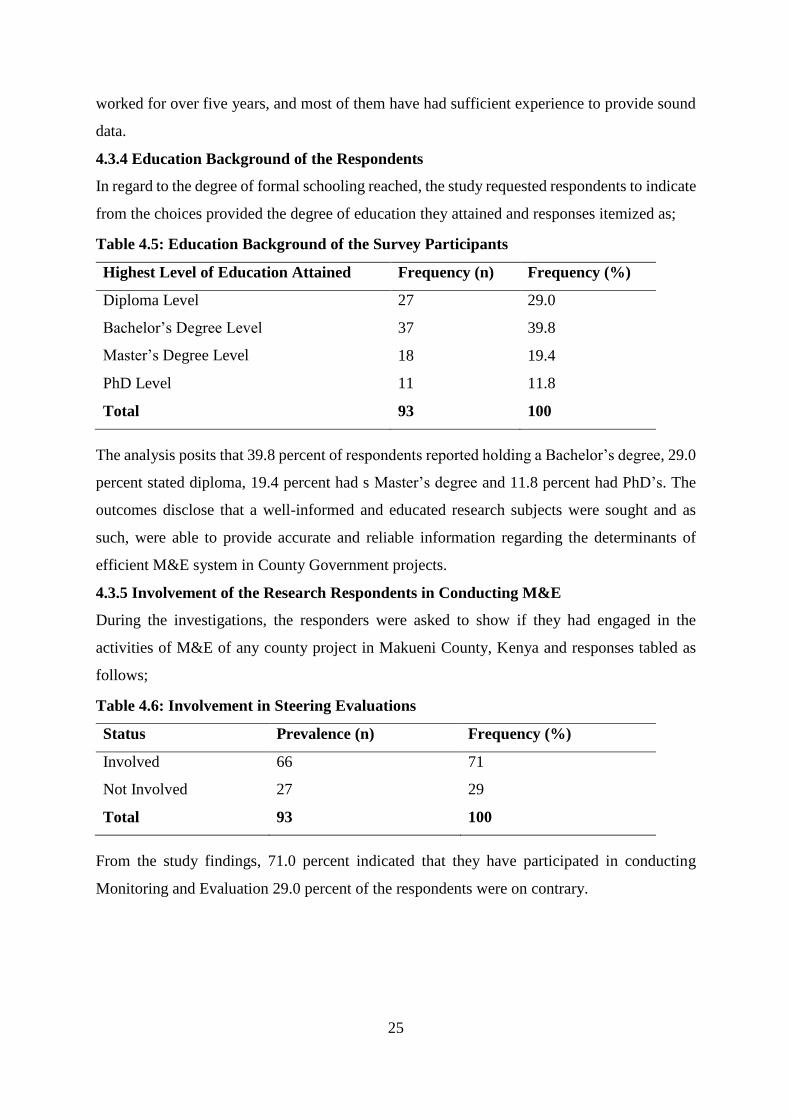
25
worked for over five years, and most of them have had sufficient experience to provide sound
data.
4.3.4 Education Background of the Respondents
In regard to the degree of formal schooling reached, the study requested respondents to indicate
from the choices provided the degree of education they attained and responses itemized as;
Table 4.5: Education Background of the Survey Participants
Highest Level of Education Attained Frequency (n) Frequency (%)
Diploma Level 27 29.0
Bachelor’s Degree Level 37 39.8
Master’s Degree Level 18 19.4
PhD Level 11 11.8
Total 93 100
The analysis posits that 39.8 percent of respondents reported holding a Bachelor’s degree, 29.0
percent stated diploma, 19.4 percent had s Master’s degree and 11.8 percent had PhD’s. The
outcomes disclose that a well-informed and educated research subjects were sought and as
such, were able to provide accurate and reliable information regarding the determinants of
efficient M&E system in County Government projects.
4.3.5 Involvement of the Research Respondents in Conducting M&E
During the investigations, the responders were asked to show if they had engaged in the
activities of M&E of any county project in Makueni County, Kenya and responses tabled as
follows;
Table 4.6: Involvement in Steering Evaluations
Status Prevalence (n) Frequency (%)
Involved 66 71
Not Involved 27 29
Total 93 100
From the study findings, 71.0 percent indicated that they have participated in conducting
Monitoring and Evaluation 29.0 percent of the respondents were on contrary.
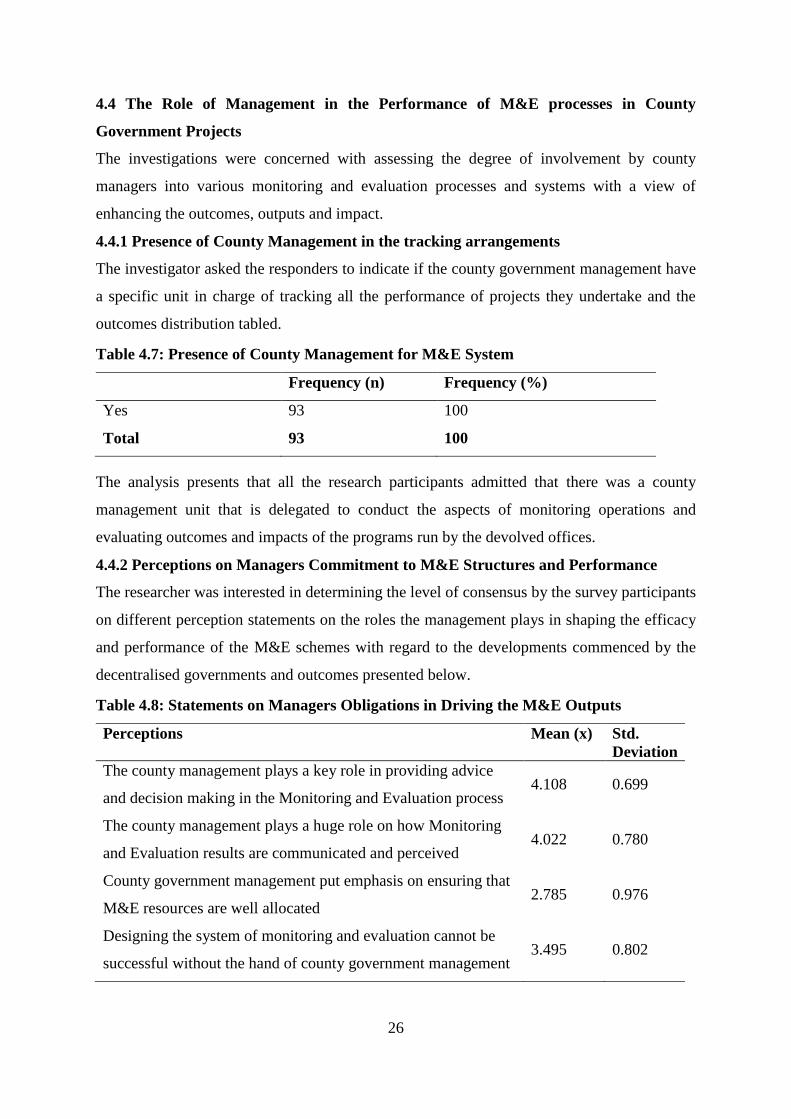
26
4.4 The Role of Management in the Performance of M&E processes in County
Government Projects.
The investigations were concerned with assessing the degree of involvement by county
managers into various monitoring and evaluation processes and systems with a view of
enhancing the outcomes, outputs and impact.
4.4.1 Presence of County Management in the tracking arrangements
The investigator asked the responders to indicate if the county government management have
a specific unit in charge of tracking all the performance of projects they undertake and the
outcomes distribution tabled.
Table 4.7: Presence of County Management for M&E System
Frequency (n) Frequency (%)
Yes 93 100
Total 93 100
The analysis presents that all the research participants admitted that there was a county
management unit that is delegated to conduct the aspects of monitoring operations and
evaluating outcomes and impacts of the programs run by the devolved offices.
4.4.2 Perceptions on Managers Commitment to M&E Structures and Performance
The researcher was interested in determining the level of consensus by the survey participants
on different perception statements on the roles the management plays in shaping the efficacy
and performance of the M&E schemes with regard to the developments commenced by the
decentralised governments and outcomes presented below.
Table 4.8: Statements on Managers Obligations in Driving the M&E Outputs
Perceptions Mean (x) Std.
Deviation
The county management plays a key role in providing advice
and decision making in the Monitoring and Evaluation process 4.108 0.699
The county management plays a huge role on how Monitoring
and Evaluation results are communicated and perceived 4.022 0.780
County government management put emphasis on ensuring that
M&E resources are well allocated 2.785 0.976
Designing the system of monitoring and evaluation cannot be
successful without the hand of county government management 3.495 0.802
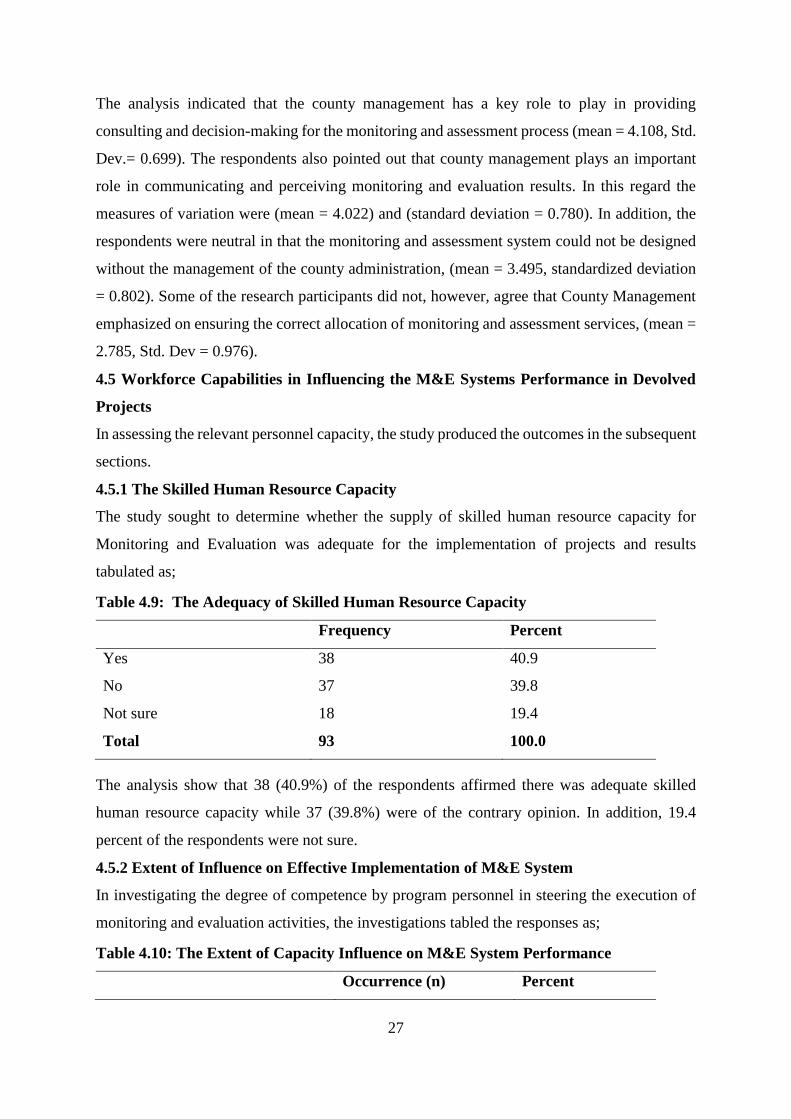
27
The analysis indicated that the county management has a key role to play in providing
consulting and decision-making for the monitoring and assessment process (mean = 4.108, Std.
Dev.= 0.699). The respondents also pointed out that county management plays an important
role in communicating and perceiving monitoring and evaluation results. In this regard the
measures of variation were (mean = 4.022) and (standard deviation = 0.780). In addition, the
respondents were neutral in that the monitoring and assessment system could not be designed
without the management of the county administration, (mean = 3.495, standardized deviation
= 0.802). Some of the research participants did not, however, agree that County Management
emphasized on ensuring the correct allocation of monitoring and assessment services, (mean =
2.785, Std. Dev = 0.976).
4.5 Workforce Capabilities in Influencing the M&E Systems Performance in Devolved
Projects
In assessing the relevant personnel capacity, the study produced the outcomes in the subsequent
sections.
4.5.1 The Skilled Human Resource Capacity
The study sought to determine whether the supply of skilled human resource capacity for
Monitoring and Evaluation was adequate for the implementation of projects and results
tabulated as;
Table 4.9: The Adequacy of Skilled Human Resource Capacity)
Frequency Percent
Yes 38 40.9
No 37 39.8
Not sure 18 19.4
Total 93 100.0
The analysis show that 38 (40.9%) of the respondents affirmed there was adequate skilled
human resource capacity while 37 (39.8%) were of the contrary opinion. In addition, 19.4
percent of the respondents were not sure.
4.5.2 Extent of Influence on Effective Implementation of M&E System
In investigating the degree of competence by program personnel in steering the execution of
monitoring and evaluation activities, the investigations tabled the responses as;
Table 4.10: The Extent of Capacity Influence on M&E System Performance
Occurrence (n) Percent
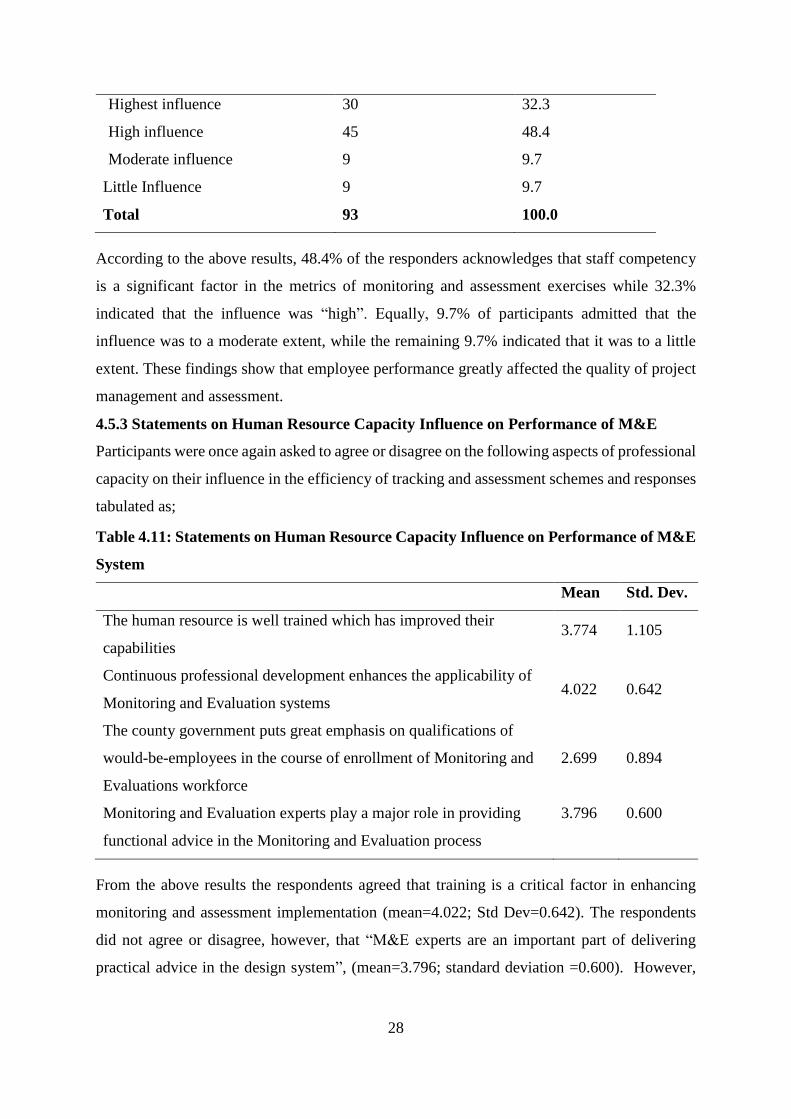
28
(Highest influence) 30 32.3
(High influence) 45 48.4
(Moderate influence) 9 9.7
Little Influence) 9 9.7
Total 93 100.0
According to the above results, 48.4% of the responders acknowledges that staff competency
is a significant factor in the metrics of monitoring and assessment exercises while 32.3%
indicated that the influence was “high”. Equally, 9.7% of participants admitted that the
influence was to a moderate extent, while the remaining 9.7% indicated that it was to a little
extent. These findings show that employee performance greatly affected the quality of project
management and assessment.
4.5.3 Statements on Human Resource Capacity Influence on Performance of M&E
Participants were once again asked to agree or disagree on the following aspects of professional
capacity on their influence in the efficiency of tracking and assessment schemes and responses
tabulated as;
Table 4.11: Statements on Human Resource Capacity Influence on Performance of M&E
System
Mean Std. Dev.
The human resource is well trained which has improved their
capabilities 3.774 1.105
Continuous professional development enhances the applicability of
Monitoring and Evaluation systems 4.022 0.642
The county government puts great emphasis on qualifications of
would-be-employees in the course of enrollment of Monitoring and
Evaluations workforce
2.699 0.894
Monitoring and Evaluation experts play a major role in providing
functional advice in the Monitoring and Evaluation process
3.796 0.600
From the above results the respondents agreed that training is a critical factor in enhancing
monitoring and assessment implementation (mean=4.022; Std Dev=0.642). The respondents
did not agree or disagree, however, that “M&E experts are an important part of delivering
practical advice in the design system”, (mean=3.796; standard deviation =0.600). However,

29
the respondents did not agree or disagree with the fact that the human resources were well
educated and that their skills have increased (mean=3.774, Std. Dev=1.105). The respondents
also disagreed that in the Monitoring and Evaluation staff recruitment process, the county
government places great emphasis on qualifications of individuals (Mean=2.699, Std.
Deviation=0.894).
4.6 Resource Allocation for the Performance of M&E System of County Government
Projects
The aim of the investigations was to investigate how the funds allocation shape the efficacy of
M&E systems in county government projects.
4.6.1 Main Source of Funding
The investigations sought to establish the main financiers of county government project’s main
source of funding and their outcomes scheduled as;
Table 4.12: The Funding Contributors
Frequency(n) Frequency (%)
County Government 39 41.9
CDF 18 19.4
Community 9 9.7
Donor/sponsor 27 29.0
Total 93 100.0
From the results, 41.9 percent of the participants indicated that they sourced funds from the
government, 29.0 percent indicated donor/sponsor and 19.4 percent indicated CDF. Also, 9.7
percent of the respondents got funds from the community. The findings indicated that the chief
financier in most projects was the government.
4.6.2 Perception Statements on Finance Availability Influence on Performance of M&E
System Associated Projects
The investigator aimed to explore participants’ perceptions on statements regarding the finance
of monitoring and evaluation systems in the devolved programs and summary outcomes tabled
as;
Table 4.13: Statements on Financial Commitments on Performance of M&E Schemes
Mean(x) Std. Dev
The project funds can operationalize monitoring systems and
evaluation processes. 3.893 0.827
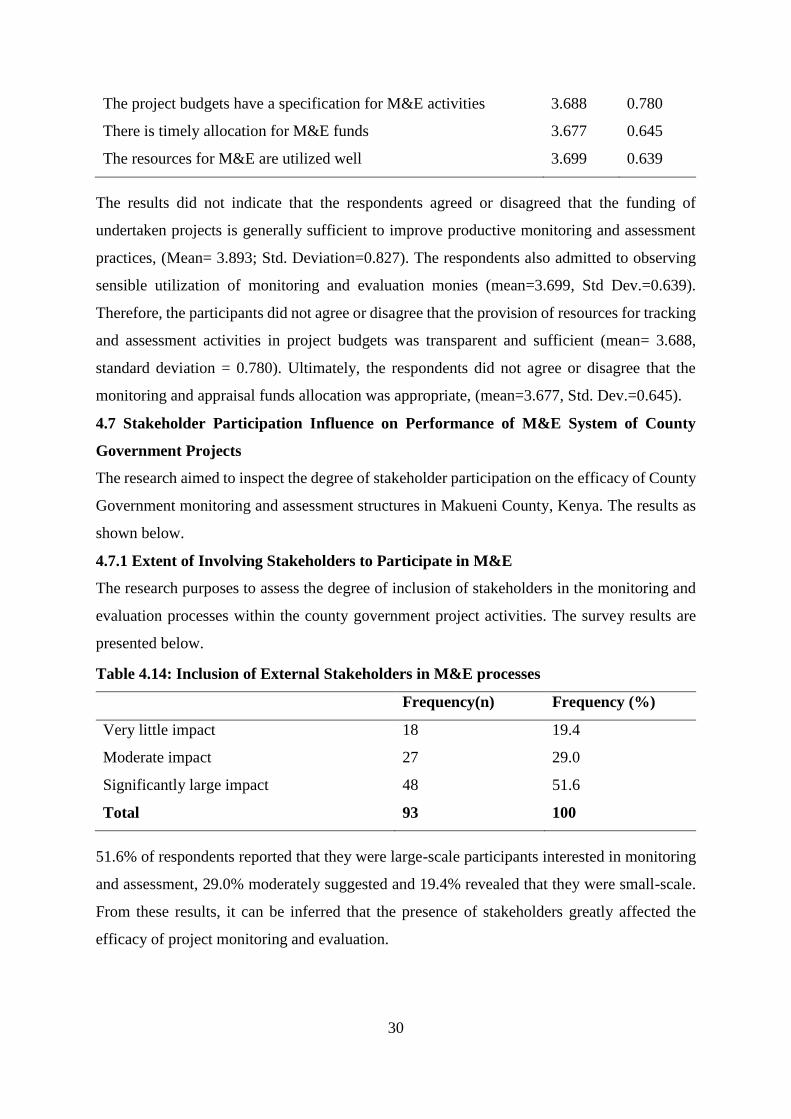
30
The project budgets have a specification for M&E activities) 3.688 0.780
There is timely allocation for M&E funds) 3.677 0.645
The resources for M&E are utilized well 3.699 0.639
The results did not indicate that the respondents agreed or disagreed that the funding of
undertaken projects is generally sufficient to improve productive monitoring and assessment
practices, (Mean= 3.893; Std. Deviation=0.827). The respondents also admitted to observing
sensible utilization of monitoring and evaluation monies (mean=3.699, Std Dev.=0.639).
Therefore, the participants did not agree or disagree that the provision of resources for tracking
and assessment activities in project budgets was transparent and sufficient (mean= 3.688,
standard deviation = 0.780). Ultimately, the respondents did not agree or disagree that the
monitoring and appraisal funds allocation was appropriate, (mean=3.677, Std. Dev.=0.645).
4.7 Stakeholder Participation Influence on Performance of M&E System of County
Government Projects
The research aimed to inspect the degree of stakeholder participation on the efficacy of County
Government monitoring and assessment structures in Makueni County, Kenya. The results as
shown below.
4.7.1 Extent of Involving Stakeholders to Participate in M&E
The research purposes to assess the degree of inclusion of stakeholders in the monitoring and
evaluation processes within the county government project activities. The survey results are
presented below.
Table 4.14: Inclusion of External Stakeholders in M&E processes
Frequency(n) Frequency (%)
Very little impact 18 19.4
Moderate impact 27 29.0
Significantly large impact 48 51.6
Total 93 100
51.6% of respondents reported that they were large-scale participants interested in monitoring
and assessment, 29.0% moderately suggested and 19.4% revealed that they were small-scale.
From these results, it can be inferred that the presence of stakeholders greatly affected the
efficacy of project monitoring and evaluation.
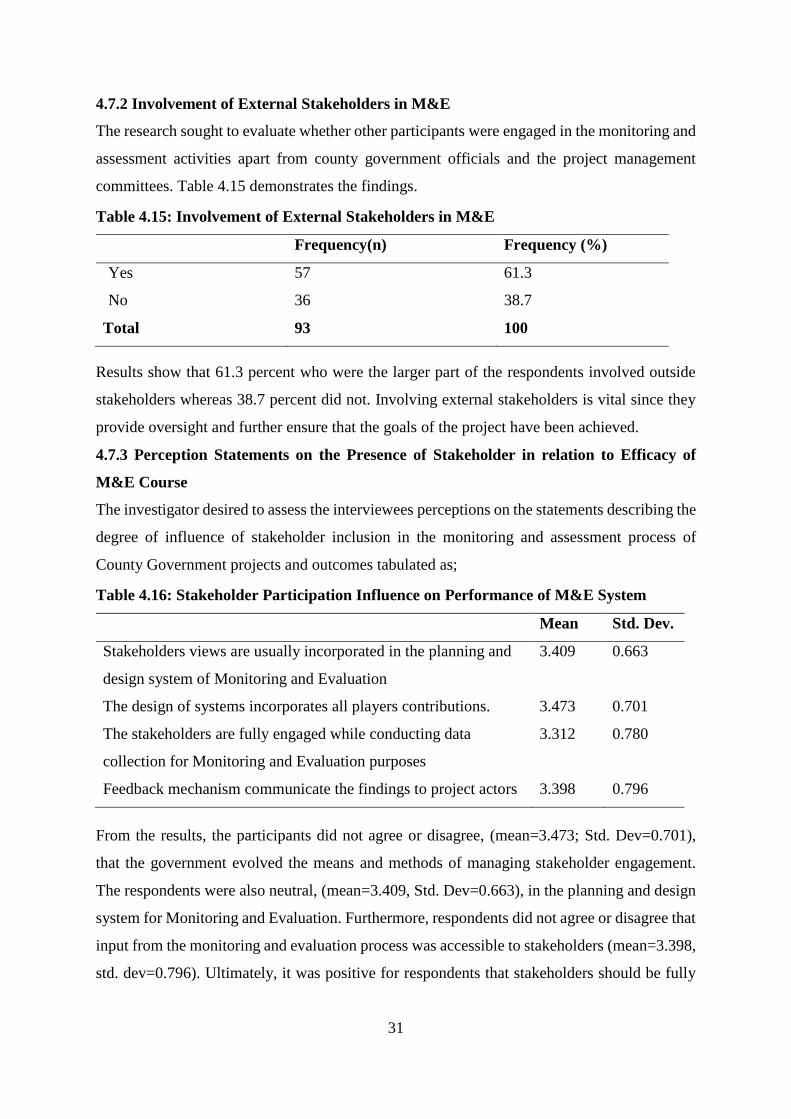
31
4.7.2 Involvement of External Stakeholders in M&E
The research sought to evaluate whether other participants were engaged in the monitoring and
assessment activities apart from county government officials and the project management
committees. Table 4.15 demonstrates the findings.
Table 4.15: Involvement of External Stakeholders in M&E
Frequency(n) Frequency (%)
(Yes) 57 61.3
(No) 36 38.7
Total 93 100
Results show that 61.3 percent who were the larger part of the respondents involved outside
stakeholders whereas 38.7 percent did not. Involving external stakeholders is vital since they
provide oversight and further ensure that the goals of the project have been achieved.
4.7.3 Perception Statements on the Presence of Stakeholder in relation to Efficacy of
M&E Course
The investigator desired to assess the interviewees perceptions on the statements describing the
degree of influence of stakeholder inclusion in the monitoring and assessment process of
County Government projects and outcomes tabulated as;
Table 4.16: Stakeholder Participation Influence on Performance of M&E System
Mean Std. Dev.
Stakeholders views are usually incorporated in the planning and
design system of Monitoring and Evaluation
3.409 0.663
The design of systems incorporates all players contributions. 3.473 0.701
The stakeholders are fully engaged while conducting data
collection for Monitoring and Evaluation purposes
3.312 0.780
Feedback mechanism communicate the findings to project actors 3.398 0.796
From the results, the participants did not agree or disagree, (mean=3.473; Std. Dev=0.701),
that the government evolved the means and methods of managing stakeholder engagement.
The respondents were also neutral, (mean=3.409, Std. Dev=0.663), in the planning and design
system for Monitoring and Evaluation. Furthermore, respondents did not agree or disagree that
input from the monitoring and evaluation process was accessible to stakeholders (mean=3.398,
std. dev=0.796). Ultimately, it was positive for respondents that stakeholders should be fully
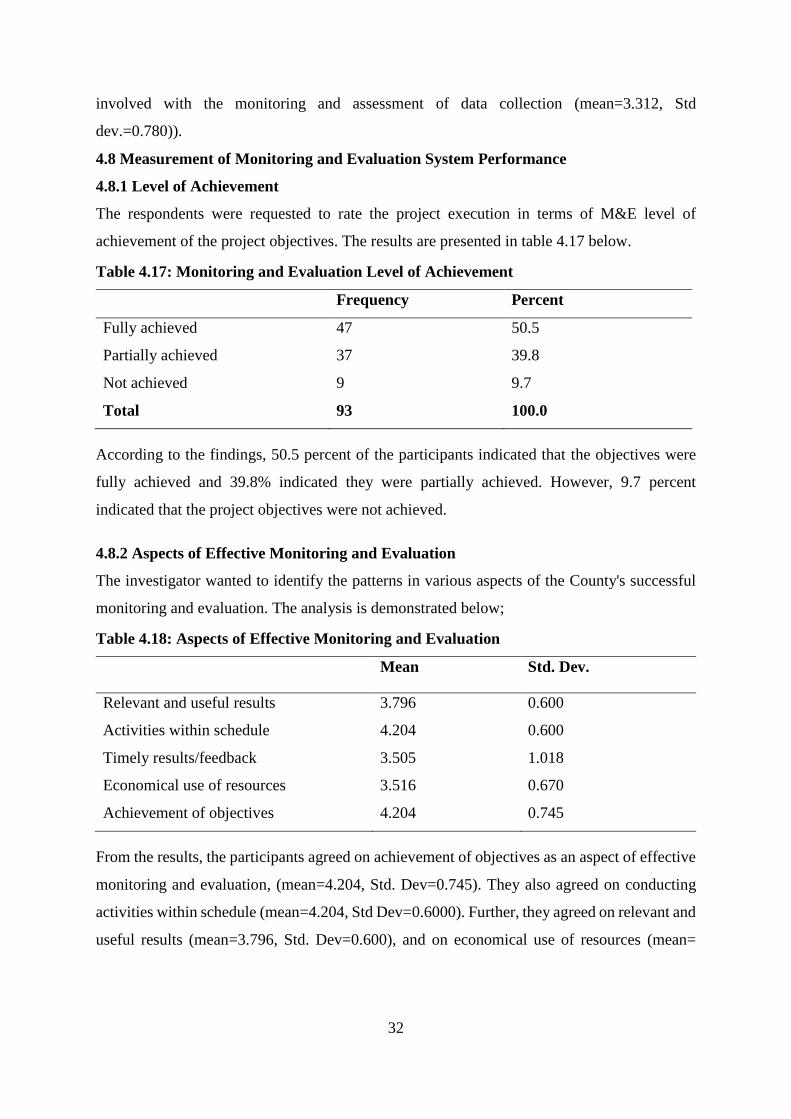
32
involved with the monitoring and assessment of data collection (mean=3.312, Std
dev.=0.780)).
4.8 Measurement of Monitoring and Evaluation System Performance
4.8.1 Level of Achievement
The respondents were requested to rate the project execution in terms of M&E level of
achievement of the project objectives. The results are presented in table 4.17 below.
Table 4.17: Monitoring and Evaluation Level of Achievement
Frequency Percent
Fully achieved 47 50.5
Partially achieved 37 39.8
Not achieved 9 9.7
Total 93 100.0
According to the findings, 50.5 percent of the participants indicated that the objectives were
fully achieved and 39.8% indicated they were partially achieved. However, 9.7 percent
indicated that the project objectives were not achieved.
4.8.2 Aspects of Effective Monitoring and Evaluation
The investigator wanted to identify the patterns in various aspects of the County's successful
monitoring and evaluation. The analysis is demonstrated below;
Table 4.18: Aspects of Effective Monitoring and Evaluation
Mean Std. Dev.
Relevant and useful results 3.796 0.600
Activities within schedule 4.204 0.600
Timely results/feedback 3.505 1.018
Economical use of resources 3.516 0.670
Achievement of objectives 4.204 0.745
From the results, the participants agreed on achievement of objectives as an aspect of effective
monitoring and evaluation, (mean=4.204, Std. Dev=0.745). They also agreed on conducting
activities within schedule (mean=4.204, Std Dev=0.6000). Further, they agreed on relevant and
useful results (mean=3.796, Std. Dev=0.600), and on economical use of resources (mean=
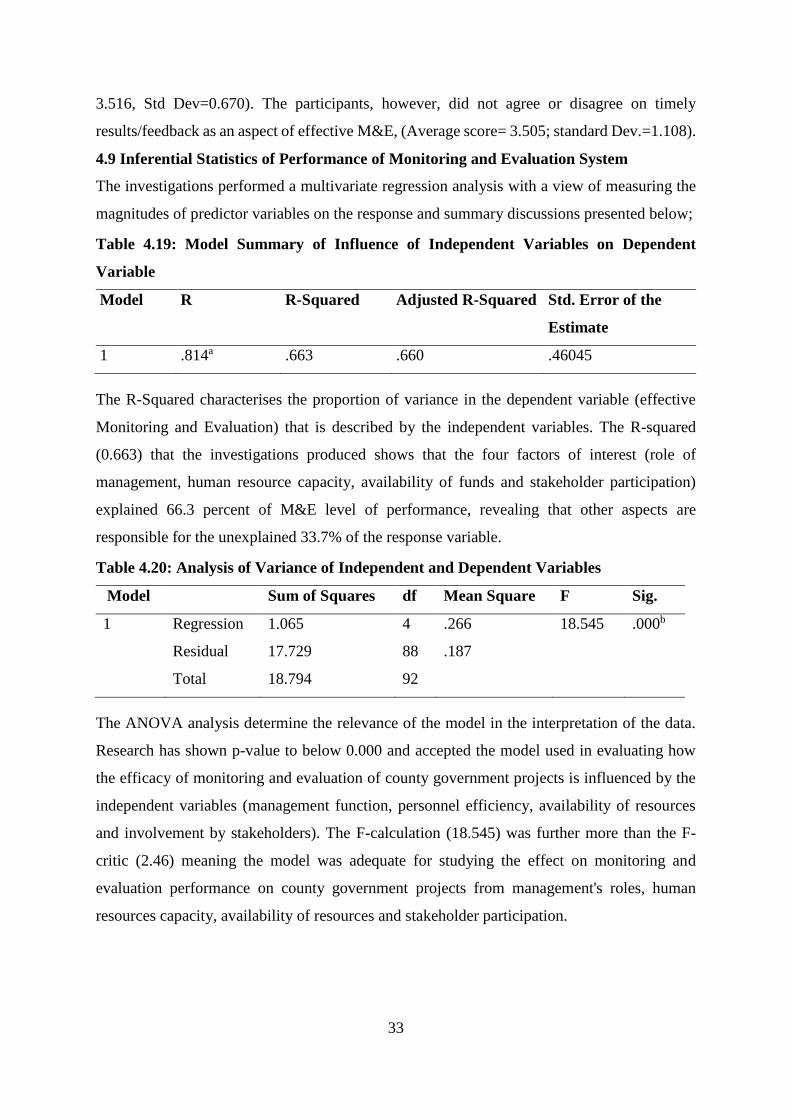
33
3.516, Std Dev=0.670). The participants, however, did not agree or disagree on timely
results/feedback as an aspect of effective M&E, (Average score= 3.505; standard Dev.=1.108).
4.9 Inferential Statistics of Performance of Monitoring and Evaluation System
The investigations performed a multivariate regression analysis with a view of measuring the
magnitudes of predictor variables on the response and summary discussions presented below;
Table 4.19: Model Summary of Influence of Independent Variables on Dependent
Variable
Model R R-Squared Adjusted R-Squared Std. Error of the
Estimate
1 .814a .663 .660 .46045
The R-Squared characterises the proportion of variance in the dependent variable (effective
Monitoring and Evaluation) that is described by the independent variables. The R-squared
(0.663) that the investigations produced shows that the four factors of interest (role of
management, human resource capacity, availability of funds and stakeholder participation)
explained 66.3 percent of M&E level of performance, revealing that other aspects are
responsible for the unexplained 33.7% of the response variable.
Table 4.20: Analysis of Variance of Independent and Dependent Variables
Model
Sum of Squares df Mean Square F Sig.
1 Regression 1.065 4 .266 18.545 .000b
Residual 17.729 88 .187
Total 18.794 92
The ANOVA analysis determine the relevance of the model in the interpretation of the data.
Research has shown p-value to below 0.000 and accepted the model used in evaluating how
the efficacy of monitoring and evaluation of county government projects is influenced by the
independent variables (management function, personnel efficiency, availability of resources
and involvement by stakeholders). The F-calculation (18.545) was further more than the F-
critic (2.46) meaning the model was adequate for studying the effect on monitoring and
evaluation performance on county government projects from management's roles, human
resources capacity, availability of resources and stakeholder participation.
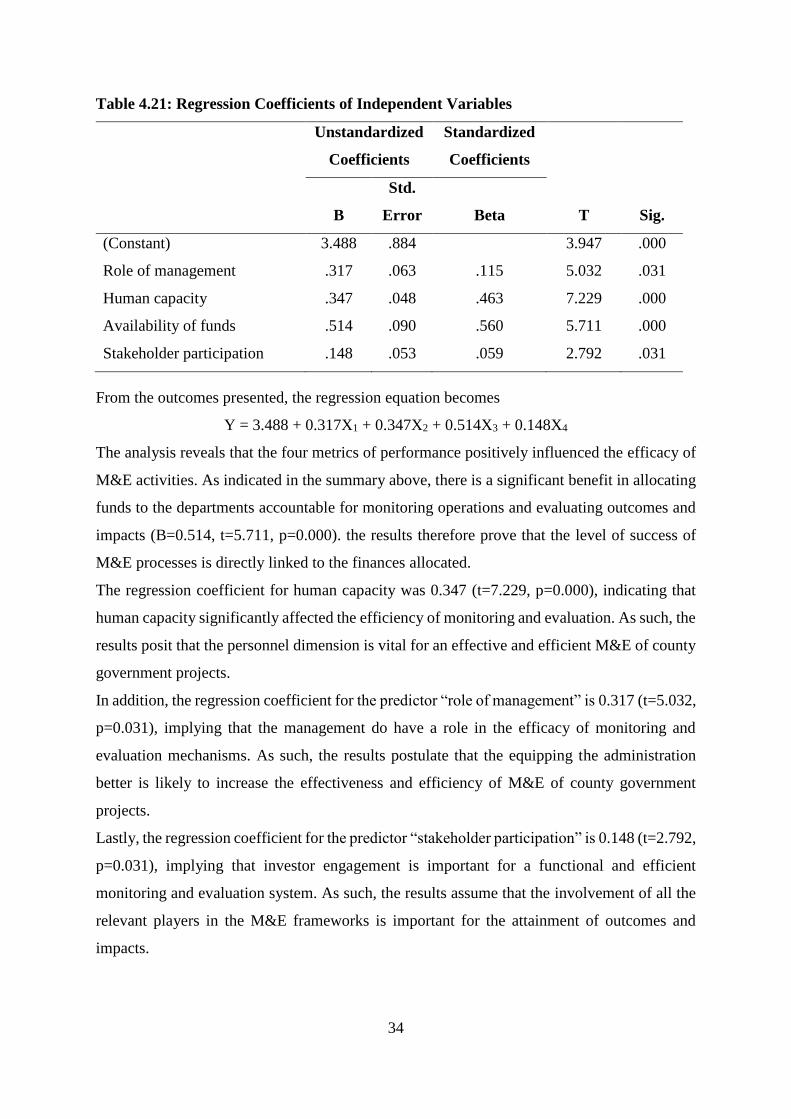
34
Table 4.21: Regression Coefficients of Independent Variables
Unstandardized
Coefficients
Standardized
Coefficients
T Sig. B
Std.
Error Beta
(Constant) 3.488 .884 3.947 .000
Role of management .317 .063 .115 5.032 .031
Human capacity .347 .048 .463 7.229 .000
Availability of funds .514 .090 .560 5.711 .000
Stakeholder participation .148 .053 .059 2.792 .031
From the outcomes presented, the regression equation becomes
Y = 3.488 + 0.317X1 + 0.347X2 + 0.514X3 + 0.148X4
The analysis reveals that the four metrics of performance positively influenced the efficacy of
M&E activities. As indicated in the summary above, there is a significant benefit in allocating
funds to the departments accountable for monitoring operations and evaluating outcomes and
impacts (B=0.514, t=5.711, p=0.000). the results therefore prove that the level of success of
M&E processes is directly linked to the finances allocated.
The regression coefficient for human capacity was 0.347 (t=7.229, p=0.000), indicating that
human capacity significantly affected the efficiency of monitoring and evaluation. As such, the
results posit that the personnel dimension is vital for an effective and efficient M&E of county
government projects.
In addition, the regression coefficient for the predictor “role of management” is 0.317 (t=5.032,
p=0.031), implying that the management do have a role in the efficacy of monitoring and
evaluation mechanisms. As such, the results postulate that the equipping the administration
better is likely to increase the effectiveness and efficiency of M&E of county government
projects.
Lastly, the regression coefficient for the predictor “stakeholder participation” is 0.148 (t=2.792,
p=0.031), implying that investor engagement is important for a functional and efficient
monitoring and evaluation system. As such, the results assume that the involvement of all the
relevant players in the M&E frameworks is important for the attainment of outcomes and
impacts.
35
CHAPTER FIVE
SUMMARY OF FINDINGS, DISCUSSIONS, CONCLUSIONS AND
RECOMMENDATIONS
5.1 Introduction
This chapter provides a summary of survey findings and draws conclusions in line with
objectives of the study. Also presented herein are recommendations for appropriate
interventions that should be considered by the relevant departments within the county
management. The chapter also highlights contributions of the study to knowledge, as informed
by the findings under each objective, as well as recommendations for further research, as
informed by gaps emerging in the findings, and/or delimitations of the study. Details are
provided in the following sub-sections.
5.2 Summary of the Findings
The investigations confirm that the four predictor variables significantly influence the efficacy
of M&E. The summary outcome for each is discussed in the succeeding sections.
5.2.1 Findings on the Role of Management
The study established that the management played a key role in providing consulting and
decision-making for the monitoring and assessment process as shown by the results (mean
score = 4.108; standard deviation =0.699). The management also played an important role in
communicating and perceiving monitoring and evaluation results, (mean score=4.022, standard
deviation 0.780). In addition, the respondents were neutral in that the monitoring and
assessment system could not be designed without the management of the county
administration, (mean =3.495; standard deviation =0.802). Finally, the outcomes reveal that
the roles that management plays are crucial for an effective M&E arrangement with regression
outcomes (B=0.317, p-value =0.031).
5.2.2 Findings on Human Resource Capacity
The investigation notes that 40.9 percent of the participants agreed that there was adequate
skilled human resource capacity. In addition, the results discovered that staff competency
significantly shapes the M&E input in project outputs and impacts. Equally, the investigations
reveal that trainings feature greatly in enhancing the implementation of Monitoring and
Evaluation, (mean =4.022, std =0.642). The regression analysis produced (B=0.347, p=0.000),
proving that a reliable workforce in terms of qualification, competence and size, was crucial
for an effective assessment and analysis of undertakings of the devolved governments.
36
5.2.3 Findings on Availability of Funds
The study found out that the majority of the funds were from the government as indicated by
41.9% of the respondents. 29.0% indicated donor/sponsor funds and 19.4% indicated CDF.
Also, 9.7 percent of the respondents indicated sourcing funds from the community. The
findings indicated that the chief financier in most projects was the government. A moderately
strong correlation was also revealed between the availability of funds and Monitoring and
Evaluation, (r=0.514, p<0.05).
5.2.4 Findings on Stakeholder Participation
The study indicated that 61.3 percent who were the larger part of the respondents involved
outside stakeholders whereas 38.7 percent did not. The regression coefficient for stakeholders’
participation is 0.148 at significance level of 0.031<0.05, showing that the association between
stakeholders’ participation and performance of monitoring and evaluation of county
government projects is significantly positive.
5.3 Discussion of Findings
The analysis proved a positive significant correlation between all the four independent and
response variables. The discussion of findings of this study is presented as follows.
5.3.1 Role of Management in Performance of Monitoring and Evaluation
The study showed that managers guarantees the success of assessment undertakings. The
Management played a very key role in providing advice and decision-making in the M&E
process and it also ensured that results were communicated and perceived. In addition, it
showed that designing of the system of monitoring and evaluation could not be successful
without the hand of county government management. Lastly, the study established that county
government management did not put emphasis on ensuring that monitoring and evaluation
resources were well allocated and did not offer adequate strong supervision and direction to
those conducting M&E. Management therefore has a duty in creating the best possible
environment for employees and stakeholders to consistently review the outputs and impacts of
the county, since they offer guidance (Shapiro, 2011).
The World Bank report (2011) also supports the view that program managers’ commitment is
vital in ensuring the tracking units are well resourced. Without the support and goodwill from
the management of an organization, the system would be poorly designed and operated and
thus ineffective. Khan (2003) suggested that all managers and leaders in an organization need
to develop interest in the aspects of assessment, since it directly affects their effectiveness.
37
5.3.2 Human Resource Capacity
The analysis proved an association between human capacity and performance of monitoring
and evaluation. It was found out that the human resource was well trained which improved
their capabilities which was vital for effective M&E. Experts played a major role in providing
functional advice and training which are central factor in enhancing the outputs of operational
processes. Still, some personnel disagreed that the county government placed great emphasis
on qualifications of individuals during the recruitment process of Monitoring and Evaluations
personnel.
Sufficient training on monitoring processes and evaluation techniques is very vital in ensuring
the systems established achieve their objectives. It training helps the team in understanding the
theory and linkage between project theory and results as well as associated indicators (CPWF,
2012). Human capital with skills in project management is fundamental in selection and
execution of M&E system (Nabris, 2002). As a result, there is a big demand for skilled
personnel, harmonization of training programs, capacity building of M&E frameworks and
technical advice (Gorgens and Kusek, 2009).
5.3.3 Availability of Funds
The analysis indicated a presence of a positive was a positive connotation between funds and
performance of the systems in charge of monitoring operations and progress and assessment of
results and goals. In the departments the researcher visited, none was found to commit between
5 to 10 percent of their budgets to M&E as recommended by Kelly and Magongo (2004).
As recommended by Chaplowe (2008), the findings indicated that the associated M&E
departments were not allocated adequate resources in the budgets and would not plan
effectively their related operations. Furthermore, contrary to the recommendation of Gyorkos
(2003), it was observed that the monitory units lacked independence.
5.3.4 Stakeholder Participation on Performance of Monitoring and Evaluation
The investigations revealed that the inclusion of donors in the assessment undertakings
contributed positively in the realisation of outputs and impacts. Stakeholder participation is key
in determining the needs of the beneficiaries that informs how the project is designed (Patton,
2008). The findings showed that an increase in stakeholder contributions in participatory and
assessment aspects directly influence the performance of such programs.
Askari (2014) cautiously advises that while the inclusion of stakeholders is very vital, excessive
involvement could result in undue influence on the process. It is therefore proper to
communicate efficiently their roles. Knowledge is created through close involvement of
38
stakeholders throughout the entire process of M&E that enhances ownership of results and
helps in capacity development and transfer of skills (UNDP, 2002).
5.4 Conclusions
The investigations observe the following; the efficacy of schemes that measure outcome and
impacts, is mostly reliant on the commitment of managers to appoint competent workforce that
is qualified to gather information, process, analyse and communicate so as to inform the
decision making of project operations. As such, the competency of the staff is vital to take part
in designing of the M&E system for county governments.
In regard to human capacity needs, the study posits that a considerable proportion of county
government staffs in charge of project operations and outputs are well versed with what M&E
is and its relevance to program outputs and impacts as they have been trained. The research
hence indicates that staff competency is a vital component in the execution of M&E activities
in county government community ventures.
Further, the study concludes that a competent and qualified workforce positively influence the
processes of judging productivities and influences on beneficiaries.
The investigator settles that a significantly positive relationship exists between resource
allocation and performance of the system under focus. The decentralised units of public service
rely on the central government funds and as such, the M&E departments are underfunded and
mostly not prioritised in the budgets, thus the potential of the processes are greatly inhibited.
Finally, the research-undertakings settles that stakeholders’ participation had an influence on
M&E. Identification of stakeholders must be done early enough and engage them in the
planning and designing stages which informs them in regard to participation as the plan for
Monitoring and Evaluation is implemented. Incorporating stakeholder’s views in relation to
planning and design plays a critical role in success of monitoring and evaluation process. It
was also concluded that lack of sufficient involvement in data collection for M & E influences
the end results in a negative way.
5.5 Recommendations
On the basis of the findings from the study on the influence of role of management, human
resource capacity, availability of funds and stakeholders’ participation on the performance of
M&E, it is recommended that:
1. When undertaking monitoring and evaluation, the management should be at the
forefront in providing advice and decision making in the M&E process.
39
2. The current staff should be trained in order to fully participate the planning and
execution of M&E of county government projects. When recruiting monitoring and
evaluation staff, their competencies should be based qualifications and knowledge in
monitoring and evaluation process.
3. There should also be proper policies on allocation of adequate funds meant to facilitate
the M&E process.
4. Stakeholders’ participation should be controlled effectively by developing a system of
identifying and managing stakeholders in the M&E process.
5.6 Suggestions for Further Research
This academic-inquiry endorses that a parallel and analogous task is needed in other devolved
public offices with a view of gathering practices and policies that touch on monitoring the
events surrounding project cycle and evaluating their impacts on community livelihoods. It is
also indorsed that other metrics of monitoring and evaluation need to be explored in order to
fully understand the contributions that organizational operations and systems impart in shaping
project M&E outcomes effectively and efficiently.
Other researchers could also look at how to strengthen performance of monitoring and
evaluation system of County Government particularly how to ensure that all the stakeholders
effectively take part in monitoring and evaluating their projects.
40
REFERENCES
Anderson, A. (2005). An Introduction to Theory of Change. The Evaluation Exchange, Volume
XI Number 2, P. 12
Askari, G. R. (2011). Factors Influencing Effective Implementation of Monitoring and
Evaluation Practices in Donor Funded Projects in Kenya: A Case of Turkana District.
(MBA Research Project, Kenyatta University, 2011).
Bakewell O. and Garbutt A. (2005). The Use and Abuse of the Logical Framework Approach.
SIDA
Briceno, B. (2010). Defining the Type of M&E System: Clients, Intended Uses and Actual
Utilization. Premnotes.
Capable Partners Program (2012). Monitoring and Evaluation (M&E) system overview. NGO
Connect news, Issue 46. Capable Partners Program (CAP).
Chaleunvong K. (2009). Training Course in Reproductive Health Research: Data collection
techniques (PowerPoint slides). GFMER – WHO – UNFPA - LAO PDR.
Chaplowe, Scott G. (2008). Monitoring and Evaluation Planning: American Red Cross/CRS
M&E Module Series. American Red Cross and Catholic Relief Services (CRS),
Washington, DC and Baltimore, MD.
Chesos R. (2010). Automated M&E system for NGOs. The Co-Ordinator, Issue No. 5, p. 1.
Cooper, D. R., & Schindler, P. S. (2008). Business Research Methods. London: McGraw Hill
Higher Education
CPWF. (2012). M&E guide: Theories of change.
Fitzgerald M., Posner J., Workman A. (2009). A Guide to Monitoring and Evaluation of NGO
Capacity Building Interventions in Conflict Affected Settings. JSI Research and Training
Institute, Inc.
Gaitano, S. (2011). The Design of M&E Systems: A Case of East Africa Dairy Development
Project. A paper presented at INTRAC 7th Monitoring and evaluation conference
GoK (2012). Social Protection Sector Review. Republic of Kenya
Gorgens, M. and Kusek, J. Z. (2009). Making Monitoring and Evaluation Systems Work. World
Bank.
Guijt, I., Randwijk and Woodhill, J. (2002). A Guide for project M&E: Managing for Impact in
Rural Development. International Fund for Agriculture Development (IFAD), Office of
Evaluation and Studies (OE)
Hosley, C. (2005). What’s Your Theory – Tips for Conducting Program Evaluation - Issue 4.
Wilder Research
IFRC. (2011). Project/programme monitoring and evaluation (M&E) guide
41
James, C. (2011). Theory of Change Review: A Report Commissioned by Comic Relief. Comic
Relief
Jaszczolt K., Potkanski T., Stanislaw A. (2010). Internal Project M&E System and Development
of Evaluation Capacity – Experience of the World Bank – Funded Rural Development
Program. World Bank.
Jha, Abhas K.; Barenstein, J. D.; Phelps, P. M.; Pittet, D.; Sena, S. (2010). Safer Homes, Stronger
Communities: A Handbook for Reconstructing after Natural Disasters (pp. 269-284).
World Bank.
J-PAL (2003). Program Theory Assessment.
Kameri-Mbote, P. (2000). The Operational Environment and Constraints for NGOs in Kenya:
Strategies for Good Policy and Practice. IELRC Working Paper 2000-2. International
Environmental House.
Kenya Gazette Supplement No. 30 (Acts No. 18), (2013). The Public Benefits Organizations
Act, 2013. The Government Printer, Nairobi.
KOFFI-TESSIO B. (2002). Efficacy and efficiency of Monitoring-Evaluation (MES) for Projects
Financed by the Bank Group. African Development Bank Group.
Kusek, Jody Zall and Rist, Ray C. (2004). A Handbook for Development Practitioners: The Steps
to A Result-Based Monitoring and Evaluation System. The World Bank, Washington.
DC
Levison, F. J., Rogers, B. L. Hicks, K. M., Schaetzel, T., Troy, L., Young, C. (1999). Monitoring
and Evaluation: A Guidebook for Nutrition Project Managers in Developing Countries.
Prepared for the World Bank, Human Development Network by International Food and
Nutrition Centre Tufts University School of Nutrition Science and Policy
Mackay, K. (2010). The Nuts & Bolts of M&E Systems. Washington, D.C. The World Bank
Makueni County Integrated Development Plan, 2013
Mathias J., Senelet P., Topcuoglu E., Kose R. and Tsui A. (2001). Best Practices in Monitoring
and Evaluation: Lessons from the USAID Turkey Population Program. USAID
Mugenda, O. M. (2003). Research Methods: Quantitative and Qualitative approaches. Nairobi,
ACTS,
Nabris, K. (2002). Monitoring and Evaluation. Palestinian Academic Society for the Study of
International Affairs (PASSIA)
Naidoo, I. (2013). All UN Agencies Vet and Monitor their Work. Daily Nation, P.
Oso R.K and Onen N.N. (2009). Essential of Nursing Research (5th ed.). Philadelphia:
Lippincott
Otieno L. (2010). Good governance in NGOs. The Co-Ordinator, Issue No. 6., p. 10.
42
Perrin, B. (2012). Linking Monitoring and Evaluation to Impact Evaluation. Impact Evaluation
Notes, No. 2.
Radhakrishna, R. B. (2007). Tips for Developing and Testing Questionnaires/Instruments.
Journal of Extension, 45(1).
Raval, K. (2009). Stratified Random Sampling.
Seith, S. and Philippines I. (2012). Evaluation and Theory of change. Presented at workshop on
randomized evaluation to improve financial capability innovation for poverty action
Shapiro J. (2011). Monitoring and Evaluation. CIVICUS.
Sharma, A.K. (2005). Textbook of Correlations and Regression. New Delhi, India: Discovery
Publishing House.
UNDP. (2002). Handbook on Monitoring and Evaluation for Results. UNDP, Evaluation office
UNDP. (2009). Handbook on Planning, Monitoring and Evaluating for Development Results.
UNDP, USA.
Warah, R. (2013). UNDP’s Shortcoming a Reflection of a Wider Failure with the UN System.
Daily Nation, P. 12
Welsh, N., Schans, M. and Dethrasaving, C. (2005). Monitoring and Evaluation Systems Manual
(M&E Principles). Publication of the Mekong Wetlands Biodiversity Conservation and
Sustainable Use Programme
William R. (2009). The History of Project Management.
World Bank (2002). Monitoring & Evaluation: some tools, methods and approaches. The World
Bank, Washington, D.C.
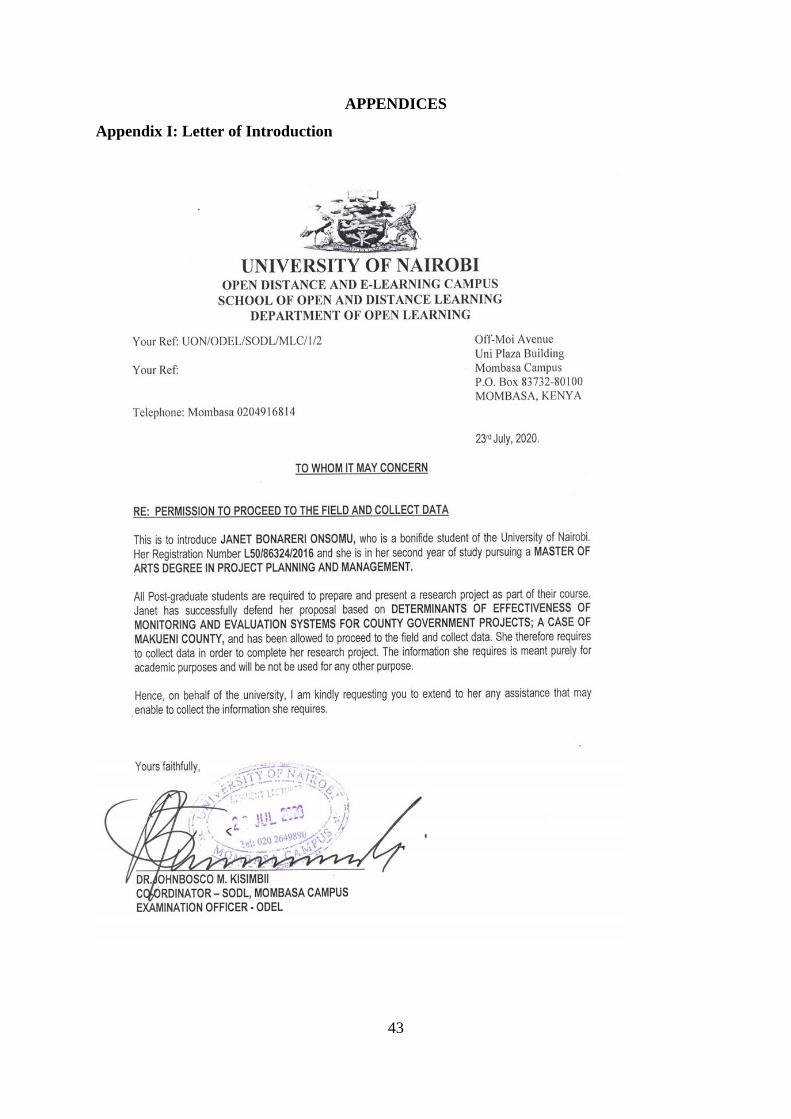
43
APPENDICES
Appendix I: Letter of Introduction
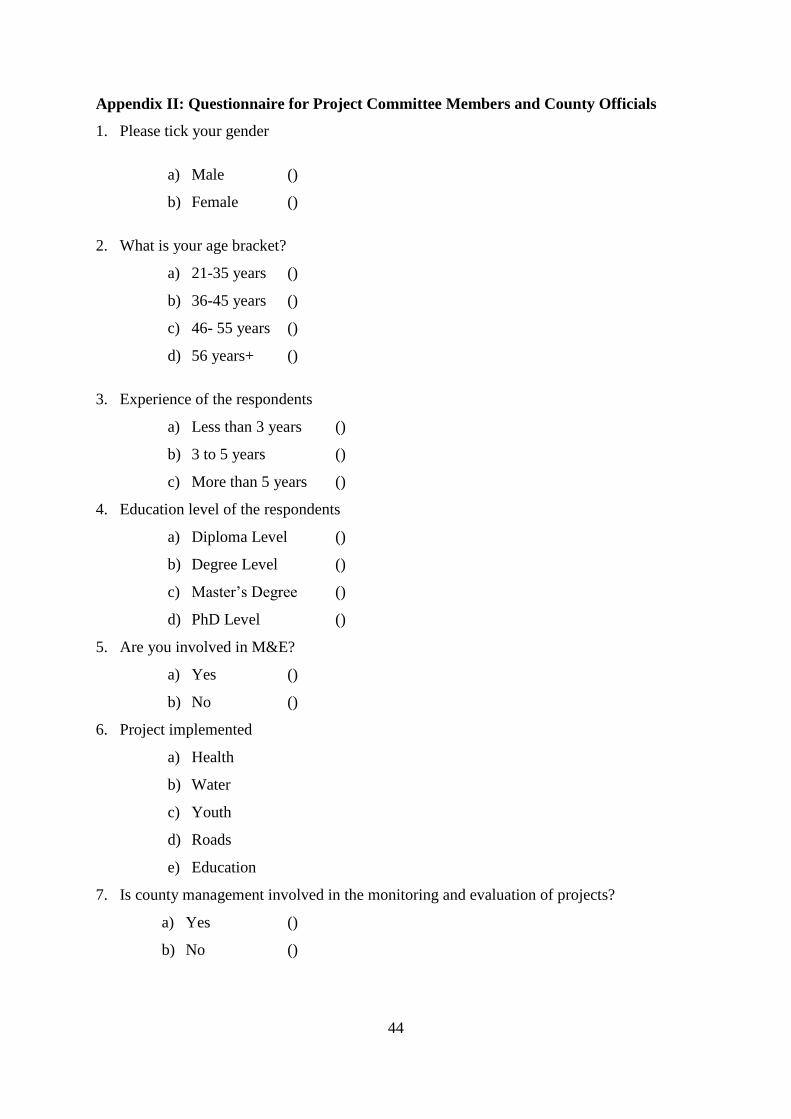
44
Appendix II: Questionnaire for Project Committee Members and County Officials
1. Please tick your gender
a) Male ()
b) Female ()
2. What is your age bracket?
a) 21-35 years ()
b) 36-45 years ()
c) 46- 55 years ()
d) 56 years+ ()
3. Experience of the respondents
a) Less than 3 years ()
b) 3 to 5 years ()
c) More than 5 years ()
4. Education level of the respondents
a) Diploma Level ()
b) Degree Level ()
c) Master’s Degree ()
d) PhD Level ()
5. Are you involved in M&E?
a) Yes ()
b) No ()
6. Project implemented
a) Health
b) Water
c) Youth
d) Roads
e) Education
7. Is county management involved in the monitoring and evaluation of projects?
a) Yes ()
b) No ()
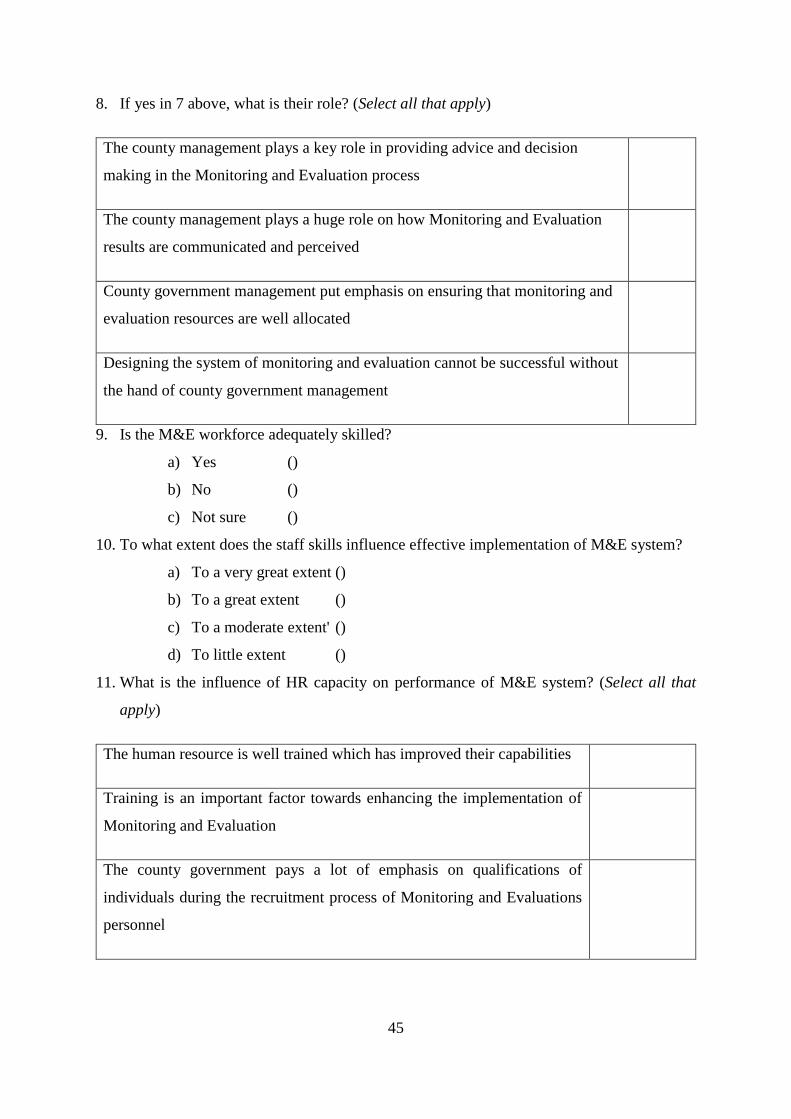
45
8. If yes in 7 above, what is their role? (Select all that apply)
The county management plays a key role in providing advice and decision
making in the Monitoring and Evaluation process
The county management plays a huge role on how Monitoring and Evaluation
results are communicated and perceived
County government management put emphasis on ensuring that monitoring and
evaluation resources are well allocated
Designing the system of monitoring and evaluation cannot be successful without
the hand of county government management
9. Is the M&E workforce adequately skilled?
a) Yes ()
b) No ()
c) Not sure ()
10. To what extent does the staff skills influence effective implementation of M&E system?
a) To a very great extent ()
b) To a great extent ()
c) To a moderate extent' ()
d) To little extent ()
11. What is the influence of HR capacity on performance of M&E system? (Select all that
apply)
The human resource is well trained which has improved their capabilities
Training is an important factor towards enhancing the implementation of
Monitoring and Evaluation
The county government pays a lot of emphasis on qualifications of
individuals during the recruitment process of Monitoring and Evaluations
personnel
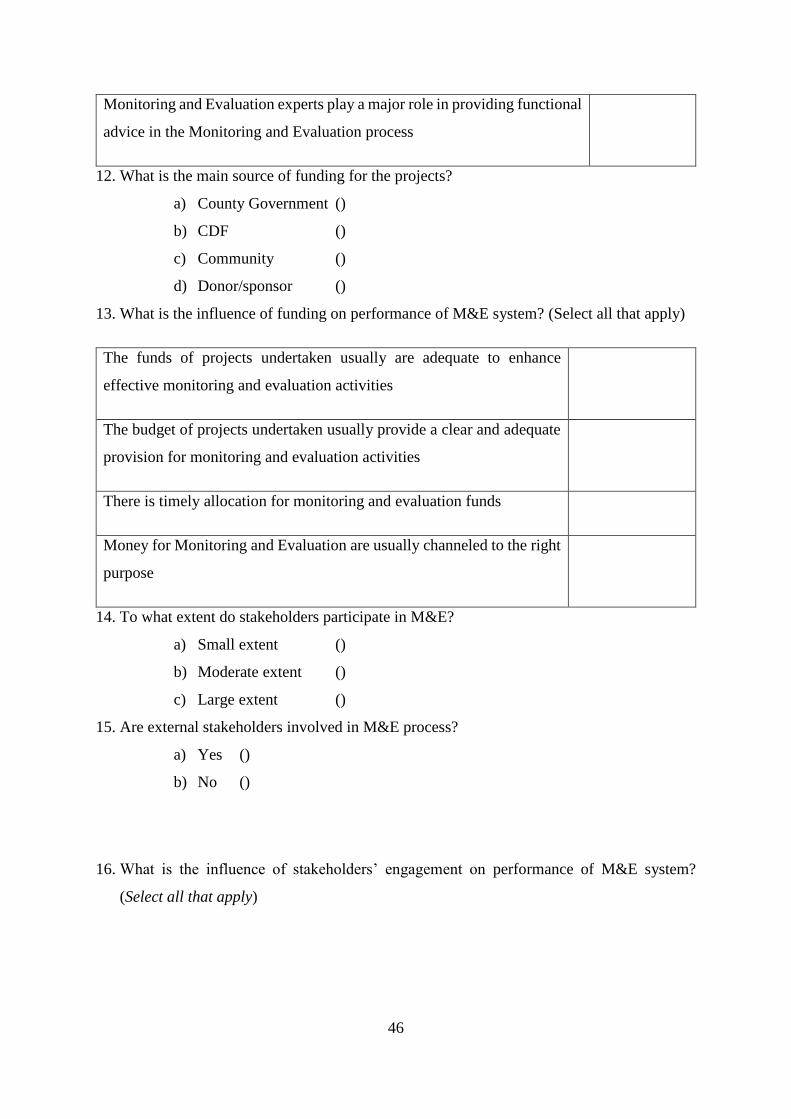
46
Monitoring and Evaluation experts play a major role in providing functional
advice in the Monitoring and Evaluation process
12. What is the main source of funding for the projects?
a) County Government ()
b) CDF ()
c) Community ()
d) Donor/sponsor ()
13. What is the influence of funding on performance of M&E system? (Select all that apply)
The funds of projects undertaken usually are adequate to enhance
effective monitoring and evaluation activities
The budget of projects undertaken usually provide a clear and adequate
provision for monitoring and evaluation activities
There is timely allocation for monitoring and evaluation funds
Money for Monitoring and Evaluation are usually channeled to the right
purpose
14. To what extent do stakeholders participate in M&E?
a) Small extent ()
b) Moderate extent ()
c) Large extent ()
15. Are external stakeholders involved in M&E process?
a) Yes ()
b) No ()
16. What is the influence of stakeholders’ engagement on performance of M&E system?
(Select all that apply)
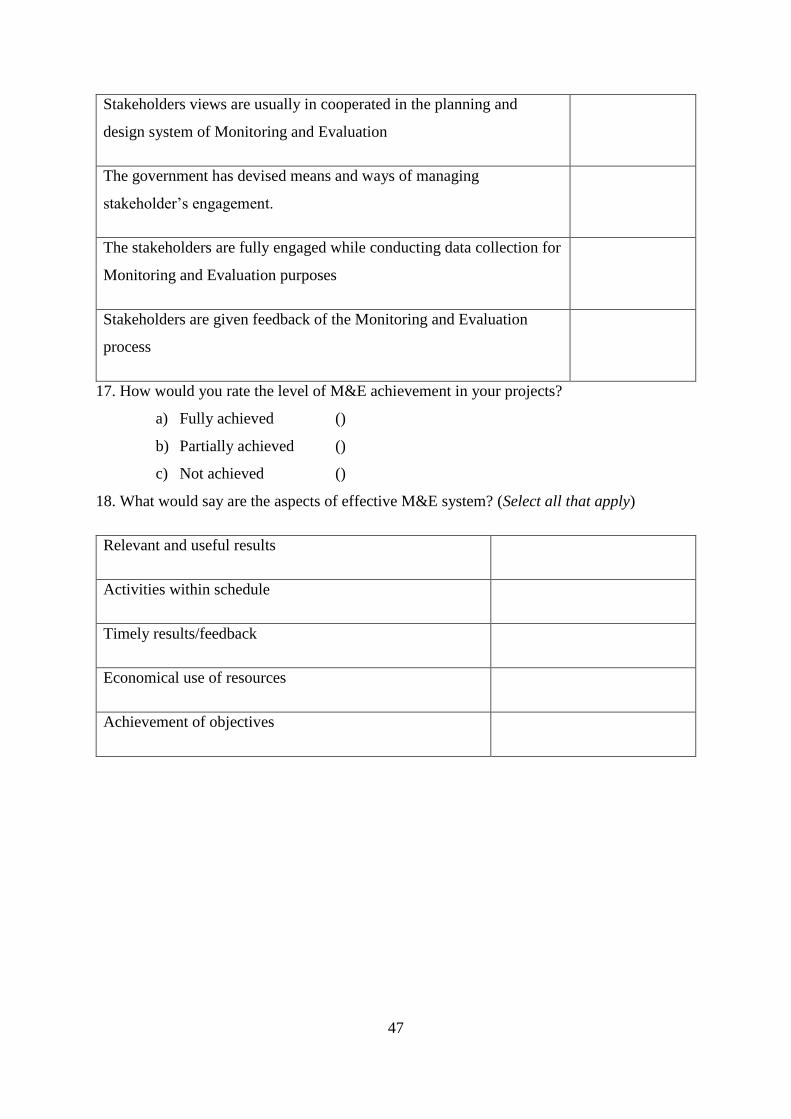
47
Stakeholders views are usually in cooperated in the planning and
design system of Monitoring and Evaluation
The government has devised means and ways of managing
stakeholder’s engagement.
The stakeholders are fully engaged while conducting data collection for
Monitoring and Evaluation purposes
Stakeholders are given feedback of the Monitoring and Evaluation
process
17. How would you rate the level of M&E achievement in your projects?
a) Fully achieved ()
b) Partially achieved ()
c) Not achieved ()
18. What would say are the aspects of effective M&E system? (Select all that apply)
Relevant and useful results
Activities within schedule
Timely results/feedback
Economical use of resources
Achievement of objectives