Determinants of crop insurance adoption in Bulgaria
22
1 Determinants of insurance adoption among Bulgarian farmers: the importance of other risk management decisions on the farm Marianne Lefebvre * , Dimitre Nikolov ** , Sergio Gomez-y-Paloma * , Minka Chopeva ** Accepted for publication in Agricultural Finance Review vol:74, iss:3 (07-Feb-2014) Abstract: Purpose – This article aims to analyze the determinants of agricultural insurance adoption in Bulgaria, using a purpose-built survey of 224 farmers interviewed in 2011. The insurance decision is analyzed conjointly with other risk management decisions on the farm such as having contracts with retailers or processors, diversifying farm activities and using irrigation. Design/methodology/approach – The agricultural insurance sector in Bulgaria is presented in the broader context of the transition to a market-oriented economy and integration of Bulgarian agriculture into the EU Common Agricultural Policy. The recent developments on the determinants of farm insurance adoption in the agricultural economics and finance literature are discussed. A multivariate probit model is used in order to determine the factors explaining the adoption or non- adoption of various risk management tools by the surveyed farmers, including farm insurance. Findings – We find that farmers with diversified activities, using irrigation or having contracts with retailers or processors, are more likely to adopt insurance, after controlling for farms and farmers' structural characteristics. Additionally, we find that the main characteristics distinguishing farmers who purchase agricultural insurance from non-users are farm size and farm location. The existence of strong regional effect suggests the importance of adapting the insurance products to the different regional contexts in Bulgaria. Originality/value – This paper contributes to the (limited) literature on agricultural insurance adoption in transition countries, currently shifting from a system where compensation against natural hazards tended to come from a State damage mitigation fund, inherited from the centrally planned governments to private and voluntary agricultural insurance. This research provides a unique data source on the Bulgarian case study. JEL classification: Q14 Keywords: Agricultural insurance; Bulgaria; Risk management; Common agricultural policy; Multivariate Probit Article classification: Research paper * European Commission, Joint Research Centre (JRC), Institute for Prospective Technological Studies (IPTS), Agrilife Unit, Edificio Expo. c/ Inca Garcilaso, 3, 41092 Seville, Spain Corresponding author: [email protected] ** Institute of Agricultural Economics, Sofia, Bulgaria
Transcript of Determinants of crop insurance adoption in Bulgaria

1
Determinants of insurance adoption among Bulgarian farmers: the importance of other risk management decisions on the farm
Marianne Lefebvre*, Dimitre Nikolov
**, Sergio Gomez-y-Paloma
*, Minka Chopeva
**
Accepted for publication in Agricultural Finance Review vol:74, iss:3 (07-Feb-2014)
Abstract:
Purpose – This article aims to analyze the determinants of agricultural insurance adoption in
Bulgaria, using a purpose-built survey of 224 farmers interviewed in 2011. The insurance decision is
analyzed conjointly with other risk management decisions on the farm such as having contracts with
retailers or processors, diversifying farm activities and using irrigation.
Design/methodology/approach – The agricultural insurance sector in Bulgaria is presented in the
broader context of the transition to a market-oriented economy and integration of Bulgarian
agriculture into the EU Common Agricultural Policy. The recent developments on the determinants
of farm insurance adoption in the agricultural economics and finance literature are discussed. A
multivariate probit model is used in order to determine the factors explaining the adoption or non-
adoption of various risk management tools by the surveyed farmers, including farm insurance.
Findings – We find that farmers with diversified activities, using irrigation or having contracts with
retailers or processors, are more likely to adopt insurance, after controlling for farms and farmers'
structural characteristics. Additionally, we find that the main characteristics distinguishing farmers
who purchase agricultural insurance from non-users are farm size and farm location. The existence of
strong regional effect suggests the importance of adapting the insurance products to the different
regional contexts in Bulgaria.
Originality/value – This paper contributes to the (limited) literature on agricultural insurance
adoption in transition countries, currently shifting from a system where compensation against natural
hazards tended to come from a State damage mitigation fund, inherited from the centrally planned
governments to private and voluntary agricultural insurance. This research provides a unique data
source on the Bulgarian case study.
JEL classification: Q14
Keywords: Agricultural insurance; Bulgaria; Risk management; Common agricultural policy;
Multivariate Probit
Article classification: Research paper
* European Commission, Joint Research Centre (JRC), Institute for Prospective Technological Studies (IPTS),
Agrilife Unit, Edificio Expo. c/ Inca Garcilaso, 3, 41092 Seville, Spain
Corresponding author: [email protected]
** Institute of Agricultural Economics, Sofia, Bulgaria

2
Acknowledgments: The collection of data was funded by the project “Risk Management in
Agriculture” (2011-2012), financed by the Bulgarian Agriculture Academy and the Ministry of
Agriculture and Food. We would like to thank Anna Atkinson for careful proofreading and Salvador
Barrios for helpful comments. The views expressed are purely those of the authors and may not in
any circumstances be regarded as stating an official position of the European Commission.
3
1. Introduction
Following the break-up of the Soviet Union in 1990, many of the state-owned monopoly of
agricultural insurers in Eastern Europe were privatized, and markets were opened up to competition
by new private commercial companies providing crop and livestock insurance policies. With the
transition towards a market-oriented economy, agricultural reform was characterised by the
liquidation of the agricultural industrial complexes, the development of a private agricultural sector
composed of a large number of small private farms (producing mainly for self-consumption) and big
private production co-operatives, land restitution and price liberalisation (Garnevska et al. 2006).
Farmers now have to decide which crops to grow and how best to grow them by considering
potential profits and risks, as well as whether to take out agricultural insurance. An insurance
contract implies that the farmer pays a premium to buy the insurance which gives him the right to an
indemnity, triggered by specific events (single peril insurance) or by a fall in yields/production below
a certain threshold (multi-peril insurance). This paper deals with the determinants of agricultural
insurance adoption in Bulgaria. It focuses on the uptake of agricultural insurance, but does not
contain any information regarding the type of insurance or coverage provided to the farmer.
Bulgarian agricultural production is affected by many sources of risk beyond the farmer’s control,
including natural hazards such as floods, storms, drought, hail, frost and fire. Agricultural insurance
was introduced in Bulgaria after the restoration of the Bulgarian state in 1878, following the Russo-
Turkish War (1877-1878). The insurance activity was developed through the establishment of
insurance co-operative societies which controlled insurance activities until 1935. During the period
from 1935 to 1946, agricultural insurance was managed by the Bulgarian Agricultural and
Cooperative Bank. In 1946, when Bulgaria became a socialist state, the existing insurance companies
were all merged to create a unique State Insurance Institute (DZI). DZI continued to be the only
insurance company of the centrally planned Bulgarian economy for 15 years. In 1961, a second state
insurance company, Bulstrat, was established.
During the 1980-1991 socialist period, agricultural insurance was compulsory. The DZI insurance
scheme was akin to a support to agriculture as the compensation for losses largely exceeded the total
premiums paid by the farmers. In 1989 the Communist Party allowed multi-party elections,
following which Bulgaria transitioned to democracy and a market-based economy. Private
agricultural insurance in Bulgaria dates back to the early years after the fall of the communist system.
In 1992, a voluntary insurance scheme for crops was implemented. Initially it only covered hailstorm
and thunderstorm risks. Since then, private companies have started offering insurance products
covering a range of farming risks; for crops: hailstorms, thunderstorms, torrential rain, floods, slush,
frost, windstorms, tornadoes, fire; for livestock: death or emergency slaughter resulting from fire and
natural disasters (providing veterinary requirements are observed, especially regarding vaccinations
or prophylactic medicines).
In Bulgaria, the trend is now for the government to promote private agricultural insurance, backed by
government financial support. The existence of private insurance schemes requires government
support as information asymmetries and the systemic nature of some agricultural risks make private
companies unwilling to cover those risks, or the administration and operating costs of offering these
insurance policies are too high compared to what farmers are willing to pay (Smith and Glauber
2012). Intervention usually takes the form of either direct premium subsidies to the farmer or indirect
subsidies for delivery costs, loss adjustment, or provision of reinsurance (Smith and Glauber 2012).
In the European Union, the different Member States have developed their own policies related to
4
production risk in agriculture, for example by subsidising insurance premiums (Mahul and Stutley
2010). Currently these policies are established, implemented and financed at the national level.1 For
example, in Bulgaria, since 2010, the State has developed schemes to support the insurance of fruits,
vegetables, vines and bee-keeping. Support consists of a subsidy on the insurance premium of 80%.
In the CAP post-2013, a “risk management toolkit” has been created as part of the Rural
Development measures under Pillar 2. Under this scheme, national governments of the Member
States are allowed to choose from a menu of instruments and receive co-financing from Brussels (EU
2013).2 One of the measures is the co-financing of insurance premium subsidies. Understanding the
factors affecting farmers' purchases of agricultural insurance is essential for evaluating the soundness
and profitability of insurance programmes and the associated public support (Goodwin and Smith
1995).
The Bulgarian farming sector comprises a large number of small, family-owned farms that have little
access to credit, making a financial shock damaging and lasting. In such small farms, farmers first
rely on risk management strategies on-farm to reduce revenues variability, rather than purchase
insurance. Some risk management strategies (such as diversification) reduce risk within the farm’s
operation, others (such as production contracting) transfer risk outside the farm (Harwood et al.
1999). But with the entry of Bulgaria into the European Union in 2007, the economic, financial and
institutional framework of Bulgarian agriculture is rapidly evolving. The variability in input and
output prices associated with free markets as well as the support received by farmers from the CAP
both affect the financial viability of Bulgarian farms. Notwithstanding effective management of risks
has an increased importance in this context, the current state of agricultural insurance uptake in
Bulgaria is unknown. The latest available figures date from 2005 (Agrostatistic, Ministry of
Agriculture and Forestry Annual report). According to the 2005 figures, about 250000 farms took out
agricultural insurance annually, corresponding to 46.8% of the farms and less than 20% of arable
land. The total insurance premium paid was 6.6 million Euros in 2005, whereas the sum of the
compensations received by the Bulgarian farms amounted to 4.7 million Euros. Given the important
changes in the Bulgarian agricultural sector since 2005 (especially the introduction of the Single
Area Payment Scheme of the Common Agricultural Policy), updated information is necessary.
The Bulgarian case is particularly interesting to complement previous studies on the analysis of the
determinants of insurance adoption as this country is currently shifting from a system where
compensation comes from a State damage mitigation fund, inherited from the centrally planned
regime, to private insurance. The decision to voluntarily purchase an insurance policy is certainly
impacted by farmers' previous experience with compulsory insurance during times of the planning
economy. The possibility of extrapolation of results from research on the determinants of insurance
adoption in other countries may therefore be limited. Prior research on the determinants of insurance
adoption refers mainly to the United States (Goodwin 1993; Smith and Baquet 1996b; Smith and
Baquet 1996a; Smith and Goodwin 1996; Mishra and Goodwin 2003; Serra 2003; Velandia et al.
2009). The United States represent a peculiar example as agricultural insurance is now well-
1 They must, though, respect EU rules on state aid so as to avoid distortion of competition in the common market. For
example, national subsidies granted to premiums paid in agricultural insurance schemes are limited to a maximum
percentage of the costs of insurance premiums (Tangermann 2011).
2 More precisely, under Article 37, Support under this measure shall cover: (a) financial contributions, to premiums for
crop, animal and plant insurance against economic losses to farmers caused by adverse climatic events, and animal or
plant diseases, pest infestation, or an environmental incident; (b) financial contributions to mutual funds to pay financial
compensations to farmers, for economic losses caused by adverse climatic events or by the outbreak of an animal or plant
disease or pest infestation or an environmental incident; (c) an income stabilisation tool, in the form of financial
contributions to mutual funds, providing compensation to farmers for a severe drop in their income.

5
developed and insurance premium subsidies now represent the largest source of farm assistance
(Zulauf and Orden 2012). Targeted research into the specificity of EU countries and the EU
agricultural insurance market is required to inform policy makers. Among the few papers analyzing
EU farmers' adoption of insurance schemes, Garrido and Zilberman (2008) analysed 52000 Spanish
farmers’ insurance outcomes over 12 years, to explain their participation in insurance schemes.
Enjolras and Sentis (2011) analysed 3514 French farms from the European Farm Accountancy Data
Network (FADN) database. Enjolras, Capitanio et al. (2012) compared the factors explaining
farmers' adoption of insurance in France and Italy.
There is almost no evidence on the adoption of insurance by farmers from the new entrant countries
in the European Union (EU-N12) although they represent 56% of the agricultural holdings in Europe
(Eurostat FSS 2010) and nearly 20% of CAP expenditures (EC 2011). Information on the penetration
rate of agricultural insurance in new EU countries was collected by the Joint Research Centre of the
European Commission, after consultation with an expert and consultant in each Member State
(Bielza Diaz-Caneja et al. 2009). According to this source, the penetration rate of agricultural
insurance is 52% in Bulgaria and Hungary, 35% in Czech Republic and 12% in Romania. To our
knowledge, the only available study with farm-level data is Sporri, Baráth et al. (2012), who used
FADN data on 5398 Hungarian farms between 2001 and 2009 to assess the impact of insurance use
on the economic performance of farms. In their sample, 40% of the farmers had adopted insurance.
The general goal of this study is to analyse Bulgarian farmers' agricultural insurance decisions, on
the basis of data collected in a purpose-built survey carried out in Bulgaria in 2011. Different farmers
confront different situations and structural characteristics, and their preferences toward risk and their
risk-return trade-offs have a major effect on their decision to manage agricultural risk. More
specifically, we examine what the determinants of insurance decisions are. The paper is structured as
follows. Section 2 presents the data used and the justification for the selection of variables as
suggested by prior studies. The econometric model is presented in section 3, while results are
presented in section 4. Section 5 provides concluding remarks.
2. Data and variables
The European Farm Accountancy Data Network (FADN) was introduced in Bulgaria in 2003 during
the pre-accession period. Since then, the sample size has increased to 2000 farms (2009) and it is
being constantly enriched with new variables in order to reach the European Commission
requirements. However, it does not yet collect any information regarding the use of agricultural
insurance. Moreover, information from other public statistical sources as well as from insurance
agencies is not available in Bulgaria, including for research purposes. The only information available
dates from the 2005 Agrostatistic report by the Ministry of Agriculture and Forestry of Bulgaria. In
this context, the only opportunity available to investigate agricultural insurance decisions was to use
the interview method. This paper is based on data from a questionnaire-based survey, which was
carried out through structured face-to-face interviews in 224 farms in Bulgaria in 2011. Data were
collected on the farm characteristics and farmers' experiences and preferences with regards to risk
management in general and insurance in particular.
The sample was selected through a non-probability sampling procedure, based on a proportional
stratified sample rationale complemented with expert judgment. The sample includes farms of four
types of specialisation: crop production (121 farms), livestock (20 farms), perennial (31 farms) and
mixed production (52 farms). Between 33 and 46 farmers were interviewed in each of the six NUTS
2 regions.
6
In the following, we describe the factors identified in the literature as potential determinants of
insurance adoption, as well as the variables used in the paper (name in parenthesis and italic).
1. The use of risk management tools
For those 224 interviewed farmers, we know whether they adopted insurance or not in 2011.
According to the survey results, in 2011, the percentage of farms which took out insurance was
26.5% (61 of the surveyed farmers took it out, 163 did not).3 We also have information on the
number of risks covered. Among those who purchased insurance, 60% are insured for the five main
risks, namely frost, rain, hail, storm and fire. After multi-risk insurance, the second most common
product is hail insurance, purchased by 20% of the surveyed farmers. An obvious limitation of the
database is that we have no information on the level of coverage (in terms of premium paid and
surface concerned). Insurance use is relatively heterogeneous across farming systems: one third of
the crop and livestock farmers were insured in 2011 but only 25% of the mixed farms and 3% of the
perennial growers. Meanwhile in terms of regions 37% of the farms are insured in the North (and up
to 61% in the North West), while only 3% in the South are insured.
Most farms use a variety of tools to mitigate and manage risk. Tools for risk management in
agriculture can be either on-farm strategies (diversification of farm and farmer's activities, irrigation,
etc.) (O’Donoghue et al. 2009; Bachev 2012; Foudi and Erdlenbruch 2012), either risk-sharing
strategies like marketing contracts, production contracts, hedging on futures markets, or the
participation in insurance (Mishra and El-Osta 2002; Velandia et al. 2009). The survey includes
information on the use of some of these risk management tools: 58 of the farmers interviewed use
irrigation, with on average 80% of their land irrigated. 123 farmers have signed contracts with
processors, wholesalers or retailers. 139 farmers have more than one type of productions on the farm.
These non-insurance risk management tools can be seen as a substitute strategy to insurance. On the
other hand, it can be argued that producers who adopt one kind of risk management instrument tend
to be highly risk-averse or have more ability in farming in general, and are therefore also more likely
to adopt other risk management tools (Velandia et al. 2009). Given the multiplicity of the risk
management solutions and situations, there is no unambiguous conclusion on the relations between
the different risk management instruments.
Our database offers the opportunity to take into account the possibility of simultaneous utilization of
multiple risk management instruments (including insurance) and the potential correlations among
these decisions. The econometric model used to account for these effects is described in section 3.
2. Potential determinants of insurance adoption
In theory, new tools for farming are adopted when the expected net benefits are positive, i.e. when
the costs are lower than the expected returns from insurance. For insurance adoption, Just, Calvin et
al. (1999) proposed to separate the risk aversion incentive (the gain in risk premium due to the
reduced variance of income) from the expected revenue incentive (the difference between the
3 This figure seems rather low compared to the 2005 figures provided by the Ministry of Agriculture and Forestry
(46.8%) and the 2009 JRC report (52%) (Bulgarian Ministry of Agriculture and Forestry 2005; Bielza Diaz-Caneja et al.
2009). One possible reason is the introduction of the Single Area Payment Scheme in 2007. While direct payments are
not generally viewed as risk management programmes per se, by adding a fixed income stream to the farm’s total income
stream, they reduce the coefficient of variation for the farm’s total income stream (Goodwin and Smith 1995). Therefore,
farmers may view this payment as a substitute to private insurance and this could explain the reduction in insurance
subscription between 2005 and 2011. Our database does not allow evaluating this effect. Differences in the sampling plan
can also not be excluded.
7
premium paid and the expected value of indemnity payments, calculated on the basis of farmers'
subjective probabilities). Despite the importance of these factors in the insurance theory, almost no
empirical studies use insurance outcomes, such as individual loss ratios, indemnities or expected
returns from insurance, to explain farmers' insurance decisions (Garrido and Zilberman 2008). Just,
Calvin et al. (1999) rely on the comparison between stated yield percentiles and insurance premiums,
but do not include indemnities received. Garrido and Zilberman (2008) use a dataset including a
complete characterisation of each farm's insurance strategy, premiums paid, premium subsidies, and
collected indemnities. They found that the variability of returns from insurance (variance and third
moment of indemnity patterns, in amount and frequency) have far more positive influence than the
expected benefits on the decision to purchase insurance. Unfortunately, our database does not include
such variables in the case of Bulgaria and does not therefore permit the analysis of the impact of
these factors. Therefore, we have to rely on other variables as proxies for the expected benefits from
insurance. We classify these variables into four categories: farm structural characteristics, risk
exposure of the farm, financial situation of the farm and "behavioural" drivers.
Farm structural characteristics
In the absence of data on the expected returns from insurance, variables capturing farm structural
characteristics can be used as proxies to explain insurance adoption patterns. Indeed, the
characteristics of the farm and production system impact the risk exposure and the expected losses in
case of damage, as well as the capacity to cope with risk.
Farm size: Farmers operating larger acreages are more likely to have a larger asset base from which
to draw resources, either to purchase insurance or to cope with the damages caused by natural
hazards (Velandia et al. 2009). Larger operations also benefit from economies of scale and better
managerial capacities that can affect risk attitudes (Sherrick et al. 2004). In light of these
characteristics, the relationship between farm size and adoption of agricultural insurance appears
ambiguous, and possibly not linear. Farm size is very heterogeneous in Bulgaria, reinforcing the need
to control for this factor. The small farms (less than 2 ha of Utilized Agricultural Area (UAA))
represent 83.2% of the total number of farms but only manage 3.9% of the total UAA. In contrast,
large farms with a UAA of over 100 ha represent only 1.43% of the number of farms but account for
78.17% of the total utilized agricultural land (MAF 2011). To avoid correlation between farm size in
hectares and the number of hectares of rented land, we create categories for farm size: small farms
are defined in the study as having less than 2 ha of UAA (small_D); medium size farms have
between 2 and 20 ha (medium_D); large farms have more than 20 ha.4 The large farm category is
treated as the indicator. This means that we observe the probability that small and medium farms use
insurance compare to large farms.
Land ownership: A larger proportion of owned acres provides greater wealth, greater stability of land
control and a larger asset base, therefore stronger risk-bearing capacities (Velandia et al. 2009).
Thus, a high ratio of owned acres to total acres is likely to be associated with non-use of insurance
and greater reliance on self-insurance relative to financial insurance (Sherrick et al. 2004). Part-
owners and tenants may be less aware of the land characteristics and thus may face higher production
uncertainty, leading to more frequent adoption of insurance (Mishra and Goodwin 2003). Moreover,
farmers who rent land are expected to buy more insurance because they are more leveraged and they
may be subject to the insurance requirements of creditors (Gardner and Kramer 1996; Wu 1999).
Mishra and Goodwin (2003) confirmed these intuitions and found that part-owners and tenants are
4 Given the limited number of very large farms (>100ha) in the sample, we use a different definition of large farms
compare to MAF (2011).

8
more likely to buy insurance compared to full owners. In Bulgaria about 80% of UAA is rented or
leased (MAF 2011). In the model, we include the number of hectares of rented land to capture this
effect (rentedland).
Specialisation: Variables accounting for farm specialization must be taken into account as they
determine the risk exposure and the type of coverage needed. The adoption of insurance will also
depend on whether insurance products adapted to the farm activities are available on the market.
Growers of perennial crops are, for example, more exposed to risk if the natural hazards provoke
irreversible damage to trees and will therefore have long-run effects on their yields and income. In
the econometric model, the specialization taken as the reference is mixed, i.e. we analyze the impact
of being specialised in crop (spe_crop_D), livestock (spe_livestock_D) or perennial farming
(spe_perennial_D) on the probability to use insurance, compared to being a farm with mixed
activities.
Legal status: If the farm is operated by one farmer alone, the farmer may be more risk-averse and
therefore willing to purchase insurance (Enjolras and Sentis 2011). However, cooperative and limited
company farms may have greater managerial capacities, which is likely to explain their willingness
to innovate and the adoption of modern risk management instruments such as insurance. The dual
agricultural system in Bulgaria, with highly heterogeneous structure and performances between
individual farms and corporate farms, further justifies controlling for the farm legal status. In 2010
98% of all agricultural holdings were owned by individuals, followed by those owned by commercial
companies (1%), sole traders (0.6%), cooperatives (0.3%) and other holdings (0.1%) (MAF 2011). In
the econometric model, we analyze the impact of being an individual farmer (individual_D) on the
probability to use insurance, compared to having another legal status.
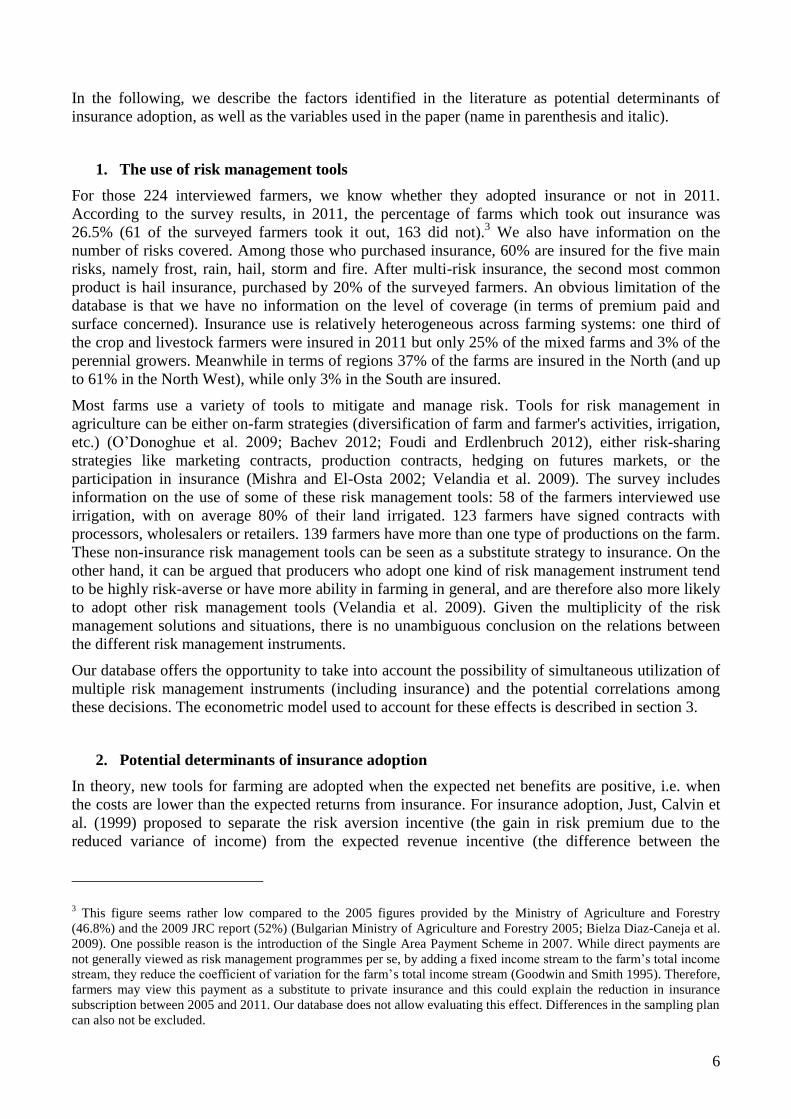
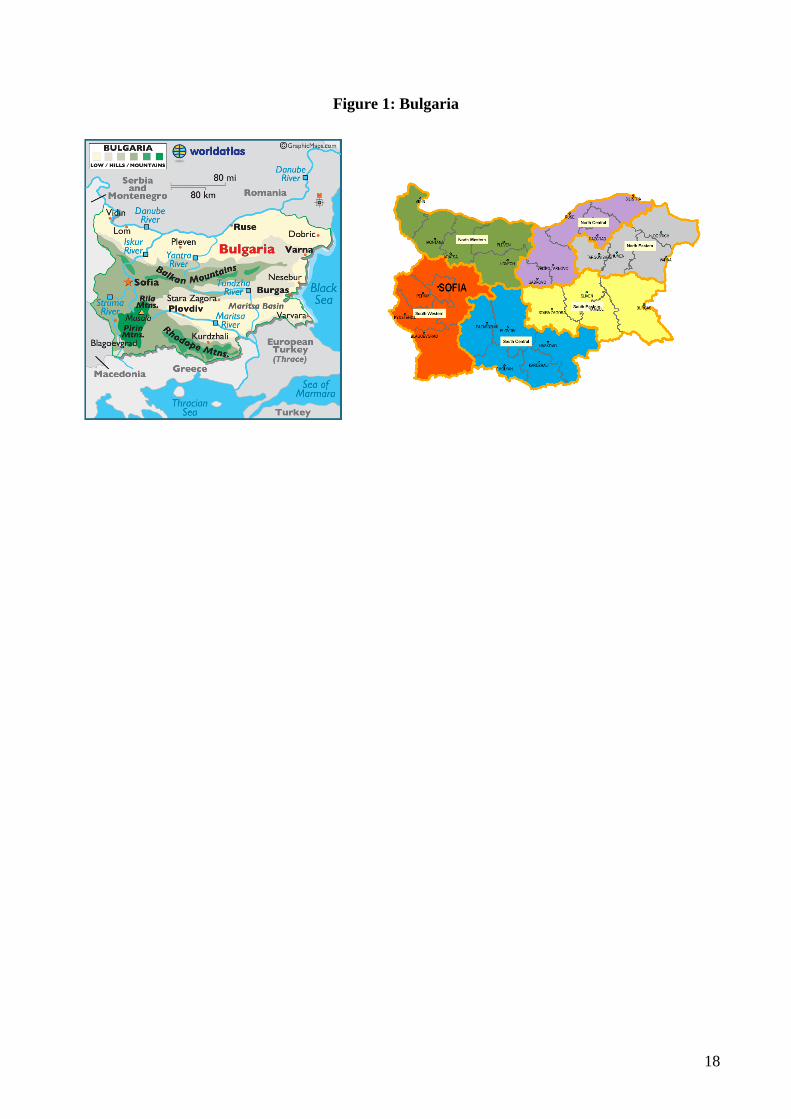
Location: Bulgaria features notable diversity in terms of agricultural systems and exposure to
extreme climatic conditions. The barrier effect of the Balkan Mountains is felt throughout the
country: Northern Bulgaria has a continental climate, i.e. it is cooler and receives more rain than the
lowlands of Southern Bulgaria, which has a Mediterranean climate. The country is divided into six
NUTS 2 regions (Figure 1).
The South-West region benefits from a generally Mediterranean climate. It is characterised by
various soil and climatic conditions, and therefore a great variety of crops are produced there
(cereals, vegetables, tobacco, vineyards, etc.). The South-West, which includes the capital Sofia, is
the richest region, contributing to 45% of Bulgaria’s GDP with about a third of the population.
At the other end of the spectrum, the regions with the loWest GDP and GDP per capita are the
North-West and North-central regions. The Danubian Plain in the North is a big agricultural region.
The North-West is the first agricultural region in terms of UAA and the North-central is in third
place. Agricultural land is mainly occupied by arable crops (mainly sunflowers, wheat and maize).
Livestock production is also developed. In the North-East region, arable land occupies 95% of the
UAA.
The South-East region is the second agricultural region in terms of UAA. Horticulture has developed
thanks to favourable climatic conditions due to the influence of the Black sea, with a reduced number
of frosts in winter and more days of sun. Grapes, vegetable, tobacco, wheat and livestock are also
important productions of the region.
The South-central region is the largest producer of vegetables, grapes and tobacco in Bulgaria - 48%
of the total area of vegetables, 33% of the vineyards and 55% of the tobacco are grown in the South-
central region. Favourable soil and climatic conditions of the region permit the cultivation of crops
that are not grown in other areas such as peaNUTS, rice, rye, cotton, damask rose, lavender, mint and
more. The South-central region is also an important cattle producer.
9
Location variables are important to capture unobservable effects due to local characteristics such as
the profitability of agricultural production and the risk exposure. We use dummies corresponding to
the six NUTS 2 regions of Bulgaria to take into account regional peculiarities (NorthCentral_D,
NorthEast_D, SouthEast_D, SouthWest_D, SouthCentral_D). The region taken as reference is the
North-West region, which is both the main agricultural region in terms of UAA and the poorest
region in terms of GDP per inhabitant.
Risx exposure and perception
Climatic variables: The most high-risk farms in terms of weather exposure should be more likely to
take out insurance. Usual proxies for climate risk exposure are meteorological data such as mean
temperature, cumulated precipitation, hours of sun, days of frost, days of strong wind, and number of
storm events (Blank and McDonald 1996; Van Asseldonk et al. 2002). The meteorological data used
here are: the number of days of precipitation, taken as proxy for rainfall and drought risk
(y0710_dayprecip), number of days of thunderstorm, used as proxy for hail risk
(y0710_daythunderstorms), and number of days of snow, a proxy for frost risk (y0710_daysnow).
These data are available at NUTS3 level.
Risk perception: Farmers were asked the number of times they have been affected by a natural
phenomenon in each of the previous four years (2007-2010). We use the average number of times the
farm has declared itself affected by a natural phenomenon in a year (risk events_avg) as a proxy for
risk perception. While we do not know whether farmers' declarations are accurate, the declaration of
a higher number of natural phenomenons reflects higher perceived risk exposure. Producers with
higher perceived risks may have more incentives to adopt risk management tools.
Access to information: We can also expect access to information on risk exposure to play a key role
in determining perception of risk exposure (Just et al. 2003). Our database includes data on whether
the farmer receives information regarding risk management, as well as the nature and total number of
sources used (publications, electronic media, internet, information agencies, state administration,
other). We use a dummy variable equals to one if the farmer declared having access to information
on risk management (inforisk_D).
Financial dimension
Insurance adoption is ultimately a financial decision. In the absence of fully efficient financial
markets, the financial situation of the farm can be an important driver of insurance adoption.
According to the literature, financial variables are expected to impact insurance decisions through
two channels: their impact on the affordability of insurance and on risk aversion. Smith and Baquet
(1996a) and Smith and Goodwin (1996) both found a farmer's net wealth significantly explains lower
insurance adoption. However, in the presence of financial constraints, a positive relationship between
income and insurance adoption can be expected (Spörri et al. 2012). Unfortunately, financial
information on income is limited in the survey. We only know whether the farmer uses credit and
whether he receives compensation after a natural catastrophe in the recent years.
Debt and liquidity constraints: Debt and liquidity constraints are also strongly expected to affect
insurance through their impact on farmers' ability to face a sudden drop in yields and revenue. More
liquidity constrained farmers are expected to insure more (Enjolras and Sentis 2011). Greater debt-
to-asset ratios indicate greater financial risk and a stronger demand for more comprehensive
insurance products (Blank and McDonald 1996; Van Asseldonk et al. 2002; Mishra and Goodwin
2003). We use a dummy variable indicating whether the farm has on-going credits, as an indicator of
the debt constraint of the farm (credit_D).
10
Compensation after a natural event (not insurance indemnity payment): Disaster aid programmes
have long been recognized to have an impact on crop insurance programmes. The history of
compensation received after a disaster has both positive and negative impacts on insurance demand.
On the one hand, ad hoc disaster programmes can be viewed as free crop and livestock insurance by
farmers, albeit with indemnities that are somewhat unpredictable (Smith and Glauber 2012). Ex-post
compensation is in this case a disincentive to take out insurance. On the other hand, receiving
compensation payments may reflect higher returns to insurance because historically yields have been
more variable, therefore leading to a positive effect on insurance demand (Smith and Baquet 1996b).
The net impact will depend on farmers' preferences regarding the opportunity to receive an uncertain
public support in case of disaster (decided ex-post) versus buying insurance to guarantee indemnity
is received after damage. In Bulgaria, the state fund is used for compensation of small risks not
covered by insurance and for support after catastrophic risks. The funds distributed each year are
highly variable as they depend on the occurrence of natural hazards: 11 million Euros and 5225
beneficiaries in 2008 but only 0.6 million and 245 beneficiaries in 2011. In our database, the three
farmers that have received State compensation after a natural disaster between 2007 and 2011 took
out insurance in 2011. Therefore, the dummy variable indicating whether the farmer received ex-post
compensation will be dropped from subsequent analysis to avoid a separation issue. Given the small
number of farmers concerned, we do not think dropping this variable has an important effect on the
model.
Characteristics of the farmer
Farmers' attitudes towards risk and uncertainty can explain deviation from insurance purchase even if
the expected returns are positive. However, we often have to rely on proxies to capture the effects
risk aversion. The age and the level of education of the farmer are likely to explain insurance
behaviour as they can be used as a proxy for risk aversion (Goodwin 1993; Smith and Baquet 1996b;
Wu 1999). In general, it is hypothesized that older and less educated producers are more risk-averse,
and therefore more likely to adopt risk management tools. However, previous studies have found
mixed results in terms of the effect of age and education on risk management tool adoption (Mishra
and El-Osta 2002). Smith and Baquet (1996b) and Mishra and Goodwin (2003) found that farmers'
education level proved significant for the decision to purchase insurance, and for the level of
coverage. Sherrick, Barry et al. (2004) found that younger and better educated farmers are more
responsive to modern approaches of risk management like insurance. Assuming insurance is part of
the toolbox of modern farming, this can be explained by the results of the innovation adoption
literature. This literature suggests that early adopters are likely to be younger producers with the
highest level of education. Overall, age (Age) and education have an ambiguous effect, depending on
the relative weight of the two channels through which they can impact insurance adoption: risk
aversion and willingness to innovate. To account for potential non-linear effect, education has been
included in the model though two dummies corresponding to no or primary education only
(education1_D) and secondary education (education2_D). The education level taken as reference is
higher education. We have tried alternative specification including the squared value of age as well
but it did not improve the performance of the model.
Descriptive statistics for these variables are presented in Table 1 both for the full sample and for the
two groups of users and non-users of insurance.
3. Econometric model
This section describes the econometric approach to obtain estimates of the effect of various variables
on insurance adoption by Bulgarian farmers.
11
Most previous studies on insurance adoption analyse factors influencing the adoption of insurance
only, rather than considering the possibility of simultaneous adoption and the potential correlation
between the adoption decisions. Our database offers the opportunity to examine the drivers of several
decisions influencing the level of risk born by the farmer, while taking into account the possibility of
simultaneous utilization of multiple risk management instruments. We focus on insurance and on-
farm traditional risk management tools such as production contracting, irrigation and diversification
of farm productions.
We follow the same approach as Velandia et al. (2009), who studied the factors affecting US farmers'
simultaneous utilization of crop insurance, forward contracting and spreading sales (corn and maize
farmers in Illinois, Iowa and Indiana). The empirical model chosen is the multivariate probit (MVP).
The MVP allows for the possible correlation in the different decisions. This specification is useful
since we do not observe how the different risk management tools interact to affect the net return of
the farmer, and these effects are therefore subsumed in the error terms. Moreover, unobservable
individual heterogeneity (risk aversion, ability …) can influence at the same time two of the risk
management decisions made by the respondent.
The model is specified as a system of four equations, with Y1 the decision to purchase insurance, Y2
the existence of marketing and/or production contracts, Y3 the use of irrigation and Y4 the existence
of diversified farm activities (more than one).
Yij*
= βj Xij + εij, j=1,…,4
Yij =1 if Yij*
>0, and 0 otherwise
εij ~ Nj [0,R], j=1,…,4
where Yij represents the decision to adopt a risk management instrument j by the farmer i. Xij is a
vector of observed variables of farmer i that affects the risk management decision j. We use the same
set of explanatory variables for all equations (Xij= Xi).5 The error terms are distributed as multivariate
normal, each with a mean of zero, and variance-covariance matrix R, with 1 on the main diagonal
values and correlations ρjk= ρkj in off-diagonal values.
The system of equations is estimated using the mprobit program in NLOGIT 4.0. It uses Geweke-
Hajivassilou-Keane (GHK) simulator for probabilities and a maximum simulated likelihood
procedure. Since the procedure used involves simulation, one of the key choices the researcher must
make is about the number of draws to consider. The maximum simulated likelihood estimator is
asymptotically equivalent to the true maximum likelihood estimator as the ratio of the square root of
the sample size to the number of draws tends to zero. For moderate to large sample sizes, setting the
number of draws equal to an integer approximately equal to the square root of the sample size is
considered appropriate (Cappellari and Jenkins 2003). Therefore, each model was run with 15 draws.
There were only small differences in the results under alternative choices of the number of draws.
For comparison, we also report the parameter estimates and marginal effects from an individual
probit explaining the insurance decision. In the individual probit model, we use the robust option to
5 The choice of these variables has been made mostly on the basis of the review of the determinants of insurance adoption
(section 2), since this is the main focus of the article. Therefore, we do not expect the predictive power of these variables
to be very high for the production contracting, irrigation and diversification decisions.
12
obtain heteroskedasticity-consistent standard errors. The marginal effects are calculated as the
variation of the estimated probability to adopt insurance with respect to a marginal variation in the
regressors (or a discrete change in case of binary variables). In the MVP, the marginal effects are
calculated as the impact of an explanatory variable on the probability of adopting insurance (Y1 =1),
conditional on all other risk management tools also being adopted (Y1= Y2= Y3 =1) (see Velandia et
al. (2009) for more detailed information on the estimation of marginal effects). Standards errors for
these marginal effects are obtained using the delta method and a bootstrapping procedure (Greene
2007). In both models, the marginal effects are computed at the means of the explanatory variables.
4. Results
We present the results of the different models and analyse the determinants of insurance adoption.
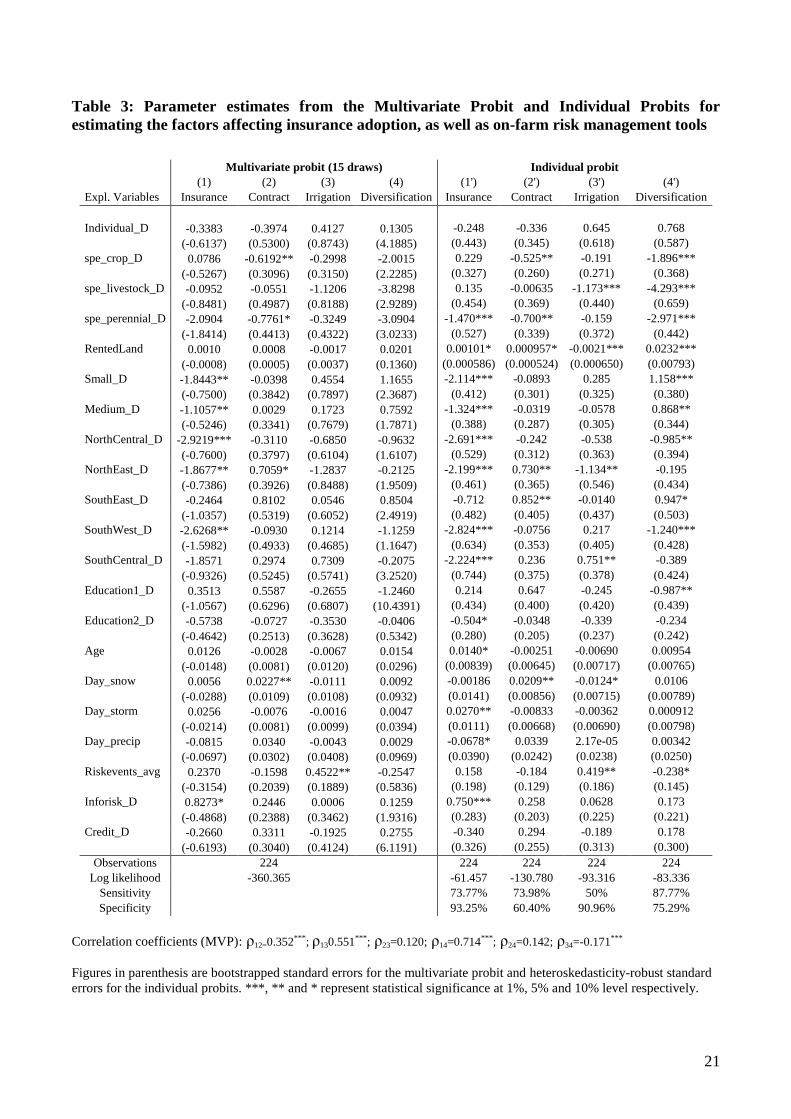
The parameter estimates from the multivariate probit and individual probits for estimating the factors
affecting insurance adoption, as well as on-farm risk management tools are presented in table 3. The
marginal effects are presented in table 4.
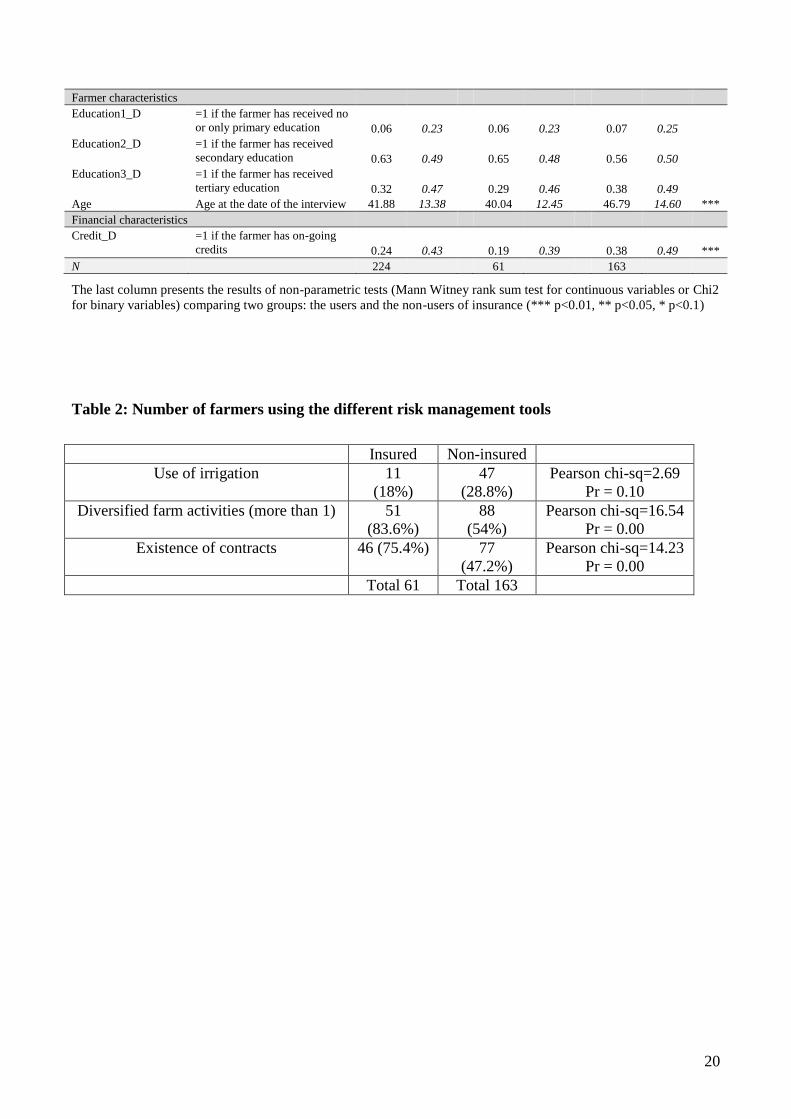
1. Correlation between the different risk management decisions
In order to get first insights on the relationship between insurance and other on-farm risk
management decisions, we use Pearson Chi-squared tests (Table 2). The tests confirm the existence
of strong correlation between the decision to purchase insurance and the existence of marketing and
production contracts, and between insurance and the fact that the farm has diversified activities
(significant at the 1% level). The correlation coefficient between insurance and irrigation is
significant only at the 10% level. Overall, these tests suggest that it is important to take into account
the possibility of simultaneous utilization of multiple risk management instruments when analysing
the determinants of their adoption.
Moreover, in the multivariate probit model, we observe that the pairwise correlation coefficients
related to the insurance equation (ρ12 ρ13 ρ14) are all positive and significantly different from zero
(Table 3). These coefficients measure the correlation between the four risk management decisions,
after the influence of the observed factors has been accounted for. This support our hypothesis that
the error terms in the insurance and other risk management tools are correlated, and a multivariate
probit approach is appropriate.
Moreover, the positive signs of the correlation coefficient (ρ12 ρ13 ρ14) suggest that a farmer adopting
insurance is more likely to adopt another risk management tool and vice-versa. Concerning contracts
(ρ12=0.352), we confirm the results of Mishra and Goodwin (2003) and Velandia et al. (2009), who
highlighted the complementarities between insurance and contracts, given that insurance covers
production risk while contracts cover price risk. For the two other instruments (irrigation and
diversification), we do not confirm the previous results found in the literature.
We find that the correlation of the error terms of the insurance and irrigation equations is positive
and significant (ρ13=0.551), while previous researches had suggested that irrigation is a possible
substitute to insurance since it allows to stabilize yields (Dalton et al. 2004; Foudi and Erdlenbruch
2012). We can find two explanations to our result. First, since irrigation usually concerns high-value
crops (fruit trees, vineyards…), geographic zones with large irrigated areas may receive more
attention from private insurers and extension services and this contributes to higher take-off of
insurance in these regions. Moreover, it is likely that in regions with sufficient rainfall irrigation is
not used and farms are less exposed to drought risk, therefore reducing the need to get insured.

13
Moreover, we find a positive correlation (ρ14=0.714) between diversification of farm activities and
insurance, while evidence in the literature is mixed. Previous researches have concluded that
irrigation is a risk-reducing input and is a possible substitute to insurance since it allows to stabilize
yields (Dalton et al. 2004; Foudi and Erdlenbruch 2012). Mishra and Goodwin (2003) found that
farmers with production and/or marketing contracts are more likely to purchase crop and revenue
insurance. Empirical evidence on the impact of the diversification of farm activities is mixed. Di
Falco, Capitanio et al. (2011) found that farms that have diversified crops are more likely to adopt
financial insurance, suggesting that crop diversification acts as a complement for financial insurance
and not as a substitute. Enjolras, Capitanio et al. (2012) found that traditional hedging practices such
as growing different crops have a positive effect on insurance in France (complement), whereas they
have a negative impact on insurance adoption in Italy (substitute). O'Donoghue, Roberts et al. (2009)
found that farm specialization, measured as the inverse of crop diversification, modestly increased
with the diffusion of insurance in the US, suggesting a small substitution effect between insurance
and crop diversification.
Irrigation and crop and animal diversification within an agricultural holding are production decisions
not primarily driven by risk management motives. The characteristics of the different parcels
(climate, soil…), the constraints on the quantities of each crop/animal that can be sell on the
market…are unobservable characteristics likely to explain these decisions. Unfortunately, our results
do not allow distinguishing whether the positive correlation observed is due to complementarities
between the different instruments with regard to risk management, or other unobserved
characteristics related to the farmer (risk aversion, ability), the production or the local context.
Nevertheless, since we observe that the error terms in the insurance and other risk management tools
are correlated, in the next section, we analyse the results of the multivariate probit in order to analyse
the factors driving insurance adoption.
2. The determinants of insurance adoption
The interpretation of the drivers of insurance adoption is made on the basis of the results of the MVP.
The signs and significant variables in the multivariate and individual probit approaches are largely
similar. The reader can find the results for the individual probit in the tables. Moreover, as the main
focus of the article is to explain insurance adoption, we do not describe the results of the other
decisions. Indeed, since the explanatory variables have not been chosen to explain the other risk
management decisions, the performance of the model to explain contracting, irrigation and
diversification is low (Table 3: lower percentage of correct classification and very few significant
variables in (2)(3)(4) compare to (1)).
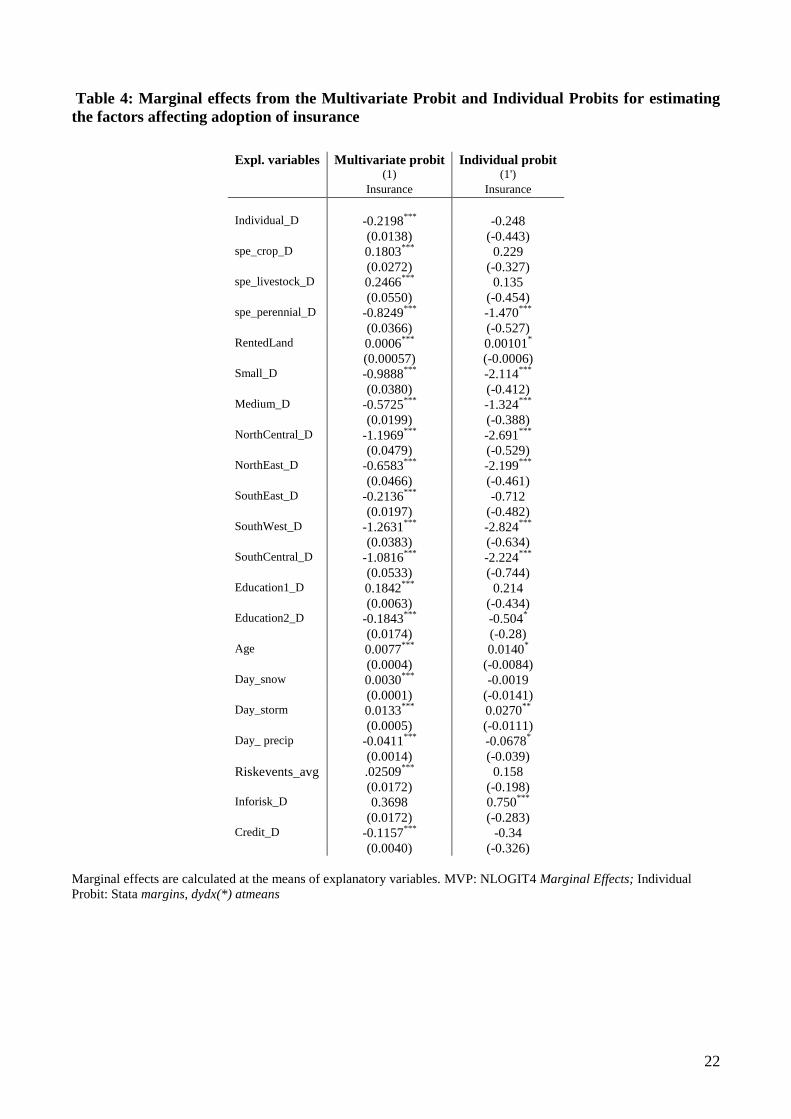
The interpretations below refer to the marginal effects of the MVP (Table 4 (1)), defined as the effect
of a marginal change in a variable on the probability of adopting insurance (Y1 =1), conditional on all
other risk management tools also being adopted (Y1= Y2= Y3 =1), evaluated at the mean of the
variable. We know, as in Velandia et al. (2009), that the marginal effects from the MVP
("conditional" marginal effect) tend to be lower than the marginal effects from the individual probits.
It suggests that the effect of an observed factor on the probability to adopt a risk management tool is
reduced when another risk management tool is already being used.
We find that the main characteristics distinguishing farmers who purchase agricultural insurance
from non-users are farm size and farm location. Small farms and medium farms (to a lower extent)
are less likely to get insured compared to large farms. Regional effects (captured by the NUTS2
dummy) also explain an important part of the differences in insurance adoption. We observe that
farmers in North-West Bulgaria (used as the reference category) are far more likely to adopt
14
insurance than those in any other region (for the South East and South Central regions, effects are not
significant). The simplest explanation is that the North-West region is the main agricultural region in
Bulgaria, and may therefore receive more attention from private insurers and extension services and
this contributes to higher take-off of insurance in this region.
Most of the other variables are significant in the estimation of the marginal effects (Table 4) but not
in the estimation of the parameters (Table 3). While there are no differences between arable crops,
livestock and mixed farms, farms producing permanent crops are less likely to get insured than
mixed farms. The legal status also has an importance since individual farms are less likely to
purchase insurance. Farmers with more hectares of rented land are more often insured, which is
consistent with the assumptions drawn in section 2.
We find a non-linear effect of education since there is no significant difference between farmers
having received no or only primary education and those who have received higher education. The
absence of significant differences between low and highly educated farmers may be due to the fact
that very few farmers are in the first group in our sample. However, we find that farmers having
received secondary education are less likely to get insured than more educated farmers. This is
consistent with the hypothesis that better educated farmers are more responsive to modern
approaches of risk management like insurance. Older farmers are more likely to get insured but the
marginal effect is small.
While more liquidity constrained farmers are expected to insure more, we find a negative impact of
having on-going credits on the probability to get insured. One possible explanation is that indebted
farmers face financial constraints and cannot face the extra costs of insurance. However, the validity
of this interpretation may be limited given that having on-going credit is not necessarily the best
indicator for financial constraints.
Higher risk exposure (higher number of days of snow and thuderstorms) and higher perception of
risk (higher number of natural phenomenon having impacted the farm declared) significantly
increase the probability to get insurance. However, more days of precipitations in the NUTS3 region
reduces the probability to get insured. This may be due to the fact that more rainfall reduces drought
risk and therefore the need to get insured.
5. Conclusion
Through analysis of the results of a purpose-built survey conducted in 224 farms in Bulgaria, we
have shown that the interest of Bulgarian farmers in insurance as a means to cope with natural
hazards is currently low: only 27% of the interviewed farmers purchased insurance in 2011.
We find that the main characteristics distinguishing farmers who purchase agricultural insurance
from non-users are farm size and farm location. In terms of practical recommendations, it suggests
that a closer tailoring of insurance premiums to producer attributes, especially in serving the needs of
small and medium farms could increase adoption. Policies should also aim to stimulate insurance
companies to service the market segment of smaller farms (Sherrick et al. 2004). Moreover, the
importance of regional effects underlines the importance of adapting insurance products to local
needs, and make sure all farmers receive information on insurance (from public extension services or
private insurers) even if they are not in the main agricultural region.
Beyond the analysis of the profile of insured farmers, the main contribution of the paper is to take
into account the potential for simultaneous adoption and correlation among the adoption decisions of
different risk management strategies, using a multivariate probit approach. We have replicated the
15
approach proposed by Velandia et al. (2009) for corn and soybean US farmers and applied it to
Bulgaria agriculture. This approach is especially relevant in the Bulgarian context where farmers has
for long used on farm risk-management strategies, even when insurance was compulsory during the
socialist period. The article has focused on contracting, irrigation and diversification of farm
productions as potential risk management strategies. We find, after controlling for farms and farmers'
structural characteristics, that farmers with diversified activities, using irrigation or contracts are
more likely to adopt insurance (and vice-versa). This result also suggests that many farms neither use
insurance, nor other on-farm risk management strategies. Advisory services should further focus on
those farms not managing risk and work on defining their optimal mix of risk management tools.
The dynamic pattern of the insurance market (how insurance use evolves over time) should also be
analyzed further. The current survey only concerns decisions for 2011, as such it does not allow us to
study the dynamics of insurance adoption. One question nevertheless enabled us to obtain some
information on the intention to purchase insurance for 2012. For 2012, 97 out of the 224 farmers
expressed their intention to take out insurance, of which 47 were insured in 2011. Among the 127
who indicated that they would not purchase insurance in 2012, 113 were not insured in 2011 either,
but 14 were. Further research should examine what influences farmers' willingness to continue to
take out insurance or not (Cabas et al. 2008). The development of the Bulgarian FADN panel dataset
is a promising advance for such deeper analysis of agricultural decisions in new EU countries.
Inclusion of risk information in the FADN will facilitate comparative analysis with other Member
States in the EU.

16
References
Blank, S. C. and J. McDonald (1996). Preferences for crop insurance when farmers are diversified.
Agribusiness 12(6): 583-592.
Cabas, J. H., A. J. Leiva and A. Weersink (2008). Modeling Exit and Entry of Farmers in a Crop
Insurance Program. Agricultural and Resource Economics Review 37(1): 92-105.
Cappellari, L. and S. P. Jenkins (2003). Multivariate probit regression using simulated maximum
likelihood. The Stata Journal 3(3): 278-294.
Dalton, T., G. A. Porter and G. A. Winslow (2004). Risk management strategies in humid production
regions: A comparison of supplemental irrigation and crop insurance. Agricultural and
Resource Economics Review 33: 220–232.
Di Falco, S., F. Capitanio and F. Adinolfi (2011). Natural Vs Financial Insurance in the
Management of Weather Risk Exposure in the Italian Agriculture. 2011 International
Congress, August 30-September 2, 2011, Zurich, Switzerland, European Association of
Agricultural Economists.
Enjolras, G., F. Capitanio and F. Adinolfi (2012). The demand for crop insurance: Combined
approaches for France and Italy. Agricultural Economics Review 13(1).
Enjolras, G. and P. Sentis (2011). Crop insurance policies and purchases in France. Agricultural
Economics 42: 475–486.
EU (2013). Proposal for a Regulation of the European Parliament and of the Council on support for
rural development by the European Agricultural Fund for Rural development (EAFRD) -
Consolidated draft regulation. http://register.consilium.europa.eu/pdf/en/13/st13/st13349-
re01.en13.pdf
Foudi, S. and K. Erdlenbruch (2012). The role of irrigation in farmer’s risk management strategies
in France. European Review of Agricultural Economics 39(3): 439-457.
Gardner, B. L. and R. A. Kramer (1996). Experience with Crop Insurance Programs in the United
States. Crop Insurance for Agricultural Development: Issues and Experience. P. Hazell, C.
Pomareda and A. Valdes. Baltimore, Johns Hopkins University Press.
Garnevska, E., J. Edwards and D. Vaughan (2006). Farm diversification opportunities in Bulgaria –
the perceptions of farmers in the Plovdiv region – a preliminary analysis. Journal of
International Farm Management 3(2): 1-14.
Garrido, A. and D. Zilberman (2008). Revisiting the demand of agricultural insurance: The case of
Spain. Agricultural finance review 68(1): 43-66.
Goodwin, B. K. (1993). An empirical analysis of the demand for multiple peril crop insurance.
American Journal of Agricultural Economics 75: 425–434.
Goodwin, B. K. and V. H. Smith (1995). The economics of crop insurance and disaster aid.
Greene, W. H. (2007). NLOGIT version 4.0 Reference guide. Plainview, N.Y.

17
Just, D. R., S. Wolf and D. Zilberman (2003). Principles of risk management service relations in
agriculture. Agricultural Systems 75(2-3): 199-213.
Just, R. E., L. Calvin and J. Quiggin (1999). Adverse Selection in Crop Insurance: Actuarial and
Asymmetric Information Incentives. American Journal of Agricultural Economics 81(4): 834-
849.
Mishra, A. K. and H. S. El-Osta (2002). Managing risk in agriculture through hedging and crop
insurance: what does a national survey reveal? Agricultural Finance Review 62(2): 135 -
148.
Mishra, A. K. and B. K. Goodwin (2003). Adoption of crop versus revenue insurance: A farm-level
analysis. Agricultural Finance Review 63(2): 143-155.
O’Donoghue, E. J., M. J. Roberts and N. Key (2009). Did the Federal Crop Insurance Reform Act
Alter Farm Enterprise Diversification? Journal of Agricultural Economics 60(1): 80-104.
Serra, T., Goodwin, B.G. and Featherstone, A.M. (2003). Modeling changes in the U.S. demand for
crop insurance during the 1990s. Agricultural finance review Fall(109-125).
Sherrick, B. J., P. J. Barry, P. N. Ellinger and G. Schnitkey (2004). Factors influencing farmers’
crop insurance decisions. American Journal of Agricultural Economics 86(1): 103– 114.
Smith, V. H. and A. E. Baquet (1996a). Demand for Multiple Peril Crop Insurance: Evidence from
Montana Wheat Farms. American Journal of Agricultural Economics 78(1).
Smith, V. H. and A. E. Baquet (1996b). The demand for multiple peril crop insurance: Evidence
from Montana wheat farms. American Journal of Agricultural Economics 78(189-201).
Smith, V. H. and J. W. Glauber (2012). Agricultural Insurance in Developed Countries: Where Have
We Been and Where Are We Going? Applied Economic Perspectives and Policy 34(3): 363-
390.
Smith, V. H. and B. K. Goodwin (1996). Crop insurance, moral hazard, and agricultural chemical
use. American Journal of Agricultural Economics 78: 428– 438.
Spörri, M., L. Baráth and I. Fertö (2012). The Impact of Crop Insurance on the Economic
Performance of Hungarian Cropping Farms. 123rd EAAE Seminar, Dublin, February 23-24.
Van Asseldonk, M., M. Meuwissen and R. Huirne (2002). Belief in disaster relief and the demand
for a public-private insurance program. Review of agricultural economics 24(1): 196-207.
Velandia, M., R. M. Rejesus, T. O. Knight and B. J. Sherrick (2009). Factors Affecting Farmers’
Utilization of Agricultural Risk Management Tools: The Case of Crop Insurance, Forward
Contracting, and Spreading Sales. Journal of Agricultural and Applied Economics 41(1):
107-123.
Wu, J. (1999). Crop insurance, acreage decisions, and nonpoint-source pollution. American Journal
of Agricultural Economics 81: 305–320.
18
Figure 1: Bulgaria

19
Table 1: Respondent characteristics Full sample Insured Non insured
Variable name description mean sd mean sd mean sd
Risk management
Insurance
=1 if the farmer was insured in
2011 0.27 0.45
Irrigation
=1 if the irrigated area is
positive 0.26 0.44 0.29 0.45 0.18 0.39
*
Diversification
=1 if the number of activities
on the farm is higher than one 0.62 0.49 0.54 0.50 0.84 0.37
***
Contract
=1 if the farmer has signed at
least one contract with a
processor, a wholesaler or a
retailer 0.55 0.50 0.47 0.50 0.75 0.43
***
Farm structure
Individual_D =1 if the legal status of the farm
is an individual farm 0.90 0.30 0.96 0.19 0.72 0.45
***
spe_crop_D =1 if the main source of income
of the farm is arable crops 0.54 0.50 0.49 0.50 0.67 0.47
**
spe_livestock_D =1 if the main source of income
of the farm is livestock farming 0.09 0.29 0.09 0.28 0.10 0.30
spe_perennial_D =1 if the main source of income
of the farm is perennial crops 0.14 0.35 0.18 0.39 0.02 0.13
***
spe_mixed_D =1 if the income of the farm
comes from both livestock and
arable crops 0.23 0.42 0.24 0.43 0.21 0.41
Small_D =1 if the farm UAA is < 2ha
0.36 0.48 0.45 0.50 0.11 0.32
***
Medium_D =1 if the farm UAA is ≥ 2ha
and <20ha 0.38 0.49 0.42 0.50 0.26 0.44
**
Large_D =1 if the farm UAA is ≥ 20ha
0.26 0.44 0.13 0.34 0.62 0.49
***
RentedLand Number of hectares of the
UAA rented 123.21 386.72 22.99 164.34 391.00 618.64
***
Farm location
NorthWest_D =1 if the farm is located in the
North West of Bulgaria 0.21 0.40 0.11 0.31 0.46 0.50
***
NorthCentral_D =1 if the farm is located in
North Central of Bulgaria 0.19 0.39 0.21 0.41 0.15 0.36
NorthEast_D =1 if the farm is located in the
North East of Bulgaria 0.15 0.36 0.13 0.34 0.20 0.40
SouthEast_D =1 if the farm is located in the
South East of Bulgaria 0.16 0.37 0.16 0.37 0.16 0.37
SouthWest_D =1 if the farm is located in the
South West of Bulgaria 0.14 0.35 0.19 0.39 0.02 0.13
***
SouthCentral_D =1 if the farm is located in
South Central Bulgaria 0.15 0.36 0.20 0.40 0.02 0.13
***
Climate and risk perception
Day_snow Number of days of snow per
year (average 2007-2010) 33.30 18.36 32.32 19.60 35.93 14.34
Day_precip Number of days of
precipitations per year (average
2007-2010) 105.69 24.94 108.21 26.74 98.93 17.86
Day_storm Number of days with
thunderstorm per year (average
2007-2010) 21.80 8.81 22.92 9.24 18.80 6.76
Riskevents_avg
Number of risky events per
year as declared by the farmer
(average 2007-2010) 0.54 0.86 0.46 0.75 0.75 1.08
**
Inforisk_D =1 if the farmer receives
information regarding risk
management 0.42 0.50 0.41 0.49 0.46 0.50
20
Farmer characteristics
Education1_D
=1 if the farmer has received no
or only primary education 0.06 0.23 0.06 0.23 0.07 0.25
Education2_D
=1 if the farmer has received
secondary education 0.63 0.49 0.65 0.48 0.56 0.50
Education3_D
=1 if the farmer has received
tertiary education 0.32 0.47 0.29 0.46 0.38 0.49
Age Age at the date of the interview 41.88 13.38 40.04 12.45 46.79 14.60 ***
Financial characteristics
Credit_D =1 if the farmer has on-going
credits 0.24 0.43 0.19 0.39 0.38 0.49
***
N 224 61 163
The last column presents the results of non-parametric tests (Mann Witney rank sum test for continuous variables or Chi2
for binary variables) comparing two groups: the users and the non-users of insurance (*** p<0.01, ** p<0.05, * p<0.1)
Table 2: Number of farmers using the different risk management tools
Insured Non-insured
Use of irrigation 11
(18%)
47
(28.8%)
Pearson chi-sq=2.69
Pr = 0.10
Diversified farm activities (more than 1) 51
(83.6%)
88
(54%)
Pearson chi-sq=16.54
Pr = 0.00
Existence of contracts 46 (75.4%) 77
(47.2%)
Pearson chi-sq=14.23
Pr = 0.00
Total 61 Total 163
21
Table 3: Parameter estimates from the Multivariate Probit and Individual Probits for
estimating the factors affecting insurance adoption, as well as on-farm risk management tools
Multivariate probit (15 draws) Individual probit
(1) (2) (3) (4) (1') (2') (3') (4')
Expl. Variables Insurance Contract Irrigation Diversification Insurance Contract Irrigation Diversification
Individual_D -0.3383 -0.3974 0.4127 0.1305 -0.248 -0.336 0.645 0.768
(-0.6137) (0.5300) (0.8743) (4.1885) (0.443) (0.345) (0.618) (0.587)
spe_crop_D 0.0786 -0.6192** -0.2998 -2.0015 0.229 -0.525** -0.191 -1.896***
(-0.5267) (0.3096) (0.3150) (2.2285) (0.327) (0.260) (0.271) (0.368)
spe_livestock_D -0.0952 -0.0551 -1.1206 -3.8298 0.135 -0.00635 -1.173*** -4.293***
(-0.8481) (0.4987) (0.8188) (2.9289) (0.454) (0.369) (0.440) (0.659)
spe_perennial_D -2.0904 -0.7761* -0.3249 -3.0904 -1.470*** -0.700** -0.159 -2.971***
(-1.8414) (0.4413) (0.4322) (3.0233) (0.527) (0.339) (0.372) (0.442)
RentedLand 0.0010 0.0008 -0.0017 0.0201 0.00101* 0.000957* -0.0021*** 0.0232***
(-0.0008) (0.0005) (0.0037) (0.1360) (0.000586) (0.000524) (0.000650) (0.00793)
Small_D -1.8443** -0.0398 0.4554 1.1655 -2.114*** -0.0893 0.285 1.158***
(-0.7500) (0.3842) (0.7897) (2.3687) (0.412) (0.301) (0.325) (0.380)
Medium_D -1.1057** 0.0029 0.1723 0.7592 -1.324*** -0.0319 -0.0578 0.868**
(-0.5246) (0.3341) (0.7679) (1.7871) (0.388) (0.287) (0.305) (0.344)
NorthCentral_D -2.9219*** -0.3110 -0.6850 -0.9632 -2.691*** -0.242 -0.538 -0.985**
(-0.7600) (0.3797) (0.6104) (1.6107) (0.529) (0.312) (0.363) (0.394)
NorthEast_D -1.8677** 0.7059* -1.2837 -0.2125 -2.199*** 0.730** -1.134** -0.195
(-0.7386) (0.3926) (0.8488) (1.9509) (0.461) (0.365) (0.546) (0.434)
SouthEast_D -0.2464 0.8102 0.0546 0.8504 -0.712 0.852** -0.0140 0.947*
(-1.0357) (0.5319) (0.6052) (2.4919) (0.482) (0.405) (0.437) (0.503)
SouthWest_D -2.6268** -0.0930 0.1214 -1.1259 -2.824*** -0.0756 0.217 -1.240***
(-1.5982) (0.4933) (0.4685) (1.1647) (0.634) (0.353) (0.405) (0.428)
SouthCentral_D -1.8571 0.2974 0.7309 -0.2075 -2.224*** 0.236 0.751** -0.389
(-0.9326) (0.5245) (0.5741) (3.2520) (0.744) (0.375) (0.378) (0.424)
Education1_D 0.3513 0.5587 -0.2655 -1.2460 0.214 0.647 -0.245 -0.987**
(-1.0567) (0.6296) (0.6807) (10.4391) (0.434) (0.400) (0.420) (0.439)
Education2_D -0.5738 -0.0727 -0.3530 -0.0406 -0.504* -0.0348 -0.339 -0.234
(-0.4642) (0.2513) (0.3628) (0.5342) (0.280) (0.205) (0.237) (0.242)
Age 0.0126 -0.0028 -0.0067 0.0154 0.0140* -0.00251 -0.00690 0.00954
(-0.0148) (0.0081) (0.0120) (0.0296) (0.00839) (0.00645) (0.00717) (0.00765)
Day_snow 0.0056 0.0227** -0.0111 0.0092 -0.00186 0.0209** -0.0124* 0.0106
(-0.0288) (0.0109) (0.0108) (0.0932) (0.0141) (0.00856) (0.00715) (0.00789)
Day_storm 0.0256 -0.0076 -0.0016 0.0047 0.0270** -0.00833 -0.00362 0.000912
(-0.0214) (0.0081) (0.0099) (0.0394) (0.0111) (0.00668) (0.00690) (0.00798)
Day_precip -0.0815 0.0340 -0.0043 0.0029 -0.0678* 0.0339 2.17e-05 0.00342
(-0.0697) (0.0302) (0.0408) (0.0969) (0.0390) (0.0242) (0.0238) (0.0250)
Riskevents_avg 0.2370 -0.1598 0.4522** -0.2547 0.158 -0.184 0.419** -0.238*
(-0.3154) (0.2039) (0.1889) (0.5836) (0.198) (0.129) (0.186) (0.145)
Inforisk_D 0.8273* 0.2446 0.0006 0.1259 0.750*** 0.258 0.0628 0.173
(-0.4868) (0.2388) (0.3462) (1.9316) (0.283) (0.203) (0.225) (0.221)
Credit_D -0.2660 0.3311 -0.1925 0.2755 -0.340 0.294 -0.189 0.178
(-0.6193) (0.3040) (0.4124) (6.1191) (0.326) (0.255) (0.313) (0.300)
Observations 224 224 224 224 224
Log likelihood -360.365 -61.457 -130.780 -93.316 -83.336
Sensitivity 73.77% 73.98% 50% 87.77%
Specificity 93.25% 60.40% 90.96% 75.29%
Correlation coefficients (MVP): ρ12=0.352***; ρ130.551***; ρ23=0.120; ρ14=0.714***; ρ24=0.142; ρ34=-0.171***
Figures in parenthesis are bootstrapped standard errors for the multivariate probit and heteroskedasticity-robust standard
errors for the individual probits. ***, ** and * represent statistical significance at 1%, 5% and 10% level respectively.
22
Table 4: Marginal effects from the Multivariate Probit and Individual Probits for estimating
the factors affecting adoption of insurance
Expl. variables Multivariate probit Individual probit (1) (1')
Insurance Insurance
Individual_D -0.2198
*** -0.248
(0.0138) (-0.443) spe_crop_D 0.1803
*** 0.229
(0.0272) (-0.327) spe_livestock_D 0.2466
*** 0.135
(0.0550) (-0.454) spe_perennial_D -0.8249
*** -1.470
***
(0.0366) (-0.527) RentedLand 0.0006
*** 0.00101
*
(0.00057) (-0.0006) Small_D -0.9888
*** -2.114
***
(0.0380) (-0.412) Medium_D -0.5725
*** -1.324
***
(0.0199) (-0.388) NorthCentral_D -1.1969
*** -2.691
***
(0.0479) (-0.529) NorthEast_D -0.6583
*** -2.199
***
(0.0466) (-0.461) SouthEast_D -0.2136
*** -0.712
(0.0197) (-0.482) SouthWest_D -1.2631
*** -2.824
***
(0.0383) (-0.634) SouthCentral_D -1.0816
*** -2.224
***
(0.0533) (-0.744) Education1_D 0.1842
*** 0.214
(0.0063) (-0.434) Education2_D -0.1843
*** -0.504
*
(0.0174) (-0.28) Age 0.0077
*** 0.0140
*
(0.0004) (-0.0084) Day_snow 0.0030
*** -0.0019
(0.0001) (-0.0141) Day_storm 0.0133
*** 0.0270
**
(0.0005) (-0.0111) Day_ precip -0.0411
*** -0.0678
*
(0.0014) (-0.039)
Riskevents_avg .02509***
0.158 (0.0172) (-0.198) Inforisk_D 0.3698 0.750
***
(0.0172) (-0.283) Credit_D -0.1157
*** -0.34
(0.0040) (-0.326)
Marginal effects are calculated at the means of explanatory variables. MVP: NLOGIT4 Marginal Effects; Individual
Probit: Stata margins, dydx(*) atmeans