Determinants of bank lending in PICs
28
GRIFFITH UNIVERSITY–SOUTH PACIFIC CENTRAL BANKS JOINT POLICY RESEARCH WORKING PAPER SERIES Griffith Asia Institute Griffith University–Reserve Bank of Fiji JPRWP#19 Determinants of bank lending in PICs Kalolaini Ranadi Reserve Bank of Fiji Jacinta Hesaie Reserve Bank of Fiji Susana Vosamacala Reserve Bank of Fiji Md Nurul Kabir North South University Md Dulal Miah University of Nizwa Parmendra Sharma Griffith University
Transcript of Determinants of bank lending in PICs

GRIFFITH UNIVERSITY–SOUTH PACIFIC CENTRAL BANKS JOINT POLICY RESEARCH WORKING PAPER SERIES
Griffith Asia Institute
Griffith University–Reserve Bank of Fiji JPRWP#19
Determinants of bank lending in PICs Kalolaini Ranadi Reserve Bank of Fiji
Jacinta Hesaie Reserve Bank of Fiji
Susana Vosamacala Reserve Bank of Fiji
Md Nurul Kabir North South University
Md Dulal Miah University of Nizwa
Parmendra Sharma Griffith University
Griffith Asia Institute
Griffith University–South Pacific Central Banks Joint Policy Research Working Paper Series
Determinants of bank lending in PICs
Kalolaini Ranadi1, Jacinta Hesaie1, Susana Vosamacala1 Md Nurul Kabir2, Md Dulal Miah3 and Parmendra Sharma4
1 Reserve Bank of Fiji
2 Department of Accounting and Finance, North South University 3 Department of Economics and Finance, University of Nizwa
4 Department of Accounting Finance and Economics and Griffith Asia Institute

About the Griffith Asia Institute The Griffith Asia Institute (GAI) is an internationally recognised research centre in the Griffith Business School. GAI aims to be the informed voice leading Australia's strategic engagement in the Asia Pacific by cultivating knowledge, capabilities and connections that will inform and enrich Australia's Asia-Pacific future. GAI's focus is on conducting and supporting excellent and relevant research on the politics, security, economies and development of the Asia-Pacific region; facilitating effective partnerships and policy outcomes for positive impact in the region; leading and informing public debate on Australia's place in the Asia Pacific; and shaping the next generation of Asia-Pacific leaders. The Institute reflects Griffith University's longstanding commitment to the study of and engagement with nations of Asia and the near Pacific.
About this publication The Joint Policy Research Working Paper Series endeavours to disseminate the findings of work in progress to academics, governments and the public at large to encourage the exchange of ideas relating to the development of the South Pacific financial sector and thereby national economic growth and development. The papers carry the names of the authors and should be cited accordingly. The findings, interpretations, and conclusions expressed in this paper are entirely those of the authors and do not necessarily represent the views of the partner Bank or Government. Disseminating findings quickly, even if work is still in draft form, is expected to encourage early and wider debate. This joint Reserve Bank of Fiji—Griffith University working paper is part of an ongoing extensive research capacity building program led by Griffith University for the South Pacific central banks. The authors are grateful to Ms Caroline Waqabaca and the Economics Group of the Reserve Bank of Fiji for their valuable comments on this paper. The texts of published papers and the titles of upcoming publications can be found on South Pacific Centre for Central Banking page on the Griffith Asia Institute website: www.griffith.edu.au/asia-institute/our-research/south-pacific-centre-central-banking ‘Determinants of bank lending in PICs’, Griffith University–South Pacific Central Banks Joint Policy Research Working Paper No. 19, 2021.

About the Authors Kalolaini Ranadi Ms Kalolaini Ranadi is an Economist at the Reserve Bank of Fiji, with 8 years of experience as a Central Banker. Her areas of research interests include monetary and macroeconomic policy issues and economic development in the South Pacific, particularly Fiji. Kalolaini holds a Master’s degree from Columbia University. Jacinta Hesaie Ms Jacinta Hesaie is currently Manager External Conditions Unit at the Economics Group of the Reserve Bank of Fiji. Jacinta has around 15 years of central banking experience. She has also spent three years as a Local Economist at the International Monetary Fund’s Resident Representative Office for Pacific Islands. Ms Hesaie holds a Masters of International Economics and Finance from the University of Queensland. Susana Vosamacala Ms Susana Vosamacala is an Economist for the Financial Conditions Unit at the Economics Group of the Reserve Bank of Fiji. She holds a Masters of Commerce, Post Graduate Diploma and a Bachelor of Commerce from the University of the South Pacific. She has been a Central Banker for the past four years and prior to joining RBF, she was an Economic Planning Officer for the Ministry of Economy. Md Nurul Kabir Dr Nurul Kabir is an Assistant Professor in Finance at North South University, Bangladesh. He completed his PhD in Islamic Finance at Griffith University and his MBA and BBA at Ritsumeikan Asia Pacific University in Japan with a major in Finance. Nurul’s research focuses on credit risk in banking, particularly a comparative analysis between Islamic and conventional banking. His research interest extends to corporate governance and corporate social responsibility in an international context. Nurul published two book chapters and several journal articles in internationally reputed journals, including Energy Economics, International Review of Economics and Finance, Pacific-Basin Finance Journal, and International Review of Financial Analysis. Nurul has presented his research at conferences such as AFAANZ, Australasian Banking and Finance Conference, Malaysian Finance Association conference and other major conferences. Md Dulal Miah Dr Mohammad Dulal Miah is an Associate Professor and Head of the Department of Economics and Finance at the University of Nizwa, Oman. He obtained his Master’s degree (MBA) in Finance and PhD in Development Economics from Ritsumeikan Asia Pacific University, Japan. Dr Miah has co-authored three books and more than 30 research papers in peer reviewed journals. He has attended numerous international conferences as invited speaker and facilitator in various countries. His research interest includes institutional economics, corporate governance, Islamic finance and banking, comparative financial systems, and environmental finance. Currently he is serving as editorial member of several journals. Parmendra Sharma Dr Parmendra Sharma is a senior lecturer and the program convenor of the South Pacific Centre for Central Banking at Griffith University. His publications are beginning to fill the huge vacuum in the literature relating to South Pacific’s financial sector, including on issues such as determinants of bank interest margins, profitability and efficiency. His recent publications include Factors influencing the intention to use of mobile value-added services by women-owned micro enterprises in Fiji), Microfinance and microenterprise performance in Indonesia (International Journal of Social Economics), A first look at the trilemma vis-à-vis quadrilemma monetary policy stance in a Pacific Island country context, (Review of Pacific Basin Financial Markets Policy), Mobile value added services in Fiji: Institutional drivers, industry challenges and adoption by women micro entrepreneurs (Journal of Global Information Management) and Bank reforms and Efficiency in Vietnamese Banks: Evidence based on SFA and DEA (Applied Economics).
Contents Abstract ......................................................................................................................................................... 1
1. Introduction ............................................................................................................................................. 2
2. Literature review ................................................................................................................................... 4
3. Hypothesis development .................................................................................................................... 6
3.1. Quality capital and credit expansion ................................................................................ 6
3.2. Deposit funding and loan expansion ................................................................................ 6
3.3 Bank’s credit risk and lending capacity ........................................................................... 7
4. Data, variable definition and descriptive statistics ..................................................................... 9
4.1 Data and sample .................................................................................................................... 9
4.2 Variable definition and measurement ............................................................................. 9
4.3. Model specification and estimation technique ......................................................... 10
4.4. Descriptive statistics ......................................................................................................... 10
4.5 Correlation matrix ............................................................................................................... 11
5. Results .................................................................................................................................................... 13
5.1 Baseline regression results............................................................................................... 13
5.2 Lending behaviour by banks and credit institutions ................................................ 15
5.3 Lending behaviour by country ........................................................................................ 16
5.4 Robustness test................................................................................................................... 17
6. Conclusion ............................................................................................................................................. 19
Notes and references ............................................................................................................................. 20

Determinants of bank lending in PICs
Joint Policy Research Working Paper #9 1
Abstract
The paper examines the determinants of bank lending in three Pacific Island Countries—Fiji, Vanuatu, and the Solomon Islands. We collect data from 21 financial institutions comprising of 15 banks and 6 credit institutions for the period of 2000-2018. Our final dataset consists of 229 firm-year observations. We apply ordinary least square (OLS), fixed effect, and system Generalised Method of Moments (GMM) estimation techniques. Results show that banks’ asset size, core capital, customer deposits, and profitability are positively related to loan growth. On the other hand, interbank deposit and non-performing loans negatively affect banks’ loan growth. We further show that the effects of these variables are stronger for banks than credit institutions. Our results remain robust even if we apply alternative proxy for bank lending. The results of the research offer some policy implications for regulatory authority, practitioners, and policymakers. Keywords: Commercial banks, Credit, Deposit, Risk, Pacific island countries

Determinants of bank lending in PICs
2 Joint Policy Research Working Paper #9
1. Introduction
The role of finance in economic growth has been a subject of academic discussion since the time of Adam Smith. Smith emphasised the role of finance as a means of lowering transaction cost and greater specialisation (Beck, 2011). Much earlier, Bagehot (1873) reinforced the discussion by arguing loanable funds, when channelled effectively through the formal financial system, encourages economic activities and facilitates the development of backward and forward linkage industries through its positive spill-over effects. Similarly, Schumpeter (1934) argued that financial intermediaries play a pivotal role in economic development as they provide prospective entrepreneurs with access to necessary finance for technological innovation. Entrepreneurs or corporate sectors make investments in an effort to generate profits, based on their rational judgments, and are considered the deficit units (Suzuki and Miah, 2018). Households, as a net surplus unit in the economy, supplies funds for required investment at a reasonable cost. Banks and credit institutions, as financial intermediaries, facilitate the mediation of funds from surplus to deficit units by socialising borrowers’ credit risk. As a result, an efficient credit channel that can successfully match the demand of and supply for funds is considered an essential precondition for economic growth. Historical accounts of most developed countries support this hypothesis (Beck et al., 2001; Claessens and Laeven, 2005; Botric and Slijepcevic, 2008; Greenwood and Jovanovic, 1990; Jappelli and Pagano,1994; Jayaratne and Strahan, 1996; Bloch and Tang, 2003; Levine, 2003). While the positive effect of banks’ credit on economic growth remains valid, an unsustainable level of credit expansion can fuel a potential financial bubble which may result in economic catastrophe. For instance, the lending patterns that happened prior to the East Asian financial crisis were similar to the earlier collapse in the banking systems of Nordic countries which occurred after periods of swift credit growth in real estate related investments (Claessens, et al. 2014). Kindleberger (2011) draws a comprehensive historical analysis of financial crises and shows that there have been four significant waves of financial crisis since the early 1970s - the Mexican crisis in 1980s, Japanese economic slump in 1990s, Asian financial crisis in 1990s, and the United States subprime meltdown which began in 2007. These financial crises followed a wave of credit bubbles (Caprio and Klingebiel, 2002; Kindleberger, 2011; Reinhart and Rogoff, 2013). The build-up of systemic risk resulting from an unnecessary credit boom on the one hand, and the productivity loss owing to suboptimal level of credit supply on the other, herald the idea that the credit market should be carefully monitored to smooth the cycle of credits (Alessi and Detken, 2018). This requires identifying the determinants that affect credit expansion by lending institutions. This paper contributes to this end. It provides new and important information by identifying the determinants of credit in the context of three Pacific Island Countries (PICs). Financial systems in PICs are highly concentrated and dominated by foreign banks with commercial banks and superannuation funds making up a large part or the entire financial system. Banks are profitable with a large portion of revenue derived from non-interest income (foreign exchange transaction commission and fees) and relatively higher interest rate spreads. The smallness, geographical dispersion and vulnerability to shocks especially natural disasters of PICs also affects the financial sector, in particular, the structural composition – that is the presence of a few large foreign banks. In addition, given the early stage of development of most PICs, a large portion of the population remains unbanked

Determinants of bank lending in PICs
Joint Policy Research Working Paper #9 3
(Davis et al., 2016; Jamaludin et al., 2015; Sharma & Gounder, 2012). Earlier studies by Sharma & Gounder (2012) on the determinants of bank lending to the private sector for six PICs indicated that lending and inflation rates negatively affected credit growth, while economic growth, deposit and asset size, positively influenced credit growth. While other PIC studies use macro-country level indicators, this study takes into account individual banking data. Therefore, apart from macroeconomic variables like GDP and inflation, this study analysed other individual bank specific indicators like the quality of bank capital (tier-1 capital), deposit funding, interbank deposits, provisioning of doubtful debts, size, profitability and their impact on lending. Due to data limitations, three countries (Fiji, Solomon Islands and Vanuatu) were included in this study. The data collected covered the period 2000-2018, with the final sample comprising 229 annual firm level observations. The estimation techniques used were: OLS, fixed effect and GMM. Key empirical findings indicate that banks’ core capital, customer deposits, bank size and profitability are positively correlated with credit growth. The results of this study support findings of other literatures by Churchill and Lewis (1986), Jiminez et al. (2012), Imran and Nishat (2013), Butt et al. (2014), Kosak et al. (2015), Beccalli et al. (2015), Louhichi and Boujelbene (2017) and Azad et al. (2019). Surprisingly, inflation positively influenced credit growth mainly because the average inflation for the three sample countries remained below 3 percent. However, interbank deposits and non-performing loans (NPLs) negatively influenced credit growth which supported the findings of Kosak et al. (2015) and Louhichi and Boujelbene (2017). This paper’s findings validate the policies that PICs have already begun to implement, in trying to widen the deposit base and applying Basel best practises. The contribution of this paper is threefold. First, to the best of our knowledge, this is the first study that examines the determinants of bank lending applying the GMM estimation technique. According to the literature, this estimation technique is more robust and could possibly solve the endogeneity problem that exists in the panel data set (Kabir, et al., 2020). Second, regulatory authorities including the central bank, require precise information regarding the determinants of credit expansion for making economic policies. Specifically, in developing countries such as PICs, monetary policy is mostly transmitted through the credit channels (Mishra et al. 2016; Anwar and Nguyen, 2018). Hence, it is imperative to provide evidence to the monetary authority about the determinants that affect bank lending so that central banks can consider these determinants for the transmission of monetary policy. Third, maintaining a robust and developed banking system has always proved to be a challenging task to regulatory authorities because the banking system, unlike other industries in the economy, is very dynamic and sensitive to various internal and external shocks. In PICs, banks compared to the capital market, contribute greatly to the financial system. Hence, the financial stability of these countries relies critically on the stability of the banking system. This research will provide information for policymakers to achieve financial stability by taking into account the determinants of banks’ lending activities. The rest of the paper is organised as follows: Section 2 reviews past studies on bank lending; Section 3 presents the hypothesis development. Sections 4 and 5 discuss the data, methods and empirical findings, and Section 6 concludes and provides some policy implications and future direction.
Determinants of bank lending in PICs
4 Joint Policy Research Working Paper #19
2. Literature review
The extant literature on banking takes the view that banks’ lending decisions are influenced by both demand and supply factors which can broadly be classified into four categories (i) bank-specific (ii) macroeconomic (iii) monetary and (iv) other factors (Adedoyin & Sobodun, 1996). Bank-specific features include profitability, liquidity and solvency (Olokoyo, 2011), and legal and regulatory frameworks comprising creditor rights, collateral & bankruptcy laws, accounting standards etc. (Cottarelli et al. 2003; Haselmann et al. 2010; Sharma & Nguen, 2010). Monetary variables take into account the monetary policy indicator rate, financing costs and broad money (Pruteanu-Podpiera, 2007). Macroeconomic variables include economic growth and inflation (Sacerdoti, 2005), while other factors include corruption (Akins, Dou, & Ng, 2017), and bank ownership type etc. (Xiaolin & Kewei, 2017; Sapienza, 2004). One of the underlying drivers of lending is bank capital, which has been widely debated since the introduction of the Basel Capital Accord in 1988 (Gambacorta & Mistrulli, 2004; Ladime et al. 2013). Kosak et al. (2015) find that tier-1 capital (but not tier-2 capital) enables banks to withstand periods of financial distress and maintain or even increase their lending activity. This is consistent with the findings by Miyajima (2017), Ladime et al. (2013), Louhichi & Boujelbene (2017) and Nguyen & Dang (2020). The positive impact of capital on bank lending is based on the risk absorption theory, which asserts that a larger capital base improves the risk bearing capacity of banks and stimulates lending activity (Coval & Thakor, 2005). The funding structure of banks also affects their lending behaviour. Kosak et al. (2015) conclude that a high proportion of customer deposits (but not interbank deposits) have a positive and significant influence on credit growth. Ivanovic (2016) also provides evidence that deposit growth contributed positively to lending in Montenegro during pre - and post-crisis periods. These results support the classical loanable funds theory, which states that bank loans depend on pre-existing savings (Pham, 2015). The macroeconomic environment in which a bank operates also influences its lending decisions. For instance, in a period of economic boom, we generally expect demand for credit to increase, while in a recession, demand for credit plummets. This pro-cyclical link between economic growth and bank lending was observed by Dell' Ariccia & Marquez (2006), who argued that in a boom period, banks tend to relax their criteria and lend to both good and bad projects. However, in a recession, most loans become non-performing and the source of credit dries up, resulting in rationing out of even good projects. Ivanovic (2016) shows that GDP growth contributed to robust credit growth in Montenegro in the pre-crisis period, but not in the post crisis period. This can be explained by the fact that although growth resumed after the crisis it remained moderate mainly due to banks’ risk averse approach. Another important factor for bank lending is credit risk. Studies by Ivanovic 2016; Miyajima 2017; Nguyen & Dang 2020 reveal the negative impact of credit risk, measured by rising non-performing loans on bank lending. Studies exploring the determinants of bank lending in the PICs are limited, which demands further research. Sharma & Gounder (2012) in analysing six PICs, namely Fiji, Papua New Guinea (PNG), Solomon Islands, Vanuatu, Samoa and Tonga for the period 1982 to 2009, find the negative impact of rising lending rates and inflation on bank credit to the private sector, while stronger economic growth, larger deposit banks’ funding, asset size and the presence of a stock market had a positive effect. Regarding the role of legal institutions on banking development, Sharma & Nguyen (2010) find that creditor protection and

Determinants of bank lending in PICs
Joint Policy Research Working Paper #19 5
enforcement quality in Fiji are quite weak relative to international standards, although broadly in line with ratings of developing countries. A more recent study on PNG by Kasingua et al. (2020) show that deposits, GDP growth, net foreign assets and real exchange rate contributed positively and significantly to private sector credit in the long run. Hence, this study fills the gap in current literature on the determinants of bank lending, particularly for developing island economies. To our knowledge, this is the first study to empirically examine whether the quality of bank capital (i.e. tier-1 capital) matters for lending in PICs. Similar to Kosak et.al. (2015), we evaluate the impact of credit risk and types of deposit funding - that is, customer and interbank deposits - on lending. The paper also considers other bank-specific factors (size, return on asset (ROA) and fixed asset ratio) and macroeconomic variables (inflation and GDP growth). Results from the paper can contribute and support informed policy decision making.

Determinants of bank lending in PICs
6 Joint Policy Research Working Paper #19
3. Hypothesis development
3.1. Quality capital and credit expansion
Studies affirm that banks with adequate capital base are able to protect themselves against large and unexpected losses and the risk of solvency, essentially supporting lending even during a crisis (Diamond & Rajan, 2000; Jokipii & Milne, 2008; Kosak, et.al. 2015; Rajan, 1994; Thakor, 1996; Zelenyuk, Faff, & Pathan, 2017). Banks are not allowed to freely use their capital for lending purpose as they have to maintain a specific portion of their risk-weighted assets as regulatory capital composed of tier-1 (core) and tier-2 capital. The larger the regulatory capital, the higher the buffer for absorbing adverse economic and financial shocks. Anginer & Demirguc-Kunt (2014) find that tier-1 capital has the greatest impact in reducing systemic fragility. In particular, during a tighter monetary policy regime, a higher level of banks’ own capital helps them continue to lend without facing credit constraints (Akhtar et al. 2019). Maintaining an adequate capital base also boosts depositors’ confidence in individual institutions and the financial system. On the other hand, holding higher capital may incentivise banks to take greater lending risks due to moral hazard concerns, which could, in turn, lead to faster lending growth as well as larger problematic loans (Jensen & Meckling, 1976; Louhichi & Boujelbene, 2017). In this regard, strengthening banks’ capital structure together with an effective risk management strategy will curtail their excessive risk-taking behaviour and help cushion the impact of any unanticipated shocks (Jokipii & Milne, 2011). Like most other countries, Fiji, Solomon Islands and Vanuatu, have regulatory capital requirements as recommended by Basel Accords. Banks in PICs have strengthened their capital structures due to PICs’ unique characteristics. Davis et al. (2016) found that banks in PICs have generally held capital in excess of regulatory requirements—to manage the high-risk perception as a result of low and/or volatile growth, potential political instability and vulnerability to shocks like natural disasters. The same was found by Kasingu et al. (2020) in a more recent research on the determinants of credit in PNG. Secondly, the nature of the banking system could be a factor. For example, Kasingu et al. (2020) indicate that higher capital is mainly due to the oligopolistic nature of the banking system in PNG. Thirdly, while exchange control restrictions have eased over the years, these policies likely contributed to higher capital as profit remittance becomes delayed (Davies, Vaught, & Cabezon, 2016). These factors, in turn, are reflected in the relatively high interest spreads contributing to the profitability of banks in PICs (Jamaludin et al. 2015). Higher profitability captured under tier-1 capital would imply more funds for lending. For these reasons, we expect that the tier-1 capital ratio is positively associated with lending growth. This leads to the following hypothesis:
H1: higher quality capital base leads to greater loan expansion.
3.2. Deposit funding and loan expansion
As mentioned earlier, it is not banks’ own capital that forms their primary source of funding. Rather, it is the deposit that constitutes the major share of banks’ funding. Hence, banks that can secure an augmented number of deposits are financially more capable of expanding loans at a greater scale. Two major forms of banks’ deposits are customer deposits and interbank deposits. Customer deposits or core deposits provide a stable source of funding for banks (Berlin & Mester, 1999; Guo, K. & Stepanyan, V, 2011, Song & Thakor, 2007; Vazquez and Federico, 2012). Since customer deposits are usually insured, it can shield bank funding costs against economic shocks (Berlin & Mester, 1999).

Determinants of bank lending in PICs
Joint Policy Research Working Paper #19 7
In the case of PICs, banks rely largely on domestic deposits to fund their lending activity. When studying six PICs, Sharma and Gounder (2012) found that deposit funding had a significant positive relationship with private sector credit. Nonetheless, deposit levels vary widely across the PICs with a large portion of their populations remaining unbanked. To help address the untapped savings demand and to grow banks’ deposit base, countries have introduced a number of financial inclusion initiatives along with mobile banking to improve banking services in rural areas (Sharma & Gounder, 2012). As such, we expect large customer deposits to have a positive effect on bank lending. This leads us to formulate the following hypothesis:
H2a: Higher customer deposits support more lending activity. Customer deposits can be demand and time deposits. However, major loans are usually extended for a fixed term. This creates a maturity mismatch between deposits and loans of a bank. If the demand for deposit withdrawal is higher at a particular point in time, banks may face short-term liquidity crisis which prompts them to borrow from other banks in overnight markets to meet the demand of depositors (Mistrulli, 2011; Fouque & Ichiba, 2013). Hence, interbank deposits are not considered a stable source of funding for commercial banks. Kosak et al. (2015) found that interbank deposits negatively affected bank lending during the global financial crisis. Banks tried to compensate for this by turning to a more stable funding source, such as retail deposits (European Central Bank, 2011). Yang et al. (2011) in examining monetary policy in PICs, explain that interbank lending is limited in PICs and/or interbank markets are illiquid. In addition, due to the smallness, shallow nature and institutional composition of their financial systems, publicly owned provident funds in PICs play an important role as providers of funds/liquidity to banks. Moreover, given their relatively large deposit size, provident funds significantly influence the movements of deposit levels and rates (Davis et al. 2016; Jamaludin et al. 2015; Yang et al. 2011). These actions in some instances can prompt interbank activity, albeit still limited due to the nature of the market. As such, we expect an increase in interbank deposits to be negatively associated with bank lending. This leads us to the following hypothesis:
H2b: Large interbank deposits reduce bank lending.
3.3 Bank’s credit risk and lending capacity
Besides banks’ capital base and deposit funding, credit risk, measured by the provision for doubtful debts1 to gross loans ratio, has a bearing on lending activity.2 Banks’ credit risk increases if a borrower fails to meet payment commitment to the bank. For such unanticipated payment defaults from borrowers, banks have to maintain adequate provision as a buffer against customers’ default risks. Such provisions allow banks to recognise the estimated loss from a particular loan portfolio before it materialises. However, mandatory and voluntary provisions limit banks’ available financial resources to expand as loans. Moreover, during economic downturns, the level of provisioning may be insufficient to cover the potential loan losses, which means that banks will require to cover the excess loan loss from its capital. Managing such credit risk can also be costly and therefore, affects the income and profitability of banks (Zou & Li, 2014). This, in turn, can erode banks’ capital and discourage banks from offering new loans (Bernake & Lown, 1991; Peek et al. 2003). On the other hand, a rapid expansion of credit can also be an indication of poor screening and lending to borrowers of lower quality which can contribute to credit losses (Kumar et al. 2018). As discussed earlier, the perception of risk is much higher in PICs (Davis et al. 2016; Guo & Stepanyan, 2011; Kasingu et al. 2020). For most PICs, credit risk mitigating factors such as proper bankruptcy laws, reliable contract enforcement, credit reporting bureaus and inadequate markets to liquidate collateral in a timely manner without incurring significant loss

Determinants of bank lending in PICs
8 Joint Policy Research Working Paper #19
are lacking (Jamaludin et al. 2015; Davis et al. 2016). Therefore, in addition to maintaining more than sufficient capital to account for risks, banks in PICs have higher interest rate spreads (Jamaludin et al. 2015), which in the case of Fiji was found (net interest margin) to have a positive and statistically significant association with NPLs (Stauvermann et al. 2018). Consequently, given the literature on more advanced economies and accounting for the PIC’s characteristics, we expect that higher provisioning for doubtful debts implies less available funds for banks to lend. Hence, we frame the following hypothesis:
H3: Elevated credit risk leads to a reduction in bank loan supply.

Determinants of bank lending in PICs
Joint Policy Research Working Paper #19 9
4. Data, variable definition and descriptive statistics
4.1 Data and sample
The data for this research consists of 21 financial institutions from three PICs (Fiji, Vanuatu and Solomon Island) during the period 2000-2018. Of these 21 financial institutions, 15 are banks and the remaining are credit institutions. We restrict our sample to only three countries due to data availability. The final sample comprises 229 firm-year observations. Data are collected from the annual reports and disclosed financial statements of the respective financial institutions.
4.2 Variable definition and measurement
As a dependent variable, loan growth is measured by the change in banks’ gross loans. To test our first hypothesis, we take Tier 1 capital ratio as a proxy of capital quality. Regarding the banks’ funding structure, two different modes of bank funding sources are considered, namely the total customer deposits as well as the interbank deposits. We scale both variables by total assets. Finally, to test our third hypothesis, we use provision for doubtful debts to total loans as a proxy of bank risk-taking levels. In line with the existing literature, we also account for a set of control variables that affect credit growth. We control for bank size (Size) through an approximation with the natural logarithm of bank’s total assets. The relationship between bank size and credit growth is mixed in the literature. We also control the fixed assets to total assets (FATA) ratio as a proxy of bank financing activities. A higher FATA ratio indicates higher banks non-earning assets relative to total asset and thus, entails limited earning ability. Therefore, we expect a negative relationship with credit growth. Prior literature also considers the ROA as a determinant of credit growth. ROA measures the earning ability of the banks and it is expected to have a positive relationship with credit growth. Of the macro-economic variables that affect the credit growth, following prior literature, we consider GDP growth and inflation rates. A higher GDP growth rate and low inflation rate are expected to have a positive impact on banks’ loan growth. Variable descriptions are provided in Table 1.

Determinants of bank lending in PICs
10 Joint Policy Research Working Paper #19
Table 1: Definition of Variables
Classification Variable Description Dependent Variable Growth of Loans
Independent variables Tier 1 Capital ratio Tier 1 Capital Ratio
TCD Total Customer deposits: The ratio of total customer deposits over total assets
IBD Interbank deposits: The ratio of interbank deposits over total assets
LLP The ratio of provision for doubtful debts to gross loans
Size The logarithm of total assets
FATA Tangibility of Bank assets: the ratio of fixed assets to total assets
ROA Profitability: Net income/ Total Assets
GDP Growth Annual growth rate of GDP
Inflation Inflation rate
Note: Table 1 defines the variables included in Equation 1.
4.3. Model specification and estimation technique
To examine the impact of capital, deposits and bank risk-taking on bank loan growth rates, we employ a dynamic panel model that considers bank-specific characteristics and country factors that are commonly used as determinants of bank loan growth. To this end, the model is specified as follows:
𝐿𝐿𝐿𝐿𝑖𝑖𝑖𝑖𝑖𝑖 = 𝛼𝛼0 + 𝛽𝛽1𝐿𝐿𝐿𝐿𝑖𝑖𝑖𝑖𝑖𝑖−1 + ∑ 𝛾𝛾𝑞𝑞𝐵𝐵𝐵𝐵𝑖𝑖𝑖𝑖𝑖𝑖𝑞𝑞 + ∑ 𝛾𝛾𝑗𝑗
𝐽𝐽𝑗𝑗=1
𝑄𝑄𝑞𝑞=1 𝐶𝐶𝐵𝐵𝑖𝑖𝑖𝑖
𝑗𝑗 + 𝜑𝜑𝑖𝑖 + 𝜇𝜇𝑖𝑖𝑖𝑖𝑖𝑖 (1)
where i, r and t denote, bank, country and year, respectively. The notation 𝜑𝜑𝑖𝑖 is the unobserved bank-specific effect and 𝜇𝜇𝑖𝑖𝑖𝑖𝑖𝑖 is the idiosyncratic effect. The dependent variable is the bank loan growth rate ( 𝐿𝐿𝐿𝐿𝑖𝑖𝑖𝑖𝑖𝑖), proxied by the annual growth rate of gross loans. 𝐵𝐵𝐵𝐵𝑖𝑖𝑖𝑖𝑖𝑖
𝑞𝑞 is a vector of bank-specific variables, namely, Tier-1 Capital Ratio, TCD, IBD, LLP, Size, FATA and ROA. 𝐶𝐶𝐵𝐵𝑖𝑖𝑖𝑖
𝑗𝑗 is a vector of two country-specific variables – GDP growth and inflation rate. We employ OLS, fixed effect model, and GMM estimation technique.
4.4. Descriptive statistics
Table 2 provides the descriptive statistics of the variables. Results show that the mean of the loan growth is 81 per cent with a standard deviation of 8.18 per cent. The minimum and maximum amounts of lending show that banks and credit institutions vary enormously with respect to their lending capacity. While some banks have enjoyed an increased level of loan growth, others have experienced a negative growth (minimum loan growth is -41.9 per cent). Regarding the capital strength, Table 2 shows that the average of Tier-1 capital is 21.76 per cent, and the corresponding standard deviation is 14.96 per cent. This shows on average, banks in the PICs hold sufficient levels of core capital. However, some banks’ capital buffer is very slim (minimum Tier-1 capital is -12.56 per cent). On the contrary, some banks have strong capital buffers shown by the Tier-1 capital (maximum ratio is 79.12 per cent). Total customer deposits (TCD) ratio averages 68 per cent whereas the mean of interbank deposit (IBD) is 2.4 per cent of the total deposit. PIC banks seem to bear low risk reflected in their low level of nonperforming loans (average -0.7 per cent, maximum 20.6 per cent).

Determinants of bank lending in PICs
Joint Policy Research Working Paper #19 11
The average value of total assets is $257 million, but the size of banks in our sample varies substantially. For example, total assets of the smallest bank in the sample were $1.3 million whereas the largest bank in the sample had total assets of $1487 million. Fixed assets constitute only a small percentage of total assets (average 2.7 per cent) which implies that earning assets constitute a major portion of the banks in the PICs. This helps banks earn a good percentage of ROA (average 1.87 per cent). However, the variation of banks with respect to ROA earnings is substantial. Some banks suffer from negative ROA whereas others earn as high as 10 percent. Turning to macroeconomic variables, GDP growth rates average 2.92 per cent and ranges between -1.70 per cent and 13.2 per cent. The average rate of inflation is about 3.0 per cent and the respective standard deviation is 2.0 per cent, indicating that PICs experience a reasonably stable level of inflation.
Table 2: Summary statistics
N Mean Std. Dev. Median min max Growth of Loans
229 0.819 8.181 0.087 -0.419 124.522
Tier One Capital Ratio (%)
229 21.767 14.964 16.990 -12.56 79.12
TCD 229 0.681 0.230 0.743 0.00 1.095 Inter-Bank Deposit Ratio
229 0.024 0.059 0.002 0.00 0.321
Loan Loss Provision
229 -0.007 0.068 -0.009 -0.255 0.206
Size (US$’000) 229 256773.51 317511.2 11.858 1342.6 1486417.2 Fixed Asset Ratio
229 0.027 0.021 0.019 0.00 0.095
ROA (%) 229 1.876 2.267 1.600 -5.000 9.55 GDP growth (%) 229 2.924 2.453 2.705 -1.700 13.196 Inflation (%) 229 2.984 1.884 2.914 -0.574 7.732
Note: Table 2 presents the summary statistics of dependent and independent variables.
4.5 Correlation matrix
The pair-wise correlation matrix is presented in Table 3. Results show significant relationships among most of the independent variables. The correlation coefficient is the highest between banks’ size and Tier 1 capital ratio, which is -0.52; hence, multicollinearity is not a problem in estimation. Growth of loans is negatively related to interbank deposits, and loan loss provisions. On the other hand, a positive relationship is noted between lending growth and Tier-1 capital, total customer deposits, bank size, and FATA. Moreover, GDP growth and inflation rates are positively related to banks’ loan growth.

Determinants of bank lending in PICs
12 Joint Policy Research Working Paper #19
Table 3: Correlation matrix
Variables (1) (2) (3) (4) (5) (6) (7) (8) (9) (10)
(1) Growth of Loans
1.000
(2) Tier One Capital
0.177* 1.000
(3) TCD 0.025* -0.315* 1.000
(4) IBD -0.030* 0.219 -0.058* 1.000
(5) Loan loss provision
-0.006 0.054* 0.096 0.345* 1.000
(6) Size 0.083* -0.526* 0.397* -0.187* 0.127* 1.000
(7) FATA 0.087 0.229 0.133* 0.256 0.289* -0.214* 1.000
(8) ROA 0.229* 0.077* -0.020* -0.263* -0.455 -0.081* -0.109* 1.000
(9) GDP Growth
0.079* 0.165* 0.236* 0.203* 0.157* 0.010* 0.173 -0.097* 1.000
(10) Inflation
0.016* 0.055* -0.054 0.042* -0.175* 0.042* -0.124* 0.107* 0.061* 1.000
Note: Table 3 presents ccorrelations between dependent variable, test variable and firm-level control variables. *Indicates two-tail significance at the 0.05 level or less. Definitions of variables are reported in Table 1.

Determinants of bank lending in PICs
Joint Policy Research Working Paper #19 13
5. Results
5.1 Baseline regression results
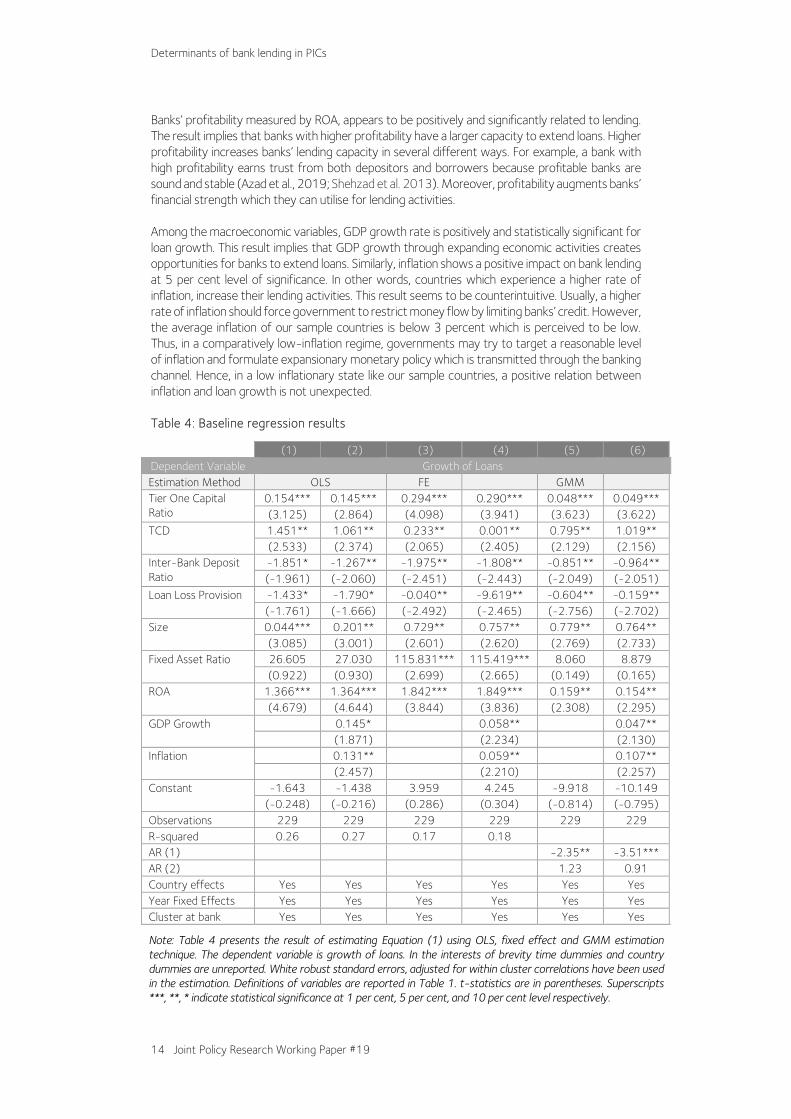
The regression results of the effect of bank and country specific variables on bank lending are presented in Table 4. Columns 1 and 2 of Table 4 portray the results of the OLS method; whereas Columns 3 and 4 present the results of the fixed effect model. We also analyse the data using system GMM estimation and the results are exhibited in Columns 5 and 6. Among all the bank-specific variables, Tier-1 capital is positively related to bank lending at 1 per cent level of significance. The result is consistent across the three estimation techniques that we used in our regression analysis. Our results conform to the findings of Kosak et al. (2015), Louhichi and Boujelbene (2017) and Jiminez et al. (2012). This result implies that banks which have a higher level of core capital enjoy increased lending opportunities. A higher level of capital buffer (Tier-1 capital, for example) improves banks’ soundness and strength, enabling them to effectively withstand the effects of financial crises, political instability, and severe economic conditions (Louhichi and Boujelbene, 2017). Moreover, regulatory compliance in the form of higher capital requirement creates a sense of trust among stakeholders about a country’s banking system, which helps create incentives for banks to expand their lending activities. Deposits are the primary sources of funding for banks. An increased level of customer deposits is expected to increase the loan books of banks. As expected, customer deposits are found to be positively related to bank lending at least at 5 per cent level of significance for all the models. Our findings are supported by Butt et al. (2014), Imran and Nishat (2013), and Churchill and Lewis (1986). This result can be explained by the fact that core retail deposits are considered to be a stable source of finance compared to other sources of funding for banks (Vazquez and Federico, 2012). Deposits thus, help banks expand their lending activities. Interbank deposits show a significant negative relationship with bank lending, shown by all the models. The relation is logical. For example, interbank transactions are relatively costly compared to other sources of finance for banks. Thus, banks often use interbank facilities in case of a shortage in regular funding. A higher level of interbank transactions implies reduced capacity for bank lending. Kosak et al. (2015) and Louhichi and Boujelbene (2017) show a negative relationship between interbank deposits and banks’ lending during the financial crisis period. Consistent with our hypothesis, our results show that banks’ loan loss provision ratio is negatively and significantly related to bank lending growth across all models. A higher NPL ratio means that bank’s loans turn bad at a higher rate. As a result, banks are required to maintain a larger number of provisions against those bad loans. Such a provisioning requirement locks in banks’ scarce funds, which results in cutback of lending activities. Moreover, an increase in the bad loan proportion compels banks to initiate tighter scrutiny of new loan applications, leading to lower lending activities of banks (Vo, 2018). Among the control variables, size, measured by total assets, showed a positive relationship with bank lending in all our models. Size offers economies of scale for banks (Beccalli et al. 2015). Larger banks have a greater number of branches and other infrastructure facilities (positive relation between banks’ size and fixed to total asset ratio). Moreover, larger banks experience less fluctuation in income and therefore, in the long run, they are more stable (Köhler, 2015). Our results confirm the findings of Miah and Uddin (2017) and Miah and Sharmeen (2015), that larger banks enjoy economies of scale. The fixed assets ratio, however, shows a significant positive relationship with banks’ loan growth, only when the fixed effect model estimation technique is used.
Determinants of bank lending in PICs
14 Joint Policy Research Working Paper #19
Banks’ profitability measured by ROA, appears to be positively and significantly related to lending. The result implies that banks with higher profitability have a larger capacity to extend loans. Higher profitability increases banks’ lending capacity in several different ways. For example, a bank with high profitability earns trust from both depositors and borrowers because profitable banks are sound and stable (Azad et al., 2019; Shehzad et al. 2013). Moreover, profitability augments banks’ financial strength which they can utilise for lending activities. Among the macroeconomic variables, GDP growth rate is positively and statistically significant for loan growth. This result implies that GDP growth through expanding economic activities creates opportunities for banks to extend loans. Similarly, inflation shows a positive impact on bank lending at 5 per cent level of significance. In other words, countries which experience a higher rate of inflation, increase their lending activities. This result seems to be counterintuitive. Usually, a higher rate of inflation should force government to restrict money flow by limiting banks’ credit. However, the average inflation of our sample countries is below 3 percent which is perceived to be low. Thus, in a comparatively low-inflation regime, governments may try to target a reasonable level of inflation and formulate expansionary monetary policy which is transmitted through the banking channel. Hence, in a low inflationary state like our sample countries, a positive relation between inflation and loan growth is not unexpected. Table 4: Baseline regression results
(1) (2) (3) (4) (5) (6) Dependent Variable Growth of Loans Estimation Method OLS FE GMM Tier One Capital Ratio
0.154*** 0.145*** 0.294*** 0.290*** 0.048*** 0.049*** (3.125) (2.864) (4.098) (3.941) (3.623) (3.622)
TCD
1.451** 1.061** 0.233** 0.001** 0.795** 1.019** (2.533) (2.374) (2.065) (2.405) (2.129) (2.156)
Inter-Bank Deposit Ratio
-1.851* -1.267** -1.975** -1.808** -0.851** -0.964** (-1.961) (-2.060) (-2.451) (-2.443) (-2.049) (-2.051)
Loan Loss Provision
-1.433* -1.790* -0.040** -9.619** -0.604** -0.159** (-1.761) (-1.666) (-2.492) (-2.465) (-2.756) (-2.702)
Size
0.044*** 0.201** 0.729** 0.757** 0.779** 0.764** (3.085) (3.001) (2.601) (2.620) (2.769) (2.733)
Fixed Asset Ratio
26.605 27.030 115.831*** 115.419*** 8.060 8.879 (0.922) (0.930) (2.699) (2.665) (0.149) (0.165)
ROA
1.366*** 1.364*** 1.842*** 1.849*** 0.159** 0.154** (4.679) (4.644) (3.844) (3.836) (2.308) (2.295)
GDP Growth
0.145* 0.058** 0.047** (1.871) (2.234) (2.130)
Inflation
0.131** 0.059** 0.107** (2.457) (2.210) (2.257)
Constant
-1.643 -1.438 3.959 4.245 -9.918 -10.149 (-0.248) (-0.216) (0.286) (0.304) (-0.814) (-0.795)
Observations 229 229 229 229 229 229 R-squared 0.26 0.27 0.17 0.18 AR (1) -2.35** -3.51*** AR (2) 1.23 0.91 Country effects Yes Yes Yes Yes Yes Yes Year Fixed Effects Yes Yes Yes Yes Yes Yes Cluster at bank Yes Yes Yes Yes Yes Yes
Note: Table 4 presents the result of estimating Equation (1) using OLS, fixed effect and GMM estimation technique. The dependent variable is growth of loans. In the interests of brevity time dummies and country dummies are unreported. White robust standard errors, adjusted for within cluster correlations have been used in the estimation. Definitions of variables are reported in Table 1. t-statistics are in parentheses. Superscripts ***, **, * indicate statistical significance at 1 per cent, 5 per cent, and 10 per cent level respectively.

Determinants of bank lending in PICs
Joint Policy Research Working Paper #19 15
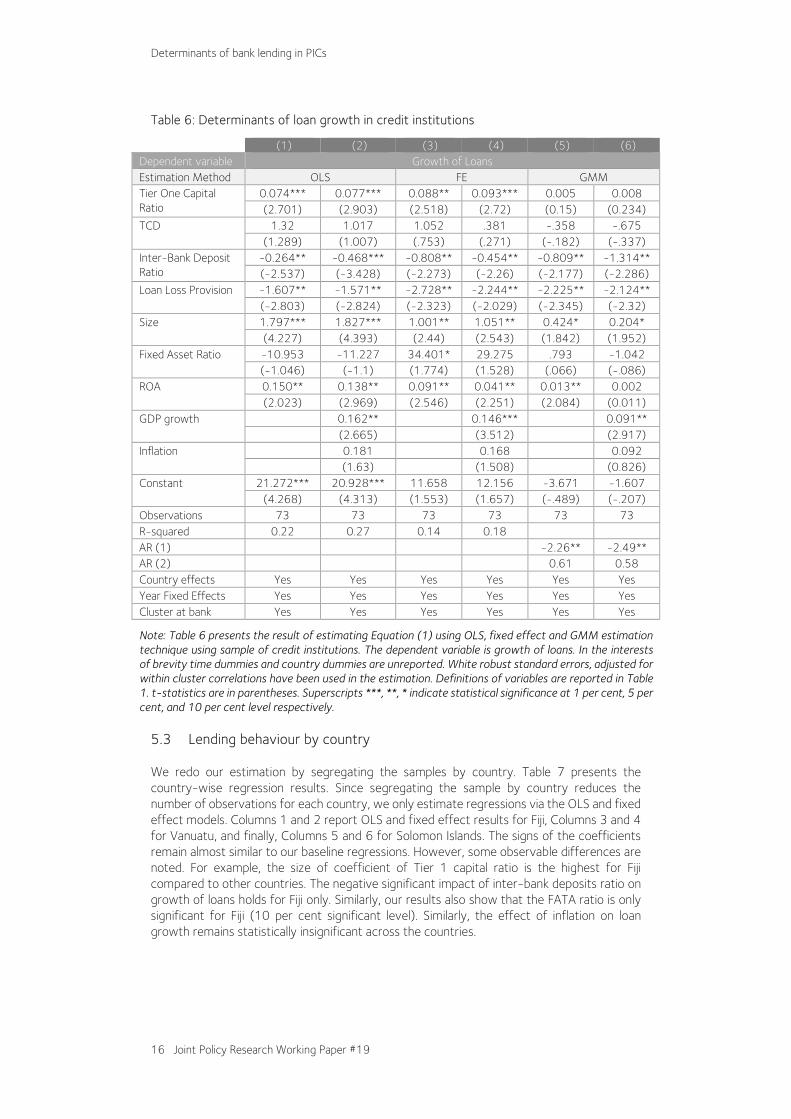
5.2 Lending behaviour by banks and credit institutions
Our sample comprises banks and credit institutions. To have a better understanding of the relationship between capital quality, deposit and credit, we segregate the data to assess the impact of bank-specific and macroeconomic variables on lending for both types of institutions. In Table 5, we present the regression results of banking institutions only. Columns 1, 3, and 5 exhibit the result of the OLS, fixed effect, and system GMM estimations, respectively considering only bank-specific variables. In Columns 2, 4, and 6 we include macroeconomic variables. Results are consistent with our baseline regressions. Among bank-specific variables, Tier-1 capital, total customer deposits, size, ROA are positively related to loan growth and the coefficients are statistically significant. On the other hand, interbank deposits and NPLs are negatively related to bank lending. Consistent to our baseline regression results, GDP growth rates shows statistically positive relations with the lending activities of banks. Another notable difference in the results reported in Table 5 compared to baseline regressions (Table 4) is that the coefficients of most of the variables have increased. It means that the selected bank-specific and macroeconomic variables have a stronger influence on loan growth for banks than the credit institutions. This is observed as well in the regression results for credit institutions reported in Table 6. Results reported in Table 6 show are similar except for a few differences. Coefficients are lower than the baseline regressions. Moreover, total customer deposits and inflation do not show any statistically significant relationship to loan growth in any regression model. Table 5: Determinants of loan growth in banking sector
(1) (2) (3) (4) (5) (6) Dependent Variable Growth of Loans Estimation Method OLS FE GMM Tier One Capital Ratio 0.199** 0.200** 0.403*** 0.411*** 0.062** 0.073**
(2.291) (2.246) (3.637) (3.562) (2.520) (2.565) TCD 1.625** 1.393** 6.971** 6.839** 0.163** 1.056**
(2.322) (2.258) (2.980) (2.921) (2.020) (2.115) Inter-Bank Deposit Ratio
-6.017** -6.067** -1.777** -1.817** -1.967** -2.934 (-2.135) (-2.109) (-2.435) (-2.432) (-2.410) (-0.428)
Loan Loss Provision
-2.906** -2.809*** -4.693*** -4.687** -4.289* -4.795* (-2.466) (-2.434) (-3.161) (-3.160) (-1.919) (-1.938)
Size
1.804* 1.802* 0.378* 0.423* 0.295* 0.279* (1.823) (1.763) (1.727) (1.850) (1.884) (1.859)
Fixed Asset Ratio
46.010 46.595 198.029*** 197.740*** 27.422 25.158 (0.998) (1.000) (3.060) (3.032) (0.326) (0.297)
ROA
2.937*** 2.947*** 2.875*** 2.872*** 0.115 0.125 (4.295) (4.219) (2.903) (2.878) (0.087) (0.095)
GDP growth
0.047* 0.024* 0.111* (1.826) (1.765) (1.820)
Inflation
0.043 -0.125 0.011 (0.104) (-0.305) (0.021)
Constant
-20.112 -20.293 -6.729 -7.087 -5.137 -5.523 (-1.597) (-1.569) (-0.329) (-0.339) (-0.270) (-0.275)
Observations 156 156 156 156 156 156 R-squared 0.24 0.31 0.16 0.17 AR (1) -2.34** -3.41*** AR (2) 1.56 1.26 Country effects Yes Yes Yes Yes Yes Yes Year Fixed Effects Yes Yes Yes Yes Yes Yes Cluster at bank Yes Yes Yes Yes Yes Yes
Note: Table 5 presents the result of estimating Equation (1) using OLS, fixed effect and GMM estimation technique using sample of banks. The dependent variable is growth of loans. In the interests of brevity time dummies and country dummies are unreported. White robust standard errors, adjusted for within cluster correlations have been used in the estimation. Definitions of variables are reported in Table 1. t-statistics are in parentheses. Superscripts ***, **, * indicate statistical significance at 1 per cent, 5 per cent, and 10 per cent level respectively.
Determinants of bank lending in PICs
16 Joint Policy Research Working Paper #19
Table 6: Determinants of loan growth in credit institutions
(1) (2) (3) (4) (5) (6) Dependent variable Growth of Loans Estimation Method OLS FE GMM Tier One Capital Ratio
0.074*** 0.077*** 0.088** 0.093*** 0.005 0.008 (2.701) (2.903) (2.518) (2.72) (0.15) (0.234)
TCD
1.32 1.017 1.052 .381 -.358 -.675 (1.289) (1.007) (.753) (.271) (-.182) (-.337)
Inter-Bank Deposit Ratio
-0.264** -0.468*** -0.808** -0.454** -0.809** -1.314** (-2.537) (-3.428) (-2.273) (-2.26) (-2.177) (-2.286)
Loan Loss Provision
-1.607** -1.571** -2.728** -2.244** -2.225** -2.124** (-2.803) (-2.824) (-2.323) (-2.029) (-2.345) (-2.32)
Size
1.797*** 1.827*** 1.001** 1.051** 0.424* 0.204* (4.227) (4.393) (2.44) (2.543) (1.842) (1.952)
Fixed Asset Ratio
-10.953 -11.227 34.401* 29.275 .793 -1.042 (-1.046) (-1.1) (1.774) (1.528) (.066) (-.086)
ROA
0.150** 0.138** 0.091** 0.041** 0.013** 0.002 (2.023) (2.969) (2.546) (2.251) (2.084) (0.011)
GDP growth
0.162** 0.146*** 0.091** (2.665) (3.512) (2.917)
Inflation
0.181 0.168 0.092 (1.63) (1.508) (0.826)
Constant
21.272*** 20.928*** 11.658 12.156 -3.671 -1.607 (4.268) (4.313) (1.553) (1.657) (-.489) (-.207)
Observations 73 73 73 73 73 73 R-squared 0.22 0.27 0.14 0.18 AR (1) -2.26** -2.49** AR (2) 0.61 0.58 Country effects Yes Yes Yes Yes Yes Yes Year Fixed Effects Yes Yes Yes Yes Yes Yes Cluster at bank Yes Yes Yes Yes Yes Yes
Note: Table 6 presents the result of estimating Equation (1) using OLS, fixed effect and GMM estimation technique using sample of credit institutions. The dependent variable is growth of loans. In the interests of brevity time dummies and country dummies are unreported. White robust standard errors, adjusted for within cluster correlations have been used in the estimation. Definitions of variables are reported in Table 1. t-statistics are in parentheses. Superscripts ***, **, * indicate statistical significance at 1 per cent, 5 per cent, and 10 per cent level respectively.
5.3 Lending behaviour by country
We redo our estimation by segregating the samples by country. Table 7 presents the country-wise regression results. Since segregating the sample by country reduces the number of observations for each country, we only estimate regressions via the OLS and fixed effect models. Columns 1 and 2 report OLS and fixed effect results for Fiji, Columns 3 and 4 for Vanuatu, and finally, Columns 5 and 6 for Solomon Islands. The signs of the coefficients remain almost similar to our baseline regressions. However, some observable differences are noted. For example, the size of coefficient of Tier 1 capital ratio is the highest for Fiji compared to other countries. The negative significant impact of inter-bank deposits ratio on growth of loans holds for Fiji only. Similarly, our results also show that the FATA ratio is only significant for Fiji (10 per cent significant level). Similarly, the effect of inflation on loan growth remains statistically insignificant across the countries.

Determinants of bank lending in PICs
Joint Policy Research Working Paper #19 17
Table 7: Determinants of loan growth by country
(1) (2) (3) (4) (5) (6) Dependent Variable Growth of Loans Fiji Vanuatu Solomon Islands Estimation Method OLS FE OLS FE OLS FE Tier One Capital Ratio
0.617*** 0.656*** 0.390** 0.065** 0.106*** 0.097*** (5.408) (5.12) (2.499) (2.579) (4.047) (4.705)
TCD
1.346** 1.11** 4.122*** 1.403*** 1.801** 0.159** (2.403) (2.023) (3.435) (3.573) (2.721) (2.066)
Inter-Bank Deposit Ratio
-0.694* -0.204** -2.336 -5.842 -1.123 -1.918 (1.88) (-2.051) (-1.45) (.521) (.879) (.536)
Loan Loss Provision -0.365* -0.171** -0.601* -1.666*** -1.956*** -1.953*** (1.965) (-2.475) (-1.912) (-2.949) (-2.812) (-3.602)
Size
0.416** 0.422** 2.156** 1.769*** 2.139** 2.863*** (2.437) (2.26) (2.167) (4.246) (2.079) (6.986)
Fixed Asset Ratio
3.311* 1.509* 5.64 0.857 12.761 0.031 (1.67) (1.799) (.062) (0.056) (0.934) (0.002)
ROA
2.118*** 2.46*** 2.554*** 0.165 0.576** -0.235 (5.823) (3.997) (4.154) (0.778) (2.545) (-1.361)
GDP growth
0.011** 0.036* 0.060* 0.603*** 0.534*** 0.626*** (2.03) (1.696) (1.815) (2.802) (2.895) (3.878)
Inflation
0.095 0.129 0.036 0.105 0.024 0.235 (.233) (.315) (.074) (.398) (0.107) (1.017)
Constant
-1.074 -1.602 34.247 23.21*** 27.4** 36.482*** (-.091) (-.085) (1.392) (4.543) (2.205) (7.517)
Observations 151 151 44 44 34 34 R-squared 0.28 0.18 0.23 0.18 0.24 0.19 Country effects Yes Yes Yes Yes Yes Yes Year Fixed Effects Yes Yes Yes Yes Yes Yes Cluster at bank Yes Yes Yes Yes Yes Yes
Note: Table 7 presents the result of estimating Equation (1) using OLS and fixed effect technique by country. The dependent variable is growth of loans. In the interests of brevity time dummies and country dummies are unreported. White robust standard errors, adjusted for within cluster correlations have been used in the estimation. Definitions of variables are reported in Table 1. t-statistics are in parentheses. Superscripts ***, **, * indicate statistical significance at 1 per cent, 5 per cent, and 10 per cent level respectively.
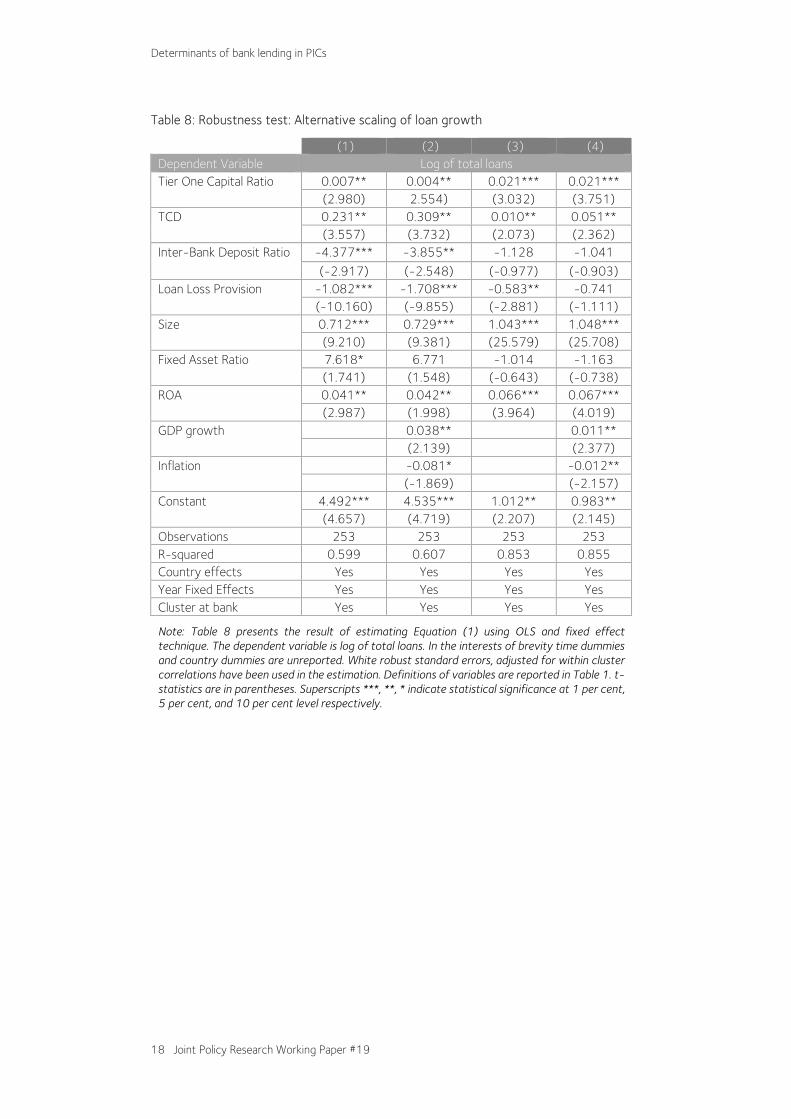
5.4 Robustness test
We check the robustness of the regression results by considering an alternative measure of lending activities—log of total loans. The results are presented in Table 8. R-squared shows a very high value which means that the adopted model fits well to the data. Most of the coefficients are statistically significant and possess the same signs as our baseline regressions. Moreover, like our baseline regression results, GDP growth rate shows a positive impact on total loans. This offers a logical explanation that corporates and individuals demand more bank loans during an economic upturn because expanding activity creates more investment opportunities. The banking system functions as an important funding source to meet this investment demand. Inflation has a negative and statistically significant effect on total loans for the sample countries.
Determinants of bank lending in PICs
18 Joint Policy Research Working Paper #19
Table 8: Robustness test: Alternative scaling of loan growth
(1) (2) (3) (4) Dependent Variable Log of total loans Tier One Capital Ratio
0.007** 0.004** 0.021*** 0.021*** (2.980) 2.554) (3.032) (3.751)
TCD
0.231** 0.309** 0.010** 0.051** (3.557) (3.732) (2.073) (2.362)
Inter-Bank Deposit Ratio -4.377*** -3.855** -1.128 -1.041 (-2.917) (-2.548) (-0.977) (-0.903)
Loan Loss Provision
-1.082*** -1.708*** -0.583** -0.741 (-10.160) (-9.855) (-2.881) (-1.111)
Size
0.712*** 0.729*** 1.043*** 1.048*** (9.210) (9.381) (25.579) (25.708)
Fixed Asset Ratio
7.618* 6.771 -1.014 -1.163 (1.741) (1.548) (-0.643) (-0.738)
ROA
0.041** 0.042** 0.066*** 0.067*** (2.987) (1.998) (3.964) (4.019)
GDP growth
0.038** 0.011** (2.139) (2.377)
Inflation
-0.081* -0.012** (-1.869) (-2.157)
Constant
4.492*** 4.535*** 1.012** 0.983** (4.657) (4.719) (2.207) (2.145)
Observations 253 253 253 253 R-squared 0.599 0.607 0.853 0.855 Country effects Yes Yes Yes Yes Year Fixed Effects Yes Yes Yes Yes Cluster at bank Yes Yes Yes Yes
Note: Table 8 presents the result of estimating Equation (1) using OLS and fixed effect technique. The dependent variable is log of total loans. In the interests of brevity time dummies and country dummies are unreported. White robust standard errors, adjusted for within cluster correlations have been used in the estimation. Definitions of variables are reported in Table 1. t-statistics are in parentheses. Superscripts ***, **, * indicate statistical significance at 1 per cent, 5 per cent, and 10 per cent level respectively.

Determinants of bank lending in PICs
Joint Policy Research Working Paper #19 19
6. Conclusion
In this paper, we examined the determinants of lending by individual depository corporations (banks and credit institutions) in three PICs—Fiji, Solomon Islands and Vanuatu. We analysed the impact of bank specific indicators—the quality of bank capital (Tier-1 capital ratio), customer deposits, interbank deposits, credit risk (provisioning of doubtful debts), size, ROA, fixed asset ratio and macroeconomic indicators – inflation and GDP - on lending. Our dataset runs from 2000 to 2018 for a sample of 229 observations. The findings of this study’s baseline regressions were in line with expectations. The study found that Tier-1 capital, customer deposits, banks’ profitability, size, GDP growth and inflation were positively related to bank lending. On the other hand, interbank deposits and credit risk showed a significant negative relation with the bank lending. Similarly, when regressed by types of depository institution, Tier-1 capital, size, ROA are found to be positively related to loan growth with statistically significant coefficients, while the total customer deposits were only significant and positive for banks. On the other hand, interbank deposits and credit risk are negatively related to bank lending. Like our baseline regression results, when we divide the sample according to the type of institutions, GDP growth rate showed a statistically positive relationship with the lending activities of banks. Our regression analysis by country shows that the impact of Tier 1 capital ratio is highest for Fiji among the sample countries. We also note that inter-bank deposits ratio and fixed assets ratio only appear to be significant for Fiji. The findings of this study offer important policy prescriptions. For example, the coefficients of variables are higher for banking institutions which validates PICs policies to strengthen the banking system of the region. This finding further implies, in the context of PICs, that banking sector development should remain a key policy. Second, PICs should continue to work on widening the deposit base by reducing the percentage of unbanked population of their respective countries, thereby increasing the ability to provide credit. Hence, the regulatory authority should remain keen on maintaining the current level of core capital of credit institutions. Fourth, credit risk restricts banks’ capacity to expand loans. This requires regulatory authorities to devise policies that reduce non-performing loan ratios. In particular, credit infrastructure such as the introduction of technologies (artificial intelligence, machine learning, cloud computing etc.) for screening and monitoring may help improve banks credit risk assessment. Future research can focus on factors yet to be covered in the literature on PICs such as natural disasters and foreign ownership. The frequency and intensity of natural disasters faced by PICs have increased while most banks in PICs are foreign owned. It would be interesting to examine whether these factors have an impact on lending. Another area of future research could revolve around the impact of the pandemic on credit expansion. However, the conduct of this additional research will depend on data availability, which for PICs, is quite limited.
Determinants of bank lending in PICs
20 Joint Policy Research Working Paper #19
Notes and references
Akhtar, Y, Kayani, GM and Yousaf, T, 2019, ‘The effects of regulatory capital requirements
and ownership structure on bank lending in emerging Asian markets’, Journal of Risk and Financial Management, vol. 12, no. 3, p. 142.
Alessi, L and Detken, C, 2018, ‘Identifying excessive credit growth and leverage’, Journal of Financial Stability, vol 35, pp. 215-25.
Anginer, D and Demirguc-Kunt, A, 2014, ‘Bank capital and systemic stability’, World Bank, Policy Research Working Paper, WPS6948, 1-42.
Anwar, S and Nguyen, LP, 2018, ‘Channels of monetary policy transmission in Vietnam’, Journal of Policy Modelling, vol. 40, no. 4, pp. 709-29.
Azad, AS, Azmat, S and Hayat, A, 2019, ‘What determines the profitability of Islamic banks: Lending or fee?’, International Review of Economics & Finance.
Bagehot, W, 1873, Lombard Street (1962 ed.) Homewood, IL: Richard D Irwin. Beccalli, E, Anolli, M and Borello, G, 2015, ‘Are European banks too big? Evidence on
economies of scale’, Journal of Banking & Finance, vol. 58, pp. 232-46. Beck, T, Demirguc-Kunt, A and Levine, R, 2001, Law, politics, and finance: The World Bank. Beck, T, 2011, The Role of Finance in Economic Development: Benefits, Risks, and Politics,
Tilburg University, Center for Economic Research. Berlin, M and Mester, L, 1999, ‘Deposits and relationships lending’, Review of Financial
Studies, vol. 12, no. 3, pp. 579-607. Bernanke, B and Lown, C, 1991, ‘Credit crunch’, Brookings Papers on Economic Activity, vol.
2, pp. 205-47. Bloch, H and Tang, SHK, 2003, ‘The role of financial development in economic growth’,
Progress in Development Studies, vol. 3, no. 3, pp. 243–51. Botric, V and Slijepcevic, S, 2008, ‘Economic growth in South-Eastern Europe: The role of the
banking sector’, Post-Communist Economies, vol. 20, no. 2, pp. 253–62. Butt, N, Churm, R, McMahon, MF, Morotz, A and Schanz, JF, 2014, QE and the bank lending
channel in the United Kingdom. Caprio, G and Klingebiel, D, 2002, ‘Episodes of systemic and borderline banking crises’ In
Klingebiel, D and Laeven, L (eds.) Managing the real and fiscal effects of banking crises, World Bank Discussion Paper, vol 428, pp. 31-49.
Churchill, NC and Lewis, VL, 1986, ‘Bank lending to new and growing enterprises’, Journal of Business Venturing, vol. 1, no. 2, pp. 193-206.
Claessens, S, Kose, MA and Terrones, ME, 2014, ‘The global financial crisis: How similar? How different? How costly?’ Financial Crises: Causes, Consequences, and Policy Responses. Washington, DC: International Monetary Fund, pp. 209-37.
Claessens, S and Laeven, L, 2005, ‘Financial dependence, banking sector competition, and economic growth’, Journal of the European Economic Association, vol. 3, no. 1, pp. 179–207.
Coval, J and Thakor, A, 2005, ‘Financial intermediation as a beliefs-bridge between optimists and pessimists’, Journal of Financial Economics, vol. 75, no. 3, pp. 535-69.
Davis, M, Vaught, J and Cabezon, E, 2016, ‘Interest rates, bank profitability and capital adequacy in the South Pacific: Resilience and growth in the small states of the Pacific’, International Monetary Fund (IMF), pp. 331-52.
Dell' Ariccia, G and Marquez, R, 2006, ‘Lending booms and lending standards’, Journal of Finance, vol. 61, no. 5, pp. 2511-46.
Diamond, D and Rajan, R, 2000, ‘A theory of bank capital’, Journal of Finance, vol. 61, no. 5, pp. 2511-46.
European Central Bank, 2011, Financial Stability Review. Fouque, JP and Ichiba, T, 2013, ‘Stability in a model of interbank lending’ SIAM Journal on
Financial Mathematics, vol. 4, no. 1, pp. 784-803.
Determinants of bank lending in PICs
Joint Policy Research Working Paper #19 21
Gambacorta, L and Mistrulli, P, 2004, ‘Bank capital and lending behaviour: Empirical evidence for Italy’, Journal of Financial Intermediation, vol. 13, no. 4, pp. 436-57.
Greenwood, J and Jovanovic, B, 1990, ‘Financial development, growth, and the distribution of income’, Journal of Political Economy, vol. 98, no. 1, pp. 1076–107.
Guo, K and Stepanyan, V, 2011, Determinants of Bank Credit in Emerging Market Economies, IMF Working Paper 11/51.
Imran, K and Nishat, M, 2013, ‘Determinants of bank credit in Pakistan: A supply side approach’, Economic Modelling, vol. 35, pp. 384-90.
Jamaludin, F, Klyuev, V and Serechetapongse, A, 2015, What Drives Interest Spreads in Pacific Island Countries? An Empirical Investigation, Asia and Pacific Department’, IMF Working Paper WP/15/96.
Jappelli, T and Pagano, M, 1994, ‘Saving, growth, and liquidity constraints’, The Quarterly Journal of Economics, vol. 109, no. 1, pp. 83–109.
Jayaratne, J and Strahan, PE, 1996, ‘The finance-growth nexus: Evidence from bank branch deregulation’, The Quarterly Journal of Economics, vol. 111, no. 3, pp. 639–70.
Jensen, M and Meckling, W, 1976, ‘Theory of the firm: Managerial behaviour, agency costs, and ownership structure’, Journal of Financial Economics, vol. 3, no. 4, pp. 305-60.
Jokipii, T and Milne, A, 2008, ‘The cyclical behaviour of European bank capital buffers’, Journal of Banking & Finance, vol. 32, no. 8, pp. 1440-51.
Jokipii, T and Milne, A, 2011, ‘Bank capital buffer and risk adjustment decisions’ Journal of Financial Stability, vol. 7, pp. 165-78.
Kabir, N, Miah, M and Huda, R, 2020, ‘Determinants of credit risk: A comparative study between Islamic and conventional banks in Bangladesh, Singapore Economic Review, https://doi.org/10.1142/S0217590820420011
Kasingu, S, Sabok, G, Tuam, D, Hamua, J, Su, J and Sharma, P, 2020, Determinants of Private Sector Credit in Papua New Guinea, Bank of Papua New Guinea and Griffith University Working Paper Series JPRWP#11, Port Moresby.
Kindleberger, CP and Aliber, RZ, 2011, Manias, panics and crashes: a history of financial crises. Palgrave Macmillan.
Köhler, M, 2015, ‘Which banks are more risky? The impact of business models on bank stability’, Journal of Financial Stability, vol. 16, pp. 195-212.
Kosak, M, Li, S, Loncarski, I and Marinc, M, 2015, ‘Quality of bank capital and bank lending behaviour during the global financial crisis’, International Review of Financial Analysis, vol. 37, pp. 163-83.
Kumar, R, Stauvermann, P, Patel, A and Prasad, S, 2018, ‘Determinants of non-performing loans in banking sector in small developing island states: A study of Fiji’, Accounting Research Journal, vol. 31 no. 2, pp. 192-213.
Ladime, J, Osei, KA and Sarpong-Kumankoma, E, 2013, ‘Determinants of bank lending behaviour in Ghana’, Journal of Economics and Sustainable Development, pp. 1-7.
Levine, R, 2003, ‘More on finance and growth, more finance, more growth?’, Federal Reserve Bank of St. Louis Review, vol. 85, pp. 31–46.
Louhichi, A and Boujelbene, Y, 2017, ‘Bank capital, lending and financing behaviour of dual banking systems’, Journal of Multinational Financial Management, vol. 41, pp. 61-79.
Miah, MD and Sharmeen, K, 2015, ‘Relationship between capital, risk and efficiency’, International Journal of Islamic and Middle Eastern Finance and Management, vol. 8, no.2, pp. 203-21.
Miah, MD and Uddin, H, 2017, ‘Efficiency and stability: A comparative study between Islamic and conventional banks in GCC countries’, Future Business Journal, vol. 3, no. 2, pp. 172-85.
Mishra, P, Montiel, P and Sengupta, R, 2016, ‘Monetary transmission in developing countries: Evidence from India’, in C Gate and KM Kletzer (eds.), Monetary policy in India, Springer, New Delhi, pp. 59-110.
Mistrulli, PE, 2011, ‘Assessing financial contagion in the interbank market: Maximum entropy versus observed interbank lending patterns’, Journal of Banking & Finance, vol. 35, no. 5, pp. 1114-27.
Determinants of bank lending in PICs
22 Joint Policy Research Working Paper #19
Nguyen, HD and Dang, VD, 2020, ‘Bank-specific determinants of loan growth in Vietnam: Evidence from the CAMELS approach’, Journal of Asian Finance, Economics and Business, vol. 7, no 9, pp. 179-89.
Peek, J, Rosengren, E and Tootell, G, 2003, ‘Identifying the macroeconomic effect of loan supply shocks’, Journal of Money, Credit and Banking, vol. 35, pp. 931-46.
Pham, TH, 2015, Determinants of Bank Lending, Université de Nantes working paper, pp. 1-28. Rajan, R, 1994, ‘Why bank credit policies fluctuate: A theory and some evidence’, Quarterly
Journal of Economics, vol. 109, no. 2, pp. 399-441. Reinhart, CM and Rogoff, KS, 2013, ‘Banking crises: an equal opportunity menace’ Journal of
Banking & Finance, vol. 37, no. 11, pp. 4557-73. Schumpeter, JA, 1934, The theory of economic development, Harvard University Press,
Cambridge. Sharma, P and Gounder, N, 2012, Determinants of bank credit in small open economies: The
case of six Pacific island countries’, Development Economics: Macroeconomic Issues in Developing Economies eJournal, DOI:10.2139/ssrn.2187772.
Shehzad, CT, De Haan, J and Scholtens, B, 2013, ‘The relationship between size, growth and profitability of commercial banks’, Applied Economics, vol. 45, no. 13, pp. 1751-65.
Song, F and Thakor, A, 2007, ‘Relationship banking, fragility, and asset-liability matching problem’, Review of Financial Studies, vol. 20, no. 6, pp. 2129-77.
Thakor, A, 1996, ‘Capital requirements, monetary policy, and aggregate bank lending: Theory and empirical evidence’, Journal of Finance, vol. 51, no. 1, pp. 279-324.
Vazquez, F and Federico, P, 2012, Bank Funding Structure and Risk: Evidence from the Global Financial Crisis, IMF Working Paper 29.
Vo, XV, 2018, ‘Bank lending behaviour in emerging markets’, Finance Research Letters, vol. 27, pp. 129-34.
Yang, Y, Davies, M, Wang, S, Dunn, J and Wu, Y, 2011, Monetary Policy Transmission Mechanisms in Pacific Island Countries, IMF Working Paper 11/96.
Zelenyuk, N, Faff, R and Pathan, S, 2017, Alignment of Interests, Voluntary Disclosure and Bank Lending, SSRN Working Paper.
Zou, Y and Li, F, 2014, The Impact of Credit Risk Management on Profitability of Commercial Banks: A study of Europe, PhD Thesis, UMEA.
Notes 1 Facilities classified as doubtful possess all the essential weaknesses of an account
classified as substandard and where the creditworthiness of the borrower has deteriorated to such an extent that full collection on the facility is improbable. The institution expects to sustain some loss of principal and/or interest, after taking into account the market value of collateral.
2 For example, in Fiji, apart from the general reserves for credit losses maintained, the Reserve Bank of Fiji expects banks to maintain, a total amount of provisions which is not less than the sum of the following 50 per cent of the shortfall in the net realisable security value over the outstanding balance of all facilities classified as Doubtful as an allocated individually assessed provision, net of unearned interest and interest suspended.

CRI
COS
No.
00
23
3E
GRIFFITH ASIA INSTITUTE
Griffith University Nathan campusNathan Queensland 4111, Australia
Phone: +61 7 3735 3730 Email: [email protected]
griffith.edu.au/asiainstitute