Understanding SME Finance: Determinants of Relationship Lending · 2016-10-21 · Understanding SME...
35
Understanding SME Finance: Determinants of Relationship Lending (Sean) Suk Hyun Choi 1 Dr. Grace Kim, Faculty Advisor Dr. Michelle Connolly, Seminar Instructor Duke University Durham, North Carolina 2014 1 (Sean) Suk Hyun Choi graduated in May 2014 with Distinction in Economics, a second major in Public Policy, and a minor in Chinese. Following graduation, Sean will be working at BlackRock as an analyst in risk management in the New York office. Sean can be reached at: [email protected].
Transcript of Understanding SME Finance: Determinants of Relationship Lending · 2016-10-21 · Understanding SME...
Understanding SME Finance:
Determinants of Relationship Lending
(Sean) Suk Hyun Choi1
Dr. Grace Kim, Faculty Advisor
Dr. Michelle Connolly, Seminar Instructor
Duke University
Durham, North Carolina
2014
1 (Sean) Suk Hyun Choi graduated in May 2014 with Distinction in Economics, a second major in Public Policy, and
a minor in Chinese. Following graduation, Sean will be working at BlackRock as an analyst in risk management in
the New York office. Sean can be reached at: [email protected].
Choi, 2
Abstract
Much of the existing literature in small and medium-sized enterprise (SME) finance
surveys the impact of borrower and lender characteristics on firms’ credit availability, and it has
already been established that there is a positive link between the strength of firm-bank
relationship and the level of credit availability. In this paper, I focus on what determines the
strength of relationship, measured by length and exclusivity. In particular, I was able to build an
original metric to gauge the strength of relationship using the inverse value of the number of
financial institutions that a firm deals with. Using a set of regressions, I confirm the existing
theories that size of the firm and type of ownership matters. Small firms and sole proprietorships
tend to have longer and more exclusive relationships, which implies their reliance on relationship
lending. Firm owner characteristics are shown to be somewhat important, in that they serve as
proxies for a given firm’s creditworthiness.
JEL Classifications: G21, G30, L14
Keywords: SME finance, relationship lending, asymmetrical information, credit rationing
Choi, 3
TABLE OF CONTENTS
I. INTRODUCTION 4
II. LITERATURE REVIEW 7
III. DATA AND SUMMARY STATISTICS 9
Table 1. Definition of Variables 11
Table 2. Descriptive Statistics 12
IV. THEORETICAL FRAMEWORK 13
V. EMPIRICAL FRAMEWORK 16
Table 3. Predicted Effects on Relationship Strength 17
Firm Influences on Strength of Relationship 18
Owner Influences on Strength of Relationship 20
Financial Institution Influences on Strength of Relationship 21
VI. RESULTS 21
VII. CONCLUSION 26
BIBLIOGRAPHY 28
APPENDIX 31
Choi, 4
I. INTRODUCTION
In the United States, small and medium-sized enterprises (SME), officially defined as
firms whose number of full-time equivalents is lower than 500 by the U.S. Small Business
Administration (SBA), play a seminal role in the U.S. economy. The distribution of firm sizes is
severely skewed towards small businesses, with 99.7% of U.S. firms classified as SMEs. They
are also responsible for driving innovation and competition in many economic sectors. SBA
reports that of high patenting firms, which refers to firms that produce 15 or more patents in a
four-year period, SMEs have produced 16 times more patents per employee than larger firms.
They also account for about 46% of U.S. GDP, and 48.5% of private-sector employment and 63%
of net new private-sector jobs (Small Business Administration 2014).
However, SMEs face a variety of challenges in the current economy. Small firms report
that the business conditions in the U.S. are generally unfavorable due to its tax and regulatory
policies, and the rising health insurance costs in the recent years have definitely taken its toll on
small business operations. SMEs also face the problem of attracting and retaining quality work
force. The competition for labor is a difficult one for small business, since they usually offer
lower compensations and benefits compared to their larger counterparts. A more critical
challenge for SMEs, however, is the availability of capital. They are naturally more vulnerable to
economic downturns, and many small, entrepreneurial firms end up going into bankruptcy from
undercapitalization. It is said that the run-of-the-mill start-up company has about 50% chance of
failing within four to six years of establishment. Most business ventures do not even get started,
with around 27% of entrepreneurs abandoning efforts within a year of germination. Only 10% of
the new businesses ever secure the capital and resources needed to survive and expand in the
market (Shane 2008).
One of the most important issues that SMEs face is the availability of credit, particularly
for young, entrepreneurial firms that are in constant need for new capital to finance their growth.
For one, small businesses lack access to stock markets, which can be a major source of capital
for bigger firms. But more importantly, the impact of informational asymmetry is even more
critical for smaller firms, since they tend to be more informationally opaque compared to larger
firms. Due to the lack of quantitative data that certifies their creditworthiness, SMEs may need to
Choi, 5
resort to unconventional lending technologies in order to acquire loans that they need to embark
on new investments.
The popular characterization of the lending technologies uses the following dichotomy:
transaction lending based on “hard” quantitative data such as financial statements, and
relationship lending based on “soft” qualitative data such as records of previous interactions
between a given bank and a firm. Berger and Udell (2006) cement this framework by further
dividing transaction lending into categories such as financial statement lending, small business
credit scoring, and asset-based lending. In particular, financial statement lending is based on the
borrower’s financial statements verified by a third party, such as a reputable auditing firm that
uses standard accounting standards such as Generally Accepted Accounting Principles (GAAP).
Small business credit scoring is a strategy in which the bank uses hard information on firms
collected from credit bureaus to evaluate counterparties, while asset-based lending uses
valuations of collaterals. In a conventional process of transaction lending, a firm requests loans
from banks by submitting hard data supporting the firm’s financial soundness, which is then
reviewed by the bank using a set of criteria to determine if the firm will be able to meet financial
obligations in the future. In many cases, the loan application submitted by a firm for transaction
lending needs to go through multiple layers of bureaucracy before finally getting approved by the
underwriters.
On the contrary, relationship lending involves little or no hard data and is often employed
by SMEs that have limited access to transaction lending. A striking 65% of the SMEs that
responded to the Survey of Small Business Finance 2003 have reported that they did not compile
financial statements or reports. It is important to note that the owners of SMEs are often directly
engaged with the loan application process, maintaining direct contact with the loan officers in the
local, regional banks. In relationship lending, the loan officer at a financial institution leverages
soft information on the SME collected through past interactions with the firm’s suppliers,
customers, competitors, and other businesses and business associations in the local market (Udell
2008). This is also referred to as “judgment lending,” since the loan officers mainly rely on
experience and training to make the final call on loan approvals (Berger and Black 2011).
Proprietary soft information can range from a loan officer’s impression of the borrower, opinions
Choi, 6
in the industry, to assessments of the future prospects of the SME inferred from the gathered soft
information.
For many SMEs, availability of credit is significant in the macroeconomic context as well
for a number of reasons. First, it has been found that small firms are generally more vulnerable to
recessions or other types of economic shocks, which is shown through decreasing employment
growth and lower sales (Chari et al. 2007, Fort 2013). In times of financial crisis or credit crunch,
the availability of credit for SMEs is disproportionally compromised compared to the larger
firms, mainly because of the limit on their ability to acquire the necessary loans. As we have just
escaped another crippling recession, it is important that sufficient attention be allotted to the
wellbeing of the SMEs that propel the U.S. economy. Second, the problem of SME credit
availability is also crucial to analyzing the impact of bank consolidation, which has become
prevalent in the United States since the mid-1980s. It is generally assumed that larger financial
institutions have a comparative advantage in providing transaction-based services to larger firms,
while smaller institutions can better service SMEs through relationship-based lending (Berger et
al. 2005, Berger and Black 2011, Carter and McNulty 2005, Park 2008). However, some scholars
found that consolidation can actually offer opportunities for community banks to take on
business that is abandoned by large consolidating organizations (Peterson and Rajan 1995, Avery
2004). In the recent environment of bank deregulation, it is imperative that we are cognizant of
the impact of bank consolidation on the ability of SMEs to obtain funds.
Much of the existing literature on small business finance explores the causal links
between lending technologies, government policies, financial structures, and credit availability.
Among them, the strength of relationship between borrowers and lenders demonstrates a
significant impact on access to credit, which is usually expressed in terms of loan approval rate,
and loan terms or conditions. Many works support the theory that stronger relationships between
banks and firms result in higher loan approval rates and more favorable terms and conditions.
They suggest that stronger relationship between a firm’s owner and a loan officer can help
overcome the asymmetrical information problem and expand credit availability for SMEs. Not as
much attention, however, has been allocated to understanding what influences the nature of the
relationship between firms and banks, or more specifically, between business owners and loan
officers. This may be due to the lack of data available on the more complicated aspects of firm-
Choi, 7
bank relationships, such as the range of financial services provided by a particular institution.2
The goal of this paper is to explore what influences relationship strength, measured in terms of
length of interaction and exclusivity, using new metrics that have not been utilized by the
existing works in the literature.
II. LITERATURE REVIEW
Literature on credit availability for SMEs surveys what drives a firm or bank’s decision
to use a certain type of lending technology. There is a general consensus that large financial
institutions have a comparative advantage in transaction lending due to economies of scale in
processing hard information (Stein 2002). Empirical analysis supports the claim that larger banks
would cater more to relatively transparent SMEs with stronger financial ratios, which tend to be
larger, older firms (Haynes et al. 1999). However, larger institutions are poorer at processing
relationship lending due to agency problems, since relationship lending requires transmitting soft
information acquired by the loan officers through the banks’ inefficient bureaucratic system.
Because of its unobservable, opaque nature, soft information is not easily communicated within a
large financial institution (Stein 2002). Small institutions, on the other hand, have an edge in
relationship lending because of fewer layers of management (Berger and Udell 2002, McNulty et
al. 2013). This makes small-sized lenders more able to utilize soft information to gauge the
quality of borrowers (Garcia-Appendini 2011). Since loan officers in smaller institutions
generally have more authority in approving loans, they can make decisions without having to
consult the other members in the organization. Thus, loan officers are better able to cater to the
needs of smaller firms through maintaining stronger relationships. In the context of the recent
trend in the banking industry, this suggests that bank consolidation, which increases the number
of larger banks and reduces smaller banks, would have unfavorable consequences for SMEs that
rely on relationship lending. Conversely, bank consolidation would benefit the larger firms that
have access to transaction lending.
Most empirical studies discover that stronger relationships generally improve availability
of credit. Strong relationships, as measured by both length and breadth, help lenders extract
2 The Survey of Small Business Finances (SSBF) 2003 does contain limited data on what types of financial services
a firm receives (transaction, cash management, credit-related, trust, or brokerage services), but this is inapplicable
for my regressional analysis, since it only surveys services provided to the firm in general, and is not specific to the
institution in question.
Choi, 8
proprietary soft information, which can allow them to lend to smaller firms with insufficient hard,
quantitative information. This is beneficial to the borrowers, who now have access to credit that
they otherwise would not due to their lack of transparency. More specifically, stronger
relationship between firms and banks is associated with higher loan application acceptance rate
or more loans without collateral requirements as a part of the loan conditions (Petersen and
Rajan 1994, 1995, Berger and Udell 1995, Cole 1998, Chakraborty et al. 2010). Studies that
focused on U.S. businesses also found that stronger relationships are typically associated with
lower interest rates on the approved loans (Peterson and Rajan 1994, Berger and Udell 1995). It
has also been found recently that strong relationships between banks and firms can increase the
likelihood that a firm would recover from financial distress (Rosenfeld 2011). A study of Italian
manufacturers also show that the duration of credit relationship, which proxies for information
available to a firm’s main bank, is positively correlated with innovation (Herrera and Minetti
2011). It can be inferred from these observations that stronger relationships help agents
overcome the asymmetrical information problem in the loanable funds market through allowing
lenders to collect information from informationally opaque borrowers.
On the other hand, there are theorists who argue that concentrated banking relationships
may involve costs. An exclusive banking relationship may give banks a monopoly power over
businesses, which results in the extraction of rent by charging interest rates that are higher than
market rates (Sharpe 1990, Rajan 1992). Some believe that exclusive relationships between
banks and firms may actually have negative effects for SMEs, and firms may choose to maintain
multiple relationships with banks, or in other words, engage in multiple banking. Multiple
banking rather than an exclusive relationship can protect firms in the event that their primary
bank becomes financially distressed and ends up severing the relationship (Berger et al. 2013). It
may also be possible that financial services may be specialized, which makes it difficult for one
financial institution to supply every type of service a firm requires. This is especially true for
larger firms that may need a greater variety of financial services. Empirical studies have
generally found that larger SMEs tend to engage in multiple banking because of this reason
(Berger at al. 2001). Detragiache et al. (2000) find that contrary to the conventional theory that
many small SMEs maintain relationship with one primary bank, multiple banking is extremely
widespread among many Italian firms. They argue using a theoretical model that multiple
banking ensures a stable supply of credit and reduces the risk of premature liquidation of the
Choi, 9
investment project. If there is a chance that a firm-bank relationship will be terminated
prematurely because of the bank’s internal problems such as liquidity, then the firm may need to
resort to non-relationship finance and interact with multiple banks as a safety net.
Some scholars focus more on exploring the subtleties of firm-bank relationships. There is
some literature on gender and race discrimination in SME finance and relationship lending.
Controlling for other variables, firms that are owned by minorities are likely to face lower credit
availability, often in terms of lower loan approval rates and higher interest rates (Cole 2013). It
has also been argued that discrimination deters minority-owned businesses from applying for
loans in the first place (Blanchflower et al. 2003). Some recent works have found that racism
works as a barrier to entry for entrepreneurs in both the United States and abroad (Ishaq et al.
2010, Dayanim 2011).
Lastly, Berger et al. (2013) is also one of the few works that look at the nature of
relationship itself rather than its effects on SME credit. They find that larger banks actually
maintained longer relationships, which is inconsistent with the conventional paradigm. However,
this is reasonable because larger financial institutions are better able to provide the variety of
financial services a firm needs. Similar to this paper, my research will also concentrate on
looking at the nature of relationships, as opposed to their effects. I will contribute to the SME
literature by introducing an empirical model using a new proxy to measure the strength of
relationship, and also confirm the theories and findings that have been developed in the past.
III. DATA AND SUMMARY STATISTICS
Despite the significance of SMEs to the US economy, little is known about their financial
operations and their means to acquire financial resources. This is partly due to the
informationally opaque nature of SMEs and, consequently, the lack of data. The Survey of Small
Business Finances (SSBF), administered by the Federal Reserve, is one of the few
comprehensive datasets that exist in the field of SME finance. The Federal Reserve conducted
four iterations of this survey in the years 1987, 1993, 1998, and 2003, but these four surveys are
independent and do not follow the same group of firms. The survey was terminated by the Fed
Chairman Ben Bernanke after the 2003 iteration due to budget constraints. In this paper, I use the
2003 iteration of the SSBF to analyze the most recent trends in SME finance. The firms that are
surveyed in this dataset were selected by the Fed in order to create a geographically
Choi, 10
representative sample of small businesses in the United States. Surveys were administered
through computer-assisted telephone interviews, in which the respondents, generally the primary
owner or accountant of the firm, answered the questions over the phone with the assistance of a
computerized script. Small businesses were defined as a nonfinancial, nonfarm enterprise with
fewer than 500 employees. The survey includes firm-specific characteristics, such as firm size,
type of ownership, industry classification, and credit history. It also contains information about
the demographic characteristics of the owners, such as education level, years of experience,
gender, and race. The four iterations of this survey show that the use of financial services for
small firms is virtually universal, and more than half of all SMEs obtain credit from financial
institutions, mainly commercial banks. For the purpose of my thesis, I have excluded the
observations that did not concern commercial banks, since the nature of the relationship with a
commercial bank would be distinctly different from credit unions or insurance companies.3
An interesting characteristic about this dataset is the inclusion of implicates. Each of the
4,240 firms in the dataset entails 5 implicates, yielding a total size of 21,200 observations. The
Federal Reserve imputed the values of variables such as interest rate on credit cards and profit
using five different methods. However, I found these variables to be irrelevant to the regressions
done in my research and thus eliminated the implicates from the dataset.
Much of the original data was omitted due to confidentiality issues. For example, the
exact addresses of each firm and information about its primary bank were dropped in the
publically available version of the dataset. Many authors, such as Cole or Berger, who had
proprietary access to the original version of the dataset, were able to use the merge SSBF 2003
with other datasets such as Call Reports or Summary of Deposits to incorporate bank-specific
information and even macro-level controls on market conditions using the regional breakdowns.
Unfortunately, due to the unavailability of such data, I have decided to mainly focus on the firm-
level, and owner-specific characteristics, and how they impact the strength of relationship.
3 This is a common methodology in the SME literature, such as Berger at al. (2007) or McNulty et al. (2013).
Choi, 11
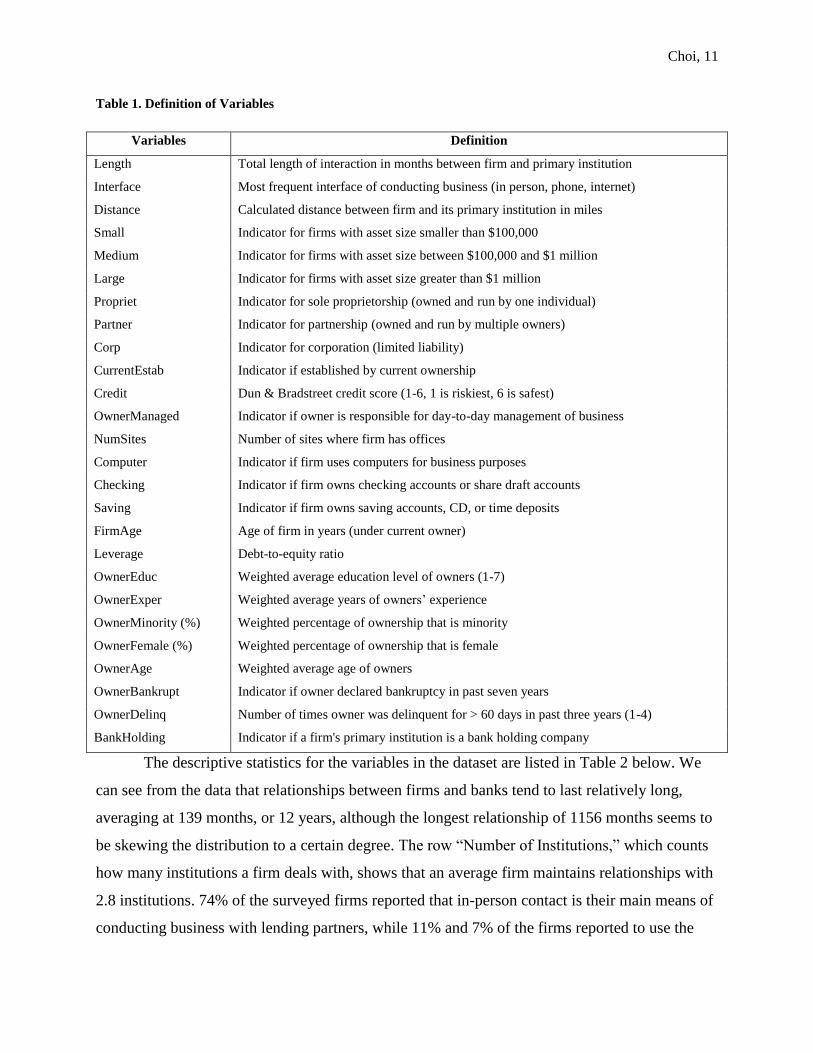
Table 1. Definition of Variables
Variables Definition
Length Total length of interaction in months between firm and primary institution
Interface Most frequent interface of conducting business (in person, phone, internet)
Distance Calculated distance between firm and its primary institution in miles
Small Indicator for firms with asset size smaller than $100,000
Medium Indicator for firms with asset size between $100,000 and $1 million
Large Indicator for firms with asset size greater than $1 million
Propriet Indicator for sole proprietorship (owned and run by one individual)
Partner Indicator for partnership (owned and run by multiple owners)
Corp Indicator for corporation (limited liability)
CurrentEstab Indicator if established by current ownership
Credit Dun & Bradstreet credit score (1-6, 1 is riskiest, 6 is safest)
OwnerManaged Indicator if owner is responsible for day-to-day management of business
NumSites Number of sites where firm has offices
Computer Indicator if firm uses computers for business purposes
Checking Indicator if firm owns checking accounts or share draft accounts
Saving Indicator if firm owns saving accounts, CD, or time deposits
FirmAge Age of firm in years (under current owner)
Leverage Debt-to-equity ratio
OwnerEduc Weighted average education level of owners (1-7)
OwnerExper Weighted average years of owners’ experience
OwnerMinority (%) Weighted percentage of ownership that is minority
OwnerFemale (%) Weighted percentage of ownership that is female
OwnerAge Weighted average age of owners
OwnerBankrupt Indicator if owner declared bankruptcy in past seven years
OwnerDelinq Number of times owner was delinquent for > 60 days in past three years (1-4)
BankHolding Indicator if a firm's primary institution is a bank holding company
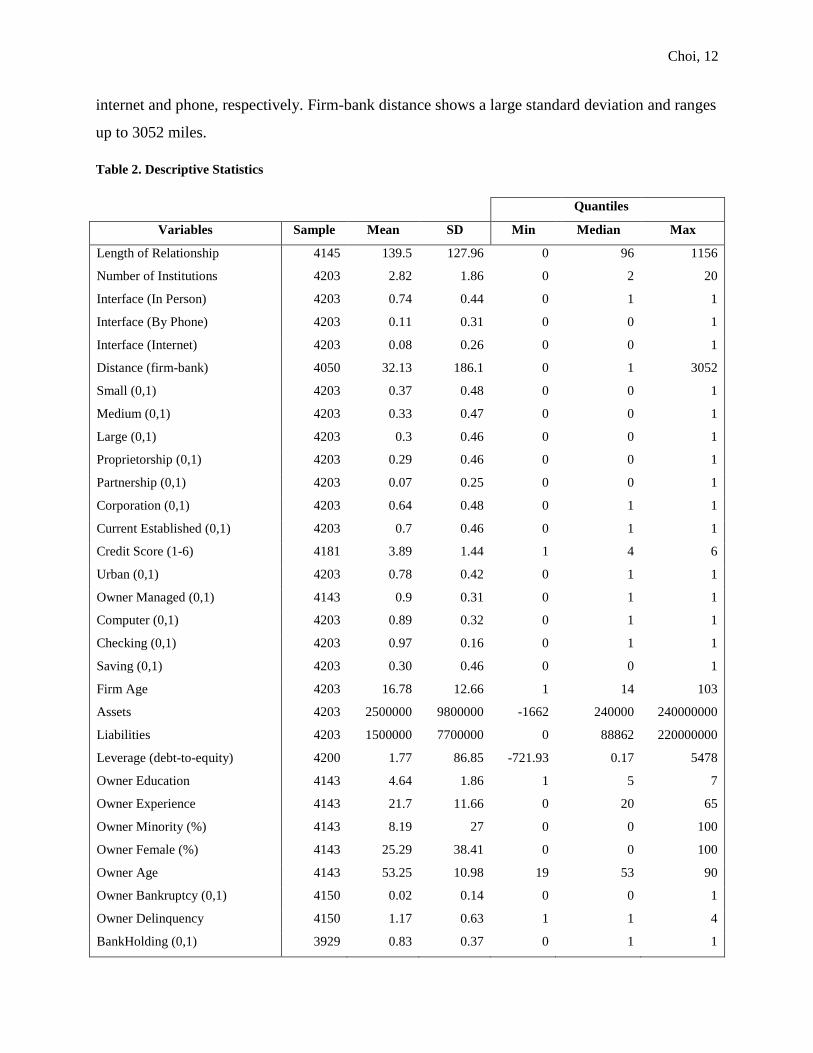
The descriptive statistics for the variables in the dataset are listed in Table 2 below. We
can see from the data that relationships between firms and banks tend to last relatively long,
averaging at 139 months, or 12 years, although the longest relationship of 1156 months seems to
be skewing the distribution to a certain degree. The row “Number of Institutions,” which counts
how many institutions a firm deals with, shows that an average firm maintains relationships with
2.8 institutions. 74% of the surveyed firms reported that in-person contact is their main means of
conducting business with lending partners, while 11% and 7% of the firms reported to use the
Choi, 12
internet and phone, respectively. Firm-bank distance shows a large standard deviation and ranges
up to 3052 miles.
Table 2. Descriptive Statistics
Quantiles
Variables Sample Mean SD Min Median Max
Length of Relationship 4145 139.5 127.96 0 96 1156
Number of Institutions 4203 2.82 1.86 0 2 20
Interface (In Person) 4203 0.74 0.44 0 1 1
Interface (By Phone) 4203 0.11 0.31 0 0 1
Interface (Internet) 4203 0.08 0.26 0 0 1
Distance (firm-bank) 4050 32.13 186.1 0 1 3052
Small (0,1) 4203 0.37 0.48 0 0 1
Medium (0,1) 4203 0.33 0.47 0 0 1
Large (0,1) 4203 0.3 0.46 0 0 1
Proprietorship (0,1) 4203 0.29 0.46 0 0 1
Partnership (0,1) 4203 0.07 0.25 0 0 1
Corporation (0,1) 4203 0.64 0.48 0 1 1
Current Established (0,1) 4203 0.7 0.46 0 1 1
Credit Score (1-6) 4181 3.89 1.44 1 4 6
Urban (0,1) 4203 0.78 0.42 0 1 1
Owner Managed (0,1) 4143 0.9 0.31 0 1 1
Computer (0,1) 4203 0.89 0.32 0 1 1
Checking (0,1) 4203 0.97 0.16 0 1 1
Saving (0,1) 4203 0.30 0.46 0 0 1
Firm Age 4203 16.78 12.66 1 14 103
Assets 4203 2500000 9800000 -1662 240000 240000000
Liabilities 4203 1500000 7700000 0 88862 220000000
Leverage (debt-to-equity) 4200 1.77 86.85 -721.93 0.17 5478
Owner Education 4143 4.64 1.86 1 5 7
Owner Experience 4143 21.7 11.66 0 20 65
Owner Minority (%) 4143 8.19 27 0 0 100
Owner Female (%) 4143 25.29 38.41 0 0 100
Owner Age 4143 53.25 10.98 19 53 90
Owner Bankruptcy (0,1) 4150 0.02 0.14 0 0 1
Owner Delinquency 4150 1.17 0.63 1 1 4
BankHolding (0,1) 3929 0.83 0.37 0 1 1
Choi, 13
For firm size, I categorized the firms into small, medium, and large, using asset size. The
thresholds for respective category was under 100,000, 100,000 - $1 million, and above $1
million. Of these three, the indicator for small firm was used as the base case, and thus does not
show up on my regressional table. Each category is more or less equally represented in the 2003
iteration of the SSBF, 37%, 33%, and 30% respectively. These are relative sizes within the
SMEs, so the large firms as indicated in my variables by no means represent the largest firms in
the United States. It is also worth noting that the SSBF 2003 oversamples larger firms, within the
definition of having fewer than 500 employees. Similarly, the number of sites that a firm
maintains is a representation of geographical scope, as opposed to merely size, and we deem that
this is significant enough to be a separate variable.4 Firm type indicates if a particular firm is a
sole proprietorship, partnership, or corporation, and about 30% of the represented firms were
sole proprietorships, while corporations accounted for 64% of the observations. Of the three
organizational types, sole proprietorship was used as a base case in my regression. The dataset
also specifies if the firm was established by the current ownership coded as a binary variable.
Firms’ credit score was measured by the Dun & Bradstreet scale of 1-6, with 1 indicating the
riskiest firms. Leverage was calculated using the debt-to-equity ratio.
As for demographic variables, it can be seen from Table 2 that the average age of the
firms represented is around 17 years, and the average years of SME owners’ business experience
is around 20 years. We can infer that older firms were oversampled, and not many of the young,
entrepreneurial firms are included in the scope of the survey. In terms of owner-specific
characteristics, we see that on average, owners have obtained a college degree, or an associate
degree in an occupational or academic program. It is also shown that minority and female owners,
8% and 25% respectively, are not as well-represented in this sample.
IV. THEORETICAL FRAMEWORK
As emphasized above, one of the most challenging issues that SMEs face is compromised
availability of credit due to asymmetric information. In an ideal world with a frictionless capital
market, perfect information, and no transaction costs, funds will always be available to business
with investment opportunities. As with most markets, it would be expected that prices of funds,
4 Another firm-specific variable that was omitted in the final version of my regression was the indicator for urban
versus rural firms. This was eliminated from the regression model because SSBF 2003 excluded firms in the
agricultural industry, which renders the distinction between urban and rural firms insignificant.
Choi, 14
or the interest rate on the loans, will adjust so that the demand for funds by businesses will
equate supply of funds from the savers, thereby clearing the loanable funds market. In this
hypothetical world, there would not even be a pressing need for banks to facilitate lending
activities, and financial contracting becomes relatively trivial (Udell 2008).
In practice, however, this is not the case for many firms, especially for SMEs that lack
sufficient informational resources. Theorists argue market frictions such as information
asymmetries may prevent capital flow for firms that need to make investments (Stiglitz and
Weiss 1981). Financial institutions may lack comprehensive understanding of individual firm’s
operations and the underlying project value, forming a classic asymmetric information problem.
In this context, institutions are unable to differentiate firms with good credit quality from those
with bad in their pool of customers. The adverse selection effect of this information problem
emerges when the banks try to make profits or to compensate for their exposure to default risks
by raising the interest rates systematically across all firms. Hence, even the SME customers who
are of good credit quality will be charged higher prices on their loans, which increases their
incentive to exit the market, leaving the pool with firms with lower credit quality (Sharpe 1990).
This will leave the market with more poorly performing businesses, or those that undertake
riskier projects. Another problem that arises is moral hazard, whereby banks see less incentive to
monitor the usage of the loans granted to firms. The informationally opaque firms, in turn, may
engage in unreasonable consumption or risky business activities. Moral hazard effect also
suggests that higher interest rate will encourage borrowers to make riskier investments. Because
of the significant informational disadvantage, financial institutions become more reluctant to
make loans to businesses and result in underinvestment or making terms and conditions on loans
more stringent. This is also supported by the Stiglitz-Weiss credit rationing theory, which
explains that the rate charged on loans determines not only the demand for funds, but also the
riskiness of the borrowers. Since raising the interest rate can increase the riskiness of the
borrower pool, financial institutions ration the quantity of loans, instead of raising the interest to
clear the market.
Theorists suggest that relationship lending using soft information can help small firms
overcome asymmetric information. Relationship can be analyzed in three factors: length,
exclusivity, and depth. A firm that has maintained a prolonged relationship with a bank may be
Choi, 15
allowed access to credit despite not having audited, hard data on the firm’s financials. The firm
may have been able to build trust with the loan officer over time, which can help them overcome
the market failure. The second way of looking at relationship is exclusivity, the distinction of a
firm having relationship with one institution versus multiple. Exclusive relationship can allow
greater access to information for the financial institution, since it can obtain information on a
variety of aspects of the firm. If a firm were transacting with multiple banks to serve different
needs, then each bank would be unable to gather sufficient information on the firm as a whole. It
may also be possible that being exclusive can contribute to the strength of relationship between a
firm’s owner and a loan officer, since the firm provides exclusive business to the financial
institution. However, it is important to note that an exclusive relationship may not be the most
efficient. The level of competition between banks may be a reason a firm deals with one partner.
In places where there is no competition, a firm may face limited options for credit. Lastly, the
depth of relationship refers to the range of financial services, such as checking, savings accounts,
or brokerage services, that a bank provides to a firm. The wider the variety of services a firm
subscribes for, the more the bank can gather information about the firm over time. These three
aspects of relationship can help an informationally opaque firm get access to credit that may be
otherwise unavailable.
There are also some implications for risk management that arise when a firm acquires
credit through relationship lending. Unlike transaction lending, which involves a bureaucratic
process of screening loan applications, relationship lending is generally decided single-handedly
by the loan officers at local banks, who use the soft information gathered over time to determine
the quality of borrowers. Since soft information is not easily observable or quantifiable, it is
difficult for loan officers to transfer the information to agents in the other areas in the bank (Stein
2002). Financial economists argue that this may result in an agency problem, whereby the loan
officers, who make loan approval decisions on behalf of the bank’s interests, shirk off
responsibilities to thoroughly evaluate and monitor loans due to their disutility for activities that
require efforts (Berger and Udell 2002).
Choi, 16
V. EMPIRICAL FRAMEWORK
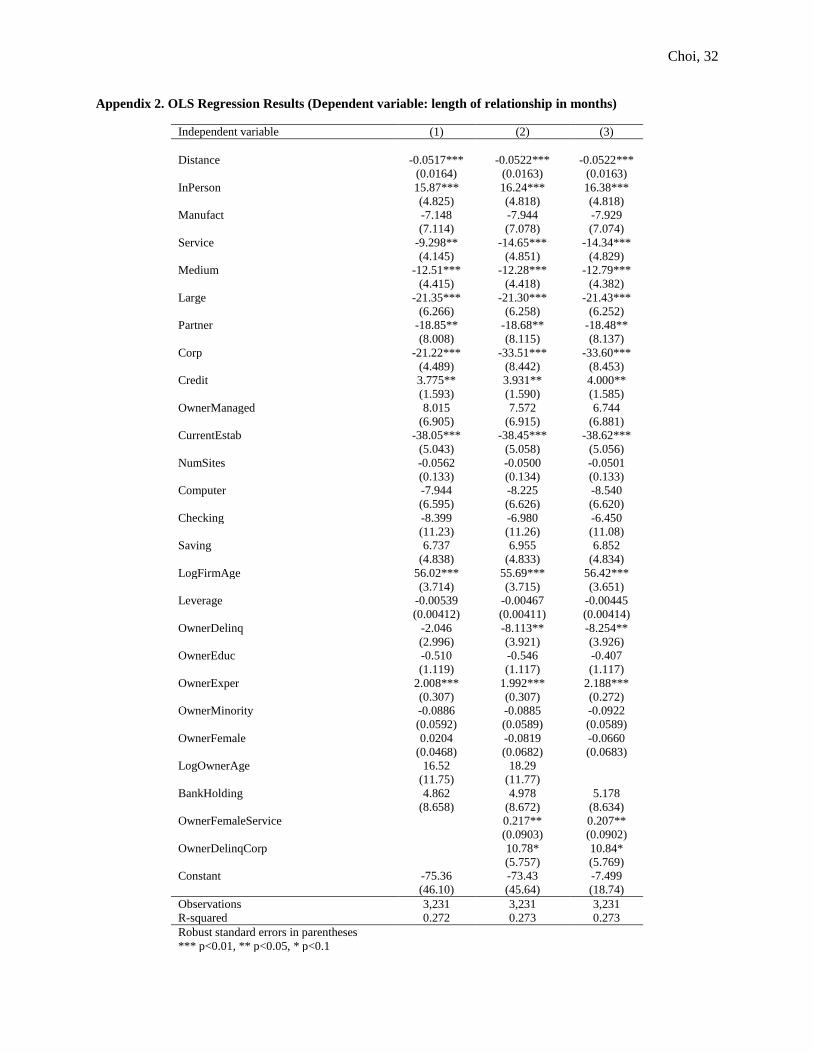
In this paper, I use three regression models to gauge the strength of relationships between
borrowers and lenders.5 My first model examines the effect of firm, owner, and lender
characteristics on the length of relationship using a cross-sectional Ordinary Least Squares (OLS)
regression. Multiple variations of the regression are created to isolate the impacts of the
interaction variables and the owner’s age variable.6 The latter was done to check the impact of
the mechanical association between the length of relationship and age in years:
Length of relationship (in months)7
= β0 + β1 Firm characteristics +β2 Firm owner characteristics
+ β3 Lender characteristics + ε
My second model is a logit regression model that uses the indicator for exclusivity as the
dependent variable. Researchers have previously used the number of institutions a firm deals
with to create an indicator for firms that maintain exclusive relationships (1 for firms dealing
with one institution and 0 for more than one). They then used this binary variable to conduct
either a logit or probit regression. In my second regression, I will use the logit model and present
the results as odds ratios, which are simply obtained by exponentiating the original coefficients.
In terms of interpreting the results, an odds ratio greater than 1 can be interpreted as having a
positive effect, equivalent to a positive coefficient in a standard logit regression. Conversely, an
odds ratio smaller than 1 can be interpreted as having a negative coefficient:
Probability of firm being in exclusive relationship8
= β0 + β1 Firm characteristics +β2 Firm owner characteristics
+ β3 Lender characteristics + ε
5 Of the three aspects of relationship mentioned previously, SSBF 2003 lacked sufficient data on the complexity and
depth of relationship, namely what types of services were available to the firms. One possibility for the dependent
variable was the interface of business, but we believe that interface may enhance depth, rather than representing the
depth of relationship itself. Thus, we deemed it was not a good proxy and excluded the third regression. 6 In Appendices 2-4, column (1) refers to the original model, (2) adds the two interaction variables, and (3) omits the
owner age variable from the model in (2) to see if there is any distortion in the results. 7 See Appendix 2.
8 See Appendix 3.
Choi, 17
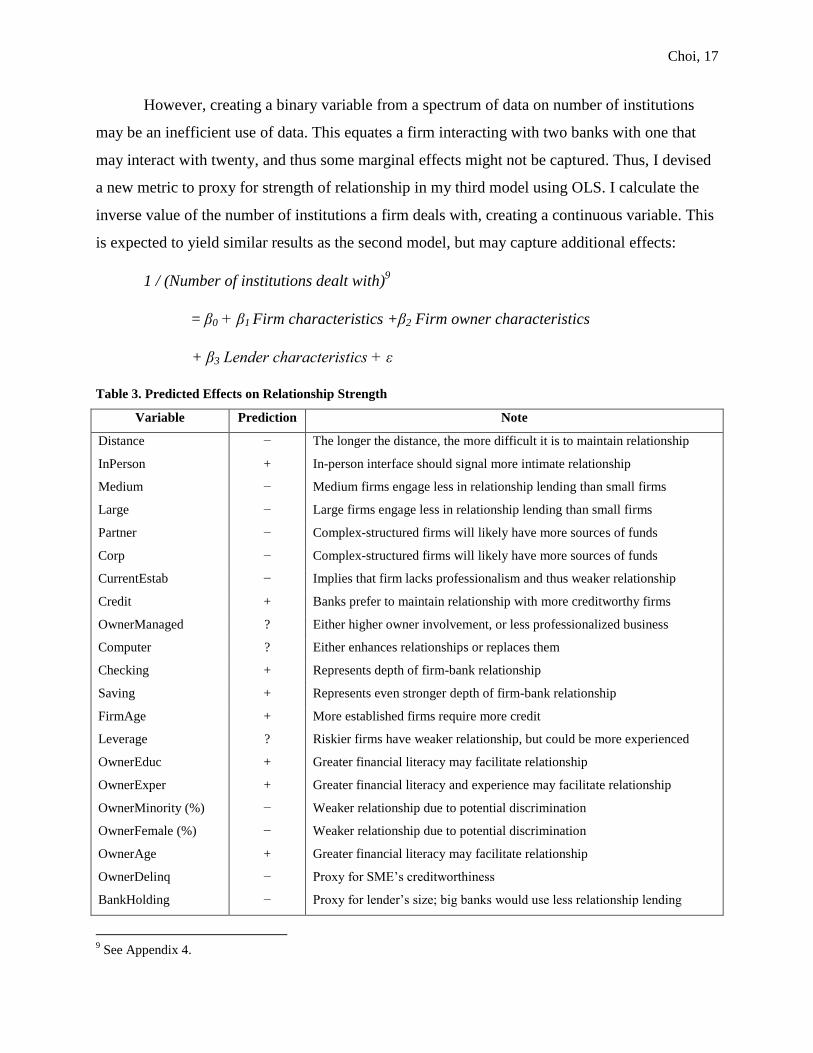
However, creating a binary variable from a spectrum of data on number of institutions
may be an inefficient use of data. This equates a firm interacting with two banks with one that
may interact with twenty, and thus some marginal effects might not be captured. Thus, I devised
a new metric to proxy for strength of relationship in my third model using OLS. I calculate the
inverse value of the number of institutions a firm deals with, creating a continuous variable. This
is expected to yield similar results as the second model, but may capture additional effects:
1 / (Number of institutions dealt with)9
= β0 + β1 Firm characteristics +β2 Firm owner characteristics
+ β3 Lender characteristics + ε
Table 3. Predicted Effects on Relationship Strength
Variable Prediction Note
Distance − The longer the distance, the more difficult it is to maintain relationship
InPerson + In-person interface should signal more intimate relationship
Medium − Medium firms engage less in relationship lending than small firms
Large − Large firms engage less in relationship lending than small firms
Partner − Complex-structured firms will likely have more sources of funds
Corp − Complex-structured firms will likely have more sources of funds
CurrentEstab − Implies that firm lacks professionalism and thus weaker relationship
Credit + Banks prefer to maintain relationship with more creditworthy firms
OwnerManaged ? Either higher owner involvement, or less professionalized business
Computer ? Either enhances relationships or replaces them
Checking + Represents depth of firm-bank relationship
Saving + Represents even stronger depth of firm-bank relationship
FirmAge + More established firms require more credit
Leverage ? Riskier firms have weaker relationship, but could be more experienced
OwnerEduc + Greater financial literacy may facilitate relationship
OwnerExper + Greater financial literacy and experience may facilitate relationship
OwnerMinority (%) − Weaker relationship due to potential discrimination
OwnerFemale (%) − Weaker relationship due to potential discrimination
OwnerAge + Greater financial literacy may facilitate relationship
OwnerDelinq − Proxy for SME’s creditworthiness
BankHolding − Proxy for lender’s size; big banks would use less relationship lending
9 See Appendix 4.
Choi, 18
Firm Influences on Strength of Relationship10
We would expect that the greater the distance between a firm and a bank, the weaker the
relationship, since it becomes more difficult to sustain contact over time. Especially given that
most firms interact with their banks in person, it should hold true that the closer firms are to their
banks, the easier it would be for them to interact frequently.11
Another variable that falls under
this category is the most frequent interface in conducting business. About 70% of the firms
surveyed in this dataset have reported that they mainly interact with institutions in person, with
11% using phone and 8% using internet to do business. It would be expected that in-person
interaction, presumably the most intimate type of interface, would be positively correlated with
the strength of relationship.
We would expect the size of a firm to play an important role in strength of relationship,
as explained by many authors who explore the nature of firm-bank relationships. We predict that
firms of smaller size will engage in relationship lending more heavily, which implies that the
firm would be maintaining a more sustained contact with its primary financial institution. On the
other hand, larger firms would have more avenues of funding available through transaction
lending, which means that they would not face a need to maintain a strong relationship with one
particular financial institution. Another important aspect of a firm’s characteristics is the type of
firm structure. The distinction between sole proprietorship, partnership, and corporation can be
analyzed in two different ways. Firstly, corporations, compared to sole proprietorships or
partnerships, would be expected to be more professional and equipped with more expertise. With
more resources available, corporations would feel less need to maintain strong relationships with
a small number of banks. Secondly, sole proprietorship is a structure in which the owner is
entirely personally liable for the firm’s performance, while in a corporation, the liability is split
among many people. One could argue that in an organization where the owner feels entirely
liable for the whole firm, he or she would make the best effort to secure funding through
sustaining strong relationships with the local banks. On a similar note, a company where the
owner is heavily involved would show a similar pattern to sole proprietorships, demonstrating
stronger relationships with the community banks. Lastly, a firm’s age may also indicate the need
10
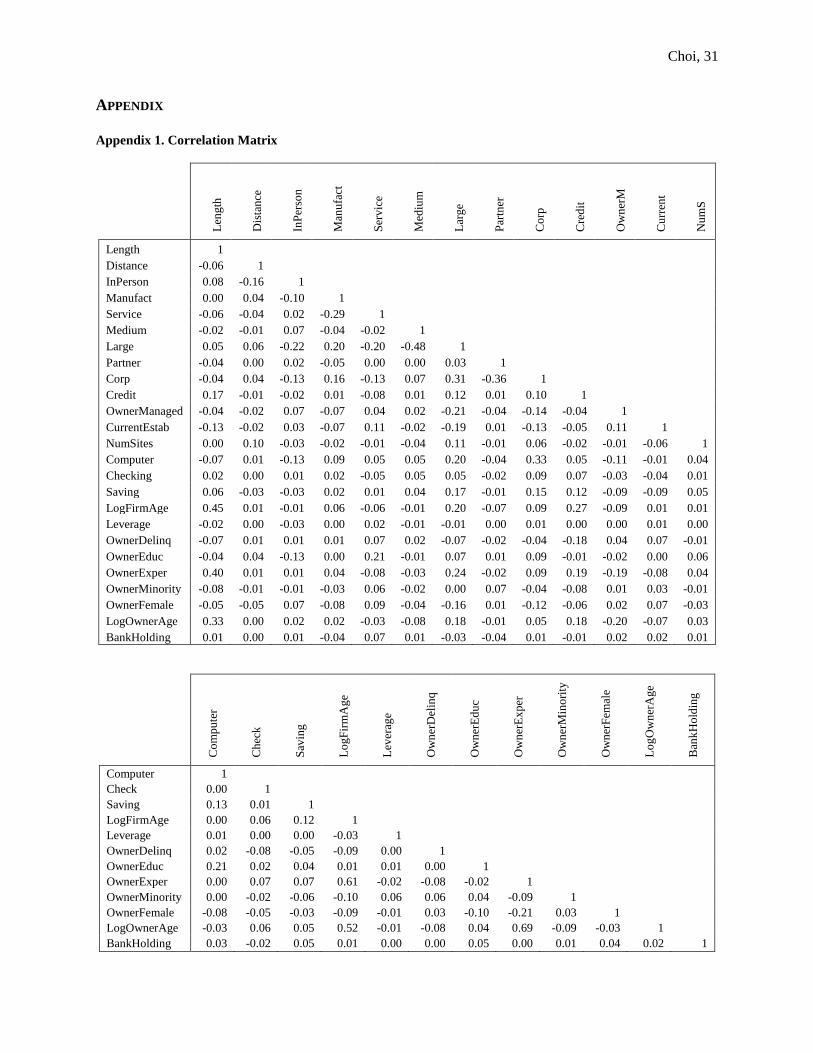
Through running the Variance Inflation Factor (VIF) test, we found that there is no multicollinearity among the
independent variables. Also, see Appendix 1 for the correlation matrix of the independent variables. 11
Another possible proxy for relationship strength was the frequency of interaction, but this data was not available
in SSBF 2003 and thus was not included in the regression.
Choi, 19
of credit. It can be argued that firms that are well-established are in need of more credit, given
their level of experience and sophistication in their business. Some scholars believe that firm age
is a measure of opacity, which can affect the likelihood of borrowing (Berger et al. 2005).
However, the age variable must be analyzed with caution, because there is a mechanical
association between age and length of relationships. The log transformation of firm age and the
length of relationship in months is shown to have a relatively high correlation of 0.44, and it is
important to keep this in mind as we interpret the regression results.
The use of computers is an interesting variable worth taking note of. About 90% of the
surveyed firms have reported to use computers for their regular business practices. It could be
argued that firms who better utilize technology have many sources of funds at their disposal. On
the contrary, if firms do not have access to computers, for reason such as being run by older
owners who are not as technologically up-to-date, then the sole means of interacting with
financial institutions would be in person, most likely in relationship lending. This would likely
be associated with stronger relationship. However, one could also argue that the use of
computers would not necessarily impede relationships, but would rather enhance it by making
communication more convenient. Thus, the predicted relationship between the use of computers
and relationships is unclear. For an SME that owns a checking or saving account, or is
subscribed to a wide array of financial services, it can be assumed that its primary institution
must have accumulated information on the firm through those financial services over time. In
particular, savings accounts may show an even greater depth of relationship, beyond services
such as compensating balance. This implies that the problem of asymmetric information may be
alleviated through greater strength of relationship.
The impact of credit score is more apparent. It would be safe to assume that if a company
has a bad credit score, this would make banks more unwilling to transact with them, destabilizing
the firm-bank relationship. Similarly, we would expect a firm’s history of bankruptcy or
delinquency to deter relationship, since such record will influence the firm’s ability to access
credit in the future.12
The lending institutions will likely deny or only approve loan applications
12
Firm delinquency, which was originally included in the regression, was omitted due to endogeneity. A firm’s past
history of delinquency would weaken the strength of relationship, which would then influence the likelihood of the
firm becoming delinquent in the future as well. Durbin-Wu-Hausman test showed there is indeed endogeneity. In
addition, only 27 firms out of the entire sample had records of bankruptcy, and they were causing a distortion in the
regression. Thus, the variable on firm bankruptcy was dropped as well due to the inherent bias in the sample.
Choi, 20
with more stringent terms and conditions. The role of leverage in determining relationship
strength is subtler. A firm that is highly leveraged would be perceived as risky by the lenders,
and the relationship would consequently be weakened. However, leverage may also show a
firm’s inherent need for large amounts of credit, which calls for a stronger relationship between
firms and banks. Thus, the predicted impact of leverage on strength of firm-bank relationship is
also ambiguous.
Owner Influences on Strength of Relationship
Owner-specific characteristics may play a role as well, especially given that relationship
lending almost exclusively deals with the relationship between loan officers and SME owners.
We would expect that the owner’s financial literacy would come into play, which can be
represented by the owner’s level of education, years of experience, and even age. The more
financially sophisticated the owner is, the more likely he or she would be engaged in an intimate
relationship with the loan officer, assuming that loan officers are more likely to approve loans to
financially literate and responsible individuals. However, there is a need to be cautious about
using the owner’s age as a variable, the same reason for the word of caution in interpreting the
firm age variable. The mechanical association between age and length of relationship, since older
owners may have had more years available to have longer relationships, can have a distortionary
effect on the regression. For this reason, I run a separate regression without this variable to check
if it yielded significant differences.13
Owner’s history of delinquency is also important in
determining strength of relationship, since it can serve as a proxy for credit score for small firms
without extensive credit history. However, we create an interaction variable between this
variable and the indicator for corporation, since we believe that for a corporation where the
ownership is shared across many people, the delinquency record of the main owner would have a
less significant effect on the strength of relationship. We also postulate that owners who are
minorities or female may be discriminated against throughout the loan application process,
yielding lower correlation with relationship strength. Additionally, an interaction variable is
created between owner’s gender and service sector, since we believe that female owners are
generally more likely to be in the service sector. This is a measure to remedy the fact that the
female indictor may not be able to capture all effects by itself.
13
Also, the regressions that use exclusivity as dependent variables are free from this bias.
Choi, 21
Financial Institution Influences on Strength of Relationship
Lastly, lender characteristics, namely the size of institution, can complement the analysis.
Due to the lack of publically available data, the only available variable that can indicate lender’s
characteristics is the indicator for bank-holding companies.14
This variable was created by the
Fed through merging SSBF 2003 with Summary of Deposit using the name of the bank, which is
only available in the proprietary version of the dataset. We use this binary indicator to proxy for
size of the bank, in which an institution that is a bank-holding company can be assumed to be
larger than one that is not. It is also a proxy for the portfolio focus of the bank, since the
conventional wisdom states that institutions of bigger size will interact more with older and
larger firms (Haynes et al. 1999). It would be consistent with the current literature that the larger
the bank, the less likely it will engage in relationship lending, since larger institutions are poorer
at processing soft information (Stein 2002). This would result in a negative correlation between
the size of bank and strength of relationship. However, it may also be that bigger institutions can
offer more services due to factors such as economies of scale, and firms may maintain longer, or
more exclusive relationships with the bank, since it is a one-stop shop for SMEs. The so-called
“deep pocket” theory predicts that the size of bank would be positively correlated with
relationships strength.
VI. RESULTS
We find that generally the three regression models conducted yield similar results, which
are displayed in Appendices 2-4. Appendix 2 presents the results from the OLS regression on
length of relationship, while Appendices 3 and 4 show the result of the models that use the
exclusive relationship indicator and the inverse value of number of institutions dealt with,
respectively. The OLS models yield an R-squared value of around 0.27, which seems low but is
expected from a regression using cross-sectional data. Although using the inverse of number of
institutions dealt with generally reveals similar information as the original logit model, it does
show higher significance for certain variables. This indicates that my new metric of measuring
strength of relationship may be capturing more data than the logit model, which is manifested in
higher significance level.
14
Performing the Ramsey RESET test showed that my model has omitted variables, which is an expected outcome
because the data on lending institutions were not available and the strength of relationship is contingent upon both
firm and bank characteristics.
Choi, 22
Distance is indeed significant in all regressions, although in a small magnitude. This is
consistent with our prediction that longer distance may hamper the interaction between a firm’s
owner and the loan officer. The literature also supports this finding that distance is negatively
correlated with the length of relationship (Rauterkus 2014). The regression on length of
relationship shows that in-person interaction is closely associated with longer relationship,
represented in both high statistical significance and high coefficient. In all regressions, the sector
variables showed insignificant relationship with the dependent variables. Manufacturing firms
generally have slightly shorter relationship with their financial institutions, which is consistent
with our belief that the nature of loans taken out by manufacturing companies will tend to be
larger and riskier. However, these patterns carry a large standard error. On the other hand, the
service sector show a significant negative relationship with the length of interaction. This is
contrary to our prediction that service sectors are comparatively low maintenance and thus would
face less barriers to acquiring the capital they need.
Most regressions suggest that the size of firm is a critical determinant of the strength of
relationship. I find that medium- and large-sized firms are likely to have shorter and less
exclusive relationship with banks, which is consistent with the existing literature that bigger
firms engage more in transaction lending and less relationship lending. Smallest firms generally
maintain longer and more exclusive relationships, a result that is also supported by the
conventional wisdom that small firms are unable to leverage arms-length, transaction lending
and resort to relying more on relationship lending. This is also supported by the effect of number
of sites. It is shown that firms with more sites on which they operate, which represents the
geographic scale of the firm, maintain shorter relationship with one particular institution. These
are consistent with much of the existing findings that firms differ in their main lending
technologies depending on their size (Berger and Black 2011, Berger et al. 2013).
I also find that types of firm structure matters as well. Compared to sole proprietorship,
where the owner is personally liable for the firm, corporations show a negative relationship with
the length and exclusivity of relationship. This is consistent with our prediction that firms with
more complicated structure are more likely to be experienced and thus have more avenues of
funds available to them. On the contrary, sole proprietorships may not have such access, thus
resorting to relationship-based lending with their partner banks. Similarly, owner-managed firms
Choi, 23
are generally associated with longer relationships with their institutions, although with small
significance. What is unexpected in this section is the significance of the current establishment
dummy variable, which indicates that the firm was established by the current owner, as opposed
to being purchased or transferred ownerships otherwise. We expected that if the current owner is
the founder of the firm, the structure of the firm would be simpler and thus may be less
professional. However, the unexpected part is that the magnitude and significance of this
variable is the one of the biggest in the regression.
Next, credit scores demonstrate an expected positive correlation with the length of
relationship, which is consistent with the framework established in the literature (Berger and
Udell 2006). Similarly, owners’ delinquency records, which proxies for the firms’
creditworthiness, have also shown to have a negative impact on strength of relationship. Firms
with better credit scores are shown to have a longer and more exclusive relationship with their
respective institutions. The impact of owner’s record of delinquency on relationship length is
significant at a 5% level, which supports our theory that for SMEs that lack sufficient hard data
on their financials, the firm owners’ records serve as a proxy for the firm’s creditworthiness in
loan application process. I also find that the interaction variable between owner’s delinquency
record and corporation shows a significant positive effect on the length of relationship, although
this result is not as apparent in the regression using exclusivity measures. This is consistent with
our belief that for corporations with shared ownership, one particular owner’s delinquency
record may not necessarily have a negative impact on the strength of the relationship with their
financial institutions. Similar effect was found in the firms’ use of leverage, which was
calculated with the debt-to-equity ratio. Results show that firms that are more leveraged, which
are perceived as riskier, have shorter relationships with their banks, although at a very low
significance and magnitude. This is more or less consistent with the findings in the literature
(Berger et al. 2013). An interesting finding was that although the logit model using the exclusive
relationship indicator does not show any significance of leverage, the inverse metric captures a
highly significant, positive effect on exclusivity. This implies that firms that are more leveraged
and thus are perceived risky may face difficulty acquiring funds through transaction-based
methods and thus have to resort to relationship lending to take out business loans.
Choi, 24
Using computers in general business operations shows a negative impact on the strength
of relationship. Although the results are insignificant in the length of relationship, the results for
exclusivity show strong negative results, suggesting that computers may be replacing the
interaction between owners and loan officers. However, it should be noted that this may be a
biased result because most firms reported that they use computers, and only around 10% of the
represented firms did not use computers. Maintaining financial services with the firms’
respective lenders shows mixed results. The checking account indicator has a negative
coefficient, indicating a weaker relationship. However, having a checking account may not
necessarily reflect the depth of relationship as well as a savings account, and this variable also
had an extremely low significance, so this does not necessarily undermine our argument. Saving
accounts, on the other hand, show a positive impact on the length of relationship, with a much
smaller standard error. This is consistent with our belief that subscribing to different financial
services implies the depth of the relationship between firms and banks, which should correlate
with stronger relationships.
We also found that a firm’s age also has a significant, positive impact on the length of
relationship. This was partly to be expected as a tautological relationship, since a firm that has
been in existence for a longer period may naturally have longer relationships. However, firm age
has a deeper implication, since it shows the opacity of the firm. In the regression for measures of
exclusivity, we see that older firms are associated with greater number of institutions dealt with.
Again, this is a result that is shown as more significant in the regression using the inverse metric
compared to the logit model. This is consistent with the literature that older firms are relatively
larger and more transparent, and thus have more avenues of funding available (Haynes et al.
1999, Berger et al. 2005). This can also be because older firms are more likely to be well-
established standing in the market compared to the younger counterparts, and thus see less need
to maintain long relationships with one particular institution.
Next, I find that owner-characteristics are not as pronounced as I expected. Owners’
average education level seems to have a negligible impact on the length of relationship. This may
be because the owner’s level of education may not necessarily reflect his or her level of
sophistication in the business setting. Since most owners have reported to have a college degree
or its equivalent, the marginal impact of having a higher or lower degree may be insignificant.
Choi, 25
What matters, however, is the level of experience. The impact of an additional years of
experience is highly significant, which is consistent with the existing empirical research
(Carrahera 2013). This is expected because experience is a crucial factor in running a business,
and a loan officer is likely to base this as a reference for the quality of the firm.
Contrary to what I expected, this particular dataset does not show a significant evidence
of racial or gender discrimination. Owners who are minorities or females show very minimal,
negative impact on the length of relationship, with very high standard error. This is contrary to
some of the findings in the literature on discrimination (Blanchflower et al. 2003, Cole 2013).
However, this is not entirely a contradiction, given the low level of representation of minorities
and females in the particular dataset I utilized. The higher barrier to entry for minority
entrepreneurs may explain the selection bias of minority-owned firms being underrepresented in
this dataset (Ishaq et al. 2010, Dayanim 2011). The interaction variable between female owners
and service sector, however, show a significant effect. Female owners who work in the service
sectors were found to maintain slightly longer relationships with their financial institutions.
Lastly, owners’ age also seem to show a somewhat positive effect on the length of relationship,
at a low significance level. The separate regression I ran without the owner age variable does not
seem to have very big distortions, and every other variable maintained generally the same results.
However, the size of the lending institution shows a relationship that contradicts the
consensus in the literature that larger banks may not engage much in relationship lending. This
was due to the issues of having to transmit soft information collected on the SMEs through the
layers of bureaucracy of the bank. The indicator for a bank-holding company, used in this
regression as a proxy for the size of the institution, is associated with longer relationship,
although not very significant. This, however, is a reasonable outcome that is explained by the
“deep pocket” theory, which supports the idea that a firm would likely maintain a relationship
with a larger bank that can serve a variety of needs for the firm. The low significance may have
emerged because of the competing effect of the conventional argument and the “deep pocket”
theory.15
This result is also consistent with some recent works that suggest SMEs may maintain
longer relationships with larger financial institutions because of the variety of services they can
offer (Berger et al. 2013).
15
It may also be due to the fact that my regression lacks sufficient data on the financial institutions, and there is
omitted variable bias.
Choi, 26
VII. CONCLUSION
Ever since the inception of the Survey of Small Business Finance in 1987, many works
have contributed to the research framework surrounding the issue of small business credit
availability. Following the seminal work of Peterson and Rajan (1994), and Berger and Udell
(1995), many works of literature have been introduced that explored the issue of access to credit
for SMEs. Contrary to the most of the literature that surveys the impact on credit availability, I
decided to focus on what determines the strength of relationship between firms and banks. This
is crucial to the existing literature, since there is already an established link between strong
relationship, as measured by length and depth, and better access to credit, often in forms of lower
interest rates or more lax conditions. In particular, I was able to use my original metric to view
strength of firm-bank relationship, namely the inverse value of the number of financial institution
that a firm deals with. By comparing these results with the standard OLS regression using the
length of relationship and the logit model using the exclusive relationship indicator, I was able to
confirm the past theories on SME finance, and in some cases, using even higher significance
levels. Firm size and organization type turned out to be some of the most contributing variables
to the strength of relationship. The results supported the conventional wisdom that smaller firms
engage more in relationship lending than transaction lending. Older and larger firms maintain
less exclusive relationships with institutions, which implies that they have more avenues for
capital using transaction lending. One deviation from the consensus in the literature, however,
was the impact of the size of the institution. Although current research framework suggests that
large financial institutions mainly use transaction lending and thus have weaker relationships
with SMEs, results from my regression do not support this. This may be partly due to the lack of
data on creditor institutions, but it is likely also that the larger financial institutions are better
able to provide comprehensive services that firms require, which motivates them to maintain
stronger relationships.
Not surprisingly, credit was an important aspect of relationship strength. Results show
that higher credit scores lead to stronger relationships, both in terms of length of relationship and
exclusivity. Also, the firm owner’s record of delinquency showed a significant, negative impact
on the length of relationship. The owner’s credit history seem to serve as a proxy for the firm’s
Choi, 27
creditworthiness for the loan officers, especially in the case of many SMEs in which financial
data is not sufficient.
Although we were able to highlight several factors that contributed to strong relationships
between firms and banks, there were limitations that may have prevented optimal results. I have
already mentioned that unlike some of the other authors who used SSBF 2003, I was not able to
access the confidential data on the location of the firms and their banks. Economists such as
Berger who did have access were able to merge the SSBF 2003 with Call Reports and Summary
of Deposits to obtain data on the lender’s characteristics as well. The nature of the relationships
is naturally contingent upon both borrower’s and lender’s conditions, and I was not able to
sufficiently account for the strength of relationships from the lenders’ perspective. In addition,
strength of relationship may also depend on the local market conditions, which calls for using
controls for regional economies. However, due to the lack of data on locations, incorporating this
into my regression was not feasible either. Going forward, other researchers who have
proprietary access to these datasets may be able to enhance the literature by controlling for the
lenders’ characteristics as well as market conditions.
The results of this study suggest that policymakers need to be cognizant of the impact of
firm size and ownership, and tailor regulations so that SMEs can better access the capital they
need. Older and larger firms, which tend to be more informationally transparent, may have better
access to credit, but smaller firms and sole proprietorships generally rely heavily on relationship
lending, and thus face more difficulty in acquiring funding. More avenues of funds should be
made available for these firms through, for instance, expanding the Small Business
Administration Loan Program, in order to remedy this issue.
Choi, 28
BIBLIOGRAPHY
Avery, R. B., & Samolyk, K. A. (2004). Bank Consolidation and Small Business Lending: The Role of
Community Banks*. Journal of Financial Services Research, 25(2/3), 291-325.
Berger, A. N., & Black, L. K. (2011). Bank size, lending technologies, and small business finance.
Journal of Banking & Finance, 35(3), 724.
Berger, A. N., Goldberg, L. G., & White, L. J. (2001). The Effects of Dynamic Changes in Bank
Competition on the Supply of Small Business Credit. European Finance Review, 5(1-2), 115-139.
Berger, A. N., Miller, N. H., Petersen, M. A., Rajan, R. G., & Stein, J. C. (2005). Does function follow
organizational form? Evidence from the lending practices of large and small banks. Journal of
Financial Economics, 76(2), 237-269.
Berger, A. N., & Udell, G. F. (1995). Relationship lending and lines of credit in small firm finance.
Journal of Business, 68(3), 351.
Berger, A. N., & Udell, G. F. (1998). The economics of small business finance: The roles of private
equity and debt markets in the financial growth cycle. Journal of Banking & Finance, 22(6–8),
613-673. doi: http://dx.doi.org/10.1016/S0378-4266(98)00038-7
Berger, A. N., & Udell, G. F. (2006). A more complete conceptual framework for SME finance*. Journal
of Banking & Finance, 30(11), 2945.
Berger, A. N. G., William; Rice, Tara,. (2013). Do Small Businesses Still Prefer Community Banks? FRB
International Finance Discussion Paper, No. 1096.
Berger, A. N. K., Leora F.; Udell, Gregory F. (2001). The ability of banks to lend to informationally
opaque small businesses. Journal of Banking & Finance, 25(12).
Blanchflower, D. G., Levine, P. B., & Zimmerman, D. J. (2003). Discrimination in the Small-Business
Credit Market. The Review of Economics and Statistics, 85(4), 930-943. doi: 10.2307/3211816
Carrahera, S., & Van Auken, H. (2013). The use of financial statements for decision making by small
firms. Journal of Small Business and Entrepreneurship, 26(3), 323-336.
Carter, D. A., & McNulty, J. E. (2005). Deregulation, technological change, and the business-lending
performance of large and small banks. Journal of Banking & Finance, 29(5), 1113-1130.
Chakraborty, A., Fernando, C., & Mallick, R. (2010). The Importance of Being Known: Relationship
Banking and Credit Limits. Quarterly Journal of Finance and Accounting, 49(2), 27-48.
Chari, V. V., Christiano, L. J., & Kehoe, P. J. (2007). The Gertler-Gilchrist Evidence on Small and Large
Firm Sales. Mimeo.
Cole, R. A. (1998). The importance of relationships to the availability of credit. Journal of Banking &
Finance, 22(6–8), 959-977. doi: http://dx.doi.org/10.1016/S0378-4266(98)00007-7
Cole, R. A. (2013). Who Needs Credit and Who Gets Credit? Evidence from the Surveys of Small
Business Finances. Rochester: Social Science Research Network.
Choi, 29
Cole, R. A. G., Lawrence G.; White, Lawrence J. (2004). Cookie-Cutter Versus Character: The Micro
Structure of Small-Business Lending by Large and Small Banks. Journal of Financial and
Quantitative Analysis, Vol. 39(No. 2).
Dayanim, S. L. (2011). Do Minority-Owned Businesses Face a Spatial Barrier? Measuring
Neighborhood-Level Economic Activity Differences in Philadelphia. Growth and Change, 42(3),
397.
Detragiache, E., Garella, P., & Guiso, L. (2000). Multiple versus Single Banking Relationships: Theory
and Evidence. The Journal of Finance, 55(3), 1133-1161. doi: 10.2307/222448
Fort, T. C., Haltiwanger, J., Jarmin, R. S., & Miranda, J. (2013). How Firms Respond to Business Cycles:
The Role of Firm Age and Firm Size. IMF Economic Review, 61(3), 520-559. doi:
http://dx.doi.org/10.1057/imfer.2013.15
Haynes, G. W. O., Charles; Berney, Robert. (1999). Small business borrowing from large and small banks.
Business Access to Capital and Credit, 287-327.
Herrera, A. M., & Minetti, R. (2004). Informed Finance and Technological Change: Evidence from Credit
Relationships. Rochester: Social Science Research Network.
Houston, J., & James, C. (1996). Bank information monopolies and the mix of private and public debt
claims. The Journal of Finance, 51(5), 1863-1889.
Ishaq, M., Hussain, A., & Whittam, G. (2010). Racism: A barrier to entry? Experiences of small ethnic
minority retail businesses. International Small Business Journal, 28(4), 362-377. doi:
http://dx.doi.org/10.1177/0266242610363523
McNulty, J. E., Murdock, M., & Richie, N. (2013). Are commercial bank lending propensities useful in
understanding small firm finance? Journal of Economics and Finance, 37(4), 511-527.
The Oxford handbook of entrepreneurial finance. (2012). New York: Oxford University Press.
Park, Y. (2008). Banking Market Concentration and Credit Availability to Small Businesses. Rochester:
Social Science Research Network.
Petersen, M. A., & Rajan, R. G. (1994). The Benefits of Lending Relationships: Evidence from Small
Business Data. The Journal of Finance, 49(1), 3-37. doi: 10.2307/2329133
Petersen, M. A., & Rajan, R. G. (2002). Does Distance Still Matter? The Information Revolution in Small
Business Lending. The Journal of Finance, 57(6), 2533-2570. doi: 10.2307/3094536
Rajan, R. G. (1992). Insiders and Outsiders: The Choice between Informed and Arm's-Length Debt. The
Journal of Finance, 47(4), 1367-1400. doi: 10.2307/2328944
Rauterkus, A., & Munchus, G. (2014). Geographical location: does distance matter or what is the value
status of soft information? Journal of Small Business and Enterprise Development, 21(1), 87-99.
Shane, S. (2008). The illusions of entrepreneurship : the costly myths that entrepreneurs, investors, and
policy makers live by. New Haven: Yale University Press.
Choi, 30
Sharpe, S. A. (1990). Asymmetric Information, Bank Lending, and Implicit Contracts: A Stylized Model
of Customer Relationships. The Journal of Finance, 45(4), 1069.
Stein, J. C. (2002). Information Production and Capital Allocation: Decentralized versus Hierarchical
Firms. The Journal of Finance, 57(5), 1891-1921. doi: 10.2307/3094499
Stiglitz, J. E., & Weiss, A. (1981). Credit Rationing in Markets with Imperfect Information. The
American Economic Review, 71(3), 393-410. doi: 10.2307/1802787
Udell, G. F. (2008). What's in a relationship? The case of commercial lending. Business Horizons, 51(2),
93-103. doi: http://dx.doi.org/10.1016/j.bushor.2007.10.005
Choi, 31
APPENDIX
Appendix 1. Correlation Matrix
Len
gth
Dis
tan
ce
InP
erso
n
Man
ufa
ct
Ser
vic
e
Med
ium
Lar
ge
Par
tner
Co
rp
Cre
dit
Ow
ner
M
Cu
rren
t
Nu
mS
Length 1
Distance -0.06 1
InPerson 0.08 -0.16 1
Manufact 0.00 0.04 -0.10 1
Service -0.06 -0.04 0.02 -0.29 1
Medium -0.02 -0.01 0.07 -0.04 -0.02 1
Large 0.05 0.06 -0.22 0.20 -0.20 -0.48 1
Partner -0.04 0.00 0.02 -0.05 0.00 0.00 0.03 1
Corp -0.04 0.04 -0.13 0.16 -0.13 0.07 0.31 -0.36 1
Credit 0.17 -0.01 -0.02 0.01 -0.08 0.01 0.12 0.01 0.10 1
OwnerManaged -0.04 -0.02 0.07 -0.07 0.04 0.02 -0.21 -0.04 -0.14 -0.04 1
CurrentEstab -0.13 -0.02 0.03 -0.07 0.11 -0.02 -0.19 0.01 -0.13 -0.05 0.11 1
NumSites 0.00 0.10 -0.03 -0.02 -0.01 -0.04 0.11 -0.01 0.06 -0.02 -0.01 -0.06 1
Computer -0.07 0.01 -0.13 0.09 0.05 0.05 0.20 -0.04 0.33 0.05 -0.11 -0.01 0.04
Checking 0.02 0.00 0.01 0.02 -0.05 0.05 0.05 -0.02 0.09 0.07 -0.03 -0.04 0.01
Saving 0.06 -0.03 -0.03 0.02 0.01 0.04 0.17 -0.01 0.15 0.12 -0.09 -0.09 0.05
LogFirmAge 0.45 0.01 -0.01 0.06 -0.06 -0.01 0.20 -0.07 0.09 0.27 -0.09 0.01 0.01
Leverage -0.02 0.00 -0.03 0.00 0.02 -0.01 -0.01 0.00 0.01 0.00 0.00 0.01 0.00
OwnerDelinq -0.07 0.01 0.01 0.01 0.07 0.02 -0.07 -0.02 -0.04 -0.18 0.04 0.07 -0.01
OwnerEduc -0.04 0.04 -0.13 0.00 0.21 -0.01 0.07 0.01 0.09 -0.01 -0.02 0.00 0.06
OwnerExper 0.40 0.01 0.01 0.04 -0.08 -0.03 0.24 -0.02 0.09 0.19 -0.19 -0.08 0.04
OwnerMinority -0.08 -0.01 -0.01 -0.03 0.06 -0.02 0.00 0.07 -0.04 -0.08 0.01 0.03 -0.01
OwnerFemale -0.05 -0.05 0.07 -0.08 0.09 -0.04 -0.16 0.01 -0.12 -0.06 0.02 0.07 -0.03
LogOwnerAge 0.33 0.00 0.02 0.02 -0.03 -0.08 0.18 -0.01 0.05 0.18 -0.20 -0.07 0.03
BankHolding 0.01 0.00 0.01 -0.04 0.07 0.01 -0.03 -0.04 0.01 -0.01 0.02 0.02 0.01
Co
mp
ute
r
Ch
eck
Sav
ing
Lo
gF
irm
Ag
e
Lev
erag
e
Ow
ner
Del
inq
Ow
ner
Ed
uc
Ow
ner
Ex
per
Ow
ner
Min
ori
ty
Ow
ner
Fem
ale
Lo
gO
wn
erA
ge
Ban
kH
old
ing
Computer 1
Check 0.00 1
Saving 0.13 0.01 1
LogFirmAge 0.00 0.06 0.12 1
Leverage 0.01 0.00 0.00 -0.03 1
OwnerDelinq 0.02 -0.08 -0.05 -0.09 0.00 1
OwnerEduc 0.21 0.02 0.04 0.01 0.01 0.00 1
OwnerExper 0.00 0.07 0.07 0.61 -0.02 -0.08 -0.02 1
OwnerMinority 0.00 -0.02 -0.06 -0.10 0.06 0.06 0.04 -0.09 1
OwnerFemale -0.08 -0.05 -0.03 -0.09 -0.01 0.03 -0.10 -0.21 0.03 1
LogOwnerAge -0.03 0.06 0.05 0.52 -0.01 -0.08 0.04 0.69 -0.09 -0.03 1
BankHolding 0.03 -0.02 0.05 0.01 0.00 0.00 0.05 0.00 0.01 0.04 0.02 1
Choi, 32
Appendix 2. OLS Regression Results (Dependent variable: length of relationship in months)
Independent variable (1) (2) (3)
Distance -0.0517*** -0.0522*** -0.0522***
(0.0164) (0.0163) (0.0163)
InPerson 15.87*** 16.24*** 16.38***
(4.825) (4.818) (4.818)
Manufact -7.148 -7.944 -7.929
(7.114) (7.078) (7.074)
Service -9.298** -14.65*** -14.34***
(4.145) (4.851) (4.829)
Medium -12.51*** -12.28*** -12.79***
(4.415) (4.418) (4.382)
Large -21.35*** -21.30*** -21.43***
(6.266) (6.258) (6.252)
Partner -18.85** -18.68** -18.48**
(8.008) (8.115) (8.137)
Corp -21.22*** -33.51*** -33.60***
(4.489) (8.442) (8.453)
Credit 3.775** 3.931** 4.000**
(1.593) (1.590) (1.585)
OwnerManaged 8.015 7.572 6.744
(6.905) (6.915) (6.881)
CurrentEstab -38.05*** -38.45*** -38.62***
(5.043) (5.058) (5.056)
NumSites -0.0562 -0.0500 -0.0501
(0.133) (0.134) (0.133)
Computer -7.944 -8.225 -8.540
(6.595) (6.626) (6.620)
Checking -8.399 -6.980 -6.450
(11.23) (11.26) (11.08)
Saving 6.737 6.955 6.852
(4.838) (4.833) (4.834)
LogFirmAge 56.02*** 55.69*** 56.42***
(3.714) (3.715) (3.651)
Leverage -0.00539 -0.00467 -0.00445
(0.00412) (0.00411) (0.00414)
OwnerDelinq -2.046 -8.113** -8.254**
(2.996) (3.921) (3.926)
OwnerEduc -0.510 -0.546 -0.407
(1.119) (1.117) (1.117)
OwnerExper 2.008*** 1.992*** 2.188***
(0.307) (0.307) (0.272)
OwnerMinority -0.0886 -0.0885 -0.0922
(0.0592) (0.0589) (0.0589)
OwnerFemale 0.0204 -0.0819 -0.0660
(0.0468) (0.0682) (0.0683)
LogOwnerAge 16.52 18.29
(11.75) (11.77)
BankHolding 4.862 4.978 5.178
(8.658) (8.672) (8.634)
OwnerFemaleService
0.217** 0.207**
(0.0903) (0.0902)
OwnerDelinqCorp
10.78* 10.84*
(5.757) (5.769)
Constant -75.36 -73.43 -7.499
(46.10) (45.64) (18.74)
Observations 3,231 3,231 3,231
R-squared 0.272 0.273 0.273
Robust standard errors in parentheses
*** p<0.01, ** p<0.05, * p<0.1
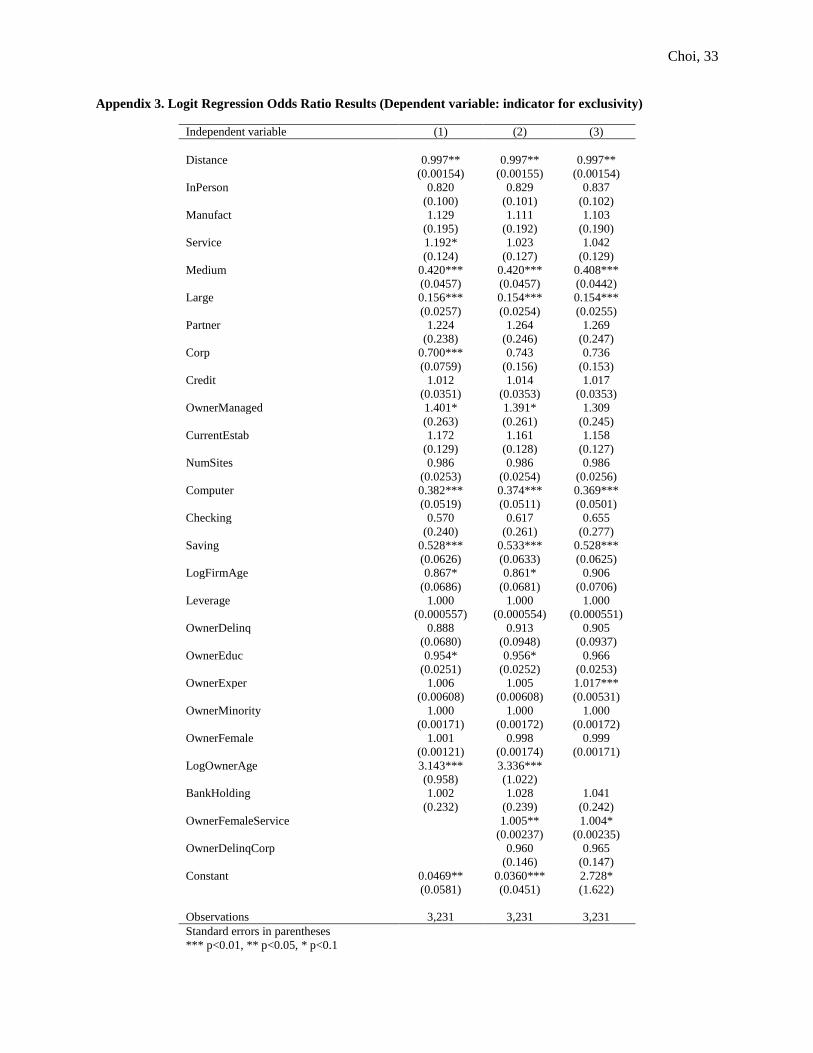
Choi, 33
Appendix 3. Logit Regression Odds Ratio Results (Dependent variable: indicator for exclusivity)
Independent variable (1) (2) (3)
Distance 0.997** 0.997** 0.997**
(0.00154) (0.00155) (0.00154)
InPerson 0.820 0.829 0.837
(0.100) (0.101) (0.102)
Manufact 1.129 1.111 1.103
(0.195) (0.192) (0.190)
Service 1.192* 1.023 1.042
(0.124) (0.127) (0.129)
Medium 0.420*** 0.420*** 0.408***
(0.0457) (0.0457) (0.0442)
Large 0.156*** 0.154*** 0.154***
(0.0257) (0.0254) (0.0255)
Partner 1.224 1.264 1.269
(0.238) (0.246) (0.247)
Corp 0.700*** 0.743 0.736
(0.0759) (0.156) (0.153)
Credit 1.012 1.014 1.017
(0.0351) (0.0353) (0.0353)
OwnerManaged 1.401* 1.391* 1.309
(0.263) (0.261) (0.245)
CurrentEstab 1.172 1.161 1.158
(0.129) (0.128) (0.127)
NumSites 0.986 0.986 0.986
(0.0253) (0.0254) (0.0256)
Computer 0.382*** 0.374*** 0.369***
(0.0519) (0.0511) (0.0501)
Checking 0.570 0.617 0.655
(0.240) (0.261) (0.277)
Saving 0.528*** 0.533*** 0.528***
(0.0626) (0.0633) (0.0625)
LogFirmAge 0.867* 0.861* 0.906
(0.0686) (0.0681) (0.0706)
Leverage 1.000 1.000 1.000
(0.000557) (0.000554) (0.000551)
OwnerDelinq 0.888 0.913 0.905
(0.0680) (0.0948) (0.0937)
OwnerEduc 0.954* 0.956* 0.966
(0.0251) (0.0252) (0.0253)
OwnerExper 1.006 1.005 1.017***
(0.00608) (0.00608) (0.00531)
OwnerMinority 1.000 1.000 1.000
(0.00171) (0.00172) (0.00172)
OwnerFemale 1.001 0.998 0.999
(0.00121) (0.00174) (0.00171)
LogOwnerAge 3.143*** 3.336***
(0.958) (1.022)
BankHolding 1.002 1.028 1.041
(0.232) (0.239) (0.242)
OwnerFemaleService
1.005** 1.004*
(0.00237) (0.00235)
OwnerDelinqCorp
0.960 0.965
(0.146) (0.147)
Constant 0.0469** 0.0360*** 2.728*
(0.0581) (0.0451) (1.622)
Observations 3,231 3,231 3,231
Standard errors in parentheses
*** p<0.01, ** p<0.05, * p<0.1
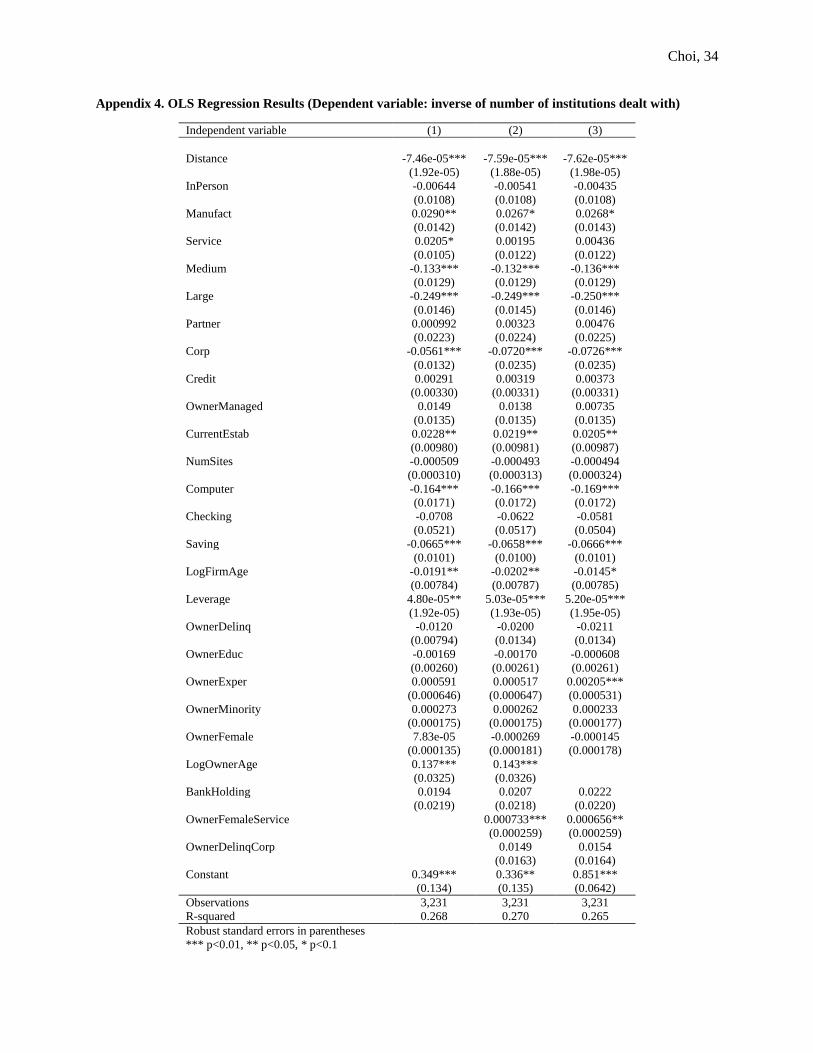
Choi, 34
Appendix 4. OLS Regression Results (Dependent variable: inverse of number of institutions dealt with)
Independent variable (1) (2) (3)
Distance -7.46e-05*** -7.59e-05*** -7.62e-05***
(1.92e-05) (1.88e-05) (1.98e-05)
InPerson -0.00644 -0.00541 -0.00435
(0.0108) (0.0108) (0.0108)
Manufact 0.0290** 0.0267* 0.0268*
(0.0142) (0.0142) (0.0143)
Service 0.0205* 0.00195 0.00436
(0.0105) (0.0122) (0.0122)
Medium -0.133*** -0.132*** -0.136***
(0.0129) (0.0129) (0.0129)
Large -0.249*** -0.249*** -0.250***
(0.0146) (0.0145) (0.0146)
Partner 0.000992 0.00323 0.00476
(0.0223) (0.0224) (0.0225)
Corp -0.0561*** -0.0720*** -0.0726***
(0.0132) (0.0235) (0.0235)
Credit 0.00291 0.00319 0.00373
(0.00330) (0.00331) (0.00331)
OwnerManaged 0.0149 0.0138 0.00735
(0.0135) (0.0135) (0.0135)
CurrentEstab 0.0228** 0.0219** 0.0205**
(0.00980) (0.00981) (0.00987)
NumSites -0.000509 -0.000493 -0.000494
(0.000310) (0.000313) (0.000324)
Computer -0.164*** -0.166*** -0.169***
(0.0171) (0.0172) (0.0172)
Checking -0.0708 -0.0622 -0.0581
(0.0521) (0.0517) (0.0504)
Saving -0.0665*** -0.0658*** -0.0666***
(0.0101) (0.0100) (0.0101)
LogFirmAge -0.0191** -0.0202** -0.0145*
(0.00784) (0.00787) (0.00785)
Leverage 4.80e-05** 5.03e-05*** 5.20e-05***
(1.92e-05) (1.93e-05) (1.95e-05)
OwnerDelinq -0.0120 -0.0200 -0.0211
(0.00794) (0.0134) (0.0134)
OwnerEduc -0.00169 -0.00170 -0.000608
(0.00260) (0.00261) (0.00261)
OwnerExper 0.000591 0.000517 0.00205***
(0.000646) (0.000647) (0.000531)
OwnerMinority 0.000273 0.000262 0.000233
(0.000175) (0.000175) (0.000177)
OwnerFemale 7.83e-05 -0.000269 -0.000145
(0.000135) (0.000181) (0.000178)
LogOwnerAge 0.137*** 0.143***
(0.0325) (0.0326)
BankHolding 0.0194 0.0207 0.0222
(0.0219) (0.0218) (0.0220)
OwnerFemaleService
0.000733*** 0.000656**
(0.000259) (0.000259)
OwnerDelinqCorp
0.0149 0.0154
(0.0163) (0.0164)
Constant 0.349*** 0.336** 0.851***
(0.134) (0.135) (0.0642)
Observations 3,231 3,231 3,231
R-squared 0.268 0.270 0.265
Robust standard errors in parentheses
*** p<0.01, ** p<0.05, * p<0.1

Choi, 35