Determinants of Adoption of Cleaner Production in ...
92
DETERMINANTS OF ADOPTION OF CLEANER PRODUCTION IN MANUFACTURING INDUSTRIES: A STUDY OF SELECTED INDUSTRIES IN NAIROBI BY NJOROGE IRENE WANJIKU C50/71744/2014 A PROJECT REPORT SUBMITTED TO THE DEPARTMENT OF GEOGRAPHY AND ENVIRONMENTAL STUDIES, FACULTY OF ARTS, UNIVERSITY OF NAIROBI IN PARTIAL FULFILMENT OF THE REQUIREMENTS FOR MASTER OF ARTS DEGREE, ENVIRONMENTAL PLANNING AND MANAGEMENT SEPTEMBER, 2017
Transcript of Determinants of Adoption of Cleaner Production in ...

DETERMINANTS OF ADOPTION OF CLEANER PRODUCTION IN
MANUFACTURING INDUSTRIES: A STUDY OF SELECTED INDUSTRIES IN
NAIROBI
BY
NJOROGE IRENE WANJIKU
C50/71744/2014
A PROJECT REPORT SUBMITTED TO THE DEPARTMENT OF
GEOGRAPHY AND ENVIRONMENTAL STUDIES, FACULTY OF ARTS,
UNIVERSITY OF NAIROBI IN PARTIAL FULFILMENT OF THE
REQUIREMENTS FOR MASTER OF ARTS DEGREE, ENVIRONMENTAL
PLANNING AND MANAGEMENT
SEPTEMBER, 2017

ii
DECLARATION
Declaration by Candidate
I certify that this project is my original work and has not been submitted for exam in any
other university.
Signed: ……………………… Date: ………………..
Njoroge, Irene Wanjiku
C50/71744/2014
Declaration by Supervisors
This project has been submitted for examination for the Degree of Master of Arts,
Environmental Planning and Management, of the University of Nairobi with our approval
as the Candidate’s supervisors.
Signed: …………………………. Date: ………………...
Prof. Evaristus M. Irandu
Signed: …………………………. Date: …………………
Dr. James M. Moronge

iii
ACKNOWLEDGEMENTS
I wish to acknowledge the support and input of all the people who contributed to the
success of my research project.
I sincerely thank my supervisors Prof. Evaristus Irandu and Dr. James Moronge for their
guidance and corrections during the entire period of the course. I would also like to
appreciate all lecturers in the geography department for their role in preparing me for this
study. I thank the staff of the industries involved in this study for allowing me to gather
information from them and taking their time to fill the questionnaires. I’m also grateful to
Ms. Janet Nyamusi of KNCPC for her help and support. Thanks to Mr. Mwangi and Mr.
Mwakavi of the Geography Department for their help and support. I also thank my
research assistant, Mutuma, for his hard work. To my fellow EPM students; Mercy,
Pauline, Grace, Margaret among others, thanks for the encouragement. I sincerely thank
my entire family for their support and encouragement; you inspired me throughout the
study. I thank the Almighty God for the gift of life and blessings throughout the entire
study period.

iv
DEDICATION
This research project is especially dedicated to my family; dear husband Charles and sons
Felix and Finley. Thank you for your patience, support and encouragement throughout
the entire study period.

v
TABLE OF CONTENTS
DECLARATION............................................................................................................... ii
ACKNOWLEDGEMENTS ............................................................................................ iii
DEDICATION.................................................................................................................. iv
LIST OF TABLES ........................................................................................................... ix
LIST OF FIGURES ...........................................................................................................x
ABBREVIATIONS AND ACRONYMS ........................................................................ xi
ABSTRACT .................................................................................................................... xiii
CHAPTER ONE: INTRODUCTION ..............................................................................1
1.1 Background of the Study ........................................................................................... 1
1.2 Statement of the Research Problem .......................................................................... 3
1.3 Research Questions ................................................................................................... 4
1.4 Research Objectives .................................................................................................. 4
1.5 Justification of the Study ........................................................................................... 5
1.7 Scope and Limits of the Study .................................................................................. 6
1.8 Operational Definitions ............................................................................................. 7
CHAPTER TWO: LITERATURE REVIEW .................................................................9
2.1 Introduction ............................................................................................................... 9
2.2 Concept of Cleaner Production ................................................................................. 9
2.3 Cleaner Production at Global, Africa and Local Levels ......................................... 10
2.3.1 Cleaner Production at Global Level ........................................................................ 10
2.3.2 Cleaner Production in Africa ................................................................................... 13
2.3.3 Cleaner Production in Kenya ................................................................................... 14
2.4 Cleaner Production Practices .................................................................................. 15
2.5 Determinants of Adoption of Cleaner Production................................................... 17

vi
2.6 Benefits of Cleaner Production ............................................................................... 20
2.7 Challenges in CP implementation ........................................................................... 21
2.8 Policy and Regulatory Framework Governing Manufacturing Industries .............. 23
2.8.1 Environmental Management and Coordination (Amendment) Act, 2015 ......... 24
2.8.2 Legal Notice 101 -EIA and EA Regulations .......................................................... 24
2.8.3 Noise Regulations ...................................................................................................... 25
2.8.4 Water Quality Regulations, 2006 ............................................................................ 25
2.8.5 Waste Management Regulations, 2006 .................................................................. 25
2.8.6 Controlled Substances ............................................................................................... 26
2.8.7 The EMCA (Conservation of Biological Diversity Resources, Access to
Genetic Resources and Benefit Sharing) Regulations, 2006 ......................................... 26
2.9 Theoretical Framework ........................................................................................... 27
2.9.1 The Three-Circles Model of Sustainability ............................................................ 27
2.9.2 The Cleaner Production Excellence Model............................................................ 28
2.9.3 The Triple Bottom Line Model ................................................................................ 30
2.10 Conceptual Framework ......................................................................................... 31
2.11 Research Gaps ....................................................................................................... 33
CHAPTER THREE: RESEARCH METHODOLOGY ..............................................34
3.1 Introduction ............................................................................................................. 34
3.2 Study Area ............................................................................................................... 34
3.2.1 Geographical location ............................................................................................... 34
3.2.2 Climate ........................................................................................................................ 34
3.2.3 Drainage ...................................................................................................................... 35
3.2.4 Population Dynamics ................................................................................................ 35
3.2.5 Industrial Land Use ................................................................................................... 35

vii
3.2.6 Major Environmental Issues .................................................................................... 36
3.3 Methodology ........................................................................................................... 38
3.3.1 Research Design ........................................................................................................ 38
3.3.2 Study Population ........................................................................................................ 38
3.3.3 Data Collection .......................................................................................................... 39
3.3.4 Data Analysis and Presentation ............................................................................... 40
3.3.5 Research Limitations ................................................................................................. 40
CHAPTER FOUR: RESULTS AND DISCUSSION ....................................................41
4.1 Introduction ............................................................................................................. 41
4.2 Response Rate ......................................................................................................... 41
4.3 General Characteristics of Surveyed Industries ...................................................... 41
4.3.1 Subsector the firm Belongs to and Products Manufactured ................................. 41
4.3.2 Main Raw Materials Used by the Industries versus Major Waste Products ...... 42
4.3.3 Year of CP Adoption ................................................................................................. 42
4.3.4 Source of Information on Cleaner Production ....................................................... 43
4.4 Cleaner Production Practices .................................................................................. 44
4.5 Determinants of CP Adoption ................................................................................. 45
4.6 Challenges Faced in Adoption and Implementation of Cleaner Production ........... 47
4.7 Impacts from Implementation of Cleaner Production in Manufacturing Industries 49
4.8 Compliance and Regulations ................................................................................... 53
CHAPTER FIVE: SUMMARY OF FINDINGS, CONCLUSIONS AND
RECOMMENDATIONS .................................................................................................56
5.1 Introduction ............................................................................................................. 56
5.2 Summary of Findings .............................................................................................. 56
5.3 Conclusions ............................................................................................................. 57

viii
5.4 Recommendations ................................................................................................... 58
5.4.1 Policy Makers ............................................................................................................ 58
5.4.2 Further Research ........................................................................................................ 59
REFERENCES .................................................................................................................60
APPENDICES ..................................................................................................................65
Appendix 1: Survey Questionnaire .................................................................................65
Appendix 2: Frequency Tables .......................................................................................74
Appendix 3: Plagiarism Report ..................................................................................... 76
Appendix 4: Declaration of Originality Form ............................................................... 77
Appendix 5: Research Permit ........................................................................................ 78

ix
LIST OF TABLES
Table 1: 5S principles of good housekeeping ....................................................................16
Table 2: Industries Making Up the Population ..................................................................38
Table 3: Year the Industries adopted CP ...........................................................................43

x
LIST OF FIGURES
Figure 1: The Three Circles model of sustainability .........................................................28
Figure 2: The Cleaner Production Excellence Model ........................................................29
Figure 3: Conceptual Framework ......................................................................................32
Figure 4: Map of Nairobi County and Sorrounding Region ..............................................37
Figure 5: Sub-sector the Firms Belong To .........................................................................42
Figure 6: Source of Information on CP..............................................................................43
Figure 7: Extent to which CP Practices Have Been Implemented.....................................45
Figure 8: Determinants of CP Adoption and Implementation ...........................................46
Figure 9: Challenges Faced in CP Adoption and Implementation ....................................48
Figure 10: Energy Conservation Measures Adopted by the Industries .............................49
Figure 11: Water Consumption Trends Since CP Adoption ..............................................50
Figure 12: Water Conservation Measures Adopted by the Industries ...............................51
Figure 13: Impacts from CP implementation in the Surveyed Industries ..........................53
Figure 14: Rating on Stringency of Environmental Regulations by Respondent Industries55

xi
ABBREVIATIONS AND ACRONYMS
CCII China Coal Information Institute
CP Cleaner Production
CTs Cleaner Technologies
EAs Environmental Audits
EABL East African Breweries Limited
EIAs Environmental Impact Assessments
EMCA Environmental Management and Coordination Act
EMS Environmental Management Systems
EOP End-of-Pipe
EST Environmentally Sound Technology
FHNW University of Applied Sciences North Western Switzerland
GDP Gross Domestic Product
GDRC Global Development Research Center
GIZ German Agency for International Cooperation
GoK Government of Kenya
IAPA Industrial Accident Prevention Association
IPCC Intergovernmental Panel on Climate change
ISO International Organization for Standardization
KAM Kenya Association of Manufacturers
KeBS Kenya Bureau of Standards
xii
KNCPC Kenya National Cleaner Production Center
KPLC Kenya Power and Lighting Company
NCPCs National Cleaner Production Centers
NEMA National Environment Management Authority
OECD Organisation for Economic Co-operation and Development
OHS Occupational Health and Safety
RECP Resource Efficient and Cleaner Production
RECPnet Resource Efficient and Cleaner Production Network
RSS Royal Scientific Society
SBA Sustainable Business Associates
SCP Sustainable Consumption and Production
SD Sustainable Development
SECO Swiss State Secretariat for Economic Affairs
TBL Triple Bottom Line
UN United Nations
UNEP United Nations Environment Program
UNIDO United Nations Industrial Development Organization
WCED World Commission on Environment and Development

xiii
ABSTRACT
Globally, industrial development has over the past few decades resulted into
environmental and social impacts like resource constraints, climate change, food
shortages and waste management in turn affecting the population’s life quality. As a
solution to these problems, there has been a growing concern towards environmental
protection. Industries are being encouraged to adopt resource efficient practices which
will also eliminate wastes; this is what cleaner production entails. The purpose of this
study was to assess the determinants of cleaner production in manufacturing industries in
Nairobi. The specific objectives were to: examine the cleaner production practices that
have been adopted by the industries; discuss the impacts of cleaner production
implementation in the industries; and evaluate the challenges to effective cleaner
production adoption and implementation in the industries. Primary data for the study was
collected using questionnaires while secondary data was obtained from published and
unpublished reports. The study found out that some cleaner production practices like
onsite recycling and products re-design had not been implemented in 20% of the
industries while changes in technology or raw materials had not been realised in 10% of
the industries. However, the industries had reaped a number of benefits from cleaner
production implementation. For instance, 70% had noted positive changes in water
consumption since adoption of cleaner production. The most significant determinants of
cleaner production adoption from the study included expected business profits and cost
savings while the least significant were pressure from customers, community and
business organizations. The industries were experiencing challenges that included
financial constraints and lack of a national cleaner production policy. Based on the results
of this study, the researcher came up with various recommendations. Policy makers need
to scale up their efforts to come up with a cleaner production policy. In addition,
government incentives to facilitate cleaner production adoption need to be availed to the
industries. For further research, studies are necessary on the impact of cleaner production
on emissions and waste reduction as well as improving occupational health and safety in
industries.

1
CHAPTER ONE
INTRODUCTION
1.1 Background of the Study
Recently, environmental issues have become a matter of concern for all sectors and
pressure has been mounting on all industrial sectors to improve their environmental
performance. Companies are becoming more informed and are taking up resource
efficient measures (UNEP, 2014). The World Commission on Environment and
Development (WCED, 1987), recommended industrial operations that are more efficient
in resource use, generate less wastes and pollution, and that minimize irreversible impacts
on human health and environment. The Commission’s report, Our Common Future,
became the drive of the concept of cleaner production (CP) in the 1980’s whose ultimate
goal is Sustainable Development (SD). Several current global trends are causing CP to
grow in relevance and importance as more and more companies become aware of low
inefficiency with which they use their material and energy resources. Inefficiency results
into higher production costs which affect competitiveness and profitability, reduction in
populations’ life quality and rapid environmental degradation in terms of resource
constraints, climate change, waste management and food shortages (Schaltegger et al.,
2008; Thatcher, 2014).
The National Cleaner Production Centers (NCPCs) program was established by the
United Nations Industrial Development Organization (UNIDO) and UNEP in 1994 and
by 2015 they had been established in 58 countries (UNIDO, 2015b). The program aims at
improving the resource productivity and environmental performance of businesses and
other organizations in developing and transition countries (KNCPC, 2014). The roles of
NCPCs are: technical and financial assistance, raising awareness in CP, training local
experts and building local capacity for CP, providing policy advice to national and local
governments, technology transfer and helping in preparation for project proposals for CP
investments (UNIDO-UNEP, 2010).
Policies and regulations have been found to play a critical role in implementation of CP.
UNEP has since 2011 partnered with the European Union (EU) to prioritize regional
approach on mainstreaming Sustainable Consumption and Production (SCP) and resource

2
efficiency to enable countries to make shift and decouple environmental degradation
from economic growth (UNEP, 2015). In Kenya, the government compliance and
enforcement regime that encourages Pollution Prevention is the Environmental
Management and Coordination (Amendment) Act (2015), an amendment of EMCA, 1999
which is the National Environmental Policy. The policy emphasizes the ‘Polluter Pays
Principle’ and the ‘Precautionary Principle’. Legal articles within the Act that are used
for CP implementation are Environmental Audits (EAs), Environmental Impact
Assessment (EIA), Environmental Quality, Environmental Monitoring and the various
licenses for waste handling (KNCPC, 2004).
According to KNCPC, enterprises are required to quantify and characterize their wastes
and understand their production processes and services, ultimately developing their
environmental policies. Kenya, however, lacks a national cleaner production policy.
Some policy statements on CP and environmental conservation addressed in the national
industrialization policy framework draft are: promotion of investment in local
manufacturing of CP equipment along with other emerging technology, mainstreaming
operation of KNCPC into the ministry responsible for industrialization and development
of a national CP policy (GoK, 2010). A public policy is needed in order to scale up
efforts to green the manufacturing sector in terms of eco-labeling, recycling and re-use,
production of eco-friendly materials and support of RECP processes (UNEP, 2014).
The activities of NCPCs have clearly proven the economic and environmental benefits of
applying CP in businesses and in some areas have facilitated the integration of CP in
national policy frameworks (UNIDO-UNEP, 2010). The potential for CP to benefit
businesses is well demonstrated, but it’s not yet as widely adopted as might be expected.
According to Schaltegger et al. (2008), this could be because of lack of adequate
information, the notion that CP is only relevant to manufacturing, institutional
frameworks which don’t encourage the adoption of CP and lack of a one-to-one
relationship between organizational change (such as CP adoption) and acting change.
Babilas et al. (2007) attributed successful application of CP in companies to
technological, training, institutional and government capacities. These capacities are
lacking especially in developing countries and efforts still need to be done to encourage

3
CP adoption. This study was necessary as it investigated into the most influential factors
that determine the adoption and implementation of CP in manufacturing industries in
Kenya, a topic that has not received much attention from many researchers. Another area
addressed by this study is the policy arena in that the study suggests the importance of the
country to adopt a cleaner production policy which is not yet there currently.
1.2 Statement of the Research Problem
Globally, economic development has been accompanied by a wide array of negative
environmental and social impacts like environmental degradation in terms of natural
resource constraints, climate change, waste management problems, food shortages and
reduction in population life’s quality. This is particularly worse in case of weak policy
regulation and (or) enforcement (UNEP, 2012a). In Kenya, industrial development is
identified as key driving force that puts pressure on environment (GoK, 2013); besides
contributing to economic growth and job opportunities, it contributes significant
environmental degradation and pollution due to factors such as type and age of
technology in use, shop-floor practices and other specific industrial characteristics. Ways
must therefore be found to achieve sustainable industrial development; one of them being
Cleaner Production.
Empirical evidence shows that very few studies on determinants on CP adoption have
been documented in Kenya as opposed to those that have been done elsewhere. Frondel
et al. (2009), Kesidou and Demirel (2010), Horbach et al. (2011), Belin et al. (2011),
Pereira and Xavier (2012) and Pablo (2013) all conducted studies on determinants of eco-
innovation in countries such as UK, France, Germany and other OECD countries which
are all developed countries and whose economic conditions cannot be compared with a
country like Kenya. These studies yielded factors such as regulation and policy, cost
savings and consumer preferences for environmentally friendly products as some of the
determinants. However, eco-innovation entails both cleaner production and end-of-pipe
approaches, two terms that the studies did not distinguish. Luken and Lompaey (2007)
assessed the adoption of Environmentally Sound Technology (EST) in developing
countries industries in a UNIDO study and noted that little is actually known about
factors that have motivated industries in developing countries to comply with

4
environmental standards and more particularly to adopt EST, especially under the
specific conditions faced in those countries. It is therefore essential for developing
countries to gain better understanding of determinants of improved industrial
environmental behavior and what can be done to strengthen those determinants. In his
study on hotels in Nairobi County, Ondieki (2013) had sought to determine the factors
influencing CP adoption and implementation but his study wasn’t conclusive on the main
determinants but only pointed out the less significant factors like previous proven
benefits, information sharing by industry players and community pressure.
In spite of the high level of environmental degradation and considering the importance of
clean methods of production in sustaining resources, there seems to be less documented
studies on determinants of adoption of CP in manufacturing industries. If the factors
influencing CP adoption are identified and addressed positively, then more enterprises
would take up the practice leading to resource conservation and ultimately enhancing
sustainable development. The purpose of this study is to assess the determinants of
adoption of cleaner production in manufacturing industries.
1.3 Research Questions
This study seeks to answer the following questions:
1. What type of cleaner production practices are adopted by the industries?
2. What are the impacts of CP in the industries?
3. What are the determinants for adoption of CP in manufacturing industries?
4. What challenges are faced in the effective CP implementation in the industries?
1.4 Research Objectives
The general objective of this study is to assess the determinants of adoption of cleaner
production in manufacturing industries in Nairobi. The study will address the following
specific objectives:
1. To examine the cleaner production practices that have been adopted by the
industries
2. To discuss the impacts of CP implementation on the selected industries

5
3. To evaluate the challenges to effective CP adoption and implementation in the
industries
1.5 Justification of the Study
Kenya has one of the largest manufacturing sectors in Sub-Saharan Africa; serving both
local market and exports to East and Central African region (GoK, 2012). However, the
contribution of the sector in GDP has stagnated at about 10% indicating that the rate of
industrial growth has been slow (UNEP, 2014). Moreover, the industrial sector has for a
long time been associated with pollution. According to IPCC (2014), the sector consumed
about 19% of total societal energy and 30% of total global Green House Gas emissions in
2010. Manufacturing is responsible for about 98% of the total direct CO2 emissions from
the industrial sector. However, manufacturing holds the key to unlock the decoupling
challenge by developing and delivering decoupled products and services, consumption
patterns and lifestyles and driving decoupling through supply chains up to extractive
industries. In addition, finding better ways to reduce energy consumption and waste
emissions in manufacturing processes is critical to reduce emissions, save energy and
other materials and also enhance sustainability (UNIDO, 2015b).
Over the past years, many manufacturing industries focused on end-of-pipe approaches,
that is, treatment of pollution at the end of the production process rather than a pollution
prevention approach (Dandira et al., 2012). As SBA (2007: 1) puts it, “CP is a mentality,
a philosophy which pursues ‘prevention’ rather than ‘remediation’ in order to achieve
sustainable growth.” Cleaner Production is an Industrial pollution prevention approach
which can help decouple economic growth from environmental pollution (UNIDO-
UNEP, 2010). It aims at a completely efficient production system where wastes would
either not be created or would be converted into products with a market value
(Schaltegger et al., 2008). This study focuses on manufacturing industries because they
are likely to contribute to higher pollution levels in form of end-of-pipe approaches
compared to other categories of industries. Moreover, the researcher studies industries
within Nairobi because this is the region with the highest concentration of manufacturing
industries countrywide.

6
However, adoption of cleaner production remains a challenge for many enterprises.
According to Dandira et al. (2012) there still remains great scope to improve the level of
awareness and implementation of the concept. The fact that only a few industries in
Kenya have incorporated the practice in their production processes shows that there are
underlying determinants and challenges which need to be understood and measures taken
by the appropriate institutions. This study aims at looking deeply into the application of
various CP approaches into the production process in order to uncover the challenges met
and more importantly the factors influencing CP adoption and implementation.
Historically, the usual (and apparently reasonable) assumption amongst many managers
has been that improving environmental performance represents only extra costs for a firm
whereas the alternative hypothesis is that wastes and pollution are signs of low efficiency
(Schaltegger et al., 2008). Thus, this study will offer good understanding to
manufacturers not to view cleaner production as just expenditure hence contributes to
more adoption of the concept with one of the outcomes being improved economic
performance of the manufacturing sector which is already declining. Also, similar
industries which have not yet implemented CP may learn the methodologies that they can
apply in their own industries. The study will also be of importance to the government in
terms of formulation of laws and policies which will favor adoption of and long-term
commitment to CP. Findings from the study will also be significant to the government
and other stakeholders who will lay down necessary procedures in order to create a
suitable environment for CP adoption by removing obstacles. Also, the study will also
reach out to international funding agencies whose aid is necessary in supporting CP
strategies implementation that is faced by severe financial constraints.
1.7 Scope and Limits of the Study
This study was conducted on industries within Nairobi except for two industries which
were in Thika. All the manufacturing industries studied had worked with the Kenya
National Cleaner Production Center (KNCPC) and had therefore incorporated some
aspects of cleaner production in their production processes. The researcher sought to
examine the extent to which each cleaner production practice was implemented. Impacts
of CP implementation in the industries were also studied and aspects such as reduction of
emission; energy and water conservation; training costs; increased profitability; and
7
increased costs of purchasing environmentally friendly materials were determined from
the respondents’ point of view but not from actual records from the industries. The
researcher also sought to assess whether cost savings through water and energy
conservation had influenced the industries to adopt cleaner production but actual figures
of consumption were not put into account.
1.8 Operational Definitions
Clean technology: This refers to the installation or a part of installation that has been
adapted in order to generate less or no pollution whereby the environmental equipment is
integrated into the production process. This reduces resource consumption, wastes and
hazards of the emissions generated and also risks of accidents or malfunction (OECD,
2014).
Cleaner production: It is the continuous application of an integrated preventive
environmental strategy to processes, products and services to increase eco-efficiency and
reduce risks for humans and the environment (UNEP, 2012).
Corporate Social Responsibility: This is the management concept whereby companies
integrate social and environmental concerns in their business operations and interactions
with their stakeholders (UNIDO, 2015a).
Eco-efficiency: This refers to the improvement in relationship between economic
performance and environmental impacts; it’s not about bridging a perceived gap between
increasing competitive industrial production, but rather about increasing competitiveness
through improved environmental performance (Schaltegger et al., 2008).
Eco-innovation: This refers to any form of innovation aiming at significant and
demonstrable progress towards the goal of Sustainable Development; achieved by either
reducing environmental impact or achieving a more efficient and responsible use of
resources (European Commission, 2015).
Eco-labeling: This refers to affixing labels to products that pass eco-friendly criteria laid
down by governments, associations or standards certification bodies based on extensive
research on product’s life cycle impact (GDRC, 2015).

8
Environmental footprint: This is the area of productive land and aquatic ecosystems
required to produce resources and assimilate waste at a specific material standard of
living, wherever that land may be located (UNEP, 2014).
Environmental Management Systems(EMS): It is an aspect of an organization’s overall
management structure that addresses immediate and long-term impacts of its products,
services and processes on the environment (UNIDO/UNEP, 2004).
Green Manufacturing: These are production processes which use inputs with relatively
low environmental impacts, which are highly efficient, and which generate little or no
waste or pollution (Ninlawan et al., 2010).
Good housekeeping: This is a way of controlling hazards along the path between the
source and the worker; removing all unnecessary items in the workplace and keeping all
necessary items in their proper places (IAPA, 2007).
Occupational Health and Safety: In the context of CP, it’s a case that aims at protecting
the health and safety of workers and requires emissions reduction at source; in a more
indirect way, efforts to make the working environment safer for workers result in better
productivity (UNEP/UNIDO, 2004)
Product Redesign: This means changing the form of the consumer goods whereby the
outcomes could be: reduction in toxicity of the materials in a product, packaging
requirements or energy and water use; increased recyclability of the used components; or
extension of the lifespan of manufactured goods (UNEP, 2012).
Source Reduction: This means reducing generation of wastes and contaminants at source,
thereby reducing releases that could pose hazards to environment and public health
(UNIDO/UNEP, 2004).
Sustainable Development: This refers to development that meets the needs of the present
without compromising the ability of future generations to meet their own needs (WCED,
1987).
Triple Bottom Line: This refers to the methodology for measuring and reporting on
financial, environmental and social performance (UNEP/UNIDO, 2004).

9
CHAPTER TWO
LITERATURE REVIEW
2.1 Introduction
This chapter is an analysis of previous research work relevant to the study. The themes of
the literature are organized as follows: Concept of Cleaner Production, cleaner production
practice, CP practices, determinants of adoption of CP, benefits of CP, challenges in CP
implementation and policy and regulatory framework governing manufacturing
industries. The theoretical framework related to CP based on which the researcher derives
the conceptual framework is also discussed. The chapter also provides gaps in the
literature that the current study intended to fill.
2.2 Concept of Cleaner Production
According to UNEP (2012), application of cleaner production in processes entails
conserving raw materials and energy, eliminating toxic raw materials and reducing the
quantity and toxicity of all emissions and wastes before they leave the production
process. Application in products entails reducing negative environmental impacts along
the life cycle of a product from cradle-to-grave by the use of an appropriate design; while
application in services entails incorporating environmental concerns into designing and
delivering of services.
Schaltegger et al. (2008), outlined the main objectives of CP as to minimise the use as
well as optimize re-use and recycling of hazardous and non-hazardous materials; to use
materials in the manufacturing process in a more efficient way reducing the amount of
inputs needed and the amount of non-desired outputs; to minimize risks and improve
human capital through workers’ hygiene and safety programs; and to improve monetary
returns by minimizing energy consumption and reducing material and handling costs. The
last objective may often require capital investment.
There are some competing concepts to cleaner production. They include: cleaner
technologies, eco-efficiency, waste prevention, pollution prevention (P2), waste
minimization and green productivity but CP is a comprehensive approach that
encompasses all these (SBA et al., 2007). CP and sustainable technologies won’t be
10
efficient without environmental management systems (EMS) (Babilas et al., 2007).
Conversely, CP may be used as a tool within EMS. Apart from EMS, implementation of
cleaner production requires readiness to change established attitudes, implementation of
technological change, collection and use of necessary information as well as a supportive
institutional context (Schaltegger et al., 2008).
CP is often misunderstood as being equivalent to cleaner or environmentally sound
technology (EST). However, technology is just one element of CP. CP addresses human
factors such as attitudinal change, methods, monitoring and management that ensure that
technology is actually used in a manner that is environmentally sound while many
definitions of EST include EOP technology which has no part in the meaning of CP
(UNIDO/UNEP, 2004).
2.3 Cleaner Production at Global, Africa and Local Levels
2.3.1 Cleaner Production at Global Level
At the Earth Summit in Rio de Janeiro in 1992, CP became internationally recognized
and was incorporated in Agenda 21 to help meet the goal of environmental protection and
economic development. Since then, CP has been one of the main activity areas of
UNEP’s Division of Technology, Industry and Economics (DTIE). The Rio +20
Conference set out a basis for governments and industry to adopt green manufacturing
with world leaders promoting sustainable patterns of consumption and production as one
of the overarching objectives of SD (UNEP, 2013b).
Among the first countries to initiate NCPCs were China, Croatia, Czech Republic,
Hungary, India, Mexico, Nicaragua, Slovakia, Tanzania, Tunisia and Zimbabwe. This is
between 1995 and 1997. By mid-1990’s, CP initiatives in developing and transition
countries like China, India, Poland and Czechoslovakia had demonstrated that CP is
equally applicable and beneficial as it had been in industrialized countries. Mexico
undertook a demonstration project involving 7 foundries and identified 103 CP
opportunities which resulted in savings in energy and material use (UNIDO, 2015b).
Between 1998 and 2002, NCPCs were initiated in other countries such as Colombia,
Costa Rica, Cuba, Ethiopia, Honduras, Kenya, Lebanon, Morocco, Mozambique, Peru,
Republic of South Korea, Russian Federation, South Africa, Sri Lanka, Uganda and

11
Vietnam. During this period, there was transfer of Environmentally Sound Technology
(EST) whereby experiences and lessons learnt from the first batch of NCPCs were
transferred to new CPCs through study tours and engagement of lead experts as trainers
and consultants in new countries. For example, Indian CPC provided extensive technical
and related support in Asia-Pacific region while Czech and Slovak Centers supported
expansion in Eastern Europe. The NCPC of Vietnam was the first among NCPCs to
establish environmental and quality management systems which were certified on
respectively ISO 14001 and ISO 9001 in 2002. This was as a result of the effort of
UNIDO to combine CP assessments with Environmental Management Systems (EMS),
Environmental Management Accounting (EMA) and EST assessment (UNIDO, 2015b).
Several current global trends are causing CP to grow in relevance and importance as
more and more companies become aware of low inefficiency with which they use their
material and energy resources (UNIDO/UNEP, 2004).CP received a market-orientation
attitude between the years 2003 and 2007. This was a move to push for market-oriented
service delivery on the side of NCPCs so that they can attain organizational independence
and financial security. New NCPCs were opened up in Armenia, Bulgaria, Bolivia,
Cambodia, and Egypt among other countries. European and Asian Roundtables enlarged
the scope of CP to sustainable consumption and production (SCP). Between 2003 and
2006, UNEP implemented a GHGs emission reduction project from Asia and Pacific
industries which included Bangladesh, China, India, Indonesia, Mongolia, Philippines,
Sri Lanka, Thailand and Vietnam which demonstrated energy savings and GHG emission
reduction through cleaner production and resource efficient methods and techniques
(UNIDO, 2015b). These industries were in cement; chemicals; ceramics; iron and steel;
and pulp and paper sectors.
Some countries undertook policy reforms and even established national CP policies
(UNIDO/UNEP, 2004). The first generation of CP policy inputs were provided between
the years 1998 and 2002 in China, Czech Republic, Guatemala and Nicaragua (UNIDO,
2015b). For example, Chinese government established the Cleaner Production Promotion
Law which came into effect in 2003 and saw unprecedented comprehensive CP policy
system starting to form. This was the first national law in the world to establish CP as a

12
national policy (Peng et al., 2005). Some of the issues addressed by the policy include
provision of economic incentives, establishing a CP fund, implementation of a time-limit
to phase off obsolete technologies and integration of CP into the education system.
Currently, China’s environmental protection agency is converting from end-of-pipe
pollution treatment to source control. The law provides environmental authorities with a
mandate to instruct highly polluting enterprises to conduct CP audit and implement
resulting opportunities. By the end of 2006, environmental authorities had mandated CP
audits in 2710 enterprises and noted cumulative benefits which included water savings,
electricity savings, reduction of wastes and waste water (UNIDO, 2015b).
Between the years 2008 and 2011, CP expanded to resource efficient and cleaner
production (RECP). New NCPCs were opened up in Rwanda, Senegal, Albania, Cape
Verde, Montenegro, Romania and the Republic of Moldova. Global evaluation of
programs in 2008 confirmed that the NCPC program had resulted in substantial benefits
at country and global levels but it had it had not yet achieved its full potential. This was
attributed to lack of systematic follow-up to assessment findings and monitoring of actual
benefits achieved by NCPC-assisted enterprises. The first RECP networking conference
was held in Switzerland in 2009 where participating NCPCs agreed to establish global
RECP network (RECPnet). This was formally established in 2010 and the first assembly
of 41 founding members held in Nairobi in October 2011 where members adopted the
Nairobi declaration.
In the Asia and Pacific region, the green growth initiative has been widely adopted as a
way to reconcile tensions between poverty reduction and environmental sustainability.
The European Commission-funded SWITCH Asia programme promotes sustainable
consumption and production (SCP) among SMEs through green public procurement,
cleaner production and eco-labeling and supports Asian policy makers in shifting towards
SCP practices (UNEP, 2012b). SCP has its scope enlarged from CP. The period between
2012 and 2015 saw countries such as Ecuador, Ghana, Indonesia, and Mauritius among
others initiating their CPCs. During this period, RECPnet grew from 41 to 71 members
representing 56 developing and transition countries in 2015. In addition, UNEP started to
champion the eco-innovation concept. Established NCPCs continue to diversify their

13
services to hospitality and health sectors; water supply and waste water treatment,
agriculture; crafts; aquaculture and fisheries (UNIDO, 2015b). By the end of 2015, a total
of 29 countries and 9 cities had adopted or started implementation of SCP and green
economy policies (UNEP, 2016).
2.3.2 Cleaner Production in Africa
Zimbabwe, Tunisia and Tanzania were the first African countries to set up NCPC’s. This
was between 1994 and 1997. In Zimbabwe, the NCPC was initiated from late 1994 by the
Environmental forum of Zimbabwe (EFZ). By 1998, 19 CP assessments had been
completed characterized by demonstrations in both SMEs and large-scale operations. The
assessments showed that the appreciation for CP was high for low- and no-cost options
but there were no investments in high-cost CP options due to challenges like lack of
technology, management commitment and access to/high cost of capital (UNIDO,
2015b). Ethiopia, Kenya, South Africa and Uganda initiated their NCPCs between the
years 1998 and 2002. Egypt, Senegal, Rwanda, Ghana and Mauritius established their
CPCs much later. NCPCs have been very active in Africa and they even supported the
establishment of the African Roundtable on Sustainable Consumption and Production
(SCP) in 2002 (UNEP, 2012b).
In November 2008, NCPC South Africa celebrated 6 years of achievement and
conclusion of the period of direct donor support from Austria and Switzerland
governments. Between the years 2003 and 2010, the CPC had implemented CP
assessments and training to over 150 companies in chemicals; agro-processing;
automotive and transport equipment; metals and allied processes; pulp and paper;
clothing and textile; leather and footwear, tourism and hospitality; and commercial
buildings sectors (UNIDO/UNEP, 2016b).Its CP strategy objectives were in 5 clusters
namely: information and awareness; capacity building; technology development and
cooperation; financial support; and policy and regulation. The centre involves itself in a
variety of RECP services including energy efficiency, industrial symbiosis and waste
recycling, Life Cycle Assessment (LCA), eco-labeling and environmental accounting.

14
UNIDO implemented transfer of environmentally sound technology projects between
2009 and 2012 in Egypt, Morocco and Tunisia whereby 43 enterprises received
assistance through CP assessment, EMS implementation and EMA. As a result,
companies involved achieved massive annual resource savings (UNIDO, 2015b).
The SWITCH-Africa Green is an EU-funded program launched in 2014 to assist six
African countries to mainstream SCP policies into national governance. The countries
are: Burkina Faso, Ghana, Kenya, Mauritius, South Africa and Uganda. The regional 10-
year Framework of Programmes on Sustainable Consumption and Production (SCP) has
spurred development and the implementation of a number of sub-regional, national and
local SCP programmes. For example, pilot projects for mainstreaming SCP in national
and city level development policies and action plans have been conducted in Tanzania
and Cairo in Egypt (UNEP, 2012b).
2.3.3 Cleaner Production in Kenya
Kenya has been implementing sustainable development and eco-friendly technology like
other countries in the world (NEMA, 2012). The Kenya National Cleaner Production
Center (KNCPC) was founded by the Government of Kenya through the Kenya Industrial
Research and Development Institute (KIRDI) and UNIDO in July 2000 under the country
cooperation framework of 1999-2003 between the Kenyan government and UNDP. It
assists the Kenyan industries to ‘produce more with fewer resources and less pollution’
(KNCPC, 2014).
A part of the Industry sector in Kenya has embraced CP technology through technical
assistance by KNCPC in order to enhance efficiency in the use of natural resources and
energy with the aim of reducing waste generation at source (NEMA, 2012). CP is seen as
an important tool in promoting green economy in Kenya because it promotes activities
that reduce carbon emissions, enhance efficient use of resources and improves industrial
production while at the same time creating green jobs and alleviating poverty. KNCPC
has been implementing programmes to promote Cleaner Production in industries since
2001.

15
An example of a KNCPC program that is ongoing is the Lake Victoria Environmental
Management Programme (LVEMP II) which is designed to address pollution and
inefficient resource utilisation through supporting the use of cleaner technologies by
industries located in the Lake Victoria Basin. This is after NCPCs mapped industrial
pollution sources in Kenya, Tanzania and Uganda and narrowed down to 88 polluting
enterprises responsible for pollutant discharges into the basin. KNCPC is the regional
coordinator of the program, which started in August 2010, and mainly works on sub-
component 2.2 that is meant to address industrial pollution challenges and unsustainable
resource consumption patterns within the lake basin through CP technologies. KNCPC
works together with Uganda Cleaner Production Center, Tanzania Cleaner Production
Center, Rwanda RECP Center and the Department of Industry of Burundi. The program
involves 40 companies on the Kenyan side and has proved to be effective as the
companies have managed to recycle their waste water reduce resource consumption-
mainly raw materials, water and energy-by up to 50% (KNCPC, 2014). For example,
Kitumbe tea factory implemented rainwater harvesting, solar drying and LED lighting
and as a result achieved 60% reduction in water use and 20% reduction in energy
consumption (UNIDO, 2015). In Nairobi, at least 20 companies have launched a program
to curb pollution in Nairobi river basin. According to KNCPC (2014), the firms are
working together with NEMA in collaboration with KNCPC with a hope that the
companies will adopt CP strategies and hence reduce pollution in the river.
2.4 Cleaner Production Practices
According to UNEP (2014), greening the manufacturing sector would require approaches
from two sides: supply side and demand side. Supply-side approaches include re-design
of products and processes, substituting green inputs for conventional inputs, recycling
and re-use of internal production processes, use of cleaner technologies and production
processes with greater energy and water efficiency. Approaches on the demand side
include production of manufactured goods to meet changing demand consumption, eco-
labeling of manufactured products and mandatory energy-efficiency audits for large
manufacturers. Another practice adopted is good housekeeping; a typically low cost
option that provides low to moderate benefits (UNIDO/UNEP, 2004). 5S principles are
used in the practice of good housekeeping. These principles are; Sort which involves

16
removal and disposal of unnecessary things; Systemize which is about arranging
necessary items in good order for use; Sweep meaning cleaning the workplace
completely; Sanitize/Standardize and Self-discipline which involves going to work early
to check machines condition’ and cleaning work area before and after work. 5S is among
the first and fundamental steps implemented by an enterprise towards the path of
implementing total quality management and continuous improvement at the operation
level (ITC, 2012). Good housekeeping is meant to keep the workplace organized, clean,
and with effective and standard conditions. The use of this tool was started in 1972 by
Henry Ford in the United States but popularized as Japanese 5S in 1980 by Hiroyuki
Hirano.
Table 1: 5S principles of good housekeeping
Source: ITC, 2012
Various studies have recommended CP practices in manufacturing/processing activities.
Bach and Gheewala (2010), did a study at a coal preparation facility in Vietnam where
they noted various problems like old technology, management of environmental issues,
coal slurry (4.5 m ton/year), high amounts of solid waste (6 m ton per year) and fresh
water consumption. They suggested CP options to address issues of run of mine coal

17
treatment, storm water, dust treatment and improving quality of fine coal product. CP
techniques suggested were: improving process control, recycling, process modification,
input substitution, redesigning technology and product modification but noted that not all
techniques are applicable in every case. Mwithalii (2009) studied the role of cleaner
production in enhancing water use efficiency of two manufacturing firms in Kasarani,
Nairobi: Central Glass Industries and East African Breweries Ltd. He observed that
annual water use declined in Central Glass Industries between 2004-2007 and noted
practices such as re-using water at the cullet and sand plants and the use of closed system
cooling as contributing factors. In EABL, he noted the re-use of hot condensed steam as
one of the practices behind reduction in energy needs in the brewing process by 30%. In
both industries, there was re-using and recycling thus saving the use of fresh natural
resources.
2.5 Determinants of Adoption of Cleaner Production
Various empirical studies have come up with various determinants of adoption of CP in
manufacturing industries. These determinants include: environmental regulation, cost
savings, availability of technological resources, competition conditions, organizational
innovations/internal innovation capabilities, consumer demand, international donors,
availability of financial support from governments, voluntary codes/self-commitment,
industrial agreements, involvement and cooperation in external knowledge flows and
expected increase in market share/penetration of new market segments (Luken &
Rompaey, 2008; Frondel et al., 2009; Kesidou & Demirel, 2010; Belin et al., 2011;
Horbach et al., 2011; Murovec et al., 2012; Pablo, 2013; Ondieki, 2013). Of all these
studies, only the one by Ondieki was conducted in Kenya and it was directed to the
service sector; that is hotels in Nairobi County. Majority of the other studies were
conducted in developed countries whose environmental and economic conditions are very
different from those of developing countries.
Luken and Rompaey (2008) surveyed 105 plants in nine developing countries and across
four manufacturing sub-sectors on factors affecting adoption of environmentally sound
technologies (ESTs) as perceived by plant managers and key informants. They noted that
environmental regulation and market pressure appear to exert more influence than

18
community pressure on EST adoption. However, ESTs are different from CP in that EST
may include EOP approaches. Frondel et al. (2009) noted a positive correlation of
environmental stringency with introduction of EOP technology but not with CP. They did
an empirical comparison of environmental innovation decisions across OECD countries
and noted that CP measures have been less subject to environmental regulations and
hence tend to be stimulated by other factors.
In addition, Blackman & Arne (2010), studied Mexican leather tanning industry and
noted that neither firm size nor regulatory pressure is positively correlated with adoption
of clean technology. They concluded that the main driver is the firm’s human capital. In
Kenya, Mputhia et al. (2012) studied Micro and Small Enterprises (MSEs) in the
manufacturing Sector in Nairobi but only considered awareness as a determinant of
compliance with environmental regulations. The study established that awareness of
environmental regulations influenced compliance and therefore recommended NEMA
and other stakeholders to increase outreach to MSEs to make them aware of the benefits
of environmental regulations compliance. They however noted awareness of EMCA and
EIA/EA to be 79.4% and 88.2% respectively.
Horbach et al. (2011) studied the role of regulatory push/pull, technology push and
market pull as determinants of eco-innovations by type of environmental impact. Using a
dataset collected in the context of community innovation surveys of the European
Commission in 2009, the researchers pointed out EMS as an important tool to trigger cost
saving cleaner technologies because they help to overcome incomplete information
within a firm. From the literature that they reviewed, they noted that environmental
innovations are more or less regulation driven while many studies showed a positive role
of cost savings as a motivation for CP technologies. The study grouped the factors that
have been found as main determinants of eco-innovations into four: firm strategies,
technology, market and regulation. Regulation pressure and corporate image were seen as
the main drivers adopting CT in Spanish pulp and paper industry while data from US,
Japan and Germany showed that innovation decisions of companies were mainly
regulation driven. Customer pressure was not seen as a strong stimulus for environmental
innovation as eco-friendly products are seen as still too expensive while supply factors

19
such as proximity to best infrastructure, improvement of technological capabilities, EMS,
knowledge transfer mechanisms, senior management commitment, teamwork,
empowerment of employees at all levels and environmental accounting were all found
important as they enable a firm become aware of inefficiencies that weren’t recognized
previously.
Kesidou and Demirel (2010), did a study based on a dataset of 1566 UK firms that
responded to government survey of environmental protection expenditure by industry in
2006 and noted that demand factors like customer and societal requirements on CSR
affect the decision of the firm to undertake environmental innovations while they exhibit
no impact upon the level of investments. They suggested that firms should initiate eco-
innovations in order to satisfy minimum customer and societal requirements and yet
increase investments in eco-innovations as stimulated by other factors such as cost
savings, firm’s organizational capabilities and stricter regulations.
On cost savings, a business is more likely to take on environmental management
practices if they can see the benefits in the form of reduced costs and/or higher revenues
and profits (Ondieki, 2013). In his study on hotels in Nairobi County, Ondieki was
interested in determining the factors that influence adoption and implementation of CP.
He however noted that previous proven benefits that accrue from CP implementation
such as reduced expenditure on energy and water have less effect on encouraging CP
adoption and attributed this to the possible fact that not many of the surveyed hotels have
developed effective mechanisms for tracking the use of resources and the associated
costs. However, his study was not conclusive in terms of the particular drivers to CP
implementation in those hotels but went on to conclude how these other factors were less
significant; improved employee morale, improved community relations and community
pressure, good information sharing by industry players and support given by other
stakeholders including local and international NGO’s.

20
2.6 Benefits of Cleaner Production
Pollution can be considered as an indicator of inefficiency which is always characterized
by resource wastage, poor working conditions, economic losses, environmental pollution,
among other negative effects (Schaltegger et al., 2008). In order to decouple growth from
its environmental impact, manufacturing industries need to apply life cycle thinking;
through adopting closed-cycle manufacturing process, extending the lifespan of
manufactured goods, improving resource recovery and applying along product value
chains (UNEP, 2012). CP is a sign of more efficient production; which in turn is more
innovative and competitive, and in principle more economically superior (Schaltegger et
al., 2008). By implementing sustainability measures like CP, the manufacturing sector
can boost economic and environmental performance through reduction of emissions,
integration of by-products into the production value chain, substantial returns of
investment and positive implications for jobs through opportunities in secondary
production (UNEP, 2012). Implementation of CP strategies aim at increasing
competitiveness and efficiency of firms as they assist in energy saving, water
conservation, pollution control, safety of machines and workers and also enhances the
image of the firm in both national and international arenas (GoK, 2010).
According to OECD (2012), Copenhagen is a leader among greening cities owing to its
Clean-tech cluster. Companies in the region had a combined turnover of €30 billion in
2011 and at least 12 billion of this is directly related to clean-tech activities. The main
sectors involved are energy efficiency, water and waste-water treatment as well as
recycling. In Tunisia, a Lead Acid battery manufacturer saved over US$ 2.2m in two
years from US$ 400000 investments through implementation of 19 pollution prevention
options; the cost of treating chemicals reduced by 66% and that associated with future
pollution prevention technology reduced by 33%, employees health was improved,
energy and water consumption was reduced, less lead was required in the process and
wastewater quality was improved (GDRC, 2015).
M’ribu (2006) studied waste management approaches in small-holder tea processing
factories in Kenya and observed that although factories largely managed their wastes
sustainably, there was no comprehensive and uniform approach to waste management.

21
He therefore recommended CP strategy adoption in waste management with a view to
having tea processing procedures that are environmentally friendly. Ondieki (2013)
assessed the adoption and level of implementation of CP by star-rated hotels in Nairobi
County. He studied efforts to deal with energy conservation, solid waste management and
OHS measures and noted that some of the leading benefits of CP to the hotel industry are:
enhanced compliance to environmental safety, enhanced safety and health for staff,
reduced operating, waste collection and disposal, energy, water and food preparation
costs. Environmental programs have also proved to be an effective means of generating
enthusiasm and motivating staff to work as a team. Ondieki noted that incorporation of
CP practices leads to greater employee involvement in, and commitment to, the
production process which often leads to higher quality products. UNEP established CP in
order to promote changes that will help achieve sustainable development. Cleaner
production in enterprises results in sustainable development by addressing three
sustainability dimensions: Production efficiency through improved use of natural
resources; Environmental Management through minimization of impacts on nature; and
Human Development through reduction of risks to people and communities
(UNIDO/UNEP, 2010)
2.7 Challenges in CP implementation
The challenges in CP implementation can be grouped into two broad categories: Internal
and External challenges.
Internal Challenges: These are problems that emanate within the enterprise.
Some enterprises generally lack the knowledge about sources of pollution and waste
flows that might be susceptible to CP solutions or generally about the economic and
environmental potential of CP (Peng et al., 2005; Schaltegger et al., 2008). This means
low awareness levels on environmental issues (UNEP, 2014). According to the China
Coal Information Institute, CCII, (2014), some enterprises in the country just have
insufficient understanding of the importance of cleaner production on sustainable
development. There still remains great scope to improve the level of awareness,
understanding and implementation of the concept in manufacturing industries (Dandira et
al., 2012).

22
Financial Constraints: Many enterprises have a difficulty in accessing cleaner technology
due to lack of investment and financing (CCII, 2014; UNEP, 2014). An enterprise may
not afford the cost of new technology. In many cases, EST requires high initial capital
costs as compared to conventional technology and is also characterized by a high
gestation period; this makes enterprises reluctant to invest in CP (Peng et al., 2005).
Green Credit Line (GCL) was first launched in 2003 in Colombia and later in Peru and
Vietnam and it assists enterprises to finance profitable CP investments. Between 20003
and 2005, loans worth USD 12.4 million were made through GCL in Colombia. One of
the beneficiaries was Aceros Industrialis; a steel wire company which invested USD
640000 to replace chemical with mechanical surface treatment thereby eliminating
wastewater. As a result, the company avoided about 400 ton GHGs and realized annual
benefits of up to USD 500000.
Lack of technical support: According to UNEP (2014), one of the challenges to CP
among various sectors in Kenya is limited technical and professional management skills.
Many enterprises have limited in-plant expertise/capability and lack access to external
technical support.
Competing business Priorities: Some enterprises experience pressure for short-term
profits hence fail to invest into practices that will cost them money without bringing
returns immediately. They give higher priorities to production expansion/market share
(Peng et al., 2005). Most companies concentrate on running the industries without
considering maintenance of equipment, which when poorly maintained, result in
environmental pollution (Dandira et al., 2012).
Lack of in-house monitoring and deficiency in maintenance: Some industries lack
effective evaluation measures to quantify the financial performance of CP projects (Peng
et al., 2005). Others have inadequate industrial self-regulation; government initiatives fail
to create self-regulation at factory level. Ondieki (2013) studied CP implementation
challenges in the hotel industries in Nairobi and noted poor record keeping and weak
accounting systems as some of the challenges facing the sector. Many of them lacked
effective mechanisms for tracking the use of resources and the associated costs.

23
External Challenges: these are forces that affect CP adoption and implementation from
outside the enterprise.
Failure of existing national policy and regulatory approaches: Many countries lack the
necessary supporting policies and (or) their enforcement especially preferential policies
that encourage enterprises to develop CP (CCII, 2014). A study done by Peng et al.
(2005) on barriers for promotion of clean technology (CT) in Small and Medium-sized
Enterprises (SMEs) of China revealed lax enforcement of environmental regulations;
whereby weak enforcement of regulations doesn’t make CP adoption an urgent task.
They also noted absence of incentives on economic policies, for example, tax exemption
and grant for installation of CT in SMEs. They recommended that the current
governmental policy should give higher priority to lessening the external and financial
barriers rather than internal and technical barriers. Although governments of different
countries try to minimise pollution from manufacturing industries by imposing penalties,
the issuance of disposal permits gives them room to continue polluting (Dandira et al.,
2012). Currently in Kenya, for example, there is no systematic monitoring of industrial
effluents and emissions; although the legislative framework requires EIAs and annual
EAs from large industries to be done (UNEP 2014). Institutional arrangements for both
enforcing environmental regulations and providing support to prevent pollution in the
country are weak. There are no government-led mechanisms and incentives to promote
adoption and implementation of CP (Ondieki, 2013). Public policy will need to adapt to
the changing situations in industries which may require assistance in the form of
incentives and subsidies. KNCPC has conducted RECP assessments in various sectors
and has found out that the major challenges to CP in Kenya are: lack of knowledge and
awareness; limited technical and professional management skills; and high investment
costs (UNEP, 2014)
2.8 Policy and Regulatory Framework Governing Manufacturing Industries
As of 1990, Kenya had no policy at all in the field of environmental protection and
lacked a comprehensive environmental legislation (Orawo, 2016). According to
Barczewski (2013) the current legislation is quite comprehensive although it lacks air
quality regulations. It is also characterized by inadequate funding, lack of engagement

24
with important community stakeholders, duplication of regulations and lack of co-
operation between ministries within the government.
2.8.1 Environmental Management and Coordination (Amendment) Act, 2015
This was assented to in May 2015 and commenced in June 2015 as an Act of Parliament
to amend the Environmental Management and Coordination Act (EMCA) of 1999 in line
with the current constitution of Kenya (GoK, 2015). In 1999, the Environmental
Management and Coordination Act (EMCA) was assented to and it commenced in 2000.
It is from this Act that Kenya’s current environment regulatory regime originates.
According to Barczewski, 2013, EMCA, 1999 is expansive and the most important
contribution to governance of environmental regulations. The EMCA is an act of
parliament to provide for the establishment of an appropriate legal and institutional
framework for the management of environment. Institutions under EMCA include:
NEMA whose role is to exercise general supervision and coordination over all matters
relating to environment and to be the principal instrument of the government in
implementation of all policies related to the environment, to enforce EMCA’s provisions
and subsidiary legislation (water quality, waste management, controlled substances,
biodiversity, wetland, river and seashore, and EIA regulations) and to review and grant
licenses to proponents that plan to change land-use; county environment committees
which are responsible for proper management of environment within the counties and
develop a County strategic environmental action plan every five years; and national
environmental complaints committee which provides the administrative mechanism for
addressing environmental harm (GoK, 2015)
2.8.2 Legal Notice 101 -EIA and EA Regulations
EMCA stipulates that any proponent of any project must submit a project report to
NEMA before commencing financing or causing to commence or finance a project. If
NEMA determines that the proposed project will have significant environment impacts,
the proponent is mandated to complete an EIA at his or her own expense. The EIA is only
conducted by NEMA licensed lead experts/licensed firm of experts.

25
2.8.3 Noise Regulations
These regulations prohibit the production of any loud, unreasonable, unnecessary or
unusual noise which annoys, disturbs, injures, or endangers the comfort, repose, health or
safety of others and the environment.
2.8.4 Water Quality Regulations, 2006
The need to formulate these regulations was necessitated by increasing environmental
degradation especially pollution to water bodies (NEMA, 2010a). These regulations make
it illegal to deposit anything into a water resource that will cause it to become pollution.
They include; protection of sources of water for domestic uses, water for industrial use
and effluent discharge and water for agricultural use. The regulations outline quality
standards for sources of domestic water, quality monitoring for sources of domestic
water, standards for effluent discharge into the environment, monitoring guide for
discharge into the environment and standards for effluent discharge into public sewers
(Kithika, 2016)
NEMA is tasked with licensing effluent and abstraction activities and monitoring sources
of water at least twice every year. If someone pollutes water without a permit or license
from NEMA, the Act makes it an offence punishable by jail time or hefty fines. The
liable party is also responsible for cleaning up the pollution. During the licensing process
NEMA charges a fee, engages local authorities, businesses, lead agencies and also
examines environmental effects of the effluents/emissions.
According to NEMA (2010a), there has been increased compliance to prescribed
environmental standards and efforts to embrace recycling and pre-treatment of
wastewater by various facilities since the inception of these regulations. However, these
regulations lack siltation standards when considering possible damage to a waterway
when too much sediment is deposited in it (Barczewski, 2013)
2.8.5 Waste Management Regulations, 2006
Poor solid waste management has contributed to environmental pollution resulting in
reduced environmental health quality, risks to human health, loss of aesthetic value and
strained existing waste management infrastructure (NEMA, 2010b). Lack of waste

26
segregation has also worsened the situation and led to mixed wastes. The waste
management regulations seek to stop and reverse environmental pollution resulting from
solid waste by providing mechanisms for managing solid waste. These mechanisms
include: promotion of CP technologies, segregation at sources, recycling and re-use. The
regulations support the application of CP technologies in relevant facilities in order to
minimize waste generation and maximize the use of raw materials through improvement
of production processes, monitoring product cycle and incorporating environmental
concerns in the design, process and disposal of a product.
These regulations apply to all categories of waste: industrial waste, hazardous and toxic
wastes, pesticides and toxic substances, biomedical wastes and radioactive substances.
The industrial sector is a major contributor of solid waste mainly in cities and other urban
centers in the world (NEMA, 2010b). These regulations require the industrial sector to
install pollution control technology for pre-treatment of the waste emanating from trade
or industrial undertaking. They outline requirements for handling, storing, transporting
and treatment/disposal of all waste categories. Disposal of waste, for example, should be
done by a NEMA licensed company.
Stakeholders for these regulations are waste generators, transporters, recyclers,
composters, incinerator operators and landfill/dumpsite operators. The regulations
provide guidelines for licensing procedures, fees, offences and penalties.
2.8.6 Controlled Substances
These are basically ozone depleting substances. One needs a license to: produce
controlled substances, import controlled substances, transport controlled substances
through Kenya and export controlled substances
2.8.7 The EMCA (Conservation of Biological Diversity Resources, Access to Genetic
Resources and Benefit Sharing) Regulations, 2006
An EIA license is required to engage in activities with an adverse impact on any
ecosystem; lead to introduction of any exotic species or lead to unsustainable use of
natural resources. Any person who intends to access genetic resources in Kenya needs an

27
access permit for genetic resources in Kenya certificate from National Council for
Science and Technology.
2.9 Theoretical Framework
2.9.1 The Three-Circles Model of Sustainability
This model was put forward in 2005 by the World Summit on social development which
identified SD goals such as economic development, social development and
environmental protection. This view has been expressed to explain the concept of
sustainability which dates back to more than 30 years and was a key theme of the UN
Conference on the Human Environment in Stockholm in 1972. The concept was coined
to suggest that it was possible to achieve economic growth and industrialization without
environmental damage (IUCN, 2006). The three dimensions have been represented as
pillars, as concentric circles or as interlocking circles. An IUCN program in 2005 used
interlocking circles model to demonstrate that the three objectives need to be better
integrated. The model provides basic sustainability understanding especially of the
interaction between the three aspects. According to Lozano (2008), sustainability is
represented by the overlapping area of the three circles shown as ‘Full’ while areas
outside of this are considered either as partial sustainability (P), the union of two circles,
or not at all related to sustainability. This implies that sustainability is only those aspects
where the three are united; which is a flaw as it disregards interconnectedness within and
among the three aspects. Sustainability is however achieved by a condition of satisfying
all the three aspects simultaneously (IUCN, 2006). However, the model lacks dynamics
of process change over time and also considers human and environmental resources
separately; while it’s impossible to separate human development from environmental
development (Lozano, 2008; Thatcher, 2014).

28
Figure 1: The Three Circles model of sustainability
Source: Lozano, 2008
2.9.2 The Cleaner Production Excellence Model
The model was created and implemented in 2006 by Sustainable Business Associates
(SBA), an international NGO, in collaboration with the University of Applied Sciences
North Western Switzerland (FHNW) and the Royal Scientific Society (RSS) with
financial support from the Swiss State Secretariat for Economic Affairs (SECO). It is
seen as of great value especially to organizations in the Mediterranean region, in Europe
and beyond. The CP Excellence Model was inspired from the European Foundation for
Quality Management (EFQM) model, a non-prescriptive framework for business
excellence which is the most widely used organizational framework in Europe and forms
basis for majority of national and regional excellence awards. The model is applicable to
all kinds of manufacturing organizations regardless of the industrial sector and size.
The model is built upon some fundamental concepts which impact among each other and
are linked directly or indirectly with the model criteria. These concepts are: leadership
and management commitment; employees’ motivation; pollution prevention; recycling,

29
re-using and recuperation; energy efficiency; economic sustainability; social
responsibility; and continuous improvement. The CP Excellence Model is a framework
consisting of eight criteria: five ‘enablers’ and three ‘results’. The enablers cover what an
organization does and the results cover what an organization achieves. The enablers
cause the results. In turn the enablers are improved using feedback from the results. The
CP Excellence Model is based on the premise that, “excellent and sustainable
environmental, economic and social results are achieved by applying CP in a systematic
mode which implies development and establishment of a diagnosis, a policy, a strategy,
the implementation of CP options and monitoring of results”(SECO/SBA et al., 2007: 5).
Figure 2: The Cleaner Production Excellence Model
Source: SECO/SBA-RSS-FHNW, 2007

30
2.9.3 The Triple Bottom Line Model
The Triple Bottom Line concept, often abbreviated as TBL, was coined by John
Elkington in 1994 when he wrote about “win-win-win” strategy but it was publicly
articulated in 1997 after widespread recognition of his book, ‘Cannibal with Forks: The
Triple Bottom Line of 21st Century Business. TBL is an accounting framework that
incorporates three dimensions of performance; social, environmental and financial
(Furnish et al., 2013). The concept originated from a business and corporate setting.
Elkington felt that it had become increasingly clear that business must play a central role
in achieving SD goals, that is, companies needed to become more responsive to what he
saw as competitive and strategic challenges of growing concern over environmental and
social justice by consumers. TBL concept of sustainability is a premise that growth and
development should take economic, social and environmental impacts into consideration.
TBL of sustainability calls for a balance between the three aspects (Thatcher, 2014). Its
dimensions are also called the 3P’s: People, Planet and Profits. It differs from traditional
reporting frameworks, which measure profits; return on investment and shareholder
value, in that it includes ecological and social measures. However, these measures can be
difficult to assign appropriate means of measurement (Slaper & Hall, 2011). This means
that measuring the degree to which an organisation is being sustainable or is pursuing
sustainable growth can be difficult.
According to Furnish et al. (2013), prominence of the TBL concept of sustainability in
international development efforts has been noted in the Brundtland Report of 1987, Our
Common Future, as well as the UN’s Agenda 21. The WCED Report strongly argued that
a single focus on environmental issues would be a ‘grave mistake’ and that the
environment does not exist separately from human actions and needs; its inseparable
from development and poverty alleviation. The Agenda 21 is an international framework
for SD that offers a practical approach for the three levels. The 27 principles underlying it
promote the centrality of social equity and environmental protection to development for
current and future generations.

31
TBL and its core value of sustainability have become compelling in the business world
due to evidence of greater long-term profitability (Slaper & Hall, 2011). For example,
reducing waste from packaging can reduce costs. In addition, the role of community
involvement is a necessary component of TBL and SD strategies should favor shared
responsibilities which involve bottom-up rather than top-down approaches (Furnish et al.,
2013). This is particularly important in implementation of CP which becomes successful
when a committed top management of an organisation involves the workers in decision
making. UNIDO based its CSR programme on the TBL approach which is used as
framework for measuring and reporting corporate performance against economic, social
and environmental performance. According to UNIDO (2015), TBL approach has proven
to be as successful tool for SMEs in developing countries to assist them in meeting social
and environmental standards without comprising their competitiveness. It’s an attempt to
align enterprises to the goal of sustainable global development by providing them with a
more comprehensive set of working objectives than just profit alone.
2.10 Conceptual Framework
The Cleaner Production Excellence Model formed the basis under which this study was
laid. This is because the model encompasses specific CP aspects like energy efficiency,
pollution prevention, recycling, reusing, social responsibility, leadership and management
commitment, economic sustainability and continuous improvement; which this study is
interested in; as opposed to the other models which generally address the issue of
sustainable development. The researcher has modified it to suit it to the context of
manufacturing industries. The conceptual framework of this study has three parts: CP
determinants and challenges, CP implementation and CP benefits. The determinants are
those drivers/ factors that influence the adoption of CP practices. The challenges are
those factors that hinder adoption/implementation of CP in the manufacturing industries
and they can be internal or external. After a manufacturing industry implements CP, the
benefits that result are of three categories which match the three principles of sustainable
development, that is, environmental, economic and social benefits and directly or
indirectly impact on the challenges and also end up improving the practices. Benefits
from CP implementation will also serve an indication of weak areas of influence that
need to be acted upon while at the same time strengthening some drivers that will

32
improve adoption. For example, improved economic performance will lessen the problem
of financial constraints. Aspects of improved social performance in most cases result
automatically with implementation of Cleaner Production, particularly with good
housekeeping.
Figure 3: Conceptual Framework
A CONCEPTUAL FRAMEWORK FOR CLEANER PRODUCTION IN
MANUFACTURING INDUSTRIES
INTERMEDIATE VARIABLES
INDEPENDENT VARIABLES DEPENDENT VARIABLES
DETERMINANTS
• Regulatory pressure
• Cost savings
• CSR
• Pressure groups
• Corporate image
improvement
• Firm’s technological
capability
• Firm’s human capital
BENEFITS
• Improved
resource use
• Improved
profitability
• Improved social
performance
CP PRACTICES
• Good housekeeping
• Technology change
• Product redesign
• Onsite recycling
• Input material
changes
INTERNAL
CHALLENGES
• Lack of CP awareness
• Financial constraints
• Competing business
priorities
• Lack of in-house
monitoring
• Deficiency in
maintenance
EXTERNAL
CHALLENGES
• External finances
• National policy and
regulatory framework
• Lack of technical
support
Source: Modified from SECO/SBA-RSS-FHNW, 2007; Ondieki, 2013

33
2.11 Research Gaps
Research into determinants of CP in manufacturing industries has not being given much
attention. Studies by researchers such as Frondel et al. (2009), Horbach et al. (2011),
Belin et al. (2011) looked at eco-innovation which involves end of pipe approaches
which have no room in cleaner production. In Kenya, Mputhia et al. (2012) looked at
awareness of environmental regulations and how it influences compliance to
environmental regulations. Their study never took into account CP aspects. This study
however looked into whether environmental regulations existence in Kenya influences
the adoption on cleaner production. A study on cleaner production in Kenya conducted
by Ondieki (2013) involved star rated hotels in Nairobi County. This study however dealt
with manufacturing industries. Another study on manufacturing industries in Nairobi was
conducted by Mwithalii (2009). However, it involved two related manufacturing
industries and it was specifically investigating the role of cleaner production in enhancing
water use efficiency without considering other benefits associated with cleaner
production or even the factors influencing its adoption.
Kenya has not yet come up with a cleaner production policy. Industries are governed by
environmental regulations which still give room for waste production and disposal into
the environment. Cleaner production adoption, which encourages waste elimination, is a
voluntary practice in the country. This is a gap in the policy framework. This study
recommends that policy makers should see to it that the country gets a cleaner production
policy governing all manufacturing industries.

34
CHAPTER THREE
RESEARCH METHODOLOGY
3.1 Introduction
This chapter describes the characteristics of the area in which the study was carried out.
This includes geographical location, climate, population dynamics, drainage, industrial
land use and major environmental issues. The methodology used in carrying out the study
is also outlined. This includes: Research Design, Study population, Data collection
methods, Data Analysis and Presentation methods. The researcher also highlights some
of the limitations experienced during the study.
3.2 Study Area
3.2.1 Geographical location
Nairobi is located at the South-Eastern end of Kenya’s agricultural heartland at
approximately 109’S, 1028’S and 3604’E, 37010’E with an area of about 700 km2. It is
Kenya’s capital city and largest urban center. The county borders three others: Kiambu to
the west and north, Machakos to the East and Kajiado to the south. The altitude is
between 1600m and 1850m above sea level. The western part of Nairobi is rugged while
the eastern part is lower and generally flat. It is a center of industry, education and culture
and houses world headquarters of two UN agencies; UNEP and United Nations Centre
for Human Settlements (UN- Habitat).
3.2.2 Climate
Usually referred to as the ‘Green City in the Sun’, Nairobi has a pleasant climate and
weather conditions throughout the year (Omwenga, 2010). Nairobi has a temperate
tropical climate with two rainy seasons. Heavy rains are experienced between March and
April while short rains are experienced between November and December. The mean
annual rainfall is between 850 mm and 1050 mm while the mean daily temperatures
range between 120C and 260C (CCN, 2007). It’s generally hot and dry in January and
February and dry and cold between July and August.

35
3.2.3 Drainage
The main drainage follows the regional slope of volcanic rocks towards the east while a
subsidiary internal drainage into the Rift region is confined to the western part (CCN,
2007). Water bodies and riverine areas cover 1.69% of the city’s land area and usually
face increasing pollution from municipal, industrial, mining and agricultural sources. The
major rivers are Nairobi, Ngong and Mathare which traverse numerous neighborhoods
(Tibaijuka, 2009).
3.2.4 Population Dynamics
The population of Nairobi represents about a quarter of Kenya’s urban population and
about 8% of the total population (Tibaijuka, 2009). According to 2009 Kenya Population
and Housing Census, Nairobi had 3 million people but the projection for 2015 was 3.8
million with a population density of 3079/km2 but varies significantly from extremely
high to very low depending on economic status of residents (CCN, 2007). Nairobi
represents a quarter of Kenya’s urban population and has a population density of 3
079/KM2 (Tibaijuka, 2009). Population is a major driver of environmental change and a
determinant for issues such as solid waste generation, land-use patterns and settlement as
well as resource consumption. High population growth rates have been attributed to high
fertility rates and high influx of people to the city for purposes of higher wage
employment, opportunity for higher education, better economic prospects and trade. The
rapid population growth rate doesn’t match the rate of economic growth and is associated
with unemployment and urban poverty which have resulted to sprawling informal
settlements that negatively affect the city’s delivery of social services and quality of life
(Omwenga, 2010)
3.2.5 Industrial Land Use
Nairobi is the most industrialized urban center in Kenya and East Africa in general. The
main Industrial area is located to the east of the city. However, the area used for industrial
purposes has grown phenomenally; some extensions have been uncoordinated leading to
incompatible mixed land uses merged with or encroached into residential use (CCN,
2007). Nairobi town is one of the many cities and towns which have grown in population
size and also expanded spatially to form huge metropolitan regions. The Nairobi

36
metropolitan region covers 32 000km2. It covers areas such as Kiambu, Ruiru, Thika,
Limuru, Mavoko, Machakos, Olkejuado, Masaku, Kikuyu, Kajiado and Kangundo and is
both the largest and well established commercial and industrial region in East and Central
Africa (Omwenga, 2010).
3.2.6 Major Environmental Issues
The city faces the challenge of planning for sustainable urban development that provides
adequate housing and services. Major environmental issues include: rapid urbanization,
informal settlements, air and water pollution, water supply and sanitation and solid waste
management (Tibaijuka, 2009).
Nairobi’s landscape was initially characterized by natural forests, riverine ecosystems
and wetlands and abundant wildlife. However, physical expansion has come at the
expense of the natural environment. Urban sprawl and construction of roads and other
infrastructure has led to loss of forests and other natural areas such as mixed rangeland
and bushland. The city’s outskirts are threatened by urban growth.
Main sources of atmospheric pollution are vehicles, industries, emissions from charcoal
and firewood burning and municipal sources such as burning of waste. The principal
sources of water for Nairobi are Ndakaini, Ruiru and Sasumua dams. However, the city’s
waste water management has not kept up with increasing demands for the growing
population and is inadequate to treat the amount of industrial and municipal effluent
entering Nairobi River and other surface waters. A number of factories in Nairobi’s
Industrial Area discharge waste directly into Ngong river.
Increased urbanization, rural-urban migration, rising standards of living and reapid
development associated with increased population growth have caused increased solid
waste generation by industrial and domestic activities. In 1992, 800-1000 tonnes of waste
were being generated; this amount shot to 1530 tonnes per day in 2002. Industrial wastes
account for 14% of the total wastes (Tibaijuka, 2009).

37
Figure 4: Map of Nairobi County and Sorrounding Region
Source: Ministry of Roads, Roads Department, 2016

38
3.3 Methodology
3.3.1 Research Design
The study applied a descriptive survey research design as its purpose was to depict an
accurate representation of individuals, event or situations (Robson, 2002). The researcher
aimed to provide a description for issues in CP adoption, clarification of challenges and
characteristics of particular industries, especially those related to production processes.
3.3.2 Study Population
The study population consisted of 15 manufacturing industries in the Nairobi
Metropolitan Region that have already implemented CP and have been working with
KNCPC. This is according to a list obtained from KNCPC in January 2015. KNCPC
provided a list of all companies they have been working with countrywide whereby the
researcher selected the manufacturing industries in Nairobi. The industries fall in
processing, paper conversion, chemicals, tanning, plastics and rubber sub-sectors. The
researcher conducted a census whereby the entire population was used for the study due
to its small size hence no sampling was done.
Table 2: Industries Making Up the Population
Name of Industry Industrial Sub-sector
Chandaria Industries Paper Conversion
Unga Millers Flour processing
BAT Kenya Limited Tobacco processing
Kapa Oil Refineries Edible Oil processing
Kapa Oil Refineries Soap manufacture
HACO Industries Plastics, cosmetics and detergents
Twiga Chemicals Chemicals
East African Leather Factory Leather tanning
Unilever Kenya Ltd Manufacturing
Osho Chemicals Chemicals
Superfoam Limited Mattress manufacture
GlaxoSmithKline Pharmaceuticals
Power Technics Electricals
Geni Items Limited Electroplating
Bidco Industries Edible oil processing

39
3.3.3 Data Collection
3.3.3.1 Nature and Sources of Data
Data was collected from both primary and secondary sources. Primary data was obtained
using questionnaires which were administered to respondents who had complete
understanding of the industrial operations. Primary data collected included: size of the
industry, major products and major raw materials used, major wastes generated, data on
water and energy consumption, benefits and challenges to CP, determinants and impacts
of CP. Secondary data was derived from published and unpublished literature from
libraries and the internet. This data included various policies governing environmental
protection, legal framework and CP practice throughout the world. The researcher also
visited the websites of the industries surveyed, government bodies like NEMA and
KNCPC, and of Organizations like UNEP and UNIDO which usually oversee
implementation of CP. Relevant government policies and regulatory framework were
also reviewed.
3.3.3.2 Research Tools
Questionnaires were used to extract information from technical officers, operations
managers or HR representatives in the respective industries. Each industry to be studied
had one questionnaire to fill; therefore, the researcher had fifteen questionnaires to be
administered. The researcher liaised with HR representatives from each industry so as to
get the right person to fill the questionnaire; majority of the industries required that the
researcher goes through the HR manager office first and in many cases he/she determined
who the respondent will be. Most of the questionnaires were dropped and then picked
later as agreed upon with the respondent while others were administered through email.
The questionnaire had five sections: Section one was used to gather general information
about the industry; size of the industry, major products produced, raw materials used and
wastes emitted. Section two gathered information on CP awareness and practice, Section
three on benefits and challenges to CP, Section four on impacts and determinants and
Section five on regulations governing the industries and compliance.

40
3.3.4 Data Analysis and Presentation
The data collected was entered in SPSS Version 20. The researcher organized the data
into variables and then coded it. Descriptive statistics like percentages were used to
analyze and make meaning out of the data. Frequency tables, bar graphs and pie-charts
were then used to present the data. Bar graphs and pie-charts were generated using
Microsoft Excel 2007.
3.3.5 Research Limitations
Some industries failed to respond by firmly stating that they do not allow academic
research in their premises. This really affected the response rate. The researcher was able
to convince some of them but this took a lot of time which was also limited for the
researcher. For the ones that responded, the respondents were hesitant to disclose some of
the information. They also restricted data collection to the questionnaire only and would
not allow photographs. The researcher however assured them that the information will be
used for academic purposes only.
The researcher also had a problem in acquiring expansive literature on the subject of CP
especially here in Kenya. Not many empirical studies have been conducted in Kenya as
majority of the referred studies are from elsewhere. Thus, the researcher made sure that
the questionnaires were as detailed as possible in order to extract more information from
the respondents.
Due to the slow nature of responsiveness on the side of the industries, the researcher
incurred many costs in terms of calling and also travels expenses. At some point, the
researcher engaged a research assistant to assist in data collection.

41
CHAPTER FOUR
RESULTS AND DISCUSSION
4.1 Introduction
This chapter summarises the results of this study. Areas covered include Response Rate,
characteristics of the surveyed industries and CP practices, CP benefits, Challenges in CP
adoption and implementation, Determinants of CP adoption and implementation, impacts
from CP implementation, Compliance and Regulations and Hypotheses Testing.
4.2 Response Rate
As illustrated in the previous chapter, the study involved a census on fifteen industries in
the Nairobi Metropolitan Region which had already worked with the Kenya National
Cleaner Production Center (KNCPC). Out of the 15 industries, 10 participated in the
study making a response rate of 66.67%.
4.3 General Characteristics of Surveyed Industries
4.3.1 Subsector the firm Belongs to and Products Manufactured
Chemical and Allied subsector had 30% of the industries, 30% were from Food and
Beverage, 10% from Energy, Electrical and Electronics, 10% from leather and tanning,
10% from metal and allied and 10% from pharmaceutical and medical equipment
subsectors. Industries from the food and beverage subsector manufacture maize and
wheat flour and also process edible oil which account for 10% and 20% of total products
manufactured by industries under study respectively. 20% of the products manufactured
are detergents while 10% are plants and animal chemicals. These products are from
industries in the Chemical and Allied sector. Hides and skins, electrical products,
electroplating and pharmaceuticals accounted for 10% of the total products manufactured
each (Appendix 2).

42
Figure 5: Sub-sector the Firms Belong To
Source: Field data, 2016
4.3.2 Main Raw Materials Used by the Industries versus Major Waste Products
From the industries manufacturing detergents, chemicals and acid oil were the main raw
materials while bleaching earth was the major waste product.40% of the industries
reported to use chemicals and acid oil while bleaching earth accounted for 33.3% of total
wastes generated. 20% of the raw materials were crude oil; namely palm/sunflower/corn
oil. These were used in the industries manufacturing edible oils. Maize and wheat, metal
anodes, hides and skins/hydroxides and electrical switches and cables accounted for 10%
each of the raw materials used. Of the major waste products, waste water, scrap metal,
bio-protein, organics, husks and Fatty Acid Distillate (FAD) accounted for 11.1% each
(Appendix 2).
4.3.3 Year of CP Adoption
KNCPC started its operations in 2001. However, 30% of the industries reported to have
adopted environmentally friendly practices before this time. This is the period between
1971 and 1997. 60% of the industries adopted CP between 2003 and 2009 while 10%
reported to have adopted quite recently (2012). This is shown in table 3.
30%
30%
10%
10%
10%10%
Sub-sector the firms Belong to
Chemical & Allied
Food & Beverage
Energy, Electrical
and Electronics
Leather & Tanning
Metal & Allied

43
Table 3: Year the Industries adopted CP
Year of CP Adoption Number of Industries
1971 1
1995 1
1997 1
2003 1
2004 3
2009 2
2012 1
4.3.4 Source of Information on Cleaner Production
All industries reported to have gotten information concerning cleaner production from
KNCPC. This confirmed the fact that all industries under study had interacted with the
government body. Of all industries under study, 30% had received information on CP
from KAM, 20% from the Ministry of Environment and Natural Resources and another
20% from NEMA (Figure 6)
Figure 6: Source of Information on CP
Source: Field data, 2016
0% 20% 40% 60% 80% 100%
KNCPC
KAM
Ministry of Environment
NEMA
100%
30%
20%
20%
70%
80%
80%
Percentage
So
urc
e
Source of Information on CP
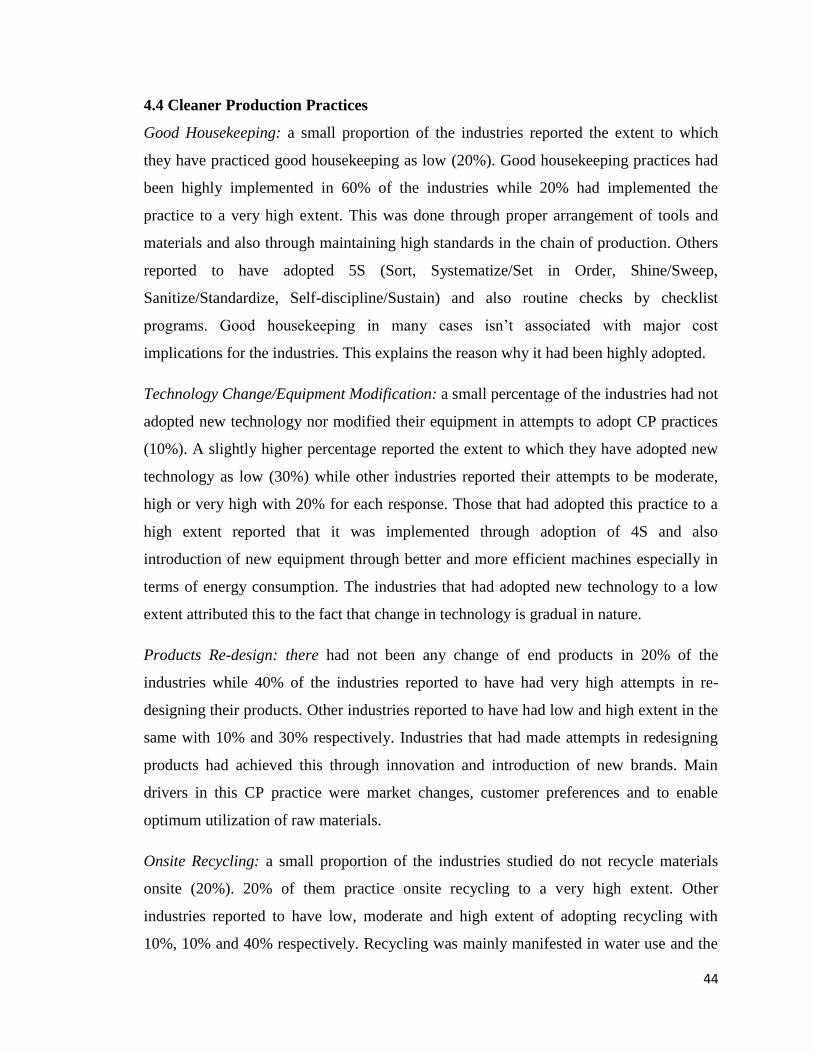
44
4.4 Cleaner Production Practices
Good Housekeeping: a small proportion of the industries reported the extent to which
they have practiced good housekeeping as low (20%). Good housekeeping practices had
been highly implemented in 60% of the industries while 20% had implemented the
practice to a very high extent. This was done through proper arrangement of tools and
materials and also through maintaining high standards in the chain of production. Others
reported to have adopted 5S (Sort, Systematize/Set in Order, Shine/Sweep,
Sanitize/Standardize, Self-discipline/Sustain) and also routine checks by checklist
programs. Good housekeeping in many cases isn’t associated with major cost
implications for the industries. This explains the reason why it had been highly adopted.
Technology Change/Equipment Modification: a small percentage of the industries had not
adopted new technology nor modified their equipment in attempts to adopt CP practices
(10%). A slightly higher percentage reported the extent to which they have adopted new
technology as low (30%) while other industries reported their attempts to be moderate,
high or very high with 20% for each response. Those that had adopted this practice to a
high extent reported that it was implemented through adoption of 4S and also
introduction of new equipment through better and more efficient machines especially in
terms of energy consumption. The industries that had adopted new technology to a low
extent attributed this to the fact that change in technology is gradual in nature.
Products Re-design: there had not been any change of end products in 20% of the
industries while 40% of the industries reported to have had very high attempts in re-
designing their products. Other industries reported to have had low and high extent in the
same with 10% and 30% respectively. Industries that had made attempts in redesigning
products had achieved this through innovation and introduction of new brands. Main
drivers in this CP practice were market changes, customer preferences and to enable
optimum utilization of raw materials.
Onsite Recycling: a small proportion of the industries studied do not recycle materials
onsite (20%). 20% of them practice onsite recycling to a very high extent. Other
industries reported to have low, moderate and high extent of adopting recycling with
10%, 10% and 40% respectively. Recycling was mainly manifested in water use and the

45
putting up of Effluent Treatment Plants (ETPs). Major drivers for this CP practice were:
reduction of wastage of raw materials, conservation of environment and reduction of
costs.
Changes to Raw Materials: 30% of the industries had not changed their raw materials at
all. 20%, 30% and 20% of the industries had had low, moderate and high attempts
respectively in the manner they had carried out this practice. Industries that had not
adopted this practice at all attributed this to the fact that they had no room for change and
thus had used the same products. Others, due to their nature, lacked alternative raw
materials for their products. Some had adopted this practice to a moderate extent through
shifting to low sulphur oils, optimization and minimizing raw material wastage.
Figure 7: Extent to which CP Practices Have Been Implemented
Source: Field data, 2016
4.5 Determinants of CP Adoption
Determinants such as customer pressure, pressure from industrial organizations, pressure
from surrounding community to adopt environmentally friendly measures and supply
chain pressure were reported to be the least significant of all determinants with more than
50% of industries each. Other determinants like pressure of environmental regulations,
incentives/subsidies from government, expected business profits/cost savings and firm’s
0% 20% 40% 60% 80% 100%
Good Housekeeping
Technology Change/Equipment…
Products Re-design
Onsite Recycling
Changes to Raw Materials
10%
20%
20%
30%
20%
30%
10%
10%
20%
20%
10%
30%
60%
20%
30%
40%
20%
20%
20%
40%
20%
Percentage
CP
Pra
ctic
e
Extent to which CP Practices have been Implemented
Not at all
Low
Moderate
High
Very high

46
human capital had at least 30% of the industries considering them as the most significant
(Figure 8).
Figure 8: Determinants of CP Adoption and Implementation
This concurs with the findings of a study by Luken and Rompaey (2008), which found
out that environmental regulation and market pressure appear to exert more influence
than community pressure on adoption of EST. similarly, a study by Kesidou & Demirel
(2010) established that customer and societal requirements on CSR exhibit no impact
upon investment level even if they may affect the firm’s decision to undertake
environmental innovation. Horbach et al (2011) noted that customer pressure was not
seen as a strong stimulus for environmental innovation and that environmental
regulations are more or less regulation driven in their studies on industries in Spain, US,
Japan and Germany. They also noted the positive role played by cost savings as a
motivation for CP technologies from the many studies in the literature they reviewed.
Ondieki (2013) also noted that a business is more likely to take on environmental
0% 20% 40% 60% 80%100%
Environmental regulations
Business profits/cost savings
Customer pressure
Technological capability
Human capital
CSR
Corporate image…
Subsidies/incentives
Industrial associations
Pressure from community
Learning from other…
Supply chain pressure
Environmental organisations
70%
10%
30%
10%
10%
50%
80%
40%
70%
40%
70%
70%
30%
60%
100%
50%
70%
30%
50%
20%
50%
30%
60%
30%
30%
30%
20%
20%
60%
10%
Percentage
Det
erm
inan
ts
Determinants of CP Adoption and Implementation
Least significant
Moderate significance
Most Significant

47
management practices if they can see the benefits in form of reduced costs and/or higher
revenues and profits.
4.6 Challenges Faced in Adoption and Implementation of Cleaner Production
Financial constraints had a strong impact on 60% of the industries, moderate impact on
20% and little impact on 10% of them. However, 10% of the industries never felt this
challenge. Low level of Awareness on good environmental practices and benefits had a
little impact on half of the industries, moderate impact on 40% of the industries and a
strong impact on 10% of them. Lack of Professional and Technical Management skills
had no impact on 30% of the industries, little impact on 30% and moderate impact on
40% of them. Pressure to make short-term profits did not have an impact on 40% of the
industries; but had a little impact on 20%, a strong impact on 30% and a very strong
impact on 10%. Lack of Effective Accounting Systems to quantify financial performance
of CP projects had no impact on half of the industries; but had little impact on 20% of
them, moderate impact on 10% and a strong impact on another 20%. All the industries
reported that lack of incentives/ subsidies from the government to encourage CP adoption
had had a strong impact in their efforts to adopt and implement CP. Resistance to change
by Industry’s top management and staff had no impact on 40% of the industries, little
impact on 10%, moderate impact on 40% and strong impact on 10%. Poor Record
keeping on water and energy Consumption as well as emissions had no impact on 40% of
the industries; but had little impact on 10% of the industries, moderate impact on 40% of
the industries and a strong impact on 10% of the industries. Lack of a National CP Policy
in Kenya had a moderate impact on 30% of the industries, a strong impact on 40% of the
industries and a very strong impact on 30% of them.
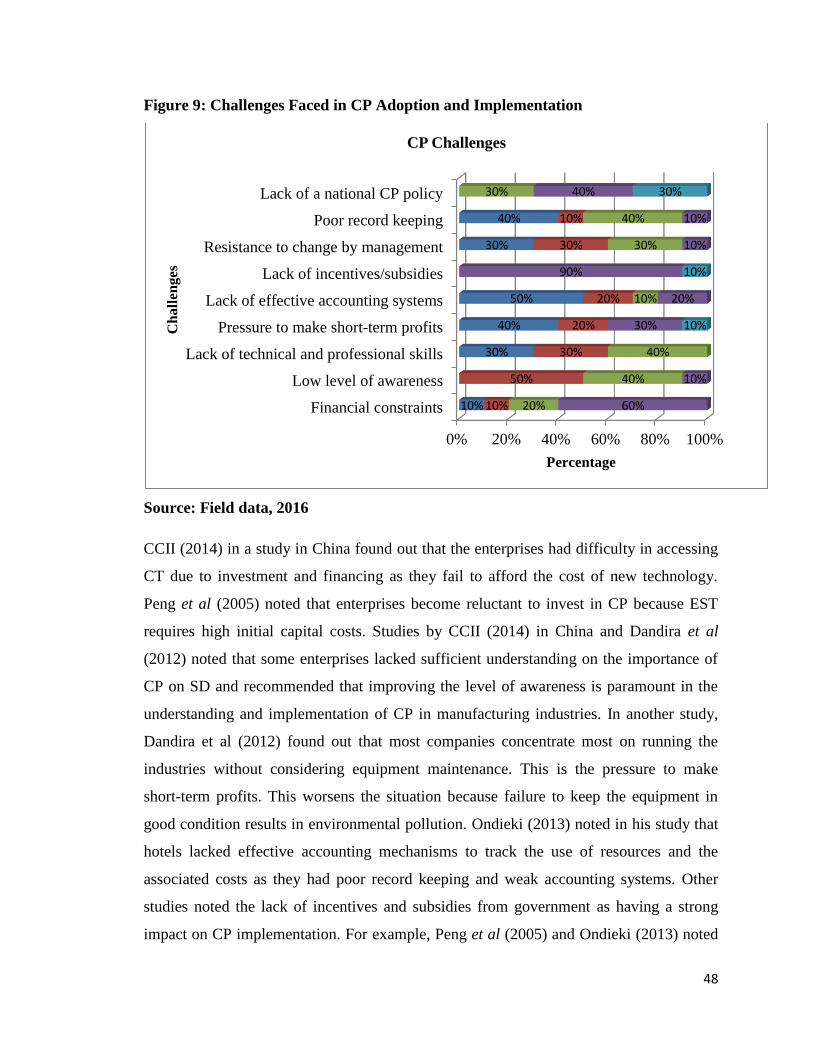
48
Figure 9: Challenges Faced in CP Adoption and Implementation
Source: Field data, 2016
CCII (2014) in a study in China found out that the enterprises had difficulty in accessing
CT due to investment and financing as they fail to afford the cost of new technology.
Peng et al (2005) noted that enterprises become reluctant to invest in CP because EST
requires high initial capital costs. Studies by CCII (2014) in China and Dandira et al
(2012) noted that some enterprises lacked sufficient understanding on the importance of
CP on SD and recommended that improving the level of awareness is paramount in the
understanding and implementation of CP in manufacturing industries. In another study,
Dandira et al (2012) found out that most companies concentrate most on running the
industries without considering equipment maintenance. This is the pressure to make
short-term profits. This worsens the situation because failure to keep the equipment in
good condition results in environmental pollution. Ondieki (2013) noted in his study that
hotels lacked effective accounting mechanisms to track the use of resources and the
associated costs as they had poor record keeping and weak accounting systems. Other
studies noted the lack of incentives and subsidies from government as having a strong
impact on CP implementation. For example, Peng et al (2005) and Ondieki (2013) noted
0% 20% 40% 60% 80% 100%
Financial constraints
Low level of awareness
Lack of technical and professional skills
Pressure to make short-term profits
Lack of effective accounting systems
Lack of incentives/subsidies
Resistance to change by management
Poor record keeping
Lack of a national CP policy
10%
30%
40%
50%
30%
40%
10%
50%
30%
20%
20%
30%
10%
20%
40%
40%
10%
30%
40%
30%
60%
10%
30%
20%
90%
10%
10%
40%
10%
10%
30%
Percentage
Ch
all
en
ges
CP Challenges

49
lack of government-led mechanisms and incentives to promote adoption and
implementation of CP. There is a dire need to have incentives on economic policies; for
example, tax exemptions and grants for installation of CP technology.
4.7 Impacts from Implementation of Cleaner Production in Manufacturing
Industries
CP implementation had had a very high impact on 70% on the industries as far as energy
conservation is concerned; 10% had had a high impact while 20% had experienced a
moderate impact on energy conservation. Regarding energy consumption, 100% of the
industries are connected to the national Grid and utilize energy from KPLC; 90% of them
also have diesel generators while only 20% utilized solar power as an energy source.
However, 90% of the industries reported to have experienced considerable energy
savings since CP adoption. Only 10% had realized increased energy consumption
accompanied by increased costs. The industries had adopted various energy conservation
measures: 20% of the industries use recycled water as a way of conserving energy; 30%
of the industries ensure that their staff is well sensitized on proper usage of energy; 40%
of the industries have adopted efficient energy conservation machinery and energy saving
bulbs; while 10% have adopted metering of the energy flow system in order to track the
production output (Figure 10).
Figure 10: Energy Conservation Measures Adopted by the Industries
Source: Field data, 2016
40%
30%
20%
10%
Energy conservation measures
Adoption of energy
efficient
machinery/bulbs
Proper sensitization of
staff
Use of recycled water

50
The researcher sought to establish the extent to which cost savings through energy
conservation influenced CP adoption. 20% of the industries reported that it had little
influence, 20% moderate influence while 60% reported that energy cost savings had a
strong influence on their decision to adopt CP.
CP had a very high impact on 60% of the industries, a high impact on 20% and a
moderate impact on 20% of the industries in terms of water conservation. Regarding
water consumption trends Since CP adoption, the researcher sought to find out about the
water consumption trends since the Industry adopted CP. Regarding this, 30% of the
industries had no noticeable change, 50% of the industries had noted a reduction in
consumption, 10% of the industries had maintained controlled consumption through
record keeping and another 10% had noted minimized water wastage (Figure 11 below).
Figure 11: Water Consumption Trends since CP Adoption
Source: Field data, 2016
Majority of the industries use piped water for their day to day industrial activities (90%);
70% of them reported to utilize borehole water while only 10% harvest rainwater for
industrial use. However, the industries had adopted various water conservation measures;
40% of the industries treat their waste water through an effluent treatment plant, 20%
recycled their waste water, 10% conducted daily checks for leakages, 20% have avoided
50%10%
10%
10%
Water Consumption Trends
Reduction in consumption
No noticeable change
Controlled consumption
through record keeping
Minimised water wastage

51
wastage in their usage of water while 10% reported to have improved on their water
storage (Figure 12).
Figure 12: Water Conservation Measures Adopted by the Industries
Source: Field data, 2016
The researcher sought to establish the extent to which cost savings through water
conservation measures had influenced their attempts to adopt CP. Majority of the
industries (60%) reported that cost savings through water conservation had a strong
influence in CP adoption while 30% and 10% reported that it had little and moderate
influence respectively.
Green product design had not been adopted in 40% of the industries since CP adoption; it
had a low impact on 20% of the industries and a high impact on 40% of them.
A small proportion of the industries (10%) had not experienced increased costs of
purchasing environmentally friendly materials and equipment; 40% felt a low impact
while 30% and 20% felt moderate and high impacts respectively. Few of the industries
(10%) had not experienced increased investments while 30%, 20% and 40% reported to
have experienced low, moderate and high impacts on the same respectively. A big
percentage (80%) of the industries studied had realized increased profitability in relation
0%
10%
20%
30%
40%
Effluent
treatment
plant
Recycling Avoiding
wastage in
water use
Improved
water
storage
Daily
checks for
leakages
40%
20% 20%
10% 10%
Per
cen
tag
e
Measures
Water conservation measures

52
to competitors to a high extent; but 10% of them had not experienced this at all while
10% had experienced a moderate impact.
Other impacts included: reduced cost of raw materials (30%), reduced Occupational
Safety expenses (80%), improved corporate image (40%), reduced costs of waste
discharge (60%), reduced environmental accidents (70%) and improved staff morale
(50%). In addition, 40% of the industries had experienced improved external markets for
products, 60% production efficiency gains and 30% improved quality of products. None
of the industries surveyed reported to have experienced reduced penalty fee from NEMA;
this might be attributed to the fact that cases of industries been subjected to penalties by
the authority due to environmental pollution are rare and almost non-existent in the
country.
Various studies have established the above impacts from CP implementation. For
example, a study done by GDRC (2015) on a Lead Acid battery manufacturer in Tunisia
who had implemented P2 options revealed benefits such as reduction of the costs of
treating chemicals (by 33%), improved employee health, reduction in energy and water
consumption, improvement of waste water quality and less lead was required in the
process. Mwithalii (2009) in his study on EABL noted that the industry had experienced
reduction in energy needs as a result of CP practices like recycling and reusing and
process modification in terms of the use of hot condensed steam. Similar results on
energy reduction were also noted by GDRC (2015) and Ondieki (2013). Bach and
Gheewala (2010) in a study on a coal preparation facility in Vietnam noted problems in
management of environmental issues and high amounts of solid waste and suggested CP
practices as a solution. Thus, CP implementation is meant to be a solution to
environmental problems and should result in reduction of pollution.

53
Figure 13: Impacts from CP implementation in the Surveyed Industries
Source: Field data, 2016
4.8 Compliance and Regulations
All the industries studied had a well-defined environmental policy and all employees
were aware of the firm’s environmental policy. A large proportion of the firms (80%)
comply with certain environmental standards while 20% do not comply with any
environmental standards. However, the researcher noted that many respondents were not
fully aware of environmental standards like the ISO 14000 series. Therefore, majority
responded to this matter with respect to environmental regulations in Kenya that they
comply with; 42.9% comply with ISO 4001 standards, 14.3% with waste management
regulations 2006, 14.3% with EIA regulations 2003, 14.3% with water quality regulations
and 14.3% with environmental management policies. A small percentage of the industries
had been able to comply with environmental standards for 12 years (10%), while 20%
had been able to comply for four years and 10% for six years. The rest of the industries
did not specify the period they had been able to comply with environmental standards.
0% 20% 40% 60% 80% 100%
Environmental protection
Energy conservation
Waste recycling
Water conservation
Green product design
Increased materials and…
Increased investments
Increased profitability
20%
40%
10%
10%
10%
20%
40%
30%
10%
20%
20%
30%
20%
10%
40%
10%
40%
20%
40%
20%
40%
80%
50%
70%
40%
60%
Percentage
Imp
act
s
Impacts from CP implementation
Not at all
Low
Moderate
High
Very High

54
International Organization for Standardization (ISO) standards provide practical tools for
all three dimensions of SD; economic, environmental and societal. In the ISO 14000
series, there is ISO 14001 which is the world’s most recognized framework for EMS and
helps organs to manage better the impact of their activities on the environment and to
demonstrate sound environmental management (ISO, 2016). Horbach et al (2011) noted
that EMS is a very important tool to trigger cost saving clean technologies and also
enables a firm to be aware of any existing inefficiencies. Other standards in the series
according to ISO include: ISO 19011 which provides guidance on auditing standards
(principles of auditing, managing audit programs and conduct of audits), ISO 14031
which provides guidance on evaluating environmental performance using suitable
performance indicators based on internal and external reporting, ISO 14020 on eco-
labels, ISO 14040 on Life-Cycle Assessment (LCA), ISO 14064 on GHGs accounting
and verification and ISO 14063 on environmental communication guidelines helping
companies make links to external stakeholders.
The researcher also sought to establish the times when the industries conducted the last
environmental audit; 87.5% of them did their last audits in the year 2015 between April
and December while 12.5% did the last audit in 2016.The respondents were also required
to rate the stringency of environmental regulations on industries. Some industries felt that
regulations are not strict (10%), others felt that regulations are a bit strict (50%) while
40% reported that environmental regulations are very strict (Figure 14).
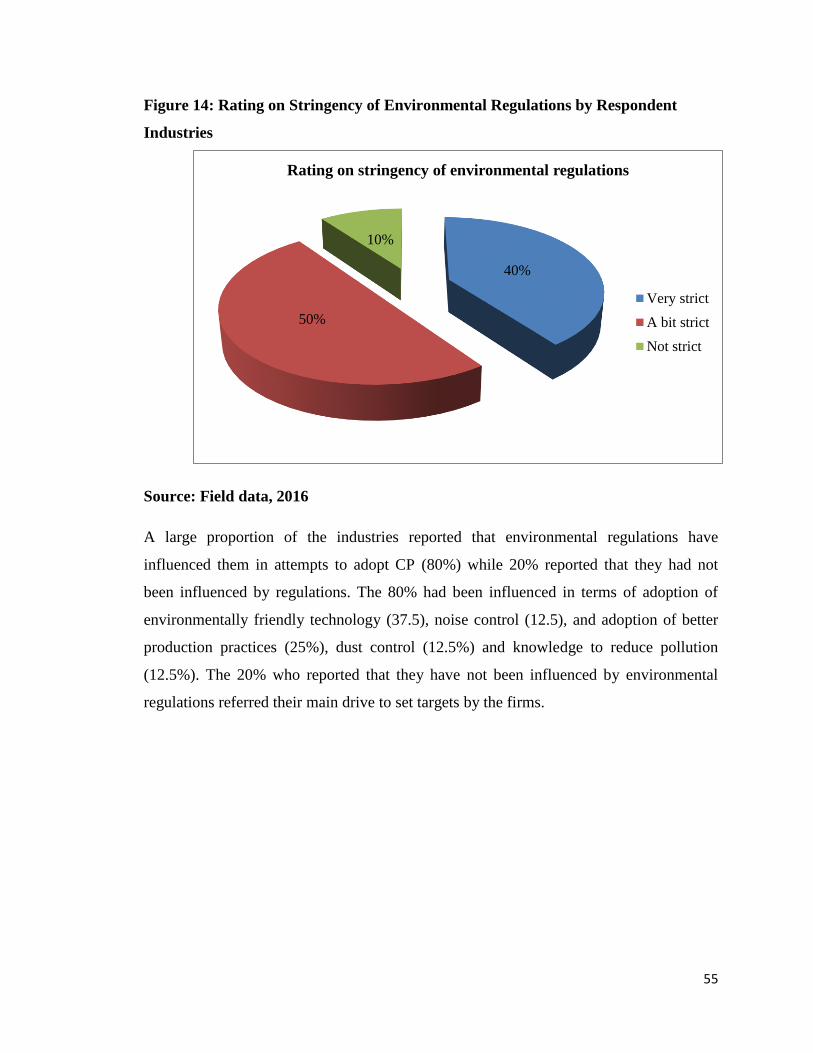
55
Figure 14: Rating on Stringency of Environmental Regulations by Respondent
Industries
Source: Field data, 2016
A large proportion of the industries reported that environmental regulations have
influenced them in attempts to adopt CP (80%) while 20% reported that they had not
been influenced by regulations. The 80% had been influenced in terms of adoption of
environmentally friendly technology (37.5), noise control (12.5), and adoption of better
production practices (25%), dust control (12.5%) and knowledge to reduce pollution
(12.5%). The 20% who reported that they have not been influenced by environmental
regulations referred their main drive to set targets by the firms.
40%
50%
10%
Rating on stringency of environmental regulations
Very strict
A bit strict
Not strict

56
CHAPTER FIVE
SUMMARY OF FINDINGS, CONCLUSIONS AND RECOMMENDATIONS
5.1 Introduction
This chapter gives a summary of research findings, conclusions and recommendations
made to policy makers as well as for further research.
5.2 Summary of Findings
The industries studied were under the following sub-sectors: chemical and allied (30%),
food and beverage (30%), energy electrical and electronics (10%), leather and tanning
(10%), metal and allied (10%); and pharmaceutical and medical equipment (10%). 80%
of the industries sell their products both locally and internationally. Chemicals and acid
oil formed the major raw materials in the studied industries (40%), while bleaching earth
and waste water were part of the major waste products (33.3% and 31% respectively).
30% of the industries had adopted environmentally friendly practices even before the
KNCPC started its operations. 70% adopted CP after 2001. All industries had received
information on CP from KNCPC. Good housekeeping as a CP practice had been
implemented by all the industries surveyed though at varying extents. Some CP practices
hadn’t been incorporated at all in some of the industries: adoption of new technology in
10% of the industries, Re-design of products and onsite recycling in 20% of the
industries. It was also noted that only 10% of the industries utilize rainwater in their day
to day operations through harvesting. However, 70% of the industries had noted positive
changes in water consumption trends since CP adoption. The major water conservation
measures included ETPs (in 40% of the industries) and water recycling (20%). 60% of
the industries reported that cost savings through water and energy consumption had had a
strong influence on their attempts to adopt CP. As far as energy consumption was
concerned, only 20% utilized solar energy. However, all industries had adopted various
energy conservation measures.
CP benefits that were experienced by over 40% of the industries included: reduced costs
of raw materials, occupational safety expenses, energy consumption and waste discharge;
improved corporate image and staff morale; reduced environmental accidents; production

57
efficiency gains and improved quality of products. Significant challenges in adoption and
implementation of CP included: financial constraints, lack of a national CP policy, lack
of effective accounting systems to quantify financial performance of CP projects, low
level of awareness on good environmental practices and their benefits and pressure to
make short-term profits.
The most significant determinants of CP adoption among the industries were pressure of
environmental regulations, expected business profits/ cost savings and human capital.
High impacts of CP implementation on the industries studied were: environmental
protection through reduction of emissions, energy and water conservation, waste
recycling and increased profitability in relation to competitors.
5.3 Conclusions
On cleaner production adoption and implementation in industries, it’s clear that the
practice has not been widely implemented in the country. The industries that have
incorporated some CP aspects in their operations have not fully implemented some
practices like recycling; technology change and products redesign which are very
relevant. Majority of industries also do no harvest rainwater nor utilize solar energy.
The lack of a national CP policy remains to be a big setback. Other challenges like lack
of effective accounting systems and financial constraints were found to have a significant
influence on CP practices such as onsite recycling, changes in raw materials, technology
change and products re-design. This probably explains why these CP practices haven’t
been implemented at all in some of the industries.
The lack of awareness on environmental standards such as the ISO 14000 series was
evident, which bear a major contribution to environmental and economic components of
SD and TBL including benefits such as; reduced raw materials/resource use, reduced
energy consumption, improved process efficiency, reduced waste generation and disposal
costs and utilization of recoverable resources. Apart from the ISO standards discussed in
the previous chapter, there are other upcoming standards such as ISO 14045 which will
provide guidelines on eco-efficiency assessment principals and requirements, ISO 14051
on principals and framework for Material Flow Cost Accounting, ISO 14067 on carbon

58
footprint of products (quantification and communication of GHGs associated with
products) and ISO 14006 which will provide guidelines on eco-design (ISO, 2016)
5.4 Recommendations
5.4.1 Policy Makers
The fact that there is no CP policy in Kenya is a matter of concern and is an issue of
significance according to this study. CP need not be a voluntary procedure in the country
for maximum realization of social, economic and environmental benefits. There needs to
be some rule guiding all manufacturing industries regarding this issue as adopted in
China in the year 2003.Policy makers also need to look into the regulatory framework
governing industries as some regulations are in conflict. EMCA, for example, has some
components that are in conflict with EIA regulations.
KNCPC should partner with organizations such as UNEP, ADB, World Bank, etc, to
source funding, technology and human capital required so that their operations can reach
out to a higher number of industries bearing the fact that the researcher only had 15
manufacturing industries only that have worked with KNCPC in the whole of Nairobi
region.
The Ministry of Environment needs to work closely with the industries and provide more
information on CP. Not many of the industries surveyed had received instructions from
the ministry. The ministry together with bodies like NEMA need to work hand in hand to
ensure that all environmental regulations are adhered to as some industries felt that the
stringency is not strong. In addition to this, the government needs to see to it that
industries have been provided with the right incentives they need in order to comfortably
adopt and implement CP. Majority of the industries pointed out lack of government
incentives as a major challenge.
The policy makers should collaborate with the Kenya Association of Manufacturers
(KAM) because this body is in the best position to influence policy making on behalf of
the industries. KAM should also find ways of influencing its members to adopt clean
energy such as solar energy and also alternative sources of water like rainwater
harvesting which this study found missing in most of the industries.

59
5.4.2 Further Research
There exists scarce empirical research on the aspect of CP; hence more studies are
paramount. This study didn’t consider aspects such as emissions and waste generation
quantities. Thus, studies are necessary to establish the influence of CP on emission
reduction and waste reduction. Moreover, studies need to be conducted on the role of CP
in improving OHS in industries and also Economic Impacts of CP on industries; among
others.

60
REFERENCES
Babilas, R., Nowosielski, R. & Pilarczyk, W. (2007). Sustainable Technology as a Basis
of Cleaner Production. Journal of Achievements in Materials and Manufacturing
Engineering, Vol. 20, Issues 1-2. International OSCO World Press, Poland.
Bach, L. B. V. & Gheewala, S. H., (2010). CP Options at a Coal Preparation Facility in
Vietnam, Journal of Sustainable Energy and Environment 1 (2010), 41-46.
Barczewski, B. (2013). How Well do Environmental Regulations work in Kenya? A Case
Study of the Thika Highway Improvement Project. Centre for Sustainable Urban
Development; Earth Institute, Columbia University & UoN, DoGES.
Belin, J., Horbach J. & Oltra V. (2011). Determinants and Specificities of Eco-
Innovations: An Econometric Analysis for the French and German Industry based on the
Community Innovation Survey, Cahiers du GREThA.
Blackman, A. & Arne K. (2010). Clean Technological Change in Developing Country
Industrial Clusters: Mexican Leather Tanning. Environmental Economics and Policy
Studies 2010 (12): pp 115-132.
CCN (2007). City of Nairobi Environment Outlook. City Council of Nairobi, UNEP and
the United Nations Center for Human Settlements (UN HABITAT).
Dandira, V., Mugwindiri K. & Chikuku, T. (2012). A Cleaner Production Exercise of a
Leather Manufacturing Company: A Zimbabwean Experience. International Journal of
Scientific and Technology Research, Vol. 1, Issue 11, pp 97-101.
Dubey, R. et al., (2014). Exploring the relationship between Leadership, Operational
Practices, Institutional Pressures and Environmental Perfomance: A Framework for
Green Supply. International Journal of Production Economics, pp 1-13.
European Commission (2015). Eco-Innovation, www.ec.europa.eu accessed on 16th April
2015.
Frondel, M., Horbach J. & Rennings K. (2009). End- of- Pipe or Cleaner Production? An
Empirical comparison of Environmental Innovation Decisions Across OECD Countries,
ZEW Discussion Papers, No. 04-82.
Furnish, A., Kay, A. & Xia S. (2013). Evaluation of Triple Bottom Line Impacts of
Resourceful Communities’ Creating New Economies Fund. Master of Environmental
Management Project, Nicholas School of the Environment, Duke University.

61
GDRC, (2015). Sustainability Concepts: Cleaner Production. Accessed at
www.gdrc.org/sustdev/concepts on17th February 2015.
GoK, (2010). Kenya National Industrialization Framework, Ministry of Industrialization,
Draft Five. Government Printer, Nairobi.
GoK, (2012). Mainstreaming Kenya’s National Climate Change Action Plan into the
Manufacturing Sector. Government Printer, Nairobi.
GoK, (2013). National Environment Policy, 2013. Ministry of Environment, Water and
Natural Resources, Republic of Kenya.
GoK, (2015). Environmental Management and Coordination (Amendment) Act,
Government Printer, Nairobi.
Horbach, J., Rammer C. & Rennings K. (2011). Determinants of Eco-Innovations by
Type of Environmental Impact, The Role of Regulatory Push/Pull, Technology Push and
Market Pull. ZEW Discussion Papers, No. 11-027
IUCN, (2006). The Future of Sustainability; Re-thinking Environment and Development
in the 21st Century. Report of the IUCN Renowned Thinkers Meeting, 29-31 January.
ISO, (2016), Environmental Management; the ISO 14000 Family of International
Standards. Accessed at www.iso.org on 1st July 2016.
ITC, (2012). 5S: Good Housekeeping Techniques for Enhancing Productivity, Quality
and Safety at the Workplace. Export Quality Bulletin, No. 89.
KAM (2012). KAM’s Industrial Business Agenda- Proposals to the Incoming
Government for Delivery of Competitive Manufacturing in Kenya Post 2012.
Kesidou, E. & Demirel, P. (2010). On the Drivers of Eco-Innovations: Empirical
Evidence from the United Kingdom, Paper Presented at the Summer Conference on
“Opening Up Innovation: Strategy, Organization and Technology” at Imperial College of
London Business School, June 15-18.
Kithika, J. (2016). Environmental Laws in Kenya. SUSBIZ Kenya, Partnerships for
Sustainable Business Development. Accessed on 1st July 2016 at
www.apps.unep.org/publications.
KNCPC, (2004). Mainstreaming CP and Sustainable Consumption in Lake Victoria
Basin Development Program, Proceedings of the First East African Roundtable on
Sustainable Consumption and Production, 6-7 Dec, Kisumu, Kenya.
KNCPC, (2014). Regional Industry RECP Award Winners Announced. Press Release.
62
Lozano, R. (2008). Envisioning Sustainability Three-Dimensionally. Journal of Cleaner
Production 16, pp 1838-1846. Elsevier Ltd.
Luken R. A. & Rompaey V. F. (2007). Environment and Industry in Developing
Countries; Assessing the Adoption of Environmentally Sound Technology. UNIDO,
Vienna, Austria.
Luken, R. A. & Rompaey, V. F. (2008). Drivers for and Barriers to Environmentally
Sound Technology Adoption by Manufacturing Plants in Nine Developing Countries.
Journal of Cleaner Production, Vol. 16 Issue 1, pp 567-577.
Mputhia, J., Mukulu, E. &Keriko J. (2012). Awareness as a Determinant of Compliance
with Environmental Regulations by Micro and Small Enterprises in the Manufacturing
Sector in Nairobi, Kenya, International Journal of Applied Science and Technology, Vol.
2 No. 6, June 2012.
M’ribu, J. M. (2006). A Study of Waste Management Approaches in Tea Processing
Factories: A Case Study of Small holder Tea Factories in Kenya. MA Research Project,
Department of Geography and Environmental Studies, University of Nairobi.
Murovec, N., Erker, R. & Prodan I. (2012). Determinants of Environmental Investments:
Testing the Structural Model. Journal of Cleaner Production, Vol. 37, Dec 2012, pp 265-
277.
Mwithalii, L.M. (2009). The Role of Cleaner Production in Enhancing Water Use
Efficiency in the Manufacturing Industry: A case Study of Central Glass Industries Ltd
and EABL, Nairobi. MA Research Project, Department of Geography and Environmental
Studies, University of Nairobi.
NEMA, (2010a). Water Quality Regulations, 2006 Information Handbook.
NEMA, (2010b). Waste Management Regulations, 2006 Information Handbook.
NEMA, (2012). Green Initiatives in Kenya, NEMA.
Ninlawan, C., Seksan, P., Tossapo, K. and Pilada W. (2010). The Implementation of
Green Supply Chain Management Practices in Electronics Industry, Proceedings of
International Multi-Conference of Engineers and Computer Scientists, Vol III, March 17-
19, Hong Kong, pp 1563-1568.
OECD, (2014). Glossary of Statistical Terms. Accessed at www.stats.oecd.org/glossary
on 27th November 2014.

63
Omwenga, M. (2010). Nairobi-Emerging Metropolitan Region: Development Planning
and Management Opportunities and Challenges. Nairobi Metropolitan Region, 46th
ISOCARP Congress.
Ondieki, J. M. (2013). Assessment of the adoption and Level of Implementation of
Cleaner Production by Star-rated Hotels in Nairobi County, Kenya. MA Research
Project. Department of Geography and Environmental Studies, University of Nairobi.
Orawo, P. (2016). The influence of KAM on Environmental Law and Energy and
Environmental policies in Kenya. CSO Case Study 2, Research and Policy in
Development, Overseas Development Institute.
Pablo Del Rio, (2013). Analysing Firm-Specific and Type-Specific Determinants of Eco-
Innovation, Paper Presented at the 35th DRUID Celebration Conference 2013, Barcelona-
Spain, June 17-19.
Peng, S., Liu, Y., Shi, H. & Zhong, P. (2005). Studies on Barriers for Promotion of Clean
Technology in SMEs of China. Chinese Journal of Population, Resources and
Environment, Vol 3 (1) pp 9-17.
Robson, C. (2002). Real World Research, 2nd Edition. Oxford: Blackwell.
SECO/SBA-RSS-FHNW (2007). Cleaner Production Excellence Model. Accessed at
www.sba-int.ch on 1st December 2014.
Schaltegger, S., Bennet M., Burritt R. & Jasch C. (Eds), 2008. Environmental
Management Accounting as a Support for Cleaner Production. Eco-efficiency In Industry
and Science, Vol 24, pp 3-26.
Slaper, T. & Hall, T. (2011). The Triple Bottom Line: What Is It and How Does It Work?
Indiana Business Review, Indiana University School of Business.
Shi, H., Peng, S., Liu, Y. & Zhong, P., (2008). Barriers to Implementation of Cleaner
Production in Chinese SMEs: Government, Industry and Expert Stakeholders’
Perspectives. Journal of Cleaner Production, Vol 16 (7), pp842-852
Thatcher, A. (2014). Theoretical Definitions and Models of Sustainable Development that
Apply to Human Factors and Ergonomics. In Broberg O., Fallentin N., Hasle P., Jensen
P., Kabel A., Larsen M. and Weller T. (Eds), Human Factors in Organizational Design
and Management-XI, Nordiac Ergonomics Society Annual Conference-46, pp 747-752
Tibaijuka, A. (2009). Nairobi and its Environment, Kenya Atlas Chapter 5
UNEP, (2012a). The Business Case for the Green Economy: Sustainable Return on
Investment. UNEP

64
UNEP, (2012b). The Global Outlook on Sustainable Consumption and Production
Policies: Taking Action Together. UNEP.
UNEP, (2013a). 2012 Annual Report. UNEP.
UNEP, (2013b). Manufacturing. Green Economy and Trade. UNEP.
UNEP, (2014). Green Economy Assessment Report- Kenya. UNEP.
UNEP, (2015). SCP Policies and the 10YFP, accessed at
www.unep.org/resourceefficiency/Policy/SCPPolicies/ on 13th February 2015.
UNEP, (2016). UNEP 2015 Annual Report.
UNIDO, (2015a). What is CSR? Retrieved from www.unido.org/en on 16th April 2015
UNIDO, (2015b). National Cleaner Production Centres 20 Years of Achievement:
Towards Decoupling Resource Use and Environmental Impact from Manufacturing
Growth. United Nations Industrial Development Organization.
UNIDO/UNEP, (2004). Guidance Manual: How to Establish and Operate CPCs, Part 1.
UNIDO/UNEP.
UNIDO/UNEP, (2016a). Kenya National Cleaner Production Center: Resource Efficient
and Cleaner Production Success Story- Chandaria. UNIDO/UNEP.
UNIDO/UNEP, (2016b). South Africa National Cleaner Production Centre. Accessed at
www.unido.org/cp on 22nd July 2016.
WCED, (1987). Our Common Future. Oxford University Press, Oxford.
West, J., Schandl H., Heyenga S. and Chen S. (2013). Resource Efficiency: Economics
and Outlook for China. UNEP, Bangkok, Thailand.

65
APPENDIX 1: SURVEY QUESTIONNAIRE
The purpose of this questionnaire is to obtain information that is relevant to my research
titled “Determinants of adoption of Cleaner Production in Manufacturing Industries: A
study of selected Industries in Nairobi.” Information collected will be used purely for
academic research and will be treated with utmost confidentiality. I humbly request you
to provide the information sought by this questionnaire as candidly as possible.
SECTION I: GENERAL INFORMATION
Name of industry: …………………………………………………………………………
Year of establishment: …………………………………………………………………….
Physical location of Industry: …………………………………………………………….
Total number of staff: …………………………………………………………………….
Position of respondent in Industry: ……………………………………………………….
1. Please select the sub-sector in which your firm belongs and the products you
manufacture (Tick one)
Sub-sector Tick Major Products
Chemical and Allied
Energy, Electrical and
Electronics
Food and Beverages
Metal and Allied
Paper and Board
Pharmaceutical and
Medical Equipment
Plastics and Rubber
Leather and Tanning
Any other (please specify)

66
2. Where are your target customers located? (please tick as appropriate)
Locally ( )
Internationally ( )
Both ( )
3. What are the main raw materials used by the industry for production?
………………………………………………………………………………………
………………………………………………………………………………………
………………
4. What constitutes the major part of the wastes produced by the industry?
………………………………………………………………………………………
………………………………………………………………………………………
SECTION II: CLEANER PRODUCTION AWARENESS AND PRACTICE
1. In which year did the Industry adopt CP?
………………………………………………………………………………………
2. Where did the industry get information on Cleaner Production from? (please tick
as appropriate; you can select more than one option)
i) From the Kenya National Cleaner Production Center (KNCPC) ( )
ii) From Kenya Association of Manufacturers (KAM) ( )
iii) From National Environment Management Authority (NEMA) ( )
iv) From Ministry of Environment and Natural Resources ( )
v) From the internet ( )
vi) From other enterprises ( )
vii) From customers ( )
viii) From environmental consultants ( )
ix) Any other source (please specify)
………………………………………………………………………………
………………………………………………………………………………

67
3. Please indicate the extent to which the following Cleaner Production practices are
adopted in your industry:
(1) Not at all (2) Low (3) Moderate (4) High (5) Very High
CP Practice 1 2 3 4 5 Please explain
briefly how
Good housekeeping
Technology change/
Equipment modification
Redesign of products
Onsite recycling
Changes to raw materials
Any other (please
specify)
4. Which of the following water sources does your industry use? (Please tick as
appropriate. You can select more than one option)
i) Piped water supply ( )
ii) Borehole ( )
iii) Rainwater harvesting ( )
iv) Nearby river/water body ( )
v) Any other (please specify)
………………………………………………………………………
………………………………………………………………………
5. Please explain briefly water consumption trends in your industry since adoption
of Cleaner Production………………………………………………………………
………………………………………………………………………………………
………………………………………………………………………………………
………………………………………………………………………………………

68
6. Please outline the water conservation measures taken by your industry
………………………………………………………………………………………
………………………………………………………………………………………
………………………………………………………………………………………
………………………………………………………………………………………
7. To what extent did cost savings through water conservation influence adoption of
Cleaner Production in your Industry? (Please tick one option)
No influence ( ) Little Influence ( ) Moderate influence ( ) Strong
influence ( )
8. Which of the following energy sources do you utilize in your industry? (please
tick as appropriate. You can select more than one option)
i) National Grid (KPLC) system ( )
ii) Solar energy ( )
iii) Diesel Generators ( )
iv) Any other (Please specify)………………………………………….
………………………………………………………………………
………………………………………………………………………
9. Please describe briefly the trends in energy consumption since adoption of
Cleaner Production in your Industry.
………………………………………………………………………………………
………………………………………………………………………………………
………………………………………………………………………………………
10. Please outline the energy conservation measures taken by your industry
………………………………………………………………………………………
………………………………………………………………………………………
………………………………………………………………………………………
………………………………………………………………………………………

69
11. To what extent did cost savings through energy conservation influence the
adoption of Cleaner Production in your industry? (please tick one option)
No Influence ( ) Little Influence ( ) Moderate Influence ( ) Strong
Influence ( )
SECTION III: CLEANER PRODUCTION BENEFITS AND CHALLENGES
1. What benefits has the industry realised as a result of implementing Cleaner
Production? (please tick as appropriate; you can select more than one option)
i) Reduced costs of raw materials ( )
ii) Reduced Occupational safety expenses ( )
iii) Improved corporate image ( )
iv) Reduced costs of energy consumption ( )
v) Reduced costs of water consumption ( )
vi) Reduced costs of waste discharge ( )
vii) Reduced environmental accidents ( )
viii) Improved staff morale ( )
ix) Access to external markets for products ( )
x) Production efficiency gains ( )
xi) Reduced penalty fee from NEMA ( )
xii) Improved quality of products ( )

70
2. The following table contains challenges faced in adoption and implementation of
Cleaner Production in manufacturing industries. To what extent do they impact on
your industry’s operations in adopting CP? (please tick one option for each
challenge)
(1) No impact (2) Little Impact (3) Moderate impact (4) Strong Impact (5) Very
strong Impact
Challenges to CP Implementation LEVEL OF IMPACT
1 2 3 4 5
Financial Constraints
Low level of awareness on good
environmental practices and their
benefits
Lack of technical and professional
management skills
Pressure to make short-term profits
Lack of effective accounting systems
to quantify financial performance of
CP projects
Lack of incentives/subsidies from
government to encourage CP adoption
Resistance to change by Industry’s top
management and staff
Poor record keeping on water and
energy consumption as well as
emissions
Lack of a national CP policy in Kenya

71
SECTION IV: DETERMINANTS AND IMPACTS OF ADOPTION OF CLEANER
PRODUCTION
1. Below are determinants for adoption of Cleaner Production in manufacturing
industries. Which ones apply for your industry? Please rate them on a scale of 1-5
(1 being the least significant and 5 the most significant)
DETERMINANTS
LEVEL OF SIGNIFICANCE
1 2 3 4 5
Pressure of Environmental
regulations
Expected business profits/cost
savings
Customer pressure
Firm’s technological capability
Firm’s human capital
Corporate Social responsibility
Expected corporate image
improvement
Subsidies/incentives from
government
Pressure from industrial associations
Pressure from surrounding
community to adopt environmentally
friendly measures
Learning from other enterprises
Supply chain pressure
Pressure from environmental
organizations

72
2. Below are some of the impacts from implementation of cleaner Production in
manufacturing industries. Please indicate the impact in your industry as a result of
adopting CP (please tick one for each impact)
(1) Not at all (2) Low (3) Moderate (4) High (5) Very High
IMPACT
LEVEL OF IMPACT
1 2 3 4 5
Environmental protection
through reduction of
emissions
Energy conservation
Waste recycling
Water conservation
Green product design
Increased training costs
Increased costs of purchasing
environmentally friendly
materials and equipment
Increased investments
Increased profitability in
relation to competitors

73
SECTION V: COMPLIANCE AND REGULATIONS
1. Does your company have a well-defined environmental policy?
Yes ( ) No ( )
2. If your answer to (1) above is Yes, is every employee aware about the firm’s
environmental policy?
Yes ( ) No ( )
3. Does your industry comply with any environmental standards (e.g. ISO 14001)?
If Yes, which ones and for how long have you been able to comply?
………………………………………………………………………………………
………………………………………………………………………………………
4. When was the last environmental audit done?
………………………………………………………………………………………
………………………………………………………………………………………
5. How can you rate the stringency of environmental regulations on industries?
(please tick one)
Not strict ( ) A bit strict ( ) Very strict ( )
6. Have the environmental regulations influenced your industry in attempts to adopt
Cleaner Production? If so, how?
………………………………………………………………………………………
………………………………………………………………………………………
………………………………………………………………………………………
THANKS FOR YOUR PARTICIPATION

74
APPENDIX 2: FREQUENCY TABLES
products the company manufactures
Frequency Percent Valid
Percent
Cumulative
Percent
Valid
detergents 2 20.0 20.0 20.0
edible oils 2 20.0 20.0 40.0
maize and wheat flour 1 10.0 10.0 50.0
hides and skins 1 10.0 10.0 60.0
electrical products 1 10.0 10.0 70.0
electroplating 1 10.0 10.0 80.0
pharmaceuticals 1 10.0 10.0 90.0
plants and animal
chemicals 1 10.0 10.0 100.0
Total 10 100.0 100.0
main raw materials used by the industry
Frequenc
y
Percent Valid
Percent
Cumulative
Percent
Valid
chemicals and acid oil 4 40.0 40.0 40.0
crude
palm/corn/sunflower
oil
2 20.0 20.0 60.0
maize and wheat 1 10.0 10.0 70.0
metal anodes 1 10.0 10.0 80.0
hides and skins and
hydroxides 1 10.0 10.0 90.0
electrical switches and
cables 1 10.0 10.0 100.0
Total 10 100.0 100.0

75
major waste products in the industry
Frequenc
y
Percent Valid
Percent
Cumulative
Percent
Valid
bleaching earth 3 30.0 33.3 33.3
waste water 1 10.0 11.1 44.4
scrap metal 1 10.0 11.1 55.6
bio protein 1 10.0 11.1 66.7
organics 1 10.0 11.1 77.8
husks 1 10.0 11.1 88.9
poly ethene and fatty
acid distillate 1 10.0 11.1 100.0
Total 9 90.0 100.0
Missing System 1 10.0
Total 10 100.0

76
Appendix 3: Plagiarism Report

77
Appendix 4: Declaration of Originality Form

78
Appendix 5: Research Permit

79