DETAILED PROJECT REPORT FOR 2G COVERAGE …usof.gov.in/usof-cms/GagendaPdf/2014 02 21 DPR North...
34
1| Page DETAILED PROJECT REPORT FOR 2G COVERAGE IN UNCOVERED VILLAGES OF NORTH EASTERN STATES Prepared by: TELECOMMUNICATIONS CONSULTANTS INDIA LTD. (A Govt. of India Enterprise) TCIL Bhawan, Greater Kailash - I, New Delhi - 110 048. Telephone: 011 - 26202020 Fax: 011 - 26242266
Transcript of DETAILED PROJECT REPORT FOR 2G COVERAGE …usof.gov.in/usof-cms/GagendaPdf/2014 02 21 DPR North...

1 | P a g e
DETAILED PROJECT REPORT
FOR
2G COVERAGE IN UNCOVERED VILLAGES
OF NORTH EASTERN STATES
Prepared by:
TELECOMMUNICATIONS CONSULTANTS INDIA LTD.
(A Govt. of India Enterprise)
TCIL Bhawan, Greater Kailash - I, New Delhi - 110 048.
Telephone: 011 - 26202020 Fax: 011 - 26242266

2 | P a g e
Contents1. EXECUTIVE SUMMARY ..........................................................................................................................4
2. STRUCTURE OF THE REPORT.................................................................................................................8
3. TELECOM SCENARIO IN NORTH EAST ................................................................................................... 9
3.1 Introduction .................................................................................................................................. 9
3.2 Gap in 2G Coverage in villages of NER ..........................................................................................9
3.3 USOF Support................................................................................................................................9
4. METHODOLOGY OF 2G COVERAGE IN NER.........................................................................................10
4.1 Introduction ................................................................................................................................10
4.2 Assumptions................................................................................................................................12
4.3 References: .................................................................................................................................13
4.4 Methodology:..............................................................................................................................13
4.4. 1 Choice for low power BTS: ......................................................................................................13
4.4. 2 BSS planning............................................................................................................................14
4.4. 3 Backhaul ..................................................................................................................................16
4.4. 4 BSNL Satellite Network Backhaul in Northeast.......................................................................17
4.4. 5 Power calculation....................................................................................................................18
4.4. 6 Infrastructure ..........................................................................................................................19
4.4. 7 System configuration ..............................................................................................................19
4.4. 8 Cost .........................................................................................................................................20
4.5 CAPEX:.........................................................................................................................................23
4.6 Key observation ..........................................................................................................................27
4.7 Recommendation........................................................................................................................28
5. ANNEXURE 1 .......................................................................................................................................29
5.1 Project Cost Summary.................................................................................................................29
5.2 2G Coverage in Arunachal Pradesh and 2 Dist. Of Assam ..........................................................30
5.3 2G Coverage in other areas of NER.............................................................................................31
5.4 2G Coverage along NH ................................................................................................................32
5.5 Tax break Up ...............................................................................................................................33
5.5.1 Tax break up for Arunachal Pradesh and 2 Dist. Of Assam.................................................33
5.5.2 Tax break Up for National Highways (in Arunachal Pradesh) ..................................................33
5.5.3 Tax break Up for National Highways ( Rest of NER-NH) ............................................................34

3 | P a g e
5.5.4 Tax break Up for rest of Villages ................................................................................................34
4 | P a g e
1. EXECUTIVE SUMMARY
Introduction:
TCIL was approached by USOF Administrator vide Letter D.O No 30-119-1/2013 –USF dated 1stNov 2013 for preparing a DPR in accordance with TRAI Recommendations dated Sep 2013 forTelecom Infra-structure Augmentation in the North Eastern States including Sikkim and Assam.
TCIL studied the above mentioned TRAI Recommendations. Based on the study and variousmeetings that were held with USOF officers in Nov 2013 the scope of DPR was finalized.
The three verticals to be addressed in the study for North East Region (NER) is as follows:
1. Providing 2G coverage to the villages that are uncovered by any Telecom ServiceProvider (TSP).
2. Providing 2G coverage to the uncovered National Highway (NH) network of North East.3. Providing redundancy and diversity for the optical media from SHQ to DHQ and inter-
state capitals connectivity.
The North east region comprises of 45,221 villages out of which 9,091 villages are uncoveredfor mobile communication. TRAI report study and broad analysis have given their assessmenton the above three vertical.
TCIL has carried out a desk top analysis for estimation of the mobile infrastructure deploymentand enhancement of optical fiber media redundancy, diversity and capacity to support thecommunication network. This report covers the 2G coverage for the uncovered villages ofNER including Sikkim, a total of 8 States.
As a part of the study, optimization of the mobile network with respect to number of BTS hasbeen carried out for determination of the capital cost. Optimization has been done by formingsuitable clusters of the villages for installation of the BTS for mobile coverage. The details ofthe estimates are covered in the subsequent chapters and are summarized below.
CAPEX ESTIMATION
The capital expenditure required to build infrastructure for 2G coverage in the uncoveredvillages of NER is tabulated below. The capital expenditure has been calculated based on theitems required for setting up the BTS site which includes evaluated BTS equipment (2, 2/2 and2/2/2 TRX) as per the site requirements, tower & antenna, power infrastructure to support theBTS covering Solar panels, batteries (with 3 days autonomy) as well as DG supply and backhaulequipment along with accessories. The backhaul has been covered through Optical, microwave

5 | P a g e
and satellite communication media. The quantities of the optical, microwave and satellitemedia have been assumed as per the proportion in TRAI report.
A. 2G COVERAGE IN NER uncovered villages
CAPEX (without Taxes)
S. No. State No. of BTS Cost (Rs. Crores)1 Arunachal Pradesh 1893 746.872 Assam 1874 812.633 Manipur 384 168.314 Meghalaya 2162 884.875 Mizoram 227 104.856 Nagaland 112 58.037 Sikkim 19 8.948 Tripura 2 1.06
Total 6,673 2,785.56
Note:1. The CAPEX calculated above does not include the survey cost. Therefore, 10%
additional cost over and above the estimated CAPEX, may be considered for survey.2. The detailed cost tables showing CAPEX, survey and OPEX are placed at Annexure 1.
The basis of the cost of telecom equipment have been taken from vendor costs, Ministry ofRenewable energy and BSNL tender No CA/NOW-CM/LWE-BSS/T-445 for setting up of 2Ginfrastructure in 9 states. The desktop analysis details have been covered in chapter 4 of thereport.
BSNL is using Satellite technology for the backhaul in northeast region for the mobile networkwhich has been detailed in section 4.4.4 of the report. The cost of supply, installation,operations and time to roll out is economical with reference to other media. The overallcapacity assessment of the satellite network of BSNL shall be required for meeting the overallneeds of the NER.
OPEX
On an average OPEX per year can be taken as 20% of capex cost. Such cost includes AMCcharges, Bandwidth charges per year, manpower, drive test and optimization, regular sitemaintenance, diesel etc.

6 | P a g e
Comparison with TRAI Report:
Based on the study by TCIL and optimization, the comparison with respect to TRAI report istabulated as under:
Mobile coverage comparison of uncovered villages
BTS Type AntennaHeight
In meter
TRXPower(Watt)
No. of TRX No. of Village No. of BTSrequired/cost
TCIL TRAI TCIL TRAI TCIL TRAI TCIL TRAI TCIL TRAI TCIL TRAI
A1 A1 20 20 5 2 2 2 8,621 3,142 6,673with INR2,785.56
Cr.
3316withINR
1725Cr.
A2 A2 30 20 5 5 2 2B B 30 30 10 10 2/2 2C C 30 40 10 20 2/2/2 2+2+2
Based on the above following may be noted:
1. TRAI report has considered villages with population greater than 250 only whereas TCILhas taken all uncovered villages having inhabitants into consideration.
2. NE SAC data has been available for 8,621 out of 9,091 uncovered villages as mentioned inTRAI report.
3. Total number of BTS estimate to cover 8,621 uncovered villages has been estimated to be6,673 at a cost of Rs. 2,785.56 crores which comes to average of Rs. 41.74 lakhs per BTS.

7 | P a g e
Total Project Cost
The Total project Cost is tabulated below:
S.No. TITLE CAPEX Tax Survey@ 10%
ofCAPEX
Centage@ 10%
onCAPEX
TotalCAPEX
OPEX for5 years
Tax @12.36%
Centage@ 10%
onOPEX
TotalOPEX
TOTAL(CAPEX &
OPEX)
1 2G Coverage inArunachal Pradesh and2 Dist. Of Assam
1,073.62 89.78 107.36 107.36 1,378.12 1,073.62 132.70 107.36 1,313.68 2,691.80
2 2G Coverage in otherareas of NER
1,711.96 85.60 171.20 1,968.75 1,711.96 211.60 1,923.55 3,892.30
3 2G Coverage along NH 97.37 7.04 9.74 114.15 97.37 12.03 109.40 223.55
4 Transmission MediaPlan (all tax inluded)
295.52 295.52 295.52
TOTAL (in Rs. Crores) 3,178.47 182.42 288.29 107.36 3,756.54 2,882.95 356.33 107.36 3,346.64 7,103.18

8 | P a g e
2. STRUCTURE OF THE REPORT
The broad structure of report is as follows:
Chapter 1 provides executive summary of the 2G coverage in villages of NER carried out. Itbriefly explains the key results arrived after doing analysis.
Chapter 2 defines the structure of the report.
Chapter 3 details the generic Telecom status of NER with respect to 2G coverage in uncoveredvillages.
Chapter 4 details the Assumptions, references, methodology, key tables , analysis andrecommendation of the study for 2G coverage study in villages of NER.
Supporting Tables and Annexure.

9 | P a g e
3. TELECOM SCENARIO IN NORTH EAST
3.1 IntroductionThe country has seen a phenomenal growth in the availability of economical telecomservices. People from all sections of the population are now using mobile telephone andaccessing the internet for viewing/retrieval of information and e-mail.However among the various states of India, it is seen that there is a substantial gap inthe tele-density in the states of NER. As the whole country is moving towards NextGeneration Network and data dominated services, there are villages in NER which donot have 2G coverage to date.
3.2 Gap in 2G Coverage in villages of NERThe analysis of uncovered villages in NER vis-à-vis the other states of country shows thatthere is a huge gap. Arunachal Pradesh has the highest 55.9% (reference TRAI report)uncovered villages, followed by Meghalaya (38.1%), Mizoram (32.3%), Manipur (24.3%).The gap in NER is wide, despite of the high targets set in the telecom plan and efforts ofgovernment.
In general the reason for low tele-density and gap in telecom coverage in NER is the highCAPEX and OPEX requirement for establishment of telecom infrastructure. The reason isNER states have tough terrain and LWE prone areas, which increases the fiber layingcost, maintenance and ROW permissions. BTS deployment cost also increases becauseof inadequate power availability which increases the diesel consumption to run a site.These issues result in more investment with low rate of return and high operatingexpenses. This unattractive business model discourages the telecom operators inentering the remote areas of NER.
3.3 USOF SupportThe USOF has already recognized the gap as mentioned above and has provided subsidyin many projects of NER under wireline and wireless schemes which covers thetransmission media network, shared passive BTS rollout in uncovered parts, rollout ofDirect Exchange lines (DELs) and provision of access equipments etc.
Presently, the rollout of OFC and Transmission network is going on in NE and Assam byRailTel and BSNL which covers the district to sub-district connectivity in ring. NOFNproject, also funded by USOF covers the Sub-district to Gram Panchayat Connectivity.The rollout of same is also under progress.
The current study conducted by TRAI on request of DOT has analyzed the gap andcovered it in four categories.
This report covers 2G coverage in uncovered villages of NER.

10 | P a g e
4. METHODOLOGY OF 2G COVERAGE IN NER
4.1 Introduction
The section reports on detailed study result on 2G uncovered villages of NER. The studyis based on the analysis made by TRAI in their report dated 26th Sept 2013. Data havebeen collected from various stakeholders to know the actual number of uncoveredvillages in the region. The report states that there are 9,091 uncovered villages out oftotal 45,221 villages in NER and the same can be covered in phased manner.
Purpose of the study is to estimate the number of BTSs with its capacity andinfrastructure required along with the budgetary CAPEX and OPEX for all the uncoveredvillages of NER states. The study shows that the maximum nos. of uncovered villagesexist in states like Meghalaya, Assam and Arunachal Pradesh. These three statesaltogether contributes 89.9% of the total villages. This chapter shows study analysis forarriving at the CAPEX required for providing 2G coverage in all the uncovered villages of
Arunachal Pradesh Assam Manipur Meghalaya Mizoram Nagaland Tripura Sikkim
Below given state wise detail of uncovered villages categorized under inhabitance lessthan 101, less than 251, less than751, less than 2501 and less than4001 and above4000.To be noted that there are 78 nos. of villages having nil population.
Table: 4.1 No. of Villages and Population
Consolidated population type NUMBER OF VILLAGES0 78
BELOW 100 2659>=100&&<=250 2942>250&&<=750 2326
>750&&&<=2500 565>2500&&<=4000 39
ABOVE 4000 12TOTAL 8621

11 | P a g e
NAME OFSTATE
POPULATIONTYPE
NUMBEROF
VILLAGES
ArunachalPradesh
0 1
BELOW 100 1462>=100&&<=250 891>250&&<=750 389
>750&&&<=2500 61>2500&&<=4000 1
ABOVE 4000 0TOTAL 2805
Assam 0 0BELOW 100 602
>=100&&<=250 798>250&&<=750 808
>750&&&<=2500 260>2500&&<=4000 25
ABOVE 4000 10TOTAL 2503
Manipur 0 77BELOW 100 39
>=100&&<=250 190>250&&<=750 157
>750&&&<=2500 61>2500&&<=4000 3
ABOVE 4000 1TOTAL 528
0 0Meghalaya BELOW 100 534
>=100&&<=250 993>250&&<=750 769
>750&&&<=2500 76>2500&&<=4000 2
ABOVE 4000 0TOTAL 2374
Mizoram 0 0BELOW 100 9
>=100&&<=250 36>250&&<=750 134
>750&&&<=2500 70

12 | P a g e
>2500&&<=4000 3ABOVE 4000 0
TOTAL 252Nagaland 0 0
BELOW 100 8>=100&&<=250 33>250&&<=750 59
>750&&&<=2500 29>2500&&<=4000 5
ABOVE 4000 0TOTAL 134
Tripura 0 0BELOW 100 0
>=100&&<=250 0>250&&<=750 0
>750&&&<=2500 2>2500&&<=4000 0
ABOVE 4000 0TOTAL 2
Sikkim 0 0BELOW 100 5
>=100&&<=250 1>250&&<=750 10
>750&&&<=2500 6>2500&&<=4000 0
ABOVE 4000 1TOTAL 23
It is mandated by TRAI that there be complete 2G coverage in each inhabited village ofthe above states in North Eastern region.
4.2 AssumptionsThe broad assumptions taken while calculating the CAPEX requirement in this report areas follows:
a.) GSM 900MHz was taken for study as GSM is most wide spread technology in NE,however the TSPs can go for CDMA technology also.
b.) Keeping in mind the topography of North East area, village was treated as dense forestand hilly areas where line of sight is limited to maximum of 4.4 Km.

13 | P a g e
c.) Gram Panchayat is taken as POP (Point of Presence) for optical backhaul connectivitybetween BTS and BSC. The assumption is based on the BBNL Gram Panchayat last mileconnectivity project.
d.) Cost of Land is not considered for CAPEX calculation as it is understood that land will beprovided by state government.
4.3 References:The reference documents used are,
a.) TRAI recommendations dated Sep 2013.b.) Report on USOF scheme for uncovered villages and National Highways.c.) The NE SAC, Shillong GIS data base made available with the name of uncovered villages
and Gram Panchayats.d.) Cost Reference: budgetary vendor costs, Ministry of Renewable energy and BSNL tender
No CA/NOW-CM/LWE-BSS/T-445 for setting up of 2G infrastructure.
4.4 Methodology:The GIS data was studied and analyzed and based on design guidelines the numbers ofsite for BTS location were arrived at. Unlike TRAI report, where ever possible cluster ofvillages were taken together and treated as a single unit with respect to radio coverage.Villages which are nearby within 2 Km range are taken together to form a cluster.
4.4. 1 Choice for low power BTS:For NER we concluded that low power outdoor BTS will be more suitable for thefollowing regions as given below:
Key Statistics of North Eastern region – Scattered & low population density – hence TRX capacity required is less. Radio coverage not more than 3 Km for population distribution, Line Of Sight
(LOS) is less. Monsoon period is larger & severe. Low availability of grid power.
Constraint with conventional BTS- Power consumption is more (4 to 5 times). More Power Requirement implies
Larger capacity Battery More no. of Solar panels DG set bigger capacity
Area required for shelter is more

14 | P a g e
Running cost of DG is higher (More pollution of sound and air raises localobjections)
Comparative Benefit with Low Power BTS in NER- Less OPEX Provides Robust outdoor unit BTS uptime more
4.4. 2 BSS planningWhile planning low power BTS (micro BTS) were consider as power requirement is thekey factor for areas without grid power. BTS was categorized as per coverage andpopulation followed by antenna height and wattage rating of TRX. Limitation of DOT formaximum radiation of 43 dBm was taken care and thus distance was limited to 4.4 KMat maximum though the North East topography was the main constraint for smalldistance coverage. Instead of considering villages as rural area we treated villages asdense forest and calculated radio coverage based on Okumura-Hata model (GM900MHz). Other parameters were taken as standards followed in link budgetcalculation.
In cases where backhaul on microwave is required, to get Line of sight (LOS) the towerlocation need to be shifted away from the target population. The minimum TRX powerof 5 Watt is taken in such cases as against the ideal need of 2Watt TRX power, so as tocover the village even from a distance. The actual survey shall decide the TRX powerand where ever possible TRX power radiation may be reduced below 5 watt so as toavoid unnecessary radio radiation. For all types of BTS, nos. of TRX was calculatedkeeping GPRS/EDGE provision of at least 128 Kbps. Below given are the BTS categorieswith respect to Antenna height and TRX watt rating. For deriving required TRX value fora particular site following are assumed.
1. GoS (Grade of Service) = 2%.2. Call rate= 20% of population of calls per hour in TCBH.3. Erlang required= average of 25 milliErlang per call.4. Erlang Table B used for channel calculation.

15 | P a g e
Table-4.2 Details of Type of BTSS.
No.
Tota
l pop
ulat
ion
per
villa
ge
No.
of u
seri
n TC
BHho
ur
Traf
fic U
se (E
RLAN
G)
No.
of C
hann
els r
efer
.Er
lang
B ta
ble
No
of T
RX a
ctua
llyre
quire
d du
e to
popu
latio
n di
strib
utio
n
TRX
pow
er
Dist
ance
in K
m
Ante
nna
Heig
ht
No
of M
icro
BTS
Requ
ired
Pow
er
Ante
nna
Gai
n
Expe
cted
cov
erag
ear
ea p
roba
bilit
y
BTS
Cate
gory
1 100 20 0.5 3 2 5 3.02 20 1 150
18dBi 95%
A12 250 50 1.25 5 2 5 3.02 20 1 150 A13 500 100 2.5 7 2 5 3.68 30 1 150 A24 750 150 3.75 9 2 5 3.68 30 1 150 A25 1000 200 5 10 2/2 10 4.47 30 2 350 B6 1500 300 7.5 14 2/2 10 4.47 30 2 350 B7 2000 400 10 17 2/2 10 4.47 30 2 350 B8 2500 500 12.5 20 2/2 10 4.47 30 2 350 B9 3000 600 15 23 2/2/2 10 4.47 30 3 525 C
10 3500 700 17.5 25 2/2/2 10 4.47 30 3 525 C11 4000 800 20 28 2/2/2 10 4.47 30 3 525 C
Note: The above categories are derived using Okumura-Hata radio propagation model for900MHz GSM considering Dense forest, considering actual design criteria.
BTS types have been taken basically of 2 types, as given for Highway solution. One typewith TRX rating of 5 Watt and the other type is of 10 Watt. Rest of the types are derivedhaving combinations of the above 2 types. Like B type is 2 nos. of 10 watt BTS and C typeis 3 nos. of 10 watt BTS.” For BSC planning micro BSC’s ware considered for lesser powerrequirement and portable size. Such BSC’s have upto 50 TRX capacity and can be easilycommissioned at remote sites like NE area. Cost of BSC along with its powerrequirement have been built up on BTS cost on per TRX basis. Similarly cost of OMC-R isalso build upon BTS cost. There is no need for a separate NOC to be established.
Types of BTS, quantity wise is given below:
S. No. BTS Type Numbers of BTS Numbers of BSC (50 TRX capacity)
1 A1 3666 147
2 A2 2253 91
3 B 680 55
4 C 74 9
Total nos. 6,673 302

16 | P a g e
Antenna requirement are to be decided after site finalization. Hence in the above BTStypes’ antenna may be Omni, Directional or Sectorial type with even or unevendistribution of TRX all depending on the tower location and population distribution.Such design can be implemented by using splitters as required. Site survey along withfeasibility study will decide the exact tower location which in return will decide theactual antenna height and required TRX radiation power. Issues like land acquisition,statutory permissions, views of inhabitants will also influence for site location feasibilitystudy.
4.4. 3 BackhaulBackhaul channel requirements have been shown in analysis result. Backhaulconnectivity is categorized under 3 types, depending on site location. As per existingsites in NER microwave/Radio Modem are found the most used technology for backhaulconnectivity. Below given existing site backhaul details:
Backhaul Details of Existing BTSs (in %)
LSA Only OFC OFC + M/W Microwave VSAT
Arunachal Pradesh 25.82 0.69 63.17 10.33Assam 10.76 1.35 87.85 0.04Manipur 8.88 1.13 88.34 1.64Meghalaya 9.56 0.98 88.53 0.93Mizoram 7.34 0.86 89.35 2.45Nagaland 18.53 0.74 80.43 0.30Tripura 12.53 0.94 86.42 0.11Sikkim 1.23 4.92 93.85 0.00
Grand Total 11.27 1.28 86.81 0.65
The number of channels in E1 is found to be maximum of 12 for a site hence maximumbackhaul bandwidth for a site will be within 768 Kbps. Gram Panchayats are consideredas PoP for E1 (Optical/Copper) backhaul connectivity to BSC and hence all opticalbackhaul sites are proposed to get connected to the nearest panchayat. It is found thatan average distance from site location to nearby panchayat is around 7 km. Hence onlythe last mile optical cable laying will be required up to the gram panchayat. Formicrowave backhaul line of sight (LoS) is essential and hence the same may influencesite location. Radio modem may be used as backhaul as the same will be a better option

17 | P a g e
in comparison to microwave as it carries IP packets for a longer distance. 1 Mbps linkcan be through for more than 10 Km with low power requirement, less than 2 watts.
For backhaul, report follows similar pattern as existing in NER region. For ArunachalPradesh no. of VSAT link can be increased subject to waiver of yearly bandwidth cost inspecific district. This will make installation quick and more feasible. The total backhaulbandwidth requirement is approx. 3.85 Gbps.
4.4. 4 BSNL Satellite Network Backhaul in Northeast
BSNL has been using IP base Satellite communication Network for backhaul connectivityfor the mobile network as per the architecture given below.
The IP based satellite network envisages BTS connectivity with BSC through BSNL MPLSnetwork as shown in diagram.
The following information may be used for estimation of the IP based satellite backhaulconnectivity.
1. The backhaul requirements for BTS connectivity shall be based on the bandwidthrequirement of 128 kbps + 128 kbps for uplink and downlink for 1 TRXconfiguration. The satellite bandwidth estimate shall be based on the actual BTSrequirements.
2. The VSAT Price for Supply, installation, testing and commissioning is estimated asRs. 90,000/-+ taxes as one time investment including 1.2M Antenna.
3. The recurring cost for the satellite bandwidth for 1TRX (128 kbps+ 128 kbps) isestimated as Rs.4.67 Lakhs + taxes per annum, including backhaul MPLS cost.
18 | P a g e
4. AMC charges for operations and maintenance of the satellite equipment isestimated as Rs 10,000 +taxes per annum per site.
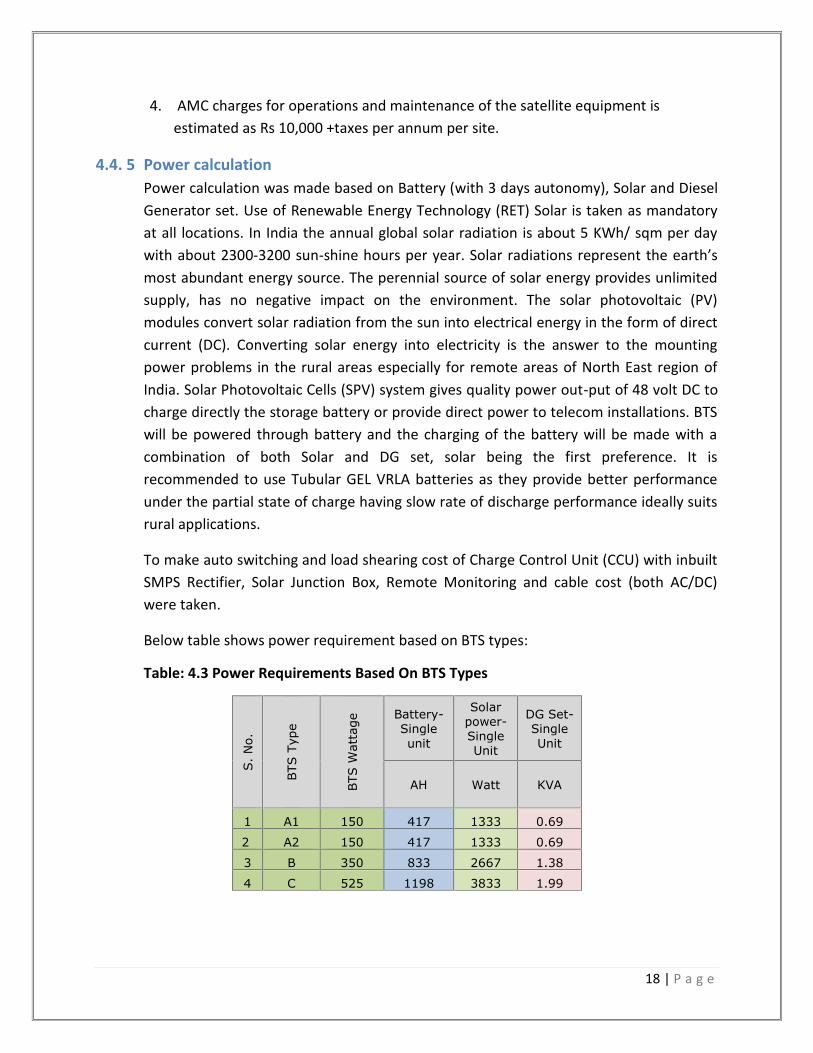
4.4. 5 Power calculationPower calculation was made based on Battery (with 3 days autonomy), Solar and DieselGenerator set. Use of Renewable Energy Technology (RET) Solar is taken as mandatoryat all locations. In India the annual global solar radiation is about 5 KWh/ sqm per daywith about 2300-3200 sun-shine hours per year. Solar radiations represent the earth’smost abundant energy source. The perennial source of solar energy provides unlimitedsupply, has no negative impact on the environment. The solar photovoltaic (PV)modules convert solar radiation from the sun into electrical energy in the form of directcurrent (DC). Converting solar energy into electricity is the answer to the mountingpower problems in the rural areas especially for remote areas of North East region ofIndia. Solar Photovoltaic Cells (SPV) system gives quality power out-put of 48 volt DC tocharge directly the storage battery or provide direct power to telecom installations. BTSwill be powered through battery and the charging of the battery will be made with acombination of both Solar and DG set, solar being the first preference. It isrecommended to use Tubular GEL VRLA batteries as they provide better performanceunder the partial state of charge having slow rate of discharge performance ideally suitsrural applications.
To make auto switching and load shearing cost of Charge Control Unit (CCU) with inbuiltSMPS Rectifier, Solar Junction Box, Remote Monitoring and cable cost (both AC/DC)were taken.
Below table shows power requirement based on BTS types:
Table: 4.3 Power Requirements Based On BTS Types
S.
No.
BTS
Typ
e
BTS
Wat
tage
Battery-Singleunit
Solarpower-SingleUnit
DG Set-SingleUnit
AH Watt KVA
1 A1 150 417 1333 0.69
2 A2 150 417 1333 0.69
3 B 350 833 2667 1.38
4 C 525 1198 3833 1.99

19 | P a g e
4.4. 6 InfrastructureUnder infrastructure category, towers are all considered to be Mast/ Pole tower oflength 20 meters or 30 meters. For hilly area of North East region erection of angulartower are time consuming and difficult job. In most of the cases the effective towerheight will depend on the tower construction site altitude with respect to the targetarea to be covered. For costing purpose angular tower was consider in comparison totubular tower as the same is more rigid and suitable for hilly areas. It is recommendedthat tower design should be based on TEC GRs or as per design approved from anorganization like Structural Engineering Research Centre (SERC)/ TEC/ IITs for structuralfitness, safety, load bearing capacity, ability to withstand wind speed etc. along withantenna cost, cost of shelter along with fencing cost was consider for calculation ofoverall infrastructure cost.
Other cost like transportation, Commissioning and Installation cost was also included inthe CAPEX estimation.
4.4. 7 System configurationThe system uses centralized power plant, battery bank, SPV and diesel generator set. Allthese are centrally controlled by a Charge Control Unit (CCU) for optimal poweringutilization of systems and charging of the battery bank. The CCU ensures smoothoperation of the overall powering arrangement without any manual intervention. Itsdesign will ensure optimal energy transfer from the SPV system using MPPT (MaximumPower Point Tracking) technique and automatic switching on/off of DG set on the basisof battery charge condition. For design purpose, Depth of Discharge (DoD) for thebattery is taken as 80% of its capacity and the DG set is consider to trigger only whenbattery is discharged below 40% of its capacity. Such combination will make optimumuses of diesel and hence cost saving along with lower level of pollution is taken care off.A schematic diagram of system design:

20 | P a g e
4.4. 8 CostBelow is given the cost components per site. The components are divided in to five categories.
1. BTS with antenna, feeder cable and BSC with OMC-R2. Power
Battery (3 days Autonomy) Solar (6 hrs. sunshine) Diesel Generator
3. Tower (20 and 30 meter)4. Backhaul (OFC/Microwave/VSAT)5. Miscellaneous Items
GEN
BATTERYBANK
CCU
BTS
Solar PhotoVoltaic(SPV)
Module
SMPS
SolarJuncti
onBox

21 | P a g e
Below given the cost break up in each category:
Description Cost in INR Cost in INR Cost in INR Cost in INRBTS conf.
2 of 5 watt 2 of 5 watt 2/2 of 10watt 2/2/2 of 10 watt
BTS CategoryA1 A2 B C
Power
Battery with Racks,connector and otheraccessories
330,000 330,000 665,000 852,500
Solar power systemwith civil works, Racks,connector and otheraccessories
400,000 400,000 600,000 800,000
Charge Control unit(CCU) 300,000 300,000 500,000 500,000
DG Set (For emergencycharging) 100,000 100,000 250,000 300,000
Description Cost in INR Cost in INR Cost in INR Cost in INRBTS conf.
2 of 5 watt 2 of 5 watt 2/2 of 10watt 2/2/2 of 10 watt
BTS CategoryA1 A2 B C
BTS with Antennaalong with BSC &OMC-R
350,000 350,000 650,000 950,000

22 | P a g e
Description Cost in INR Cost in INR Cost in INR Cost in INRBTS conf.
2 of 5 watt 2 of 5 watt 2/2 of 10watt 2/2/2 of 10 watt
BTS CategoryA1 A2 B C
Tower
Mast/ Pole (SERCApproved Design)erecting with all civilworks
650,000 900,000 900,000 900,000
Description Cost INR(in Lakhs)
Cost INR(in Lakhs)
Cost INR(in Lakhs)
Cost INR(in Lakhs)
BTS conf.2 of 5 watt 2 of 5 watt 2/2 of 10
watt 2/2/2 of 10 watt
BTS CategoryA1 A2 B C
Back haul Cost in lakhsOFC per KM with onesplicing joint for 7 Km 56 56 56 56
Microwave 4.50 4.50 4.50 4.50VSAT 3.00 3.00 3.00 3.00
Description for miscellaneous items Cost in INR Cost in INR Cost in INR Cost in INRBTS conf.
2 of 5 watt 2 of 5 watt 2/2 of 10watt
2/2/2 of 10watt
BTS Category A1 A2 B C
Cables and accessories like AC/DCCable+ Earthing+ HDPE PIPES 100,000 100,000 200,000 500,000
Shelter cost 10'x10' feet, fiber blockroofing, Fencing etc 200,000 200,000 250,000 250,000
Transportation 250,000 250,000 400,000 500,000
Commissioning & Installation 200,000 200,000 250,000 250,000
Any other items 100,000 100,000 200,000 200,000
23 | P a g e
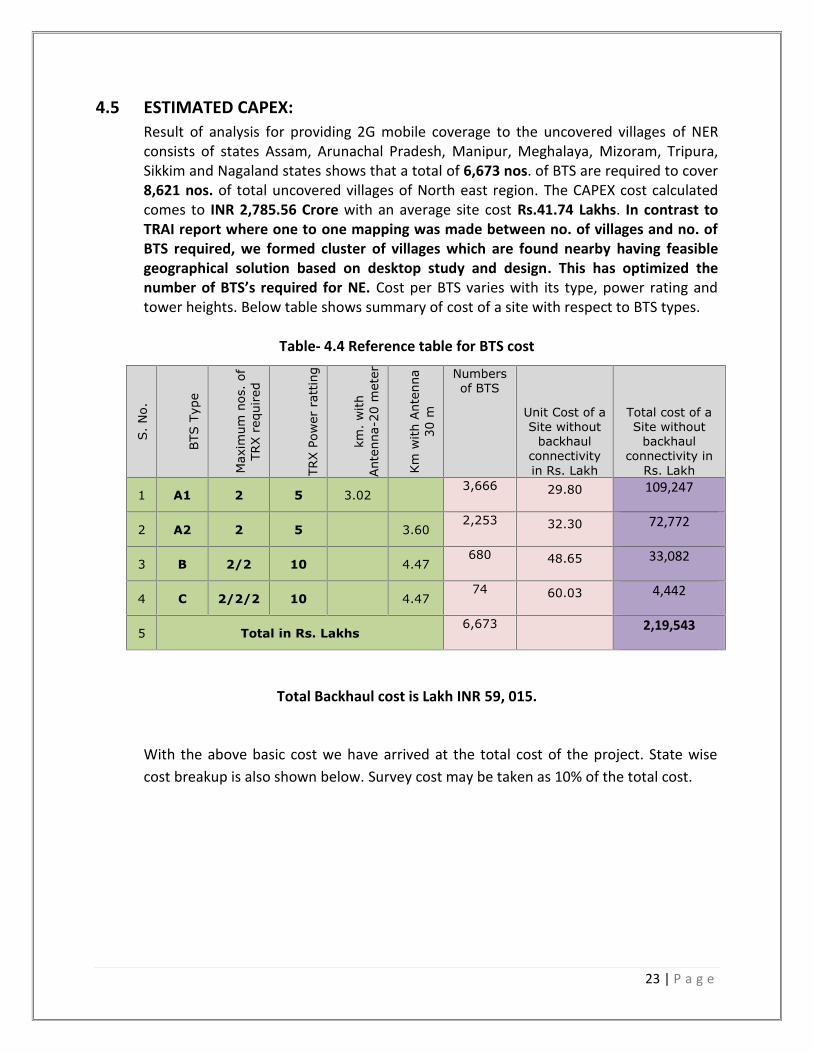
4.5 ESTIMATED CAPEX:Result of analysis for providing 2G mobile coverage to the uncovered villages of NERconsists of states Assam, Arunachal Pradesh, Manipur, Meghalaya, Mizoram, Tripura,Sikkim and Nagaland states shows that a total of 6,673 nos. of BTS are required to cover8,621 nos. of total uncovered villages of North east region. The CAPEX cost calculatedcomes to INR 2,785.56 Crore with an average site cost Rs.41.74 Lakhs. In contrast toTRAI report where one to one mapping was made between no. of villages and no. ofBTS required, we formed cluster of villages which are found nearby having feasiblegeographical solution based on desktop study and design. This has optimized thenumber of BTS’s required for NE. Cost per BTS varies with its type, power rating andtower heights. Below table shows summary of cost of a site with respect to BTS types.
Table- 4.4 Reference table for BTS cost
S.
No.
BTS
Typ
e
Max
imum
nos
.of
TRX r
equi
red
TRX P
ower
rat
ting
km.
with
Ant
enna
-20
met
er
Km
with
Ant
enna
30 m
Numbersof BTS
Unit Cost of aSite without
backhaulconnectivityin Rs. Lakh
Total cost of aSite without
backhaulconnectivity in
Rs. Lakh
1 A1 2 5 3.023,666 29.80 109,247
2 A2 2 5 3.602,253 32.30 72,772
3 B 2/2 10 4.47680 48.65 33,082
4 C 2/2/2 10 4.4774 60.03 4,442
5 Total in Rs. Lakhs6,673 2,19,543
Total Backhaul cost is Lakh INR 59, 015.
With the above basic cost we have arrived at the total cost of the project. State wisecost breakup is also shown below. Survey cost may be taken as 10% of the total cost.

24 | P a g e
Table – 4.5 Consolidated & State- Wise Cost Break up:
Consolidated At site BackhaulA1 A2 B C Optical VSAT Microwave
Total in Numbers 6,673 3,666 2,253 680 74 583 692 5,398
Cost (Rs. Crore) 1092.47 727.72 330.82 44.42 326.48 20.76 242.91
Total Cost (Rs. Crore) 2785.58 2195.43 590.15
Assam:
Assam At site BackhaulA1 A2 B C Optical VSAT Microwave
Total in Numbers1874 763 748 310 53 150 37 1687
Cost (Rs. Crore) 227.37 241.60 150.82 31.81 84.00 1.11 75.92
Total Cost (Rs. Crore) 812.63 651.61 161.03
Arunachal Pradesh:
Arunachal Pradesh At site Backhaul
A1 A2 B C Optical VSAT MicrowaveTotal in Numbers
1893 1356 447 88 2 152 605 1136
Cost (Rs. Crore) 404.09 144.38 42.81 1.20 85.12 18.15 51.12
Total Cost (Rs. Crore) 746.87 592.48 154.39

25 | P a g e
Manipur:
Manipur At site BackhaulA1 A2 B C Optical VSAT Microwave
Total inNumbers 384 159 149 71 5 35 3 346
Cost (Rs.Crore) 47.38 48.13 34.54 3.00 19.60 0.09 15.57
Total Cost(Rs. Crore) 168.31 133.05 35.26
Meghalaya:
Meghalaya At site BackhaulA1 A2 B C Optical VSAT Microwave
Total in Numbers2162 1329 731 99 3 206 42 1914
Cost (Rs. Crore) 396.04 236.11 48.16 1.80 115.36 1.26 86.13
Total Cost (Rs. Crore) 884.87 682.12 202.75
Mizoram:
Mizoram At site BackhaulA1 A2 B C Optical VSAT Microwave
Total in Numbers227 33 117 74 3 18 4 205
Cost (Rs. Crore) 9.83 37.79 36.00 1.80 10.08 0.12 9.23
Total Cost (Rs. Crore) 104.85 85.43 19.43

26 | P a g e
Nagaland:
Nagaland At site BackhaulA1 A2 B C Optical VSAT Microwave
Total in Numbers112 22 54 30 6 21 1 90
Cost (Rs. Crore) 6.56 17.44 14.60 3.60 11.76 0.03 4.05
Total Cost (Rs. Crore) 58.03 42.19 15.84
Sikkim:
Sikkim At site BackhaulA1 A2 B C Optical VSAT Microwave
Total in Numbers19 4 7 6 2 1 0 18
Cost (Rs. Crore) 1.19 2.26 2.92 1.20 0.56 0.00 0.81
Total Cost (Rs. Crore) 8.94 7.57 1.37
Tripura:
Tripura At site BackhaulA1 A2 B C Optical VSAT Microwave
Total in Numbers2 0 0 2 0 0 0 2
Cost (Rs. Crore) 0.00 0.00 0.97 0.00 0.00 0.00 0.09
Total Cost (Rs. Crore) 1.06 0.97 0.09

27 | P a g e
The BTS location has been identified with Latitude and the longitude along with itsantenna height, number of TRX and maximum sector requirements. As power supply iscrucial factor for the project hence total power requirement is also shown in the table.Battery autonomy is taken for 3 days irrespective of BTS type. Capacity of battery wascalculated made considering solar and diesel generator set to be as backup for batterycharging where solar charging will be given priority over DG set. On an average sunshinewas considered to be for 6 hours a day and the Depth of Discharge (DoD) for the batteryis taken as 80%. Battery when discharge below 40% of its capacity will trigger the DG setprovided that there is no solar charging available at that moment. Such circuit design ispossible through DCPDB board and automatic change over switch.
4.6 Key observation
Business case does not exist in North Eastern States remote village site because of verylow return on investment (ROI). The OPEX cost is also high in such regions. It is observedthat due to less availability of power source in remote areas of North East region thecost per site increases many folds. It may be observed that the cost of BTS is only some10 to 12% of site cost. The maximum of the cost is contributed by power systemhaving both solar and DG sets. Hence BTS power rating would be a key factor on theoverall budget estimation. It is suggested to go for low power outdoor low maintenanceBTS instead of conventional BTS though it’s cost is little higher.
Below table shows in % equipments and cost involved.
BTS Type BackhaulA1 A2 B C Optical VSAT Microwave
No. in percentage55% 34% 10% 1% 9% 10% 81%
Total Cost inpercentage 79% 21%
Cost in percentage50% 33% 15% 2%
The backhaul contributes about 21% of the total expenditure. Backhaul in NER region iscontributing significantly towards project cost. It is recommended that backhaul opticalconnectivity should be minimized as the same is costly and time consuming for layingworks etc in comparison to Microwave or VSAT. In case of VSAT the CAPEX is quite lowbut the bandwidth cost is found to be very high, around INR 9 lakhs per year per Mbpslink. Hence microwave is more suitable in NER and the same can be seen from theexisting backhaul connectivity in NER area. The license free band, 5 GHz may be used formicrowave link which is more suitable for rainy areas like NER. In Arunachal Pradesh

28 | P a g e
where VSAT bandwidth cost is likely to be waived off, the total backhaul may be onVSAT.
Moreover cost saving may be done mostly on BTS part for Type A1 and Type A2 as theirtotal contribution is more than 83% of the BTS site cost. Thus with low power rating BTScost saving on the power back up equipments will be significant and thus may prove tobe better feasible solution for sites with very low return on investment (ROI).
4.7 Recommendation
In addition to the CAPEX above, there is a huge recurring investment required tomaintain this infra structure in the form of Fiber and equipment maintenance. As theNorth eastern Region has tough terrain and low tele-density, operators do not see alucrative business model or rate of return in this part of the country because of the gapin huge investment of capital and operational expenses vis-à-vis the revenue earned.Therefore there is a need to cover operating costs also; this will encourage operators toprovide keep providing services in NER.
The CAPEX as estimated above for the BTS deployment in uncovered villages may befunded by USOF. This will encourage operators to establish infrastructure. As OPEX isalso very high in NER, the same can be factored by taking the net revenue (i.e. Revenue– OPEX) while calculating the subsidy. It is to mention in earlier schemes of USOF,passive sharing of towers is mandated. However, as per current guidelines active sharingof RAN is also allowed and the main advantage of this technology is the reduction inCAPEX and OPEX as both active and passive component is shared by operators. Thesubsidy calculation to fund the gap may consider this technology and mandate theactive sharing of RAN.
29 | P a g e
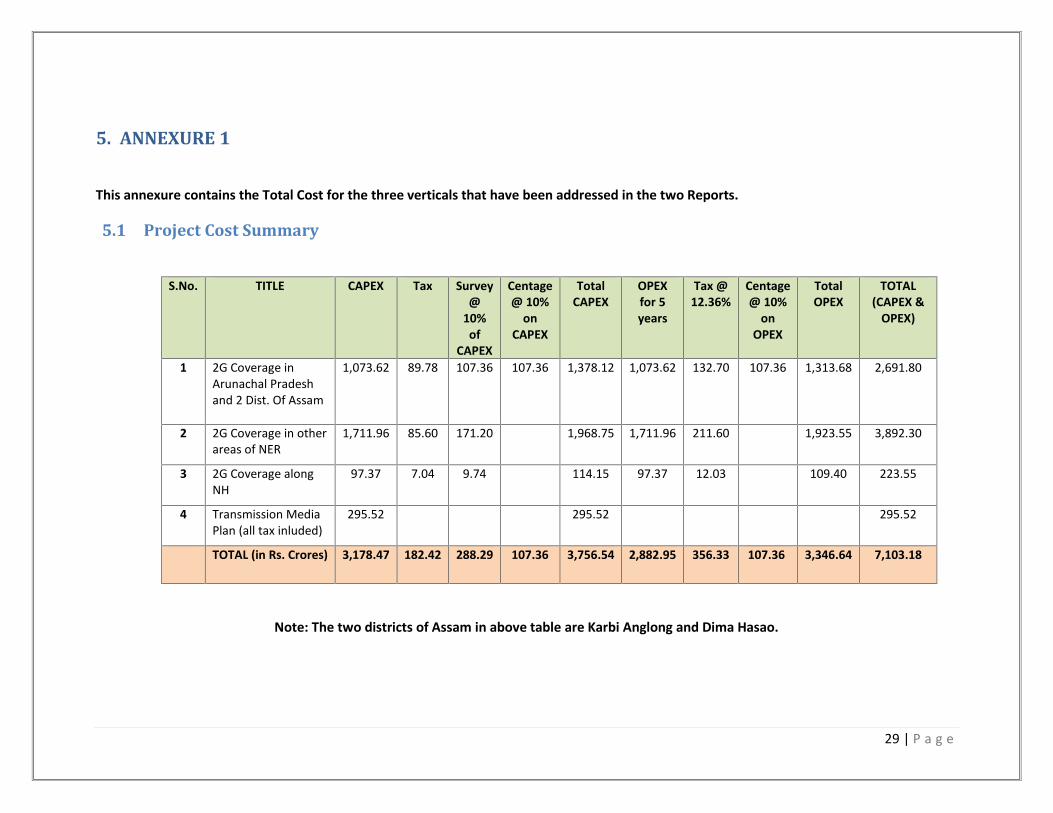
5. ANNEXURE 1
This annexure contains the Total Cost for the three verticals that have been addressed in the two Reports.
5.1 Project Cost Summary
S.No. TITLE CAPEX Tax Survey@
10%of
CAPEX
Centage@ 10%
onCAPEX
TotalCAPEX
OPEXfor 5years
Tax @12.36%
Centage@ 10%
onOPEX
TotalOPEX
TOTAL(CAPEX &
OPEX)
1 2G Coverage inArunachal Pradeshand 2 Dist. Of Assam
1,073.62 89.78 107.36 107.36 1,378.12 1,073.62 132.70 107.36 1,313.68 2,691.80
2 2G Coverage in otherareas of NER
1,711.96 85.60 171.20 1,968.75 1,711.96 211.60 1,923.55 3,892.30
3 2G Coverage alongNH
97.37 7.04 9.74 114.15 97.37 12.03 109.40 223.55
4 Transmission MediaPlan (all tax inluded)
295.52 295.52 295.52
TOTAL (in Rs. Crores) 3,178.47 182.42 288.29 107.36 3,756.54 2,882.95 356.33 107.36 3,346.64 7,103.18
Note: The two districts of Assam in above table are Karbi Anglong and Dima Hasao.

30 | P a g e
5.2 2G Coverage in Arunachal Pradesh and 2 Dist. Of Assam
S.No.
STATE Villagesas perTRAI
Villagesas perTCIL
Towers CAPEX Tax Survey@ 10%
ofCAPEX
Centage @
10% ofCAPEX
TotalCAPEX
OPEX for5 years
Tax @12.36
%
Centage @
10% ofOPEX
TOTALOPEX
TOTAL(CAPEX
& OPEX)
1 Arunachal
Pradesh2,886 2,805 1,893
746.87 73.44 74.69 74.69 969.69 746.87 92.31 74.69 913.87 1,883.56
2 2 Dist. OfAssam 1,605 1,314 924
326.75 16.34 32.67 32.67 408.44 326.75 40.39 32.67 399.81 808.24
TOTAL(in Rs.Crores)
4,491 4,119 2,8171,073.62 89.78 107.36 107.36 1,378.12 1,073.62 132.70 107.36 1,313.68 2,691.80

31 | P a g e
5.3 2G Coverage in other areas of NER
S.No. STATE Villagesasper TRAI
Villagesas perTCIL
Towers CAPEX Tax Survey@ 10%ofCAPEX
TotalCAPEX
OPEX for5 years
Tax @12.36%
Total OPEX TOTAL(CAPEX& OPEX)
1 Assam(otherthan 2 states)
1280 1189 950 485.88 24.29 48.59 558.77 485.88 60.06 545.94 1,104.70
2 Manipur 610 528 384 168.31 8.42 16.83 193.56 168.31 20.80 189.12 382.673 Meghalaya 2389 2374 2162 884.87 44.24 88.49 1,017.60 884.87 109.37 994.24 2,011.844 Mizoram 258 252 227 104.85 5.24 10.49 120.58 104.85 12.96 117.81 238.395 Nagaland 137 134 112 58.03 2.90 5.80 66.74 58.03 7.17 65.21 131.956 Tripura 2 2 2 1.06 0.05 0.11 1.22 1.06 0.13 1.19 2.427 Sikkim 23 23 19 8.94 0.45 0.89 10.28 8.94 1.11 10.05 20.33
TOTAL(in Rs.Crores)
4699 4502 3856 1,711.96 85.60 171.20 1,968.75 1,711.96 211.60 1,923.55 3,892.30

32 | P a g e
5.4 2G Coverage along NH
S.No. STATE TOWERSTRAI
TOWERSTCIL
CAPEX Tax Survey@
10%of
CAPEX
TotalCAPEX
OPEXfor 5years
Tax @12.36%
Total OPEX Total(CAPEX &OPEX)
1 ArunachalPradesh
122 119 49.73 4.66 4.97 59.36 49.73 6.15 55.88 115.24
2 Assam 10 23 9.61 0.48 0.96 11.05 9.61 1.19 10.80 21.853 Manipur 18 34 14.21 0.71 1.42 16.34 14.21 1.76 15.96 32.304 Meghalaya 0 9 3.76 0.19 0.38 4.33 3.76 0.46 4.23 8.555 Mizoram 1 12 5.01 0.25 0.50 5.77 5.01 0.62 5.63 11.406 Nagaland 10 29 12.12 0.61 1.21 13.94 12.12 1.50 13.62 27.557 Tripura 4 6 2.51 0.13 0.25 2.88 2.51 0.31 2.82 5.708 Sikkim 0 1 0.42 0.02 0.04 0.48 0.42 0.05 0.47 0.95
TOTAL (in Rs. Crores) 165.00 233.00 97.37 7.04 9.74 114.15 97.37 12.03 109.40 223.55
Tax Assumptions:1. Sales tax on goods @ 5% on CAPEX.2. Entry tax for Arunachal Pradesh @ of 13.5% for battery and @ 4% for other goods on
CAPEX.3. Service tax @ 12.36% on OPEX.4. Octroi and local taxes will be additional.

33 | P a g e
5.5 Tax break Up
5.5.1 Tax break up for Arunachal Pradesh and 2 Dist. Of Assam
CAPEX for Villages Total cost TaxesArunachal Pradesh 746.872 dist of Assam 326.75Total 1,073.62Tax @ 5% 53.68Entry Tax for Arunachal PradeshBattery 65.52Tax @ 13.5% 8.85Rest of the items 681.35Tax @ 4% 27.25
89.78OPEXArunachal + 2 dist. Of Assam 1,073.62Tax @ 12.36% 132.7
Total tax in crores 222.48
5.5.2 Tax break Up for National Highways (in Arunachal Pradesh)CAPEX Total cost TaxesArunachal Pradesh 49.73Total 49.73Tax @ 5% 2.49Entry Tax for Arunachal PradeshBattery 3.93Tax @ 13.5% 0.53
34 | P a g e
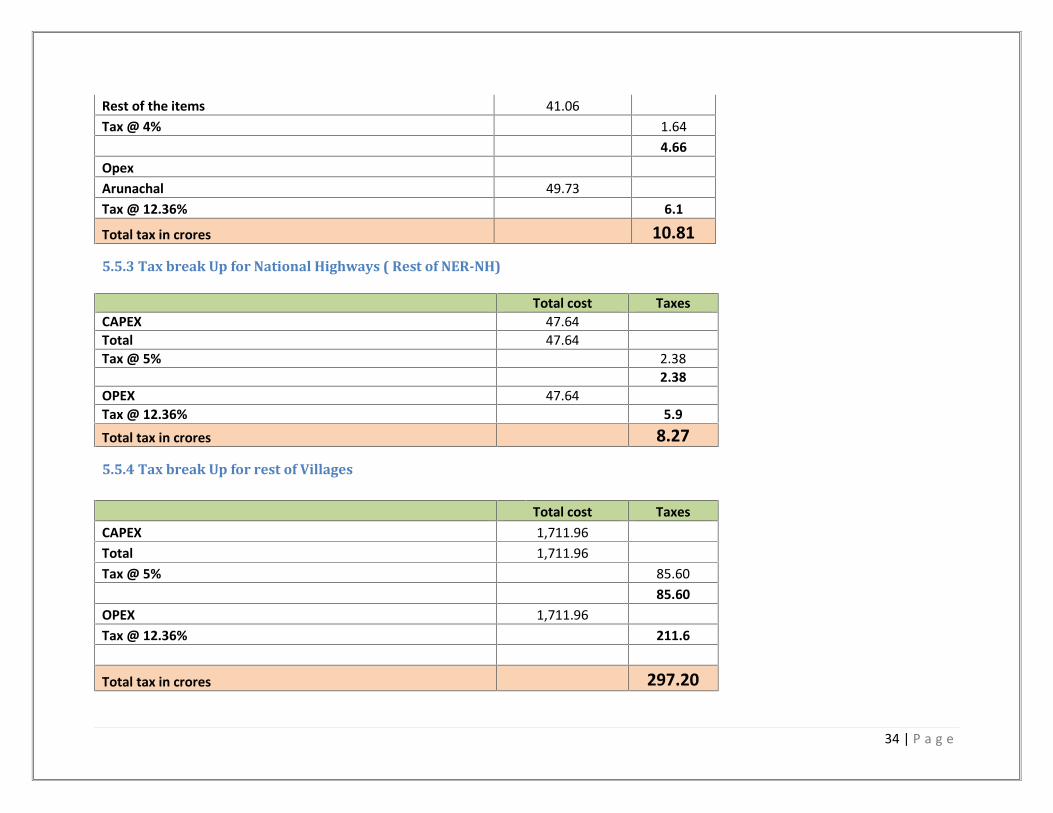
Rest of the items 41.06Tax @ 4% 1.64
4.66OpexArunachal 49.73Tax @ 12.36% 6.1
Total tax in crores 10.81
5.5.3 Tax break Up for National Highways ( Rest of NER-NH)
Total cost TaxesCAPEX 47.64Total 47.64Tax @ 5% 2.38
2.38OPEX 47.64Tax @ 12.36% 5.9Total tax in crores 8.27
5.5.4 Tax break Up for rest of Villages
Total cost TaxesCAPEX 1,711.96Total 1,711.96Tax @ 5% 85.60
85.60OPEX 1,711.96Tax @ 12.36% 211.6
Total tax in crores 297.20