DESIGNING AND TESTING OF PRIMERS FOR CLONING OF … and testing of primers for cloning...(24...
24
DESIGNING AND TESTING OF PRIMERS FOR CLONING OF Cinnamoyl-CoA Reductase (CCR) GENOMIC SEQUENCE FROM KELANIPAYAN (Neolamarckia Cadamba) Sia Jennie TS 933 Bachelor of Science with Honour L5 (Resourse Biotechnology) S562 2010 2010
-
Upload
truonglien -
Category
Documents
-
view
212 -
download
0
Transcript of DESIGNING AND TESTING OF PRIMERS FOR CLONING OF … and testing of primers for cloning...(24...
DESIGNING AND TESTING OF PRIMERS FOR CLONING OF Cinnamoyl-CoA Reductase (CCR) GENOMIC SEQUENCE FROM
KELANIPAYAN (Neolamarckia Cadamba)
Sia Jennie
TS 933 Bachelor of Science with Honour L5
(Resourse Biotechnology) S562
20102010
tun KWdrualliklllmli Abdul UNTVERSm MALAVSIA AKAWAI
P KHIOMAT nAKLUMAT AKAOEMIK
UNlnAS
1111111111111111111111111 1000276589
Designin g a nd Testing of Primers for Cloning of Cinnamoyl-CoA redu ctase (CCR) genomic
sequence from Kelampayan (Neolamarckia cadamba)
SIA JENNIE
The thesis is submilted in partial fulfillment of requirements for degree of Bachelor of Science
with Honours in Resource Biotechno logy Programme
DepaJ1ment of Molecul ar Bio logy
Faculty of Resource Science and Technology
UN IVERSITI MALA YSIA SARAWAK
2010
ACKNOWLEDGMENTS
Throughout my stud y in this Final Yea r Project (FYP) I feel grateful towards a number of
people who had certainly assisted and encouraged me Firstl y I would like to express my
greatest grat itude and sincere appreciation to my honorable supervisor Dr Ho Wei Seng
Facult y of Resource Science and Technology UN IMAS who has provided me thi s precious
chance to conduct my FYP research in Forest Genomics and Infoffilat ics Laboratory I thank
him wholly for hi s patience valuable advice and supports that helped me to complete my
study fruitfully
FurthenTI ore I would like to thank my co-supervisor Dr Pang Shek Ling a
resea rcher from SARAWAK FORESTRY Corporation for her unremitting guidance and
go lden advice all along the way [ carry out my research She has taught me ways to solve
some technical problems in the research and how to use software for data analysis Her
courteous encouragement and good teaching skills while I conducted my stud y did inspire me
and make me learn a Jo t from her
Moreover [ would like to convey my sincere thankfulness to all of the
postgraduates in Forest Genomi cs Laboratory UN IMAS especiall y Mr Liew Kit Siong Mr
Phui Seng Lo i and Ms Tchin Boon Ling for their kind assistances and valued advices even
though they have packed and busy schedule daily They are polite and helpful to teach me
whenever I face any problem or difficulties during the research [ de finitely wou ld not able to
complete my stud y without their kindly assistances
Last but not leas t I would like to show my appreciation to my family friends and
everyone else who directly or indirectly contributed their supports guid ance and preclOus
tim e for my study Their precious encouragements absolutely help me all the time
Designing and Testing of Primers for Cloning Cinnamoyl-CoA reductase (CCR) genomic sequence from Kelampayan (Neolamarckia cadamba)
Sia Jennie
Resource Biotechnology Programme Faculty of Resource Science and Technology
Universiti Malaysia Sarawak
Abstract
Lignin content in the wood is an important criterion to choose planting materials for economic purposes A study of one of the lignin biosynthesis genes cinnamayl-CaA reductase (CCR) from Nealamarckia eadamba was carried out Paliial CCR DNA fragment was amplified by using the primer set I designed from partial cDNA of Nealamarekia cadamha The amplification product was then examined on 15 agarose gel and continued with the purification of the product The purified product was then cloned into pGEM-T Easy Vector One positive clone was sent for sequencing and the data obtained was analyzed The amplified product using primer set I did not show homology to the CCR gene from Nealamarckia cadamha Therefore primer set 2 was designed from partial cDNA of Nealamarekia cadamba and tested to amplify the target region of the CCR gene Polymerase chain reaction (PCR) optimization of CCR gene from Nealamarckia eadamba was perfomled by using primer set 2 The PCR product was then purified and cloned into pGEM-T Easy Vector However the estimated product size of the colony PCR of the CCR was not observed positive clone was not obtained Few solutions could be taken in order to successfully clone the desired PCR product into the pGEM -T Easy Vector
Key Words Nealamarckia cadamba Cinnal71oyl-CoA reduelas (CCR) Polymerase Chain Reaction (PCR) primer set
Abstrak
Kandungan lignin di dalam kayu ialah salu krileria penling unluk memilih pakok yang dapal mengaul keunlungan Jujukun DNA bagi gen cinnam(vl-CoA reduelase (Cell) daripada NC(J lamarekia cadamba lelah dikaji Jujukan [ CR DNA telah diampiikasikan dengan menggunakan sci pencelus I direka daripada segmcn cDNA Nealamarckia eadamha Hasil ampliikasi segmen DNA diklonkan ke dalam pGEA1 -T Easy Vecior dan salu pasilif klan dihanlar unluk penjujukan Hasil analysis data tersehut mendnjukkan hasil ampliikasi lersehut lidak berhamalog dengan jujuleell1 CC~ DNA daripada Neolamard ia cadamha Oleh flu set pencelus 2 direka daripada segmen eDNA lleOWICl rckia cadu mha dan diuji untuk I17cngampliilwsikan jujukan ~[B DNA Oplimiswi PCR gCI1 CCR dari Ncolamarekia cadamba telah dijaankan dengan menggunakan set pencelus 2 Hasil peR lelah dipunjikasi dan diklonlwn ke dalam pGEM -T Easy Veelar Sal produk koloni PCR yang dijangka tidak dieapai dan pasilile klan lidak didapali Behempa cam penyelesaian pengklonan dapat digunakan unluk mengklankan produk PCR yang dikehendaki ke dalam pGEv-T Easy Vector
Kala Kunci tc2j(Jrifc kia cadamba Cinnam Q)I- CoA reduelase (LCJJ) PCR sel peneelus
It
tgtupt KIidntal Maklumat Akadfm~ t lVl-$rrt ~ ~4Jt~W4J(
TABLE OF CONTENTS
ACKNOWLEDGMENTS I
ABSTRACT II
TABLE OF CONTENTS III
LIST OF ABBREVIATIONS V
LIST OF TABLES VI
LIST OF FIGURES VII
CHAPTER I
INTRODUCTION 1
CHAPTER II
LITERATURE REVIEW 4
21 Neolamarckia cadamba (Ke larnpayan) trees 4
22 Lignin Biosynthesis Pathway 5
23 Cinnamoyl CoA reductase (CCR) gene 7
CHAPTER III
MATERIALS AND METHODS 9
3 1 Co ll ecti on of Plant Ma terials and DNA samples 9
32 DNA Iso lation and Purification 9
32 1 CTAB Extract ion Buffer Preparation 9
322 Mod ified DN A Isolation Protocol 10
323 DNA Purification II
33 DNA Quantification 12
III
34 Primer design 13
35 Po lymerase Chain Reaction 14
36 Cloning IS
36 1 Purifi cation of DNA from Agarose Gel IS
362 DNA Li gati on 15
363 T ransformati on 16
364 Blue-W hite Co lony Screening 17
365 Plasmid Isola ti on 18
37 DNA sequencing and Data Analys is 18
CHAPTER IV
RESULTS AND DISCUSSION 19
41 DNA Iso lati on Purification and Quantification 19
42 Po lymerase Chain Reaction 22
43 Cloning of PCR Products 23
44 DNA Sequencing of CCR 29
45 Polymerase Chain Reaction and Cloning of CCR by using Primer Set 2 30
CHAPTER V
CONCLUSION S AN D RECOMMENDATIONS 36
REFERENCES
APPENDIX
IV
LIST OF ABBREVIATIONS
cDNA
CCR
DNA
GAS
LD
MAS
mR NA
ORF
PAL
PCR
QTL
QTNs
RT-PCR
SNP
Complementary DNA
Cinnamoyl-CoA reduclase
Deoxyribonucleic acid
Gene Assisted Selection
Linkage Disequilibrium
Marker Assisted Selecti on
Messenger RNA
Open Reading Frame
Phenylalanine ammonia-lyase
Polymerase Chain Reaction
Quantitative Trait Loci
Quantitative Trait Nucleotides
Reverse Transcriptase-Polymerase Chain Reaction
Single Nucleotide Polymorphi sm
v
LIST OF TABLES
Table 31 Mass 00 Hind IJI DNA in a selected fragment 13
Table 32 Ligat ion reaction mixture and volume 16
Table 41 Absorbance Readings at different wavelengths and DNA concentration 21
Table 42 BLASTn output for amplified 508 bp DNA fragment ofCCR 30
VI
LIST OF FIGURES
Figure 21 Neolamarckia wdamba (a) trees bark (b) leaves and flowers structures 4
Figure 22 Lignin Biosynthesis Pathway 6
Figure 41 Electrophoresis of genomic DNA on 08 agarose gel Lane M J Hind III marker (Promega USA) (a) Unpurified genomic DNA (b) Purified genomic ON A 19
Figure 42 Annealing temperature optimization for the designed primer set I 23
Figure 43 Figure 43 Agarose gel electrophores is of (a) PCR product of CCR amplifIed by the designed primer I (b) The purified PCR product 24
Figure 44 Figure 44 LB agar plate showing the result of a blue wh ite
screening for (a) positive contra (b) desired insel1 DNA orCCR gene
from Kelampayan 26
Figure 45 Figure 45 Agarose gel electrophoresis of colony peR products of the CCR amplified by using M 13 forward and reverse sequence pmners 27
Figure 46 Agarose electrophoresis of purified recombinant plasmid clone of Neolamarckia cadamba
of CCR 28
Figure 4 7 Agarose gel electrophoresis of peR products for the iso lated recombinant DNA plasmid amplified by using primers M 13 forward and reverse sequence primers 29
Figure 48 Annealing temperature optllnization for the designed primer sel 2 31
Figure 49 Agarose gel electrophoresis of (3) PCR product of CeR amplified by the designed primer set 2 (b) Purified PCR product 32
Figure 410 LB agar plate showing the result of a blue white screening 33
Figure 411 Agarose gel electrophoresis of colony peR products of the ampli fied by using M [3 forward and reverse sequence primers
CCR 34
VII
CHAPTER I
INTRODUCTION
Forest trees contribute to the majority of terrestl~al biomass production and are vital
component of the biodiversity Current global demand for wood is unable to be compensated
by some of the slow growing species forest trees Thus thi s results in the loss and
degradation of fores t Fast growing species in the plantation forests such as Neolamarckia
cadamba have the capability to supply the bulk of wood needs on a long-tenn basis thus
reduce the harves t pressure on natural forest for wood production to an acceptable level
SARA W AK FORESTRY Corporation is stepping up mass production of genetica ll y
improved seeds to meet the growing demand for plantation timber projects The corporati on
had set up II seed production areas statewide Jt is prod ucing seeds of priority species like
kapur bukit meranti sa rang punai kelampayan benuang and be lian on natural s tands The
seed orchard wo uld help mass production of qualit y seeds for large-sca le plantati on programs
The governments planted fo rest project started II years ago targeting to establi sh a
sustainable source to supply the region s timber processors and the sta te s planned pulp and
paper industry sa id by the managing director of SARAWAK FORESTRY Corporati on
Datuk Len Ta li f Sa ll eh during a seed orchard establishment and plus-tree se lectio n workshop
at Semenggoh in November 2008
Neolamarckia caclamba or locally known as Kelampayan is an impo11ant fa st growing
species used in veneer and plywood production Kelampayan under the fami ly of Rubiaceae
is characterized as a large deciduous and economicall y signifi cant species as it provides earl y
economic retums within 8 to 10 years (Joker 2000) Kelampa yan is one of the li ght-co lored
timbers with low density which serves as raw materi al for pulp and paper industry and it is
one of the best materials for plywood industry According to Ho el 01 (2009) Kelampayan
has been identified as one of the potential fa st growing species for planted forest development
in Sarawak
Based on the research done by Lim el 01 (2005) at Forest Research Instit ute Malays ia
The tree is medium sized to large trees (40 m to 45 m tall) Its bole is stra ight and cylindri cal
It is often branchl ess o f up to 25 m and a diameter of up to 100 cm with buttresses to 2 m talL
It is di stributed in lowland to mountain forests to 1000 m altitude often by st reams and ri vers
as well as open si tes in the forest Kelampayan timber is white with coarse surface due to the
presence of large vessels The timber is usuall y used for li ght-weight purposes such as picture
frames moulding skirting disposable chopstick wooden sandals genera l utility fu m iture
veneer and plywood as the timber is soft and light
Lignin is one of the worlds most abundant natural polymers other than ce llul ose and
chiti n Lignin a phenolic polymer which usually derived from phenyl alanine serves as a
matrix around the polysaccharides components of the plant cell wa ll s Lignin is believed to
contribute compressive strength provide additional rigidity resistance to degradation by
microbia l attack rendering the wall s hydrophobic and water impem1eabilit y to the
polysaccharide-protein matrix o f the cell walL
Due to economi c purposes lignin has become one of the criteri a for choosing pl anting
mateJi aL According to Chi ang (2005) tremendous effort has been devo ted to developing
geneti call y engineered trees with the emphasis on reducing lignin q uantit y to improve wood
pulp production efficiency Yet lignin chemical reacti vit y also is a criti ca l barrier to wood
pulp production because li gnin removal from wood is either initi a ted by chemical
degradations or in most cases accomplished entirely by chemical reac ti ons Therefore the
curren t tree biotechnology emphasis on low lignin quantity must be expanded to include
greater lignin reactivity and ultimately a combination of low and reactive lignin traits
2
In the lignin biosynthesis pathway many genes such as cinnamy i alcohol dehydrogenase
(CAD) cinnamale 4-hydroxylase (C4H) phenylalanine ammonia-lyase (PAL) and others are
involved Nevertheless in thi s stud y the main focus is cinnamoyl-CoA reductase (CCR) from
Kelampayan trees Function of CCR is to catalyze the reducti on o f hydro xycinnamoyl CoA
esters into cinnamaldehydes in the lignin biosynthesis pathway (Hahlbrock and Schee l 1989
Lacombe el 0 1 997 Lauvergeat el al 2002)
Goffn er el al (1994) hypothesized that CCR plays a key regul atory role in lignin
bi osynthesis as the first committed step in the producti on of monolignols fro m
phenylpropanoid metabolites Trees altered in their lignin profile either with reduced amounts
of li gnin or with a more extractable syringyl-rich composition 3re more des irabl e for pulping
Less severe pulping conditions are required for more rapid delignifi cation This result in
decreased of cellulose degradation reduced chemical consumption and higher pulp yield and
strength (Hibberd e 01 1999)
To date the lignin biosynthesis gene CCR from N cadamha has not been characterized
and studied Hence a study with the objectives of designing and testing of primers for
cloning of CCR genomi c sequence from N cadamha was conducted The CCR gene was
amplifi ed purified clo ned and sequenced accordingly Two set of primers were des igned for
the purpose of PCR The fIrst primer set and second primer set were des igned by usi ng
Prim er Premier 50 software and Primer 30 respectivel y The positi ve clone was sent fo r
sequencing Sequ enced result was then analyzed with BLASTn (Altschul el 01 1990)
through BLA ST Search Engines (http blasLncbinlmnihgov) to verify the identity of the
nucleo tide sequcnce
3
CHAPTER n
LITERATURE REVIEW
21 Neolamarckia cadamba (Keampayan) trees
Neolomorckia codomba is di stributed in the Asia-Tem perate such as China and Asia-Trop ical
country like India Nepal Sri Lanka Cambod ia Laos Myanmar Thail and Vietnam
Indonesia Malaysia and Papua New Guinea It s economical value is environmental materials
and medicines N coda mba is grown for o rnamental purpose and it is potential for agro
forestry The timber can be used in producing fiber and wood The barks and leaves are
reported to possess various medicinal va lues such as astringent anti-hepatotox ic (Kapil el aI
1995) antidiuretic anti septic wound healing and anthelmintic Figure 21 shows the
structures of Neolomorckia codombo trees bark leaves and flowers
(a) (b)
Figure 21 Neoamarckia cadal11ba (a) trees bark http prolhom-aloblogcomu sersbasecol11puter14 6
(b) leaves and fl owers stru ctures Source
4
usraquo1 Khidmal l1akJumat Akadrmil UNlYERSm MAUV~IA SAKAwA](
According to Patel amp Kumal (2008) in the pharm acognost ica l studies of N cadamba the
shape of N cadamba leaves is broadly ovate elliptic-oblong with en tire m argin pulvinus
base bitter in ta ste mucronate apex glabrous surface pinnate venation length ranged from
75 to 18 cm and breath is 45 to 16 cm Through the microscopic s tudies the leaf is
dorsi ventral with thick prominent midrib and unifonnl y thin lamina Ground tissue of the
midrib con tai ns a broad outer zone of collenchymas and inner and middle zo ne of
parenchym a Vascul ar bundle built up of a ho rseshoe shape in verted vascular s trands and two
small top-shaped s trands placed at the ends o f the U -shaped strands T he ep idermis of the
midrib is di s tinct with squarish thick-walled cells and promi nen t cut icle On the other hand
microscopic powder of N cadambo showed the presence of unicellular ligified trichomes
paracytic stomata simple starch grains and sandy ball s of ca lcium oxalate crystals
22 Lignin Biosynthesis Pathway
Lignins are po lymers of three alcohol monomers o r a lso known as mono ligno ls such as
coumaryl alcohol coniferyl alcohol and sinapyl alcohol that represent coumaryl units (H
units) gua iacyl subunits (G units) and syrin gyl units (S units) respectively In fOiming a
li gni n pol ymer each monolignol will fonn several types of bonds wi th o ther mo noligno l
through dehydrogcnative polymeriza ti on Lignin con ten t and composition va ry between the
major groups of higher plants and between species (Freudenberg 1959 and 1965) For
example angiospenn lignin consist majority of G units and S units
5
Phenyf PAL C inna mic alanlllpound aC id
TAL C4H l
TyrosinE ----- p- COUtlla nc C3-H Catrelc Fer ullC F5H 5~ HydroK- c_lI Mf 8t id acid aCid fe lultc sed
1 1 p-Courn~ royl - __ Caffeo~ Feruloy l- 5middotHyd ro~rulo~~ S poyl middot
CoA C COA-3H CoA CroAoMT CoA CGA CCoA-CM T CoA
I middotr ~1 1shy
p-(oum3Ialdeh yde Contfer uldeh yde 5middot Hydro-y Smap-Idehyde I onlferaldehyde
p-C oumaryl alcohol Conlferyl alcoho l SlIlap yt a Ico hoi (H ) (G) 5)
I
Figure 22 Li gnin Biosynthesis Path way (Spangenberg el aI 200 1)
Enzymes that cata lyze the biosynthetic pathway of lignins belong to the common
phenylpropanoid pathway which begins with deamination of phenylalanine and leading to th e
synthesis of hydroxycinnamoyl CoA esters Hydroxycinnamoyl CoA esters are drawn
towards li gnin synthesis through two enzymes Cinnamovl CoA reductase (CCR) reduces
hydroxyc innamoyl CoA esters into cinnamaldehydes while cinnamoyl alcohol
dehydrogenase (CAD ) catalyzes the reduction of cinnamaldehydes in to hydroxycinnamoyl
alcohols the precursors of lignin (Hahlbrock and Scheel 1989 Lacombe el aI 1997
Lauvergeat e 01 2002)
Secondary xylem (wood) is built up of cellulose li gnin and hemi celluloses Cellulose
microfibril s are embedded in lignin and a hemi-cellulose matri x which gives strength to the
wood tissue (P lomion el 01 200 I) Relati vel y few plant cell types accum ulate substanti al
amounts of lignin during nonnal development Xylem elements and sclerenchyma cell s that
6
accumulate lignin usually have other cell wall modifications fo r exampl e secondary cell wall
thickening that plays the same role in strengthening the cell Genes participated in lignin
biosynthesis respond to both developmental and envirolUnental signals as disease or
wounding can induce lignin deposition in many ceIJ typ es (Whetten and Sederoff 1995)
23 Gllllalloyl CoA reductase (CCR) gene
CCR catalyzes the redu cti on of hydroxyci nnamoyl-CoA thioesters to th e corresponding
aldehydes in the li gni n biosynthesis pathway CCR gene in Eucalyptus urophyla co shy
laca lised w ith a quantitati ve tra it loc i (QTL) for both li gnin content (accou ntin g for 135 of
the phenotypic variation in this trait) and the SG rati o (247 ) (Gio n el al 2001) Accord ing
to Piquem al el al (1998) this infonnation was cons istent with res ult s obtained from
transgenic studi es with the down regulation of CCR to produce a reduction in li gnin content
in tobacco
Analysis of natural mutant in Arabidopsimiddot has shown that mutati ons in cinnamoyl CoA
reduClClse (CCR) a key lignin gene affect ph ysical properti es of the secondary ce ll wall such
as stiffness and s trength of wood According to Thumm a el aJ (2005) using CCR gene
tested wheth er linkage di sequilibrium (LD) mapping co uld identify a ll eles associated with
microfibril angle (MFA) MFA is kno wn as a wood quality trait affecting stiffness and
strength of wood Further analys is of the mutant has shown that a lternati ve sp li cing in CCR
gene is responsible for the changes in physical properties
Twenty-five common single nucleotide polymorphism (SNP) markers in the CCR gene in
Eucalvplumiddot nitens were iden tifi ed by Thumma el al (2005) Two h ap lo types significantly
associated with M FA were found by using single-marker and haplotype analyses in 290 trees
7
from E nilens natural popu lation These results were confirmed in two full-sib families of E
nilens and E globulus eDNA clones were sequenced and an altematively sp li ced variant
from the significant hapl o type region was identified to und erstand the functional significance
of the SNP markers
8
CHAPTER III
MATERIALS AND METHODS
31 Collection of Plant Material and DNA samples
The leaf samples of N cadamba used in thi s stud y were collected from Kelampaya n Trial
Plot Landeh Forest Reserve Semengoh
32 DNA Isolation and Purification
321 CTAB Extraction Buffer Preparation
100 ml of 1 M Tris HCI pH 80 and 40 ml of 05 M EDTA pH 80 were mi xed 600 ml of
di still ed deionised water was added 8182 g of 14 M NaCI was weighted and added The
vo lume of mixture was adjusted to 1 L with deionised water autoclaved and stored at ro om
temperature 20 g of 2 Cetyl trimethyl ammonium bromide (CTAB) was weighted and
added into the mixture It was stirred vigorously on a magnetic stirrer for several hours or
overnight to dissolve 109 of I Polyvinylpyrrolidone (PVP) was weighted added and
stirred vigorous ly on a magnetic stirrer for several hours to di sso lve 40 III of 2 (vv) (3shy
mercaptoethanol was added to 20 ml EB immediately before use
9
322 Modified DNA Isolation Protocol
The CTAB DNA iso lation method used was modified fiom the Doyle and Doyle protocol
(1990) Initially water bath was filled with di still ed water and the temperature was set at
65 degC Then 08g to 1 0 g of leaf sample was prepared 4 ml of extraction buffer and 80 ~I of
i3-mercaptoethanol (s uggested for small DNA vo lume) were put into a Falcon tube and were
incubated for 30 minutes a t 65degC water bath The lea f sample was was hed wi th water and
wiped with 70 ethanol Then it was tom into small pieces The leafs vines were removed
and then put into the pestle The mmial and peslle must be pre-chilled with liquid nitrogen
befo re grinding Liquid nitrogen was then added and the leaf sample was grind into powder
The leaf powder sample was then added into the fa lcon tube that co nt ained extracti on
buffer and J-mercaptoethanol Then the fal con tube was incubated for 30 minutes w ith
shaking to mix the content 600 ~I of the sample was taken with the cut tip pipette Next 600
~I of Chloroform-Isoamyl (CIA) solution was added in to each microcentrifuge tube The
microcentrifuge tubes were inverted 25 times and then centrifuged at 13000 rpm for 10
minutes The upper aq ueous phase was transferred to a new microcentrifuge tubes and the
C IA ex traction step was repeated
After that 06 vo lum e of co ld isopropanol was added to the micro centrifuge tube and
stored at -20C for 30 minutes to precipitate the DNA The mcrocentrifuge tube containing
the mixture was then cent rifuged at 13000 rpm at 15 minutes The supernatants were poured
off and the DNA pellets were washed with I ml of 70 ethanol at room temperature and
each tube was inverted with qui ck centrifuged at 12000 rpm for I minute The ethanol was
then removed and air-dri ed Finally 20 ~I of ultrapure water was added to resuspend the
DNA sample (Volume of ultrapure added was depend in g on the size of DNA pellet)
10
323 DNA Purification
The isolated DNAs were purified using Wizard Genomic DNA Purification Kit (Promega
USA) based on the manufactureS protocol The DNA samples were topped up to 600 ~l with
double-distilled water Then 3 ~I of 4mgml RNase A Solution was added into each of the
microcentrifuge tube containing DNA The DNA samples were mi xed by inverting the tube
2-5 tiL11es The mi xtures were then incubated at 37degC for 15 minutes Later the tubes
containing mi xture were allowed to cool to room temperature for 5 L11inutes before
proceeding
Next 200 ~I of Protein Precipitation Solution was added into each tube and then mixed
gently by inverting the tubes The tubes were centrifuged for 5 minutes at 13 000 rpm The
supernatant contai ning the D NA was carefully removed and transfelTed to a clean 15 ml
microcentrifuge tube containing 600 ~I of room temperature isopropano l The solution was
gently mixed by inversion for 30 minutes at room temperature until thread like structure of
DNA fOITll a visible mass
The tubes were centrifuged at 13 000 rpm for 10 minute a t room temperature The
supernatant was decanted and 600 ~I of room temperature 70 ethanol was added The tu bes
were gently in vel1ed several times to wash the DNA The tubes were centrifuged at 13 000
rpm for 1 minute The s upern atant was decanted The pe ll et was air-dried and ddHO was
then added to resuspend the DNA The quality and quantity of the purified DNA were then
analyzed on 08 agarose gel
II
33 DNA Quantification
The purifi ed DNA was quantified using Lambda 25 UYy IS Spectropho tomer (Perkin Elmer
USA) Three microlitres of purified DNA from each sample were transferred into quartz
cuvette and then di luted with 2997 III of doubl e distilled water with the dilution factor of
1000x Later the absorbance readings were measured at wavelength of 230 nm (Ano) 260
mn (A260) and 280 nm (A~ )
The absorbance ratio and concentration of each DNA sample was calculated The DlA
amount was further quantified using the agarose gel electrophoresis method to confirm the
readin gs obtained The DNA concentration was calculated by comparing the band intensity of
the DNA samples w ith the band intensity of the AHind [II mark er
The mass of AHind [JI DNA in a selected fragment
Fragmen bp X (Co ncentration of i D~A ) gtlt Volume of f DNA)
Total ) bp
Concentration of DNA samples
mass of gtJl in d III DNA in a selecte d fla gn en =
Vo lume of s ample DNA
12
Table 31 Mass orA Hind III DNA in a selected fragment
Band (bp) =gDNA
23130 14307
9416 5824
6557 4056
4361 2697
2322 1436
2027 1254
564 349
125 077
Total~ 48502
34 Primer design
The folJowing criteria were used for primer design primer length of 20-25 bp GC content
40-60 and T between 57-63degC In addition the 3 -end of primers optimally consist of one
or two Cs or Gs this is important to prevent breathing of ends and increases efficiency of
priming Moreover a primer should not contain sequences that allow hairpin formation
andor base pairing with itself or the complementary primer Primers were synthesized by Bio
Basic Inc (Canada)
First ptimer pair was designed from cDNA sequence of CCR from N cadamha using
sequence Ncdx036B04 of 699 bp (obtained from Cadamomics) and Primer Premier 50
software The designed primer pair consists of the forward primer with sequence 5
AAGTTGTCCCCCGCCGTCAG 3 and reverse pnmer with sequence 5
TCACCACTAAGTCCACTCCTTTCTC 3 This primer pair generated the partial sequence
of CCR with size of 463 bp The PCR product was then continued with cloning and DNA
13
sequencing at Step 36 and Step 37 respectively to verify the ampli fied product of CCR gene
from N cadamba
Second primer pair was designed because the amplifi ed product of CCR gene from N
cadamba using the fir st primer pair did not show homo logy after checked by using BLASTn
(Altschul et a 1990) through BLAST Search Engines (http b lastncbinlmnihgovl) The
second primer pair was des igned from eDNA sequence of CCR fro m N codombo using
sequence Ncdx036 B04 of 699 bp (obtained from Cadamomics) and Primer 30 software
(availabl e at URL http frodowimitedulcgi-binprimer3primer3_wwwcgi) The designed
prnner consists of the forward pnmer with sequence 5
CCCGACGATGCAAAGAATAG 3 and reverse pruner with sequence 5
AG AATGTGTGCCAATGCAAC 3 This primer pair was estimated to generate the partial
sequence o f CCR w ith size of 58 1 bp
35 Polymerase Chain Reaction (PCR)
PCR reaction mi xture includes 30 ng of DNA template 5 pmol of forward and reverse
primers 02 mM dNTPs I x PCR buffer (200 mM Tris-HCI pH 88 100 mM KCL I Triton
X-I OO 100 mM (NH4)zS04 I fl g mL BSA) 15 mM MgC l1 I U Toq DNA Polymerase
(Promega USA) and steril e distill ed water to make up 25 fl
CCR amplifIca ti on for primer set I was done in Mastercycler Gradient Thennal Cycler
(Eppendorf Gemlany) for 2 min at 95T 35 cycles of 45 sec at 9rc 45 sec at 496degC and I
min at 72degC fo llowed by fina l ex tension of 10 min at 72degC On the other hand CCR
amplifi cation fo r primer set 2 was done in Mastercycler Gradient Thennal Cycler (Eppendorf
Gennany) for 2 min at 95degC 35 cycles of 45 sec at 94 C 45 sec at 65 degC and I min at 72C
14
followed by final extension of 10 min at 72 C The PCR products were then examined on a
15 agarose gel and 100bp DNA ladder (BioLabs New England) was run simultaneously
36 Cloning
361 Purification of DNA from Agarose Gel
Purification of DNA from agarose gel was performed through QIAquick~ Gel Ext ractlOn Kit
QIAGEN Gennany The PCR product was excised and transferred into pre-weight
microcentrifuge tub e The tube that contained the gel fragment was weighted again to obtain
the amount of gel Then 3 volumes of Buffer QG was added to I volume of gel and
incubated at SOT for 10 min or until the gel is fully dissolved Later I gel vo lume of
isopropanol was added and mixed by fli cking A QIAquick spin vo lume was placed in a
provided 2 ml collection tube The DNA mixture was then pi petted into the column and
centrifuged for I min
After that the flow tuough was di scarded and the co lumn was placed back to the
coll ection tube Next 750 III of Buffer PE was added into the column and centrifuged for I
min The flow throu gh was discarded and centri fuged again for 5 min then a QIAquick
column was placed into a clean 15 ml microcentrifuge tube Then 50 III of di stilled water
was added to the centre of the membrane and the column was centrifuged for I min Fina ll y
the DNA was examined on a 15 agarose ge l and A Hind III DNA marker (Promega USA)
was run simultaneously to detem1ine DNA concentrati on
362 DNA Ligation
15
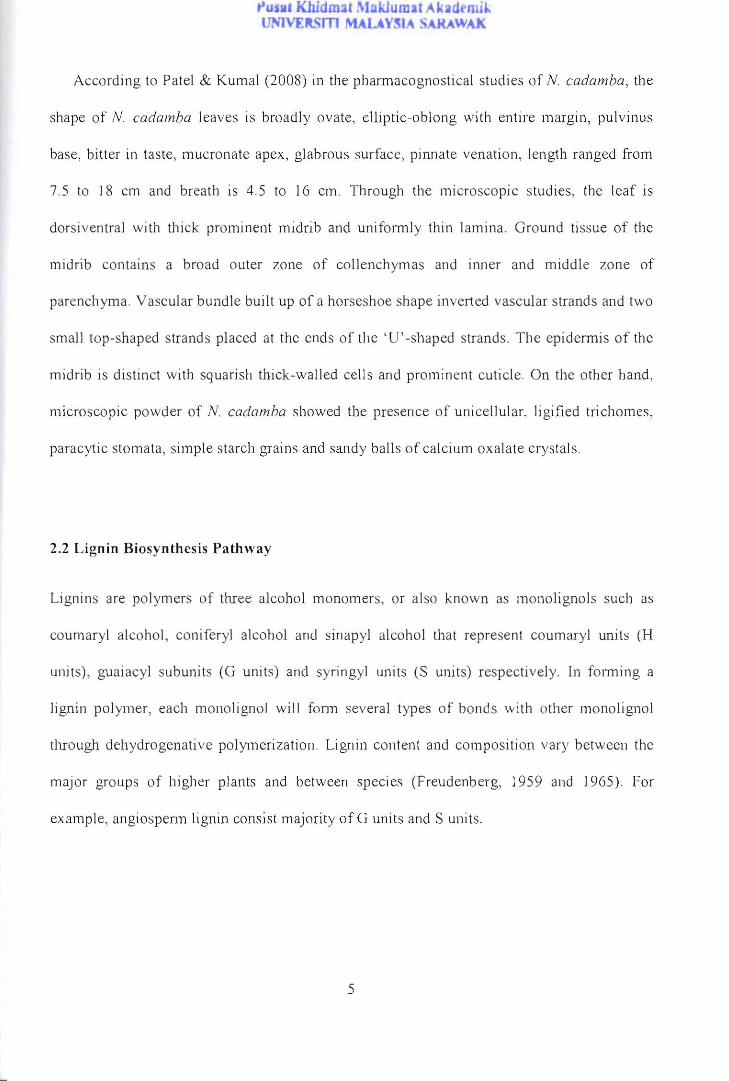
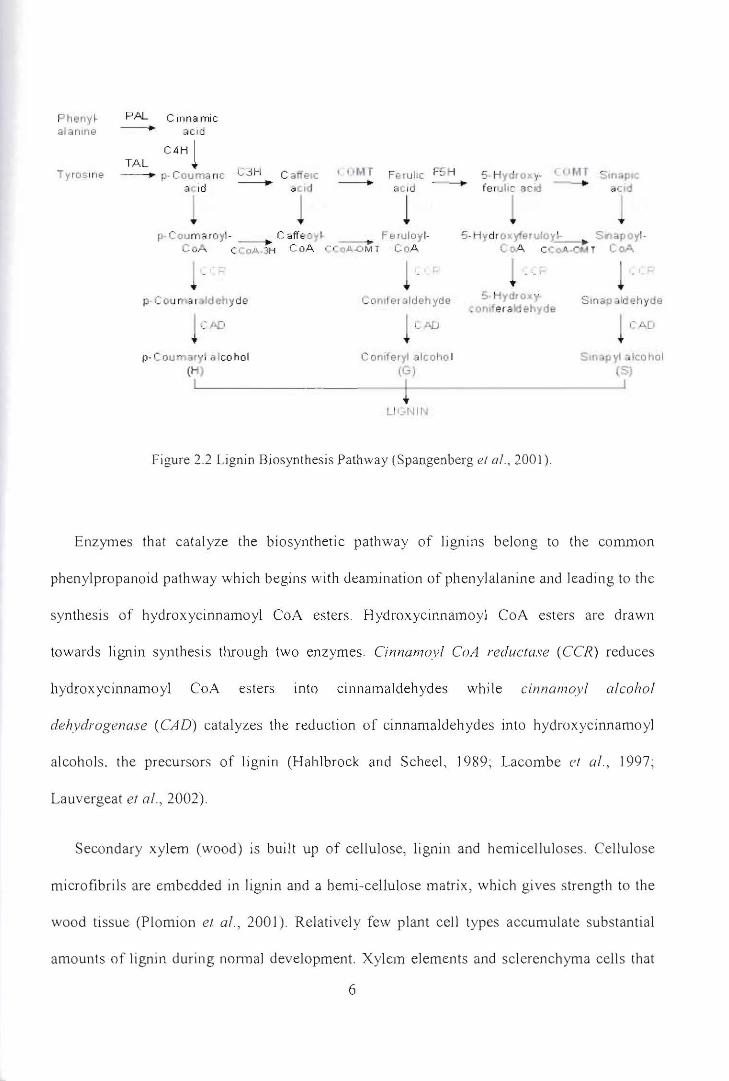
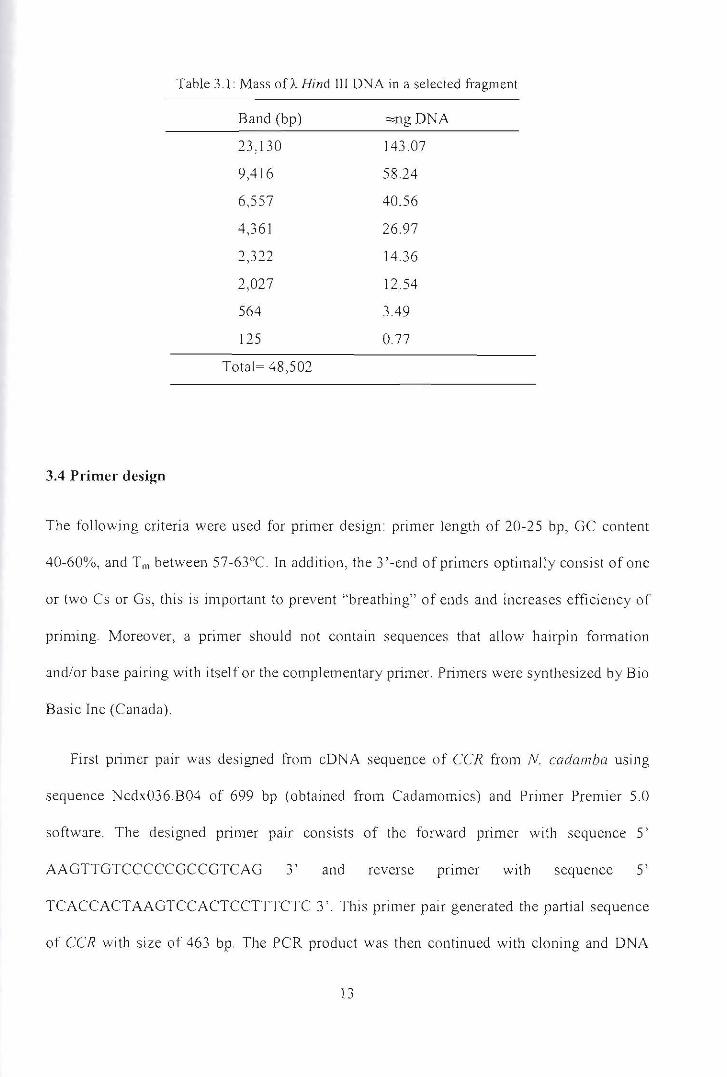