
DESIGN, SET-UP, AND TESTING OF A MATRIX ACIDIZING APPARATUS...
90
DESIGN, SET-UP, AND TESTING OF A MATRIX ACIDIZING APPARATUS A Thesis by JAVIER NEVITO GOMEZ Submitted to the Office of Graduate Studies of Texas A&M University in partial fulfillment of the requirements for the degree of MASTER OF SCIENCE August 2006 Major Subject: Petroleum Engineering
Transcript of DESIGN, SET-UP, AND TESTING OF A MATRIX ACIDIZING APPARATUS...
DESIGN, SET-UP, AND TESTING OF A MATRIX ACIDIZING APPARATUS
A Thesis
by
JAVIER NEVITO GOMEZ
Submitted to the Office of Graduate Studies of Texas A&M University
in partial fulfillment of the requirements for the degree of
MASTER OF SCIENCE
August 2006
Major Subject: Petroleum Engineering

DESIGN, SET-UP, AND TESTING OF A MATRIX ACIDIZING APPARATUS
A Thesis
by
JAVIER NEVITO GOMEZ
Submitted to the Office of Graduate Studies of
Texas A&M University in partial fulfillment of the requirements for the degree of
MASTER OF SCIENCE
Approved by:
Chair of Committee, A. Daniel Hill Committee Members, Ding Zhu
Zhengdong Cheng Head of Department, Stephen A. Holditch
August 2006
Major Subject: Petroleum Engineering

iii
ABSTRACT
Design, Set-Up, and Testing of a Matrix Acidizing Apparatus. (August 2006)
Javier Nevito Gomez, B.Sc., Universidad Surcolombiana
Chair of Advisory Committee: Dr. A. Daniel Hill
Well stimulation techniques are applied on a regular basis to enhance
productivity and maximize recovery in oil and gas wells. Among these techniques,
matrix acidizing is probably the most widely performed job because of its relative low
cost, compared to hydraulic fracturing, and suitability to both generate extra production
capacity and to restore original productivity in damaged wells. The acidizing process
leads to increased economic reserves, improving the ultimate recovery in both
sandstone and carbonate reservoirs.
Matrix acidizing consists of injecting an acid solution into the formation, at a
pressure below the fracture pressure to dissolve some of the minerals present in the rock
with the primary objective of removing damage near the wellbore, hence restoring the
natural permeability and greatly improving well productivity. Reservoir heterogeneity
plays a significant role in the success of acidizing treatments because of its influence on
damage removal mechanisms, and is strongly related to dissolution pattern of the matrix.
The standard acid treatments are HCl mixtures to dissolve carbonate minerals and HCl-
HF formulations to attack those plugging minerals, mainly silicates (clays and feldspars).
A matrix acidizing apparatus for conducting linear core flooding was built and
the operational procedure for safe, easy, and comprehensive use of the equipment was
detailed. It was capable of reproducing different conditions regarding flow rate, pressure,
and temperature. Extensive preliminary experiments were carried out on core samples of
both Berea sandstone and Cream Chalk carbonate to evaluate the effect of rock
heterogeneities and treatment conditions on acidizing mechanisms.

iv
The results obtained from the experiments showed that the temperature activates
the reaction rate of HF-HCl acid mixtures in sandstone acidizing. The use of higher
concentrations of HF, particularly at high temperatures, may cause deconsolidation of
the matrix adversely affecting the final stimulation results. It was also seen that the
higher the flow rate the better the permeability response, until certain optimal flow rates
are reached which appears to be 30 ml/min for Berea sandstone. Highly permeable and
macroscopic channels were created when acidizing limestone cores with HCl 15%. In
carbonate rocks, there is an optimum acid injection rate at which the dominant wormhole
system is formed.

v
DEDICATION
To my wife Elizabeth and my children, Ana María and Luis Guillermo, the
source of my inspiration.

vi
ACKNOWLEDGMENTS
I would like to thank my advisors Dr. A. Daniel Hill and Dr. Ding Zhu who
guided me throughout the course of this research with extraordinary kindness and
patience.
Thanks to ECOPETROL, the Colombian Oil State Company, for supporting me
with the sponsorship. Finally thanks to Dr. Zhengdong Cheng, for his help and support
as a member of my committee.

vii
TABLE OF CONTENTS
CHAPTER Page
ABSTRACT ............................................................................................................ iii
DEDICATION ..........................................................................................................v
ACKNOWLEDGMENTS........................................................................................vi
TABLE OF CONTENTS ........................................................................................vii
LIST OF FIGURES..................................................................................................ix
LIST OF TABLES ...................................................................................................xi
I INTRODUCTION ...........................................................................................1
1.1 Matrix acidizing fundamentals..........................................................1 1.2 Literature review and history of matrix acidizing.............................4 1.3 Objective of the research work..........................................................7
II DESIGN OF A MATRIX ACIDIZING SETUP............................................10
2.1 System requirements .......................................................................11 2.2 System components.........................................................................12
2.2.1 Pumps ...............................................................................12 2.2.2 Core holder .......................................................................14 2.2.3 Accumulators ...................................................................16 2.2.4 Heaters and temperature controller ..................................17 2.2.5 Back pressure regulator ....................................................21 2.2.6 Data acquisition................................................................23 2.2.7 Core preparation equipment and core description............27 2.2.8 Piping network, valves, and fittings .................................29 2.2.9 Hydraulic pump................................................................30
III EXPERIMENTAL DETAILS STUDY .........................................................31
3.1 Matrix acidizing experiment details ................................................31 3.2 General matrix acidizing procedure ................................................35 3.3 Core sample saturation procedure ...................................................36 3.4 Acid preparation ..............................................................................37 3.5 Accumulators charging ...................................................................38

viii
CHAPTER Page
3.6 Detailed matrix acidizing procedure ...............................................40 3.7 Safety issues and precautions ..........................................................43
IV PRELIMINARY EXPERIMENTS AND RESULTS ....................................45
4.1 Experiments parameters ..................................................................45 4.2 Preliminary experiments results on sandstone cores.......................47 4.3 Preliminary experiments results on carbonate cores .......................56
V CONCLUSIONS AND RECOMMENDATIONS.........................................60
5.1 Conclusions .....................................................................................60 5.2 Recommendations for future research work on matrix acidizing ...61
REFERENCES........................................................................................................63
APPENDIX A Matrix acidizing experiment data sheet sample.....................65
APPENDIX B Detailed procedure to program the LabVIEW DAQ .............66
VITA .......................................................................................................................79

ix
LIST OF FIGURES
FIGURE Page
2. 1 Schematic of matrix acidizing laboratory set-up......................................10
2. 2 Teledyne ISCO D500 precision syringe pump.........................................13
2. 3 Core holders 1”, 1.5”, and 4’ diameter by 6” and 20” long. ....................15
2. 4 Schematic drawing showing details of core holder..................................16
2. 5 Acid accumulators, PVC refill container, and brine accumulator............17
2. 6 Omegalux rope heater ..............................................................................18
2. 7 Type jacket heater Delta MFG, wrapping the core holder .......................19
2. 8 OMEGA CSC32K-C2 benchtop controller..............................................20
2. 9 GLASCOL Digitrol II temperature controller .........................................20
2. 10 Mity-Mite model S91-W back pressure regulator....................................22
2. 11 Schematic drawing with details of Mity-Mite model S91-W BPR..........22
2. 12 FOXBORO pressure transducers .............................................................24
2. 13 Schematic of pressure signal acquisition .................................................24
2. 14 NI Interface board CB-68LP DAQ ..........................................................25
2. 15 Data acquisition LabVIEW program (front panel) ..................................26
2. 16 Data acquisition LabVIEW program (block diagram).............................27
2. 17 Heavy duty HILTI DD200 core driller and core bits ...............................28
2. 18 Core samples of three different rocks ......................................................29
2. 19 ENERPAC model P392 hydraulic pump .................................................30

x
FIGURE Page
3. 1 Viscosity of brine .....................................................................................33
3. 2 Viscosity of HF-H2O system. ................................................................35
3. 3 Vacuum glass bell to saturate cores. ........................................................37
3. 4 Schematic of recharging system...............................................................39
4. 1 Inlet face of acidized Berea sandstone cores............................................47
4. 2 Acid response curve from a Berea core....................................................48
4. 3 Scanning visualization of the Berea sandstone core ................................49
4. 4 Pressure drop data as recorded in LabVIEW program.............................50
4. 5 Effect of temperature on acidizing Berea sandstone ................................51
4. 6 Effect of flow rate on acidizing Berea sandstone at room temperature ...52
4. 7 Effect of flow rate on acidizing Berea sandstone at 100 oF.....................53
4. 8 Slope change during main acid stage .......................................................53
4. 9 Dissolved minerals in bedding planes of the cores ..................................54
4. 10 Inlet face of cores acidized with 9% HCl- 6% HF...................................54
4. 11 Acid response curve of Berea acidized with 9% HCl- 6% HF ................55
4. 12 Effect of acid concentration on Berea sandstone .....................................56
4. 13 Pressure drop during acidizing carbonate cores .......................................57
4. 14 Wormholes at inlet and outlet face of carbonate cores ............................58
4. 15 Optimum injection rate for wormholing in Cream chalk .........................58
4. 16 Wormholes in Cream chalk......................................................................59

xi
LIST OF TABLES
TABLE Page
1. 1 Original McLeod’s sandstone acidizing use guidelines .............................5
1. 2 Modified use guidelines from Kalfayan.....................................................6
3. 1 Dynamic viscosity of aqueous solutions of HCl ......................................34
4. 1 Mineral composition of Berea sandstone………….. ...............................47

1
CHAPTER I
INTRODUCTION
1.1 Matrix acidizing fundamentals
Matrix acidizing is one of the oldest well-stimulation techniques used to remove
damage near the wellbore. It was initially applied in carbonate reservoirs and over the
years it has been extended to more complex mineralogies. So far, matrix acidizing is
often considered for many people as risky to undertake due primarily to heterogeneous
nature of formation minerals and an appreciable degree of unpredictability of their
response to acid formulations1; however, it is a relatively simple stimulation technique
that has became one of the most cost-effective method to improve significantly the well
productivity and hence the hydrocarbons recovery.
During matrix acidizing treatments the acid is injected at pressures below the
parting pressure, to avoid fractures being created during the treatments, searching for
improving the permeability in the vicinity of the wellbore rather than affecting the
reservoir to a great extent; the acid reacts within a few inches form wellbore in
sandstones and a few feet in carbonates2. In sandstone formations, matrix acidizing may
enhance significantly the well performance by removing the near wellbore damage,
primarily associated with plugging of pores by siliceous particles as the consequence of
drilling, completion, stimulation, perforating, and production operations; therefore their
natural permeability can be restored.
Hydrofluoric acid (HF) is the only common acid that dissolves clay, feldspar and
quartz fines. For years mixtures of HF and HCl have been the standard acidizing
treatment to dissolve the minerals that cause damage. These treatments are preceded
by a preflush of either HCl varying between 7.5% to 15% or weaker acids such acetic
___________________ This thesis follows the style of SPE Journal.

2
acid to dissolve carbonates and avoid precipitation of calcium fluoride3. The main
readily HCl-soluble minerals are calcite, dolomite, and siderite which additionally do not
generate precipitates. The reactions are:
Calcite 2HCl + CaCO3 ------- CaCl2 + H2O + CO2
Dolomite 4HCl + CaMg(CO3)2 ------- CaCl2 + MgCl2 + 2H2O +2CO2
Siderite 2HCl + FeCO3 ------- FeCl2 + H2O + CO2
Quartz, clay, and feldspars are the main siliceous particles involved in damage of
sandstones. The primary chemical reactions in sandstone acidizing are:
Quartz SiO2 + 4HF ------- SiF4 (silicon tetrafluoride) + 2H2O
SiF4 + 2HF ------- H2SiF6 (fluosilicic acid)
Clays (kaolinite) Al4Si4O10(OH)8 + 24HF + 4H+------- 4AlF2 + 4SiF4 + 18H2O
(montmorillonite) Al4Si8O20(OH)4 + 40HF + 4H+----- 4AlF2 + 8SiF4 + 24H2O
Feldspars (Mg, Na or K) KAlSi3O8 + 14HF + 2H+------ K+ + AlF2 + 3SiF4 + 8H2O
The major issues that determine design of matrix acid treatments are the reservoir
characterization which comprises the understanding of formation mineralogy,
permeability, porosity, and reservoir fluid dynamics. Formation damage assessment in
turn includes laboratory analysis, fluid compatibility and core testing4. As a general basis,
the treatments normally follow this procedure:
o Preflush, (HCl or Hac)
o Main acid (HF) stage
o Postflush stage
o Diverter stage
o Repeat previous stages (as necessary)
o Final flush

3
The main acid stage requires the greatest emphasis because of the damage
mechanisms, directly associated to precipitation of products from the HF reactions.
Secondary reactions may occur between fluosilicic acid H2SiF6, a byproduct of primary
reaction, and aluminum-silicates, clays and feldspars. These reactions are considered to
have adverse effects since silicon can be precipitated as hydrated silica, which
contributes to damage if mobile even though the presence of HCl to reduce the pH to
prevent silica and flousilicate precipitation. Conversely, some authors believe these
reactions are beneficial because they retard HF reactions allowing deeper penetration.
Additionally, HF dissolves native clays and feldspars, and when reacting with quartz
may also cause formation deconsolidation by weakening the matrix.
Precipitation will always take place, associated with HF concentration among
other things; however, it tends to be more severe if HF acid treatments are not properly
displaced. Acid stimulation techniques have to account for both chemistry and treatment
execution to accurately predict the effectiveness since the effect of these precipitates
could be minimized if they are deposited far from the wellbore4, 5. Careful selection of
mixtures, additives, acids formulations, and treatment volumes must be accounted to
minimize these secondary adverse effects.
Reservoir geology and mineralogy are the relevant issues for successfully
removing the acid-soluble particles present in reservoirs; removal mechanisms are
strongly related to dissolution pattern of the matrix. Recent studies have shown that one
of the most important factors that determines the etching pattern is the heterogeneity of
the rock. In sandstones, the variations in permeability, porosity, and mineralogy may
drive the acid to follow certain paths, the highly permeable channels called wormholes6.
There is experimental evidence that wormhole dissolution patterns can be achieved
particularly using high HF concentrations and elevated temperatures 4, 7; however, the
risk of precipitation and rock deconsolidation might significantly be increased.
Sandstone matrix acidizing can not be considered as an exact and predictable set
of rules; thus, the appropriate design of treatments almost never has only one right

4
answer. That is an inherent problem of the complex and heterogeneous nature of most
sandstone matrices. The interactions between different minerals and the injected acid
depend on the chemistry, as well as temperature, pressure, pore-size distribution, surface
morphology, and pore- fluid composition1.
1.2 Literature review and history of matrix acidizing
Acidizing may be considered as the oldest well stimulation technique, hydraulic
fracturing has more recent development. The earliest acid jobs were performed by 1890
to stimulate limestone formations by using HCl. In the 1930’s acidizing emerged as a
suitable method for scale removal and the corrosion inhibitors were also developed.
As a direct consequence of successfully applications of acid in limestone
formations, interest in sandstone treatments began growing. In 1933, Jesse Rusell
Wilson patented the application of hydrofluoric acid for treating sandstone formations
calling for HF generation either in the wellbore or in the formation to avoid the risk in
handling this “extremely dangerous material”. The most remarkable aspect of Wilson’s
work is its awareness of the damage caused by acid soluble solids plugging.
In the same year Halliburton conducted the first sandstone treatment using a
mixture of hydrochloric and hydrofluoric acid with discouraging results of high sand
production; therefore Halliburton did not offer this treatment during the next 20 years.
In late 1930’s Dowell (Dow Well Service) introduced the “famous” mixture of
12% HCl and 3% HF, called “Regular Strength Mud Acid”, whose main objective was
initially the removal of the drilling mud filter cake from the wellbore8. In 1984 McLeod
presented the basic guidelines for proper designing of acid treatments based on
formation mineralogy, an important issue which is often overlooked. These guidelines
are presented in Table 1.1.

5
Table 1. 1 Original McLeod’s sandstone acidizing use guidelines
_______________________________________________________________________
Formation Main acid Preflush _______________________________________________________________________
Solubility in HCl >20% Use HCl only
High Permeability (>100 mD)
High quartz (> 80%); low clay (<5%) 12% HCl-3% HF 15% HCl
High feldspar (>20%) 13.5% HCl-1.5% HF 15% HCl
High clay (>10%) 6.5 HCl-1% HF Sequestered 5% HCl
High iron chlorite clay 3% HCl-0.5% HF Sequestered 5% HCl
Low Permeability (10 mD or less)
Low clay (<5%) 6% HCl-1.5% HF 7.5% HCl or 10% Hac
High chlorite 3% HCl-0.5% HF 5% Hac
_______________________________________________________________________
These guidelines have been modified since its introduction to fill certain gaps
and must be considered as a starting point in treatment design. Kalfayan8 presented a
modification of the basic guidelines for conventional sandstone acidizing based on
successive modification from McLeod’s work and his own experience, as summarized in
Table 1.2.
In 1999 Da Motta et al3 presented evidence of successful application of
fluosilicic acid to effectively stimulate sandstone in two injector wells in off-shore Brazil.
They called to account for the relevant role of secondary reaction of H2SiF6 with clays to
remove formation damage, emphasizing the fact that comparing with conventional HF
treatments, the lower cost of fluosilicic acid as a by-product of sodium fluoride makes it
a viable option to routine acidizing treatments.

6
Table 1. 2 Modified use guidelines from Kalfayan _____________________________________________________________________________________
Formation Main acid Preflush _____________________________________________________________________________________
Solubility in HCl > 15-20% Avoid use of HF, if possible
Calcite or dolomite 15% HCl only(1) 5% NH4Cl
High iron carbonate (siderite, Ankerite) 15% HCl + iron control(1,2) 5% NH4Cl + 3% Acetic
High permeability (> 100 mD) (3,4)
High quartz (>80%); low clay (<5%) 12% HCL-3% HF 15% HCl
Mod. Clay (5-8%); low feldspar (<10%) 7.5 HCl, 1.5% HF 10% HCl
High clay (>10%) 6.5 HCl-1% HF 5-10% HCl
High feldspar (>15%) 13.5% HCL-1.5% HF 15% HCl
High feldspar (>15%) and clay (>10%) 9% HCL-1% HF 10% HCl
High iron chlorite clay (>8%) 3% HCl-0.5% HF or, 5% HCl
10% acetic- 0.5% HF 10% acetic + 5% NH4Cl
Medium permeability (10-100 mD)(3,4)
High clay (>5-7%) 6% HCl- 1% HF 10% HCl
Lower clay (<5-7%) 9% HCl- 1% HF 10% HCl
High feldspar (>10-15%) 12% HCl-1.5% HF 10-15% HCl
High feldspar (>10-15%) and clay (>10%) 9% HCl-15 HF 10% HCl
High iron chlorite clay (> 8%) 3% HCl-0.5% HF or, 5% HCl
10% acetic- 0.5% HF 10% acetic + 5% NH4Cl
High iron carbonate (>5-7%) 9% HCl-1% HF 5% HCl
K< 25 mD 5% HCl-0.5% HF 10% HCl
Low permeability (1-10 mD)(3,4,5)
Low clay (<5%); low HCl sol. (<10%) 6% HCl- 1.5% HF 5% HCl
High clay (>8-10%) 3% HCl- 0.5% HF 5% HCl
High feldspar (>10 9% HCl-1% HF 10%HCl
High iron chlorite clay (> 5%) 10% acetic-0.5% HF or, 10% acetic + 5% NH4Cl
Very low permeability (<1 mD) Avoid HF acidizing; non-HF matrix stimulation (dictated by damage) or hydraulic fracturing is preferred.
_____________________________________________________________________________________

7
Table 1. 2 Continued
_____________________________________________________________________________________ (1) Location of carbonate in matrix is important; it may be possible to include HF in naturally fractured formations with high carbonate content. (2) HCl can be replaced by acetic or formic acid- partially or completely-especially at higher temperatures (250-300 o F). (3) If zeolites (analcime) are present (> 3%), consider replacing HCl with 10% citric acid or special service company organic acids. (4) For higher temperatures (> 225-250 o F), consider replacing HCl with acetic or formic acid. (5) Although fracturing may be preferable, low permeability, low clay containing sands may respond
favorable to HF acidizing-contrary to conventional wisdom.
In 2000, Kalfayan et al.4 presented results of a job using high HF concentration
up to 6% at 265 oF, achieving permeability increases as high as 200 %. Previous
experimentation on cores showed the formation of larger channels although the integrity
of the rock was reduced in a 40%. In 2002, Thomas et al7 presented their results on core
flood testing at temperatures as high as 300 oF; they observed channeling depending
upon the type of preflush, HF concentration, core permeability, and heterogeneity of the
core. These channels were enhanced with HCl instead of acetic acid, resulting in a
positive impact on the field production.
More recently, some authors have called for the necessity of using non HF-based
systems because of the nature of damaging potential inherent in the reactions between
sandstone minerals and HF9. They insist in the capability of these new systems to
stimulate effectively, specially those formations with high content of HCl soluble
minerals.
1.3 Objective of the research work
The present research project aim to design and set up an apparatus to carry out
matrix acid displacements in both, sandstone and carbonate cores, to determine the

8
formation damage removal, permeability improvement, and minerals dissolution in the
former by the acidizing processes, as well as evaluate the matrix acidizing behavior, the
effect of rock heterogeneity, and to determine the optimal injection rates to create the
acid created channels in the latter.
Conduct extensive experiments in both, sandstone and carbonate cores, to
validate the operative suitability and reliability of the apparatus under a broad range of
conditions, flow rate, temperature, volume pumped, and acid concentration. The new lab
setup must reproduce as much as possible the characteristics of the treatments in field
conditions to investigate the effects of matrix acidizing on diverse types of rock;
therefore the results can be likewise escalated.
The new apparatus has been designed to be safe and easily operable, with the
purpose of displacing diverse types of acid at different conditions; the operation
procedure will be detailed. The wetted parts are made of Hastelloy C-276, an special
alloy to prevent the attack of acid; three core holder will be available for different sizes
of cores, two syringe precision pumps allow the wide range in flow rates (from 0.2 up to
204 cm3/min) at high pressures (up to 3500 psi).
The experimental measured data are to be processed and interpreted; detailed
procedures are to be developed for each experiment stage. The equipments and
instruments specifications are to be listed. The major lab setups are illustrated and the
future work about this project is discussed.
The complete test of matrix acidizing comprises the following steps:
o The core sample preparation, which includes sandstone and carbonate
cutting at different sizes and further vacuum saturation with brine.
o Determination of initial porosity and permeability of the cores by using the
helium porosimeter and the air permeameter.

9
o If possible, analyze the samples with CT-Scan equipment to determine their
degree of heterogeneities and initial pore distribution.
o Brine and acid preparation, preflush and postflush, and injection through
the core samples to conduct the experiment.
o Record the pressure data from the test, generation, and analysis of acid
response curve of the specific sample to be analyzed.

10
CHAPTER II
DESIGN OF A MATRIX ACIDIZING SETUP
In this chapter we shall determine the components and specifications necessary to
complete the proposed apparatus, which must be capable to deal with the required
conditions for experimentation on different size core samples at flow rates and
temperatures similar to those to be encountered at field conditions. Figure 2.1 is the
schematic of the apparatus.
Figure 2. 1 Schematic of matrix acidizing laboratory set-up
As illustrated in fig. 2.1, brine and acid previously prepared and stored in the
accumulators, are pumped and heated up, according to the test procedure and particular
�����������
���� ������
� ���� ����
��������������������
�������������
������� ��������������� ������
���������� ������ ����������� �� ����
�����!
"������!
#�$�!
% ��
��� ��&'������� ��� ��
'���������

11
conditions, via the tubing network and flows through the cores samples within the core
holder. The core sample is confined inside the core holder with a Viton sleeve by a
hydraulic pump. The spent acid is gathered and measured in the beaker at the end of the
process. The back pressure provided for nitrogen supply via the teflon diaphragm BPR
maintain the CO2 in solution.
During the matrix acidizing experiments, the flow rate, temperature, confining
pressure (overburden), and back pressure are set and maintained constant; the
differential pressure across the core during the process is measured by analog pressure
transducers and recorded by the LABVIEW software to construct and analyze the acid
response curve. All the equipment reside inside a laboratory exhaust system to vent the
acid fume.
2.1 System requirements
The main parts considered essential for the purposes of the set up are the
following:
o Pumps capable to displace at a broad range of flow rates and suitable to work on
either constant flow rate or constant pressure modes.
o Core holders, special alloy made to prevent acid corrosion for a long time and
high pressure and temperature resistant.
o Accumulators to store the acid mixtures required during the different tests at
different concentrations.
o Heaters and temperature controllers to increase temperature up to desired levels
and as occurring at field conditions.
o Back pressure regulator to provide the necessary pressure against the flow
maintaining the CO2, product of the acid reactions, in solution.

12
o Data acquisition system for monitoring and getting the data generated in the
acidizing process for further analysis.
o Flow system to serve as a network for the different fluids to be used in the
experimentation, oil, brine, and acids.
o Hydraulic pump to provide the necessary confining pressure to the core within
the core holder.
2.2 System components
2.2.1 Pumps
In matrix acidizing experimentation, a versatile pumping system is required
depending on the particularities of each type of rock to be treated and the desired
conditions to affect the acidizing process. Among these conditions one of the most
important is the flow rate at which the fluids are to be displaced; in the majority of the
experiments this flow rate must be constant during the process to accurately determine
the pressure changes in the rock while the fluids are passing through the core.
After visiting the laboratories of two majors services companies, BJ Services and
Schlumberger, we defined that the best option for our application is the Teledyne ISCO
500D; see figure 2.2. This pump is a syringe precision type which makes it the ideal
equipment for a wide range of chemical feed applications requiring flow rates up to 200
ml/min at pressures up to 3,750 psig; its 500 ml cylinder capacity allows delivering a
precise 1 ml/minute for over 8 hours on a single fill.
The ISCO D500 pump uses a "Smart Key" controller that can operate any three
pump modules, either independently or together. Operating modes include either single
or dual pump independent constant flow or pressure and it additionally comes with a RS-

13
232 serial interface for computer control or monitoring of operating parameters using
commercial LabVIEW software.
Figure 2. 2 Teledyne ISCO D500 precision syringe pump
The specifications of the equipment are:
o Capacity: 507 ml
o Flow range (ml/min): 0. 001 - 204
o Flow accuracy: 0.5% of set point
o Displacement resolution: 31.7 ml
o Motor stability: ± 0.001% per year
o Pressure range (psi): 0- 3,750
o Standard pressure accuracy: 0.5% FS
o Optional pressure accuracy: 0.1% FS
o Wetted materials (standard): Nitronic 50, PTFE, Hastelloy C-276

14
o Plumbing ports: 1/8" NPT
o Operating temperature: 0 - 40° C Ambient
o Power required: 100 Vac, 117 Vac, 234 Vac, 50/60 Hz
o Dimensions (HxWxD, cm): 103 x 27 x 45
o Weight: Pump module - 33 kg; controller - 3 kg
The set-up has two pumps installed in parallel which use hydraulic oil as a
driving fluid to avoid direct contact with extremely corrosive conditions during testing.
Inlet and outlet ports, that constitute the refill and dispense lines, are 1/8" NPT female
threads connected to 1/8” stainless steel tubing forming the discharge manifold which in
turn are connected using “gyrolok” type of compression fittings.
The cylinder of each pump must be filled first before any use by selecting
REFILL mode in the controller; discharge and refill lines are independent and the valves
in the manifold are to be operated carefully during any operation being done. Once the
cylinder is empty after running the pump through a test, close the discharge valve and
open the refill valve; select the pump in the controller and push the refill button. It is
recommended refill at a flow rate of 30 to 40 ml/min. The refilling process may be
performed at the same time the other pump is running. After refill is complete, close the
refill valve and keeping the discharge valve closed, start the pump at 5 to 10 ml/min until
reaching the discharge pressure, then open the valve and equalize the pressure.
2.2.2 Core holder
The core holder is perhaps the most important part of the system for matrix
acidizing purposes; these are the cells where the core samples are confined to displace
the fluids through them.
Because of the nature of fluids to be used, hydrochloric and hydrofluoric acids at
different concentration and temperatures, the core holders need to be made of special

15
alloy material. Our core holders were manufactured by Phoenix Instruments, made of
Hastelloy C276, a corrosion resistant material and capable to withstand a working
pressure of 3000 psi and temperatures of about 300 o F. Figure 2.3 shows the three core
holders available in the matrix acidizing laboratory.
Figure 2. 3 Core holders 1”, 1.5”, and 4’ diameter by 6” and 20” long.
Each core holder comes with the regular inlet and outlet tip with ports 1/8” and
the distribution pattern to contact the total face area of the core; inside the cylinder a
special rubber Viton sleeve, temperature resistant, has been adapted to confine the core
once in use.
The core holders were though to allow the recirculation of mud and conduct
different type of experiments on jetting acidizing; therefore additional set of tips with
spacers were purchased to use in this particular application in which is necessary first to
create a certain filter mud cake in the face of core sample. Figure 2.4 shows the drawings
and the details of the core holders.

16
Figure 2. 4 Schematic drawing showing details of core holder
2.2.3 Accumulators
The accumulators were manufactured by Phoenix Instruments and they are type
piston. These parts of the set up are the vessels where the products to be displaced
through the cores during the acidizing experimentation are contained. Figure 2.5 shows
the piston accumulators actually installed in the set up with their corresponding stands
and entrance lines.
Three of these accumulators were designed to be corrosion resistant that means
they are made of special alloy material, Hastelloy C-276, with capacities of 1000 ml and
2000 ml the largest one; there is also one accumulator stainless steel made because is
tough to use for brine containment whose capacity is 1500 ml. All of the accumulators
have inlet and outlet ports 1/8” NPT.

17
Figure 2. 5 Acid accumulators, PVC refill container, and brine accumulator
The displacement of the acid and brine is performed by the syringe pumps that
pump the hydraulic oil which in turn acts on the Teflon piston pushing either the acid or
brine out at necessary pressure and flow rate to carry them to the core via pipe network
until reaching the core face into the core holder.
To refill the piston accumulators with either acid or brine, a PVC container is
filled first with a funnel and then air at 100 psi from the laboratory air system, push the
products into the accumulators to be ready for experiments. It is necessary to vent the oil
line on top of the accumulator to allow either the acids or brine to be entered into the
accumulators as the oil inside them is removed. This operation must be done
independently for each accumulator. This procedure will be described in more detail in
chapter III.
2.2.4 Heaters and temperature controller
Temperature is a relevant factor that affects the reaction rates and kinetics of
chemical reactions between minerals and acids; in the case of HF with sandstone
minerals the kinetics expressions can be represented by:

18
-rmineral = Ef [1+K (CHCl)β] Cα HF (2.1)
and
Ef = Ef o exp(-∆E/RT) (2.2)
It is also well known that actual reservoir temperatures are much higher than
atmospheric or room temperature; therefore, temperature becomes an important aspect to
be considered when simulating different conditions at which the acidizing experiments
are conducted. To make the set up capable to reproduce real conditions on matrix
acidizing and study the effect of temperature on mineral dissolution and wormholing
patterns two different heaters were considered and installed on the apparatus.
A rope heater manufactured by OMEGA is used in the lab set-up, which is
shown in Figure 2.6. This heater is capable to wrap around small diameter tubing, as
small as 1/8” and for use in either conductive or non-conductive surfaces. Its maximum
allowable temperature is 900 o F, the wattage is 500 w at 120 volts, and it is 10 feet long.
The rope heater was installed wrapping the general flow line between the discharge of
the accumulators and the inlet valve before entering the core holder.
Figure 2. 6 Omegalux rope heater

19
Another different heater system has been in use acting directly on core holder
wrapping the cylinder, it is ceramic type jacket. This device is much more powerful than
rope heater one with a wattage up to 1600 at 120 volts, and capable to rise temperature
also up to 900 o F, it is manufactured by Delta MFG. It can be seen in Figure 2.7.
Figure 2. 7 Type jacket heater Delta MFG, wrapping the core holder
The temperature of the acidizing process must be maintained fairly constant to
ensure the reliability of the results; so two controllers are then used. First the temperature
of the preheated fluids coming from the accumulators is controlled by compact benchtop
CSC32 series which has 4-digit display, 1 or 0.1° resolution with an accuracy of ±
0.25% full scale ± 1°C. It uses a type K thermocouple and two Outputs (5 A 120 Vac
SSR); Figure 2.8 shows this type of device. The thermocouple located downstream,
senses the temperature of the fluid displaying it in screen and maintain it constant.

20
Figure 2. 8 OMEGA CSC32K-C2 benchtop controller
To control the temperature in the jacket wrapping the core holder is used a
GLASCOL Digitrol II temperature controller which uses a 1/16 DIN microprocessor-
based, user-selectable control mode temperature control. The control features a digital
dual output display for set point and process temperature indication. The load and the
thermocouple receptacles are located on the front panel; the thermocouple is type J
installed upstream, so the set point is given by the temperature of the fluid coming out
the core. The accuracy is 0.1% of span, it has up/down keys for set point and °F or °C
can be displayed as necessary. Figure 2.9 shows the GLASCOL controller.
Figure 2. 9 GLASCOL Digitrol II temperature controller

21
These two heater rise temperature very fast and it is important never let the
heater on for a long time when there is no fluid flow in the flow line, and exceeds the
working temperature of the core holder, 300 o F to prevent early tubing and equipment
metal failure, as well as risk of accident.
2.2.5 Back pressure regulator
Back pressure is necessary during the experiments at the core outflow to simulate
down-hole conditions, as the pore pressure does in actual strata conditions, to avoid the
presence of free CO2 gas bubbles, which can lead to undesirable two-phase effects and
might increase the fines migration phenomenon. The backpressure must be kept constant
and it is desired to be 300 - 400 psi less than the overburden pressure.
One Mity-Mite back pressure regulator model S91-W is installed on the upstream
line. The pressure in the line controls the effluent flow and exerts the resistance for the
purpose described above, maintaining constant pressure upstream; the pressure is the
same as the nitrogen dome pressure.
The connections to the flow lines are 1/4" NPT female threads and the
connection to the charging line is 1/8” NPT female thread. In the front panel there is a
gauge to control and watch the back pressure. The pressure range may vary between 100
and 2000 psi and temperature -65 o F and 200 o F; the material of body and dome is
stainless steel and the diaphragm is Teflon. The maximum Cv is 0.38 and it weighs 4 lbs.
The type of BPR is externally dome loaded therefore it must be charged from an
external source of gas pressure; in our case dome pressure is supplied by a nitrogen
bottle with its correspondent regulators. Figure 2.10 shows the regulator as installed in
the set up and figure 2.11 shows its detailed drawing.

22
Figure 2. 10 Mity-Mite model S91-W back pressure regulator
Dome pressure acts over the exposed area of the diaphragm to seat it on the
nozzle; when upstream pressure exceeds the desired level, it pushes the diaphragm up
off the nozzle. The flow of fluid through the regulator relieves the pressure in the
upstream system; as the upstream pressure drops off, the diaphragm moves down to
reduce or shut off the flow, so that upstream line pressure is held constant.
Figure 2. 11 Schematic drawing with details of Mity-Mite model S91-W BPR

23
2.2.6 Data acquisition
To exert a real time monitoring of behavior of the acidizing experiments, it is
necessary to record all the parameters that define the process among others flow rate,
temperature, and pressure drop along the core.
The flow rate is directly set and controlled by the ISCO syringe pumps controller,
which can control up to three units; because the acidizing experimentation is normally
carried out at constant flow rate the variable that changes as the process occurs is the
discharge pump pressure, that in turn determines the pressure at the inlet face of the core.
The pressure drop is then sensed with a set of FOXBORO differential pressure
gauges models, IDP10-T26(C-D-E) 21F-M2L1; which measures the difference between
two pressures and transmits a proportional or square root (Flow) electrical Signal. The
differential pressure gauges are energized by a 30 volts single DC power supply and
display pressure data on LCD screens and output 4~20 mA DC current signals that travel
to hardware via grade 16AWG electric cable.
There are three different gauges installed with ranges 0-30 psi, 0-300 psi, and 0-
3000 psi; which permit to choose the most adequate one according to the expected
pressure drop of each particular type of rock, related to their permeability. The sensor of
these devices is made of hastelloy C276 and silicone fill fluid.
The connections of the transmitters are assembled with 1/8” hastelloy C276
tubing and Gyrolok compression fitting. Figure 2.12 illustrates the pressure transmitter
setup and figure 2.13 shows the connection mode to capture the electric signals and
convert to PC based data acquisition system.
The NI CB-68LP board is the device that receives the electric signal from the
transducers, via the wires, and transfers the signals to the main board inside the
computer; see figure 2.14.

24
Figure 2. 12 FOXBORO pressure transducers
Figure 2. 13 Schematic of pressure signal acquisition

25
The interface board has a direct network interface to processes I/O signals up to
64 channels, eight of which are type analog. The channels entering to the board and its
distribution and recognition are programmed by the software labVIEW from National
Instruments.
Figure 2. 14 NI Interface board CB-68LP DAQ
There are three pressure signals actually installed in the set up, which use
independent analog channels in the interface board, these signals are then distributed and
directed to the main board installed inside desktop. These three signals are processed by
the software LabVIEW which automatically recognizes and display them on a wave
chart in front panel as shown in figure 2.15.
The software works with specific commands for each tasks and it easily links the
pressure signals with the workflow to calculate the variable permeability, which was
previously formulated in the specific command. The pressure drop and permeability

26
readings are finally sent to be recorded in a file in a time sequence determined as
optimum depending on the duration of the test. The frequency of data acquisition must
be set and normally one reading every two, five, or ten seconds is the standard.
Figure 2. 15 Data acquisition LabVIEW program (front panel)
The files can be downloaded as a excel spread sheet to represent the differential
pressure and permeability data. Figure 2.16 shows the block diagram of the LabVIEW
with the program to acquiring and writing the data. In Appendix 2 the steps to create the
program are described illustratively.

27
Figure 2. 16 Data acquisition LabVIEW program (block diagram)
2.2.7 Core preparation equipment and core description
Core samples used in matrix acidizing experiments are Berea sandstone and
carbonates (Indiana Limestone, Dolomite, Cream Chalk). These cores are cut using the
HILTI model DD200, a heavy duty and portable core driller and the three sizes of core
bits required for use with the available core holders. A special frame was necessary to
built to install the machine and make it more stable because the abnormal lengths of
cores to be used; see figure 2.17.

28
Figure 2. 17 Heavy duty HILTI DD200 core driller and core bits
Core bits were specially designed for HILTI to be used in our application in a
non-standard length 4” diameter by 20” long, 1.5” diameter by 20” long and the regular
one 1” diameter by 6” long. Figure 2.18 shows the smallest cores obtained from Cream
chalk (left), Indiana limestone (center), and Berea Sandstone (right).
The cores are saturated in the vacuum facility already existing in the Department.
Vacuum bell is a large size glass vessel, in which the cores samples are submerged to
completely remove air in the pore space of core samples and then saturate the cores with

29
Figure 2. 18 Core samples of three different rocks
brine, ammonium chloride 3% or potassium chloride 1%. This pre-saturation process
assures that the initial permeability is measured at 100% fluid saturated or absolute
permeability.
2.2.8 Piping network, valves, and fittings
The tubing pipe installed in the set up to serve as flow line to displace the acids
and brine during the experiments was designed to be 1/8” diameter with a wall thickness
of 0.03”. Its effective inner diameter allows to flow at the maximum rates provided by
the ISCO D500 pumps that is 204 ml/min; the burst pressure is greater than 7500 psi.
Because the nature of the fluid to work with, this tubing is made of hastelloy C276 to
resist the corrosive environment of HCl-HF mixtures. Regular stainless steel tubing 1/8”
is used in tubing in which hydraulic oil is the fluid.

30
Two types of valves are installed in the piping network of the set up; needle
valves HiP taper seal made of hastelloy, which are used for flow lines with acid; their
fittings seal metal to metal as a compression fitting by a sliding sleeve fastened to the
tubing. These valves are designed to withstand pressures up to 15,000 psi and
temperatures of 450 o F. The ball valves are stainless steel made and bring with type
gyrolock compression fittings; they are used in lines with either no dynamic flow as
those for detecting pressure signals or hydraulic oil lines; they withstand up to 6000 psi
and 300 o F.
2.2.9 Hydraulic pump
This pump is an ENERPAC hydraulic model P392 that provides the necessary
pressure to confine the core sample inside the core holder to simulate the overburden
pressure. Pressure, commonly 1,000-1200 psi, acts on the rubber Viton sleeve; which in
turn contact the core sample. In any case it should be 300-400 psi greater than
backpressure. Figure 2.19 shows the ENERPAC hydraulic pump.
Figure 2. 19 ENERPAC model P392 hydraulic pump

31
CHAPTER III
EXPERIMENTAL DETAILS STUDY
3.1 Matrix acidizing experiment details
Acid core-flooding is a unique technique that mimics matrix acidizing effects on
different types of rocks. Diverse phenomena associated with acid-mineral interactions
during the linear core flooding can be observed and analyzed to simulate different
treatment conditions and adjust available modeling to improve actual understanding on
acidizing techniques.
Linear core-flood acidization in laboratory is extremely useful to understanding
this complex process particularly in sandstone acidizing. Principles of flow in porous
media, reaction kinetics and other phenomena reproduced by conducting linear flow
experimentation of acid into the cores will allow us to provide highly quality
experimental data well suited for petrophysical models, simulators or other tools that can
be escalated to more complex geometries as occurring at field conditions
Core flood process begins once the core has been inserted inside the core and the
confining pressure has been set at desired level. The objective of the project is to build
the reliable equipment to conduct acid core-flooding at diverse conditions and to study
their effect on different rocks once acidized.
Hydrochloric acid (HCl) is usually selected for carbonate acidizing; it reacts
readily with carbonate minerals. HCl is used in carbonate formations to dissolve the
matrix and bypass the damage. For this reason, both damage and rock characteristics
must be taken into account when designing the treatment.
In carbonate rocks effective matrix stimulation rely on the formation of highly
permeable channels called wormholes which are the result of flow and reaction of acids.
The structure of these wormholes is strongly dependent upon the injection rate and the

32
fluid/rock properties10. At low rates the wormhole structure result in a complete
dissolution from the inlet face; while at high injection rates uniform dissolution and
ramified wormholes can result, and at intermediate flow rates single a dominant
wormhole are obtained.
The purpose of sandstone acidizing is to dissolve the damage; it is distinguished
from carbonate acidizing in that it involves the dissolution of damage that is blocking or
bridging the pore throats in the formation matrix, thus ideally recovering the original
reservoir permeability. Siliceous minerals are dissolved by hydrofluoric acid and its
chemistry is much more complex than the HCl when reacting with carbonates.
Reaction rates are affected for kinetics; among the factors that strongly influence
the mineral reactions are acid concentration and temperature. Dissolution reaction rates
are proportional to the HF concentration for most sandstone minerals. The dissolution of
minerals is a thermally activated phenomenon; thus, the rates increase greatly as a
function of temperature (approximately multiplied by 2 for quartz for a 25°C increment),
and the penetration depths of live acid diminish accordingly 11.
The broad range of flow rates that can be obtained with the set of pumps already
installed, will allow to reach high acid flux as those encountered at field conditions or
even higher; for example, when displacing acid in cores at 200 ml/min, the flux equals to
39.5 cm/min, 17.5 cm/min, and 2.5 cm/min for 1”, 1.5”, and 4” diameter respectively;
thus, very realistic flow rates can be achieved to see the effect on the process of
acidization of diverse rocks. When displacing acid through carbonate cores it is expected
to form the wormholes at low injected volumes of acid, i.e. less than two pore-volumes;
so it is so important to watch the pressure behavior until severe pressure drop can be
observed and hence reached the breakthrough.
In sandstone cores the main result is the acid response curve in terms of pressure
drop or permeability vs. time or amount of injected acid (pore-volume); it shows the
permeability behavior as the acidizing process take place. Permeability is calculated by

33
applying the Darcy’s Law equation for a linear flow. This common expression as a
follows:
LPAQ
kµ
∆= (3.1)
The equation 3.1 can be rewritten in terms of variables used in laboratory as:
LPDQ
kµ
∆= 8.122 (3.2)
Where k is permeability in mD; D diameter of the core in inches; ∆∆∆∆P is pressure
drop in psi; µµµµ is the viscosity in cp, L is the core length in inches, and Q is the flow rate
in ml/min.
0
0.2
0.4
0.6
0.8
1
1.2
0 20 40 60 80 100 120
Temprature (o C)
Vis
cosi
ty (c
p)
Figure 3. 1 Viscosity of brine
The values of permeability are computed directly for the LabVIEW, based on a
constant viscosity to facilitate the calculation during the experiments; therefore, these

34
calculations must be corrected by viscosity depending on the temperature at which the
testing was carried out and the type of fluid being displaced at each stage once the file
has been downloaded. Figure 3.1 shows the variation of viscosity of brine with
temperature and Table 3.1 shows values of dynamic viscosity in centipoises for aqueous
HCL.
Table 3. 1 Dynamic viscosity of aqueous solutions of HCl. * extrapolation
_____________________________________________________________________
Concentration TEMPERATURE (o F) % wt 14 32 50 68 104 140 176 212 _______________________________________________________________________
0.05 1.84 1.40 1.10 0.72* 0.51* 0.38* 0.30*
0.10 2.58 1.94 1.50 1.19 0.79* 0.56* 0.41* 0.31*
0.15 2.64 2.02 1.51 1.28 0.87* 0.63* 0.48* 0.38*
0.20 2.73 2.13 1.71 1.39 0.98* 0.72* 0.56* 0.45*
0.25 2.96 2.32 1.87 1.54 1.10* 0.83* 0.65* 0.53*
0.28 3.43* 2.75 2.25 1.88 1.37* 1.06* 0.84* 0.70*
0.30 3.21 2.54 2.07 1.73 1.27* 1.00* 0.82*
0.33 3.42* 2.72* 2.23* 1.87* 1.39* 1.10*
0.36 3.74* 2.98* 2.44* 2.04* 1.51*
_______________________________________________________________________
HF aqueous solution also need to be corrected by viscosity, information about
this property is limited; so as a good approximation the HCl viscosity at the
concentration used with HF can be used because the % wt of HF normally is not greater
than 6%. Figure 3.2 shows the viscosity of aqueous HF.

35
Figure 3. 2 Viscosity of HF-H2O system12.
3.2 General matrix acidizing procedure
The general matrix acidizing procedure is:
o Cutting and preparation core samples;
o Saturation of core samples with brine:
o Prepare acid mixture and brine;
o Refill pumps with hydraulic oil and accumulators with acid and brine
o Assemble of core samples into core holder adjusting inlet and outlet face and
pressurize the Viton sleeve;
o Set the desired back pressure from nitrogen supply;

36
o Pump the fluids in the correct sequence through the core sample. If temperature
is required turn the heaters on once start pumping the brine, not before;
o Switch the pump of and close the inlet valve, release the back pressure to zero
and the confining pressure as well;
o Disassemble the equipment and clean all the parts in contact with the fluids;
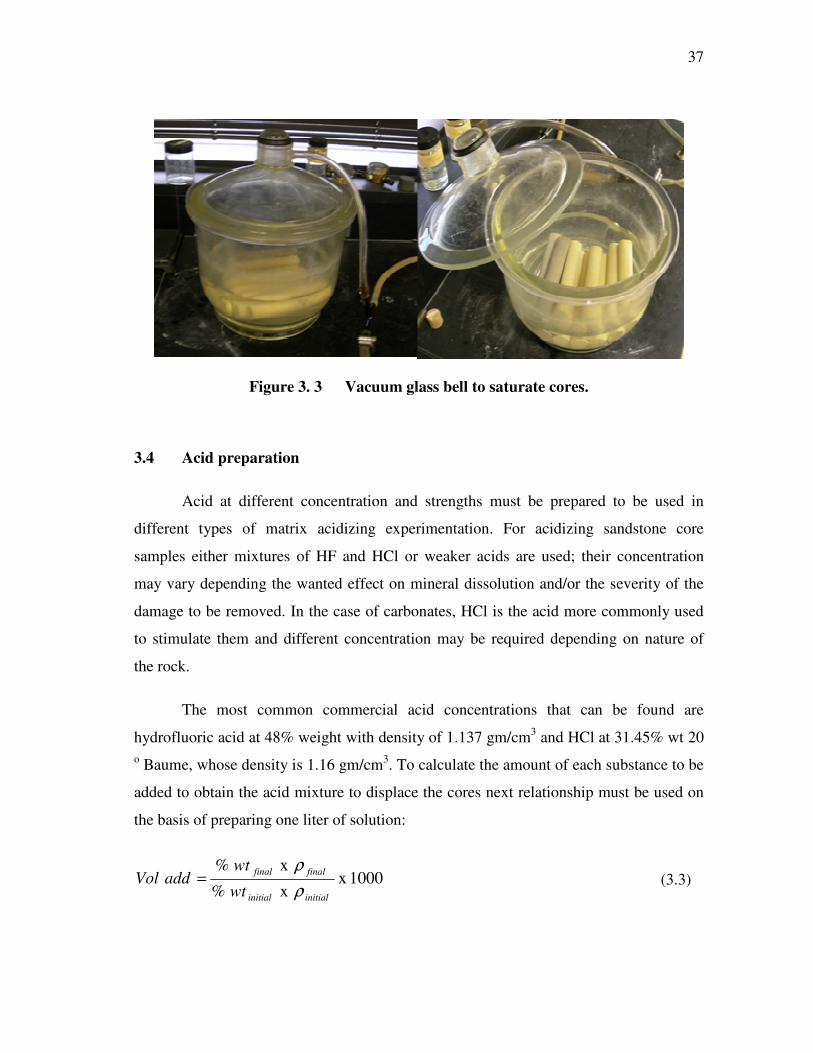
3.3 Core sample saturation procedure
The cores are previously cut in the desired size with the drilling machine HILTI
DD-200 using the core bits. The core samples are saturated in a vacuum bell to get them
saturated with brine before being flooded by the acid treatment; the air from the pore
space in core samples is completely removed to avoid the presence of bubbles that may
cause undesirable effect on acidizing process. Figure 3-3 shows the glass bell, the
special vessel, vessel used to saturate the cores vacuum. The procedure to saturate the
core samples is the follow:
o Connect the vacuum lines to the vacuum pump, glass vessel, buffer bottle and the
switch.
o Put sufficient amount of brine into the vessel to completely submerge the
samples.
o Apply the vacuum grease on glass vessel rim, put core samples in glass vessel,
and then move glass lid to cover the vessel completely; make sure the whole core
samples are submerged.
o Turn the vacuum pump on and keep it running for 24 hours to assure a good
saturation.
o Shut off the vessel vacuum lines, take the core samples out of the vessel and put
them in a container with similar type of brine while they are using in the
experiments, avoiding long contact with air after saturated.
37
Figure 3. 3 Vacuum glass bell to saturate cores.
3.4 Acid preparation
Acid at different concentration and strengths must be prepared to be used in
different types of matrix acidizing experimentation. For acidizing sandstone core
samples either mixtures of HF and HCl or weaker acids are used; their concentration
may vary depending the wanted effect on mineral dissolution and/or the severity of the
damage to be removed. In the case of carbonates, HCl is the acid more commonly used
to stimulate them and different concentration may be required depending on nature of
the rock.
The most common commercial acid concentrations that can be found are
hydrofluoric acid at 48% weight with density of 1.137 gm/cm3 and HCl at 31.45% wt 20 o Baume, whose density is 1.16 gm/cm3. To calculate the amount of each substance to be
added to obtain the acid mixture to displace the cores next relationship must be used on
the basis of preparing one liter of solution:
1000xx %
x %
initialinitial
finalfinal
wt
wtaddVol
ρρ
= (3.3)

38
As an example, to prepare a solution of regular mud acid HF 3% wt and HCl
12% wt from commercial products, the proportion of each product must be calculated
knowing that density of mud acid in 1.064 gm/cm3, thus the calculation gives:
mladdVol
mladdVol
HF
HCl
581000x1.137x 48.01.064x 03.0
3501000x1.16x 3145.0
1.064x 12.0
==
==
Thus volume of water must be added until the volume basis that is 1000 ml is
completed. The balance in term of weight gives:
Volume (cm3) Density (gm/cm3) Weight (gm) % weight
350 1.16 128 12
58 1.137 32 3
592 1 904 85
3.5 Accumulators charging
Once the acids and brine have been prepared according the formulation to be
used and has been decide what type of treatment is going to be pumped, the
accumulators must be charged appropriately with these fluids. Figure 3-4 shows the
schematic diagram of accumulators and lines.
The procedure is quite simple but at the same time it demands to be carefully
with the handling of the acids; therefore, proper safety equipment must be used such as
neoprene gloves, face shield or glasses, and respirator. The procedure is as follows:

39
Figure 3. 4 Schematic of recharging system
o Remove the air quick connection on top of one liter PVC container;
o Check the valve # 1, # 2, and # 4 to be closed and by using the funnel, slowly put
the acid into the PVC container; when filled this container, reconnect the air
supply;
o Open the valve # 4 and those corresponding to the accumulator to be filled at this
time, brine or acid, open the valve # 3 to vent the oil being displaced.
o Open the air supply, which at a pressure of 100 psi will displace the fluid into the
accumulators while the oil is coming out and collected in other container;
o Watch this process to measure the volumes of hydraulic oil being recovered; it is
extremely important when the accumulators is larger than one liter which will
require a new operation.

40
o Once filled the accumulator close the valve of air supply, close the valve # 1 and
those of the accumulator recently filled; Disconnect the air supply to release the
remaining pressure.
o Open the valve # 2 to drain any remaining fluid from the PVC container taking
care in handling the fluids.
3.6 Detailed matrix acidizing procedure
When the type of rock and the characteristics of the treatment to be pumped
through the core sample are defined, and the accumulators have been filled with the
appropriate fluids, then the experiment can be carried out; the detailed procedure is as
follows:
o Insert the core inside the core holder, connect the flow tubing, inlet and outlet
tips, and pressure access lines to core holder. Make sure all the connections are
tighten and valves in proper positions. Check the nitrogen lines from nitrogen
bottles to back pressure regulators.
o Check the valves of pressure to choose which of pressure gauges are going to be
used to get the signals. As was previously mentioned, there are three different
scales, so it is recommended to try first with the highest one, that means 0-3000
psi and once stabilized the pressure drop, and if this pressure is less than 300 psi
the medium one can be used and so on if pressure goes down up to less than 30
psi to use then the lowest range gauge.
o Check the by-pass valves in the downstream line; which must be closed and open
the inlet valve to allow the fluids to be displaced through the core.
o Connect the line of hydraulic oil to the ports in the core holder and apply the
confining pressure with ENERPAC pump up to reach the desired pressure; it is

41
recommended 1200 psi, check the pressure gauge mounted in the front panel,
labeled as Overburden Pressure, to see this pressure signal.
o Put in open position the inlet valves of the three accumulators to maintain the
pressure as constant as possible during the experiments and open the outlet valve
of brine accumulator.
o Open nitrogen regulator; for main effluent back pressure regulator, adjust the
outlet pressure backpressure 300 psi less than overburden pressure; this is the
pressure to be applied on the dome of BPR; check this pressure in the gauge
mounted in the front panel.
o Open the discharge valve of both syringe pumps previously refilled with
hydraulic oil; operate the key controller to select the pump which is going to start
the process and set the working flow rate as well as the maximum pressures to
protect the equipment. Turn on lab exhaust system and start the pump on.
o If the experiments are to be conducted at different temperature other than room
temperature, turn the heater on by operating the heater controller and set the
desired temperature. Do not operate the heaters before the fluids start pumping
and monitor the fluid temperature constantly.
o As long the process is moving forward, open the LabVIEW software and run
either “M_Acidize(C3000).vi” or acid “M_Acidize(C300).vi” program from the
desktop. The wave chart for two pressure channels and the calculated
permeability will display on screen. Input the flow rate, core diameter, core
length, and the base viscosity; set the rate for acquiring the data and determine
the file to store them.
o Check the flowing conditions and wait until the pressure downstream reach the
backpressure, so the fluids will start to coming out and dropping into the

42
container. Check the flow line to make sure no leakage at high pressure. When
the process is stable enough, the data acquisition can start from the computer.
o Let the brine flow until the pressure drop becomes constant, reaching the plateau
that means this is the original permeability.
o Switch the valves to change the fluids coming into the core; that is, open the HCl
preflush valve and close the brine valve. Depending how much carbonate
minerals are present is the amount of HCl necessary, in general it s recommended
to pump at least twice necessary the volume to dissolve the carbonate mineral
based on dissolving power at used acid strength.
o Once displaced the preflush, switch the valves again opening the brine line and
closing the HCl line. Thus brine will displace the possible reaction by-products
before pumping the main acid stage. It is recommended to pump eight to ten pore
volumes of brine at this stage.
o When pumped the brine volume, switch the valves opening the HF/HCl
accumulator and closing the brine accumulator; thus the main acid stage will be
pumped into the core. The volume must be decided in accordance with the effect
that is required to achieve in the rock.
o Finally once pumped the volume corresponding to main acid stage, switch the
valves again opening the brine accumulator and closing the HF/HCl accumulator
to allow brine to flow through the core an determine the final permeability.
Note: During the process of pumping and changing the type of fluids, depending
on the flow rate, it will be necessary to change the pump switching them once the
cylinder get empty and the operator must be ready to change. When the cylinder’s
volume of working pump goes to zero, immediately in the controller select the new
pump and push the button corresponding to this one and press start, making sure the
flow rate has been set the same as previous. The empty pump must be refill by closing

43
the discharge valve and opening the refill line, in the controller select the refill mode and
choose the pump to be refilled and press start; it is recommended a maximum 40 ml/min
as the rate for this refilling operation.
o When the brine postflush displacement is finished, switch the pump off and close
the inlet valve. Close the nitrogen valves and release the back pressure. Stop
LabVIEW program to acquiring data. Wait for a while, until flow in no longer
coming out to release the overburden pressure.
o Disconnect all fittings and get the core out. Rinse all components with water.
3.7 Safety issues and precautions
During acidizing experimentation people must be aware of they are dealing with
extremely dangerous and highly corrosive fluids as HF 48%. Testing is regularly
conducted at moderate to high temperature and pressure; therefore, the safety is a
priority and all of related issues as special clothes and carefully planned procedures
deserve special attention.
HF is a colorless liquid with a strong irritating odor at low concentrations.
Exposure to HF has dangerous potential effects, very hazardous to human health and the
environment. It may cause severe burns to eyes, skin, and respiratory tract; these burns
may not be immediately painful or visible, onset can be delayed up to 24 hours. It can be
absorbed through the skin in fatal amounts causing destruction of the deep tissue, with
high risk of cardiac and nervous disorders. Inhalation causes severe irritation of the nose
and the throat, spasmodic cough and difficulty in breathing. Specialized medical
treatment is required for any exposure to HF.
HF should be used with adequate ventilation to minimize inhalation of vapor. It
must be handled inside a properly functioning chemical fume hood. Chemical splash

44
goggles together with a face shield when handling concentrated HF, if risk of vapors is
resent a respirators must be used with the adequate vapor gases cartridge.
Shorts or open-toed shoes never should be worn when handling HF or other
corrosive chemicals; medium or heavyweight viton, nitrile, or natural rubber gloves are
needed to be worn when working with HF. As first aid, calcium gluconate gel, a topical
antidote for HF skin exposure must be kept nearby whenever working with HF. It.
should be stored in a refrigerator if possible. Even after applying calcium gluconate, it is
essential that a medical evaluation be made.
As a safe work practice if possible, avoid working alone when using HF. Do not
eat, smoke, or drink where HF is handled, since the chemical can be swallowed. Wash
hands thoroughly after handling HF. Store all HF and HF waste in labeled chemically
compatible containers (e.g., polyethylene or Teflon). Glass, metal, and ceramic
containers are not compatible with HF. HF should never be stored with incompatible
chemicals such as ammonia or other alkaline materials.
Always place HF on a low protected shelf or other location where it will not be
accidentally spilled or knocked over. HF waste should be placed in a chemically
compatible container with a sealed lid and clearly labeled.

45
CHAPTER IV
PRELIMINARY EXPERIMENTS AND RESULTS
A set of preliminary experiments of matrix acidizing were conducted on cores of
Berea sandstone, Cream Austin chalk and Indiana limestone to adjust the lab set-up and
check the capacity and reliability of the installed equipment and testing its operating
range. The experimental results were recorded and preliminarily analyzed.
Matrix acidizing in Berea sandstone is conducted to see the effect of mixtures of
HF/HCl on acid response curve, permeability/∆P Vs. injected pore volume; while in
carbonates, Cream Chalk and Indiana limestone, the goal was to observe the evolution of
wormholing patterns created by mineral dissolution through highly permeable pathways
by effect of HCl mixtures.
4.1 Experiments parameters
Diverse acid mixtures were prepared according the formulation previously
discussed and stored in the fume hoods conditioned for this purpose. Cores of Berea
sandstone and some carbonates (Cream Chalk and Indiana limestone) were first
completely vacuum-saturated with ammonium chloride brine.
Sandstone cores were acidized at three different flow rates for acid-displacement,
15 ml/min, 30 ml/min, and 45 ml/min. The acid concentration was the regular mud acid,
12% HCl and 3% HF for the main acid and the preflush was HCl 15%. Different
temperatures were used at each flow rate; changing the variables, several displacements
were done at room temperature, 72 oF, 100 oF, 150 oF, and 200 oF.
A certain volume of preflush is required in all sandstone treatments to dissolve
the HCl soluble minerals. Based on the reaction stoichiometry between HCl and these
minerals the concept of dissolving power2 was applied. The dissolving power expresses,

46
on a mass or volume basis, the amount of mineral that can be consumed by a given
amount of acid. Thus, the gravimetric dissolving power � is defined as:
acidacid
eraleral
MWvMWv minmin
100 =β (4.1)
Where the � terms are the stoichiometric coefficients and MW are the molecular
weights; thus, for the reaction between 100% HCl and CaCO3, β 100 = 1.37 lb CaCO3/lb
HCl. The dissolving power of any other concentration is β 100 times the weight fraction
of acid in the acid solution. For an acid 15% HCL, dissolving power β 15 equals to 0.21.
The volumetric dissolving power X, is defined as the volume of mineral dissolved by a
given volume of acid and it is related to the gravimetric dissolving power by:
eral
solutionacidXmin
100 ρρ
β= (4.2)
A 15% HCl solution has a specific gravity of about 1.07 and CaCO3 has a density
of 169 lbm/ft3. For the reaction of these species, the volumetric dissolving power is
0.082 ft3 CaCO3/ft3 HCl15%.
Table 4.1 shows the typical mineral composition of Berea sandstone. As it can be
seen HCl soluble minerals are Dolomite and Siderite whose volumetric dissolving power
are 0.0628 and 0.0945 respectively; thus for a core of 6” long and 1” diameter, bulk
volume 77 ml, with a porosity of 21%; the volume of HCl to dissolve the total dolomite
and siderite was calculated as 75 ml, which means about 5 pore volumes of the core. The
porosity of Berea sandstone core samples was measured at existing laboratory with the
helium porosimeter as 21.15%.

47
Table 4. 1 Mineral composition of Berea sandstone3.
__________________________________________________
MINERAL VOLUME FRACTION (%)
__________________________________________________
Quartz 75
Feldspar 5
Dolomite 5
Siderite 5
Chlorite 5
Mica/Illite 5
_____________________________________________________
4.2 Preliminary experiments results on sandstone cores
To acidize Berea sandstone cores, regular mud acid (HCl 12% HF 3%) was used
at different flow rates and temperatures. Diverse effects were observed once the
displacement was completed as can be seen in figure 4.1, which shows the inlet face of
three cores of Berea sandstone recently acidized with regular mud acid.
Figure 4. 1 Inlet face of acidized Berea sandstone cores

48
The general procedure is followed in all cores previously saturated with brine 3%
NH4Cl at vacuum conditions.
o Displace the cores with brine 3 % NH4Cl until stable enough to measure initial
permeability.
o Inject the preflush, 100 to 140 ml of HCl 15%, to remove HCl soluble minerals
o Inject NH4Cl as a spacer, generally 170 ml which corresponds to 10 pore
volumes.
o Inject the treatment fluid, HF 3% - HCl 15%, at different temperatures and flow
rates. Initially was pumped the maximum capacity available, up to 60 pore
volumes.
o Inject the postflush, 3% NH4Cl brine, to determine final permeability, sufficient
amount until reach this value as constant as possible.
Figure 4. 2 Acid response curve from a Berea core

49
Figure 4.2 presents the acid response curve for a typical sandstone acid core
flooding. In this curve, the pressure drop and the calculated permeability are plotted and
the different stages of the process are detailed; the improvement in permeability can be
observed clearly.
The core was scanned before and after acidizing process to see the difference
between the two stages; after the process of acidization it appears to be present some sort
of a preferential flow channel at the middle of the core based on the difference in density,
see figure 4.3.
Figure 4. 3 Scanning visualization of the Berea sandstone core
During the preflush stage, a significant increase in pressure drop occurred, hence
reducing the permeability; this may be a result of either viscosity contrast between the
fluids in the porous media or the precipitates generated when HCl start reacting with the
HCL soluble minerals; however, after one period proximately equal to the volume
initially calculated as necessary to dissolve all of these minerals, the pressure drop goes
down to the normal level. In the main acid stage a less severe pressure drop increase can

50
be seen at the beginning of the stage and it gradually improves until switching to the
postflush stage when the possible precipitates and any by-product are flowed out the
core. Figure 4.4 shows the raw data as presented in the front panel in LabVIEW.
Figure 4. 4 Pressure drop data as recorded in LabVIEW program
The effect of temperature was studied at constant flow rate of 15 ml/min;
temperature increases the reaction rate between clay minerals and regular mud acid as
that used in the experiments. See figure 4.5, in which only the data corresponding to the
main acid and postflush stage were plotted to isolate from the effect of HCl in preflush
to dissolve carbonates.
Notice that the higher the temperature the more permeability improvement can be
achieved. At room temperature could be achieved the same result in permeability
enhancement as achieved at 100 o F but being necessary 40 % of additional acid to be
injected as can be observed in curves 72 o F (a). In curve 72 o F can be observed that a
large volume of acid was necessary to get optimal results.

51
Figure 4. 5 Effect of temperature on acidizing Berea sandstone
Experiments were conducted at different flow rates to determine first the
capability of the installed equipment and see the effect on matrix acidizing process. As it
is shown in figure 4.6, in three core displacements at room temperature using Regular
Mud Acid, the permeability response could be significantly improved when the flow rate
increases. This may be explained by the fact of the reaction products are being rapidly
displaced.
However, it is clearly notorious that when using very lower flow rates, as low as
5 ml/min, it seems that the permeability response to the stimulation process occurs
slowly and just a very little enhancement in permeability could be obtained. This effect
could be due to lack of displacing capacity of precipitates which may be present as
products of the reaction between acid and minerals, leading possibly to cause an
additional damage.
0
0.5
1
1.5
2
2.5
3
3.5
0 10 20 30 40 50 60 70
Pore Volume Injected
K/K
o150 o F 100 o F 72 o F 72 o F (a)
Switching to brine post flush

52
Figure 4. 6 Effect of flow rate on acidizing Berea sandstone at room temperature
The effect of flow rate was besides determined by analyzing the results from four
core displacements using the Regular Strength Mud Acid, which were carried out at 100 oF; in figure 4.7 were plotted these different curves. It is shown that at lower flow rates
the permeability response is still relatively poor compared to those obtained at higher
ones. However, it looks like there could be determined an optimum flow rate, for Berea
sandstone cores, based on the results at 30 ml/min, whose permeability response looks
better than those achieved at 15 ml/min and 45 ml/min.
When the cores samples are acidized at relatively high temperatures, more than
100 oF, and large volumes of acid are used, more than 30 pore volumes, a severe change
in the slope of the trend generally occurs in anywhere during the main acid stage leading
to have a more rapid increase in permeability, see figure 4.8; that could means the
complete dissolution of siliceous minerals present in bedding planes as can be seen in
figure 4.9.
0.0
0.5
1.0
1.5
2.0
2.5
3.0
3.5
0 10 20 30 40 50 60 70 80
Pore Volume
K/K
o
5 ml/min 15 ml/min 30 ml/min
Switching to brine post-flush

53
Figure 4. 7 Effect of flow rate on acidizing Berea sandstone at 100 oF
Figure 4. 8 Slope change during main acid stage
0.0
0.5
1.0
1.5
2.0
2.5
3.0
0 10 20 30 40 50 60
Pore Volume
K/K
o 5 ml/min 15 ml/min 30 ml/min 45 ml/min
Switching to brine post flush

54
Figure 4. 9 Dissolved minerals in bedding planes of the cores
Acid concentration is one of the most important parameters to take into account
when designing matrix acidizing. Figure 4.10 shows some sandstone core samples
acidized with a high strength acid mixture, HF 6%- HCl 9%. As can be observed, by
using this concentration may causes a significant matrix deconsolidation.
Figure 4. 10 Inlet face of cores acidized with 9% HCl- 6% HF

55
Because of this undesirable effect, an experiment was conducted, injecting only
10 pore volume of acid, whose acid response curve is shown in figure 4.11, it can be
observed that not much permeability improvement has been reached due perhaps to
additional migration of fines from deconsolidated matrix.
Figure 4. 11 Acid response curve of Berea acidized with 9% HCl- 6% HF
Lower acid concentration, HF 1% - HCl 9%, were also displaced in Berea
sandstone cores; this concentration is the recommended by McLeod and Kalfayan for
those permeability greater than 100 mD. Figure 4.12 shows the effect of acid
concentration on acidizing results.
The acid response curve for the mixture 1% HF- 9% HCl does not show much
success after injecting 55 pore volumes; however, the trend in the curve would allow to
extrapolate a better permeability improvement by injecting more acid. The curves for
Regular Mud Acid, 3% HF – 12% HCl, show similar behavior and the difference is due
to the amount of displaced acid in each experiment. Only the data during the main acid

56
stage and postflush has been plotted to isolate from the effect on permeability of HCl in
preflush stage dissolving the carbonates.
Figure 4. 12 Effect of acid concentration on Berea sandstone
4.3 Preliminary experiments results on carbonate cores
Matrix acidizing experimentation in carbonates differs enormously from that
process in sandstone. In linear core-flooding of carbonates, the principal parameter to be
evaluated is the volume necessary to reach the breakthrough, which means that
wormholing phenomenon has occurred. This experimentation reveals the optimum rate
to stimulate the rocks and the wormholing patterns development.
Cores of Cream chalk and Indiana limestone were used to do the core
displacements; the porosity, measured at helium porosimeter, was 26.82%. Lower flow
rates than those used in previous sandstone displacements were used. First a certain
volume of brine was pumped, sufficient to get the original permeability of the rock.
Once reading the permeability stable enough, switch the accumulator to displace the acid
0
0.5
1
1.5
2
2.5
0 10 20 30 40 50 60 70
Pore Volume Injected
K/K
o
6% HF – 9% HCl 3% HF – 12% HCL 3% HF – 12% HCL 1% HF – 9% HCl
Switching to brine post flush

57
through the core and observe carefully the process until observing the sharpness in
pressure drop indicating the breakthrough has occurred, immediately switching again to
displace the brine. Figure 4.13 shows the pressure drop during carbonate acidizing; in
this experiment the breakthrough occurred at 0.845 pore volume.
Figure 4.14 shows the inlet face of Cream chalk carbonate samples after they
were acidized with HCl 15% wt; as it can be seen, clearly the wormholes product of
mineral dissolution are present. The flow rates for acidizing these cores were 2, 4, and
1.5 ml/min from left to right. As can be seen the lesser the flow rate more uniform
appears to be the inlet face dissolution.
Figure 4. 13 Pressure drop during acidizing carbonate cores
In Figure 4.15 are plotted the injected pore volume at the breakthrough at
different flow rate for Cream chalk cores at room temperature; it can be seen the trend to
determine the optimum injection rate that represents the conditions at which a minimum
volume of fluid is required to form the dominant wormhole channels.

58
Figure 4. 14 Wormholes at inlet and outlet face of carbonate cores
Figure 4. 15 Optimum injection rate for wormholing in Cream chalk
Some cores were scanned to see the patterns of created wormhole in Cream chalk.
In Figure 4.16, the highly permeable channels can be observed, after acidizing the cores
with HCl 15% wt at flow rates of 1, 1.5, and 2 ml/min.

59
Figure 4. 16 Wormholes in Cream chalk

60
CHAPTER V
CONCLUSIONS AND RECOMMENDATIONS
5.1 Conclusions
A compact matrix acidizing apparatus was designed and built to conduct core-
flooding experimentation on both sandstone and carbonate cores. The new equipment is
located at the acidizing laboratory in Petroleum Engineering Department.
The acid apparatus was developed to be capable to work at a wide range of
operational conditions in terms of flow rate, from 0.5 to 204 ml/min, temperature up to
250 o F, and pressure up to 3500 psi, to carry out extensive experimentation on matrix
acidizing process.
The detailed operational procedure of the apparatus, as well as the main
equipment and instrument features and capabilities were described; likewise the safety
issues related to hydrofluoric acid handling were referred to account during
experimentation.
Preliminary matrix acidizing experiments were carried out in both Berea
sandstone and Cream chalk. Regular mud acid, HF 3% - HCl 12%, 6% HF – HCl 9%,
and 1% HF – HCl 9% mixtures were used with the former and HCl 15% with the latter.
From these preliminary experimental results, some conclusion can be drawn:
o Temperature increases the reaction rate of HF-HCl acid mixtures when
acidizing Berea sandstone cores; thus, at higher temperatures better
results could be expected from acidizing stimulation.
o Higher concentration of HF in acid mixtures to stimulate sandstones may
cause deconsolidation of the rocks, adversely affecting the final result of

61
acidizing process because of post-stimulation fines migration along the
core.
o From the limited testing with HF 3% - HCl 12%, in Berea sandstone at
room temperature, it was observed that the higher the flow rate the better
the permeability response, being significantly diminished the
improvement at very low rates. At higher temperatures, 100 oF, the flow
rate of 30 ml/ml appears to be the optimum rate.
o Acidizing limestone cores with HCl 15% showed the formation of highly
permeable and macroscopic channels, wormholes.
o In carbonate rocks, the acid injection rate affects the amount of acid
required for breakthrough. The lesser the flow rate the more uniform the
pattern dissolution in the inlet face of the core samples.
5.2 Recommendations for future research work on matrix acidizing
Complement the matrix acidizing experimentation with sampling of the effluent
to watch the mineral concentration during the coreflooding; exerting constant monitoring
of the minerals product of the reactions. If possible, support interpretations of core
testing with thin section analysis and SEM-DRX.
Test new non HF acid systems in sandstone matrix acidizing; which, although do
not dissolve significantly some of silicates, may cause less negative effects on
deconsolidation of the matrix. Another interesting area to go deeply into is using of
retarded systems as those based on blends of phosphonic and citric that would allow
reaching deeper penetration, being at the same time less corrosive and much safer to
handle, reducing the common problems of conventional acid systems.
Investigate how using of different additives, regularly used in field applications,
can affect the acidizing performance. Additives such as corrosion inhibitors, iron control

62
agents, clay stabilizers, and surfactants are examples of the wide spectrum of products
that can either positively or adversely influence the stimulation process.
Study in depth the impact of flow rate on acidizing performance in sandstone
core samples, conducting more experimentation at rates lower than 5 ml/min to look for
evidence of channeling, wormholing, as reported in some previous studies.

63
REFERENCES
1. Rae, P. and Di Lullo, G.: “Matrix Acid Stimulation – A Review of the State-of-
the-Art,” paper SPE 82260 presented at the 2003 SPE European Formation
Damage Conference, The Hague, 13-14 May.
2. Economides, M. J., Hill, A. D., and Economides, C. E.: Petroleum Production
Systems, First edition, Prentice-Hall, Upper Saddle River, New Jersey, (1994).
3. Da Motta, E. P., and Dos Santos J. A.: “New Fluosilicic Acid Removes Deep
Clay Damage,” paper SPE 54729 presented at the 1999 SPE European Formation
Damage Conference, The Hague, The Netherlands, 31 May-1 June.
4. Kalfayan, L. J., and Metcalf, A. S.: “Successful Sandstone Acid Design Case
Histories: Exceptions to Conventional Wisdom,” paper SPE 63178 presented at
the 2000 Annual Technical Conference and Exhibition, Dallas, 1-4 October.
5. Ziauddin, M., Berndt, O., and Robert, J.: “An Improved Sandstone Acidizing
Model: The Importance of Secondary and Tertiary Reactions,” paper SPE 54728
presented at the 1999 SPE European Formation Damage Conference, The Hague,
The Netherlands, 31 May-1 June.
6. Xie, T., Li, U., Pournik, M., Zhu, D., Hill, A. D., et al.: “An Experimental and
Modeling Investigation of Acid-Created Channels in Sandstone,” paper SPE
94566 presented at the 2005 SPE European Formation Damage Conference,
Scheveningen, The Netherlands, 25-27 May.
7. Thomas, R. L., Nasr El-Din, H. A., Lynn, J. D., Mehta, S., Muhareb, M., et al.:
“Channel vs. Matrix Sandstone Acidizing of a HT/HP Reservoir in Saudi

64
Arabia,” paper SPE 73702 presented at the 2002 SPE International Symposium
on Formation Damage Control, Lafayette, Louisiana, 20-21 February.
8. Kalfayan, L.: Production Enhancement with Acid Stimulation, First edition, Penn
Well Corporation, Tulsa, Oklahoma, (2001).
9. Martin, A. N.: “Stimulating Sandstone Formations with non-HF Treatment
Systems,” paper SPE 90774 presented at the 2004 SPE Annual Technical
Conference and Exhibition, Houston, 26-29 September.
10. Fredd, C. N., Tija, R., and Fogler, H. S.: “The Existence of an Optimum
Damkohler Number for Matrix Stimulation of Carbonate Formations,” paper
SPE 38167 ppresented at the 1997 SPE European Formation Damage Conference,
The Hague, The Netherlands, 2-3 June.
11. Economides, M.J., Nolte, K.G., Reservoir Stimulation, Third edition, Prentice
Hall, Englewood Cliffs, New Jersey, (2001).
12. Honeywell, “Hydrofluoric Acid properties”, Specialty Chemicals, Volume 1.1,
January 2002, at http://www.honeywell.com/sites/docs/HF.pdf

65
APPENDIX A Matrix acidizing experiment data sheet sample
Rock Type:_____________________________________________ Experiment Date:____________________
Core Length: ________________ inch
Core Diameter:________________ inch
Porosity: ________________ %
Acid Type: ______________________________________________________________________
Overburden Pressure: ________________ psi Backpressure: __________________ psi
Temperature: ________________ o F Flow Rate: __________________ ml/min
Pump Schedule: Preflush __________________ ml
Spacer _________________ ml
Main Acid __________________ ml
Postflush __________________ ml
Total Volume: ______________________ ml
Observations: _____________________________________________________________________ _____________________________________________________________________ _____________________________________________________________________ _____________________________________________________________________
MATRIX ACIDIZING COREFLODING

66
APPENDIX B Detailed procedure to program the LabVIEW DAQ
Open the software LabVIEW following the sequence “Start” - “Programs” -
LabVIEW”; it displays the next screen.
By clicking on New the “Front Panel” is displayed to start programming

67
The platform to build the program is the Block Diagram view, which displays by
selecting Window and then show Block Diagram.
Right click and by clicking the icon “Input” get the icon “DAQ Assistant”; drag
the icon and put it somewhere in the Block Diagram. See next screen.

68
Double click on the “DAQ Assistant” and observe the new window in which
Analog Input and then Voltage palette must be selected, see the screen.
Select the analog input channels connected in the CB-68LP board; aI0 reads
inputs 68 and 34, aI1 reads inputs 66 and 33, and aI2 reads inputs 65 and 31which
correspond to differential pressure gauges of 30 psi, 300 psi, and 3000 psi as connected
to the board. See the next screen.

69
Once selected the analog channels, click “Finish” and it display a new window
showing the control to adjust the scale and rename the channels as convenience to
identify them easily, see the next screen.
By clicking the palette “Connection Diagram”, the signal flow can be seen. The
next screen shows the connection for the pressure signal up to 30 Psi, which means the
inputs 68 and 34. See next screen.

70
Going back to Block Diagram window, right click and select “Signal
Manipulate” and then select the command “Split Signals”, see the next screen.
Drag the icon “Split Signal” next to the “DAQ Assistant”, expand the icon up to
the exact number of signals, in this case three pressure signals are coming from the set
up; link the data box with the “Split Signal”. Now, right click and select “Analysis” icon
and “filter” command; see next screen.

71
Drag three “Filter” icons corresponding to the three pressure signals and right
clicking on each click on properties and select the option “smoothing” and “View as
Icon” to become them smaller. See next screen.
Link “Filter” icons with the “Split Signal” icon. Next, by right clicking, select
“Signal Manipulate” and then select “From DOT” to convert from dynamic data.

72
Drag the icons “From DOT” put them and link them next to the “Filter” icon.
Next step is right click on Block diagram window, click on “All Tools” select “Array”
and “Index Array”; see next screen.
Drag “Index Array” icons and link them with the icons “From DOT”. Now right
click on Block Diagram window, select the icon “Arith/Compare” next select
“Numeric” and finally select “Numeric Constant”, see the next screen.

73
Drag three “numeric Constant” icons and link them with the icons “Index Array”.
Next, to create the graph showing the calculated permeability, right click and select
“Arith/Compare” and select “Formula”, see next screen.
Drag the icon “Formula” and double click on it, it displays the windows in which
the variables involved in the calculation are defined and the equation is written. By
labeling each variable, automatically they become available to put into the equation. See
next screen.

74
Once written the equation into the command “formula” and defined the variables,
right click on each input, that is Q, L, D, and mu, and click create control, they
automatically will appear linked to each input and in the Front Panel view as well; DP
is taken from the differential pressure signal specifically chosen for each experiment,
that means 0-30 psi, 0-300 psi, or 0-300 psi depending the conditions of the core sample
and the measurements given during the core-flooding. See next screen.
The result form calculated permeability is going to be filtered and put in same
type of array previously described for the pressure signals, see next screen.

75
By right clicking, create “Graph Indicator” the wave form charts appear and they
must be linked to signals from “Index Array”; see next figure. The wave form charts
automatically display in the front panel view and they may be relocated as convenience
by the users.

76
Right click and select “Signal manipulate” and then select “Merge Signals” to get
the appropriate icon, see next screen.
The four signals, three pressure and the calculated permeability, are merged to
create the path to save the data in a defined file, see next screen.

77
By right clicking, select “Output” and select “Write LVM” to display the
command to send the data to a file, this path may be changed by double clicking and
selecting the new route easily.
Finally right click, select “Exec Control” and then select “While Loop” to create
the limit for the program and select all the commands previously generated. See the final
block diagram showing the command, and the final appearance of the front panel.

78
To start running the program first the values for core length, core diameter, flow
rate and viscosity must be entered in the appropriate “Control” cells displayed on front
panel. Once defined and connected the pressure gauge to be used for calculating
permeability, defined the file where to store the data, click on the run button to start
acquiring the data.

79
VITA
Name: Javier Nevito Gómez
Address: Calle 17 # 40 - 47, El Vergel, Neiva, Colombia
Phone: 57-88-770437
Email Address: [email protected]
Education: B.Sc., Petroleum Engineering,
Universidad Surcolombiana, Colombia, 1990
Employment History: ECOPETROL S.A, Colombia, from 1992
This thesis was typed by the author.