Design Review SR BPM Upgrade
18
Argonne National Laboratory is managed by The University of Chicago for the U.S. Department of Energy Design Review SR BPM Upgrade Tony Pietryla December 2, 2005
description
Design Review SR BPM Upgrade. Tony Pietryla December 2, 2005. Prototype System Block Diagram. Receiver Interface Buffer Position and Intensity signals Receive control signals for receiver Two 14-bit ADCs Stratix II FPGA. Prototype Data Acquisition Chassis. Stratix II FPGA. 2 Channel ADC. - PowerPoint PPT Presentation
Transcript of Design Review SR BPM Upgrade
Argonne National Laboratory is managed by The University of Chicago for the U.S. Department of Energy
Design ReviewSR BPM Upgrade
Tony Pietryla
December 2, 2005
2
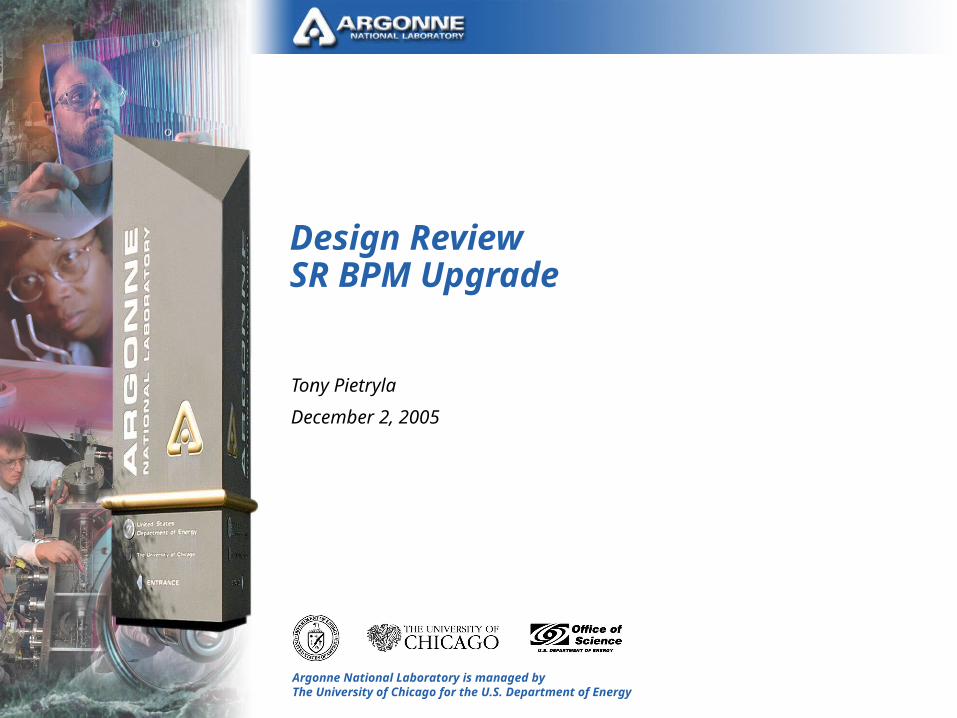
Prototype System Block Diagram
Receiver Interface– Buffer Position and Intensity signals– Receive control signals for receiver
Two 14-bit ADCs Stratix II FPGA
Watkins-Johnson Receiver
Filter Comparator
TOTI
BO
BI
DxDyS
Stratix FPGA
14bit ADC
14bit ADC
D/S
Coldfire Embedded
IOC
EPICS Readbacks
Fiber Transmitter
SFeedback
Prototype Monopulse BPM Data Acquisition
P0
44MHz
D/S and S are Differential
Signals
Receiver Interface
Control Signals
New components are shown in blue

3
Prototype Data Acquisition Chassis
Coldfire IOC
Stratix II FPGA
2 Channel
ADC
4
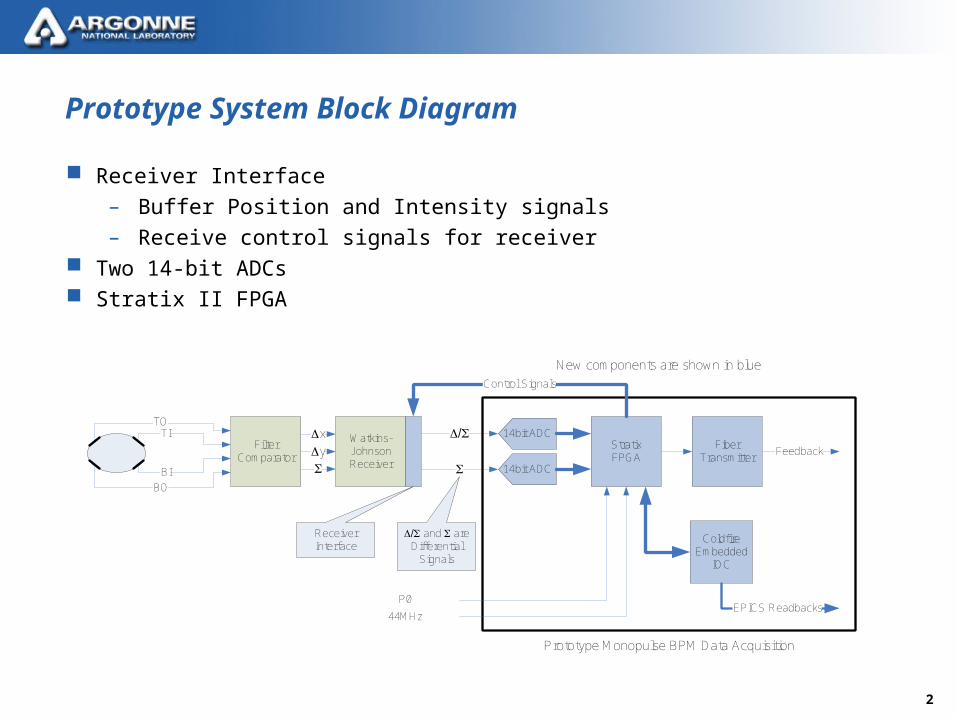
Prototype Receiver Interface
Backplane
Receiver Interface
Receiver Housing/Heatsin
k
Receiver

5
Lab Test Setup
Tests performed with:
1. CW signal from generator, Dx & Dy terminated on receiver, or
2. 100Hz tone applied to ADC inputs
Power Divider
Watkins-Johnson Receiver
Filter Comparator
TOTI
BOBI
DxDyS
14bit ADC
14bit ADC
D/S
Coldfire Embedded
IOC
EPICS Readbacks
Fiber Transmitter
SFeedback
Prototype Monopulse BPM Data Acquisition
Signal Generator
Stratix FPGA
P0
44MHz
D/S and S are Differential
Signals
Receiver Interface
Control Signals
New components are shown in blue

6
SRS DS360 Function Generator
100Hz Input directly into the ADC
Lab Measurement – Calibration Data
Scope Measurement: 2.82mV
Measured Output: 2.96mV
Scope Measurement: 14.35mV
Measured Output: 14.74mV

7
Lab Noise Measurement – RMS Motion 1Hz – 1kHz
CW input using filter comparator and WJ receiver
Both delta inputs on receiver were terminated
60Hz signal approximately 85nm rms.

8
Lab Noise Measurement – RMS Motion 200kHz – 44MHz
CW input using filter comparator and WJ receiver
Both delta inputs on receiver were terminated
9
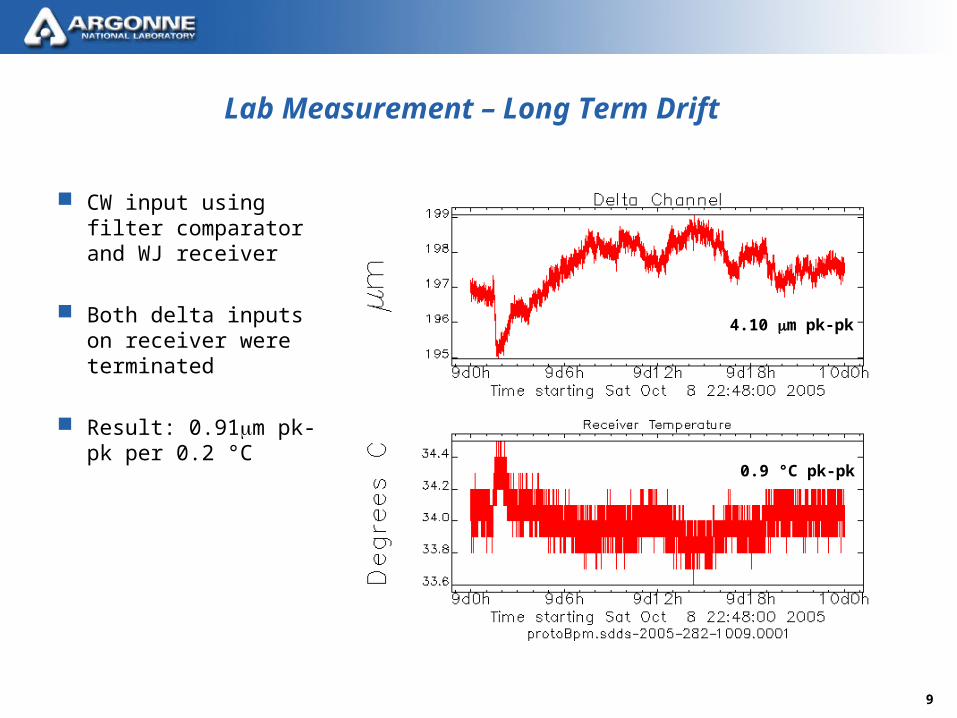
Lab Measurement – Long Term Drift
CW input using filter comparator and WJ receiver
Both delta inputs on receiver were terminated
Result: 0.91m pk-pk per 0.2 °C
4.10 m pk-pk
0.9 °C pk-pk
10
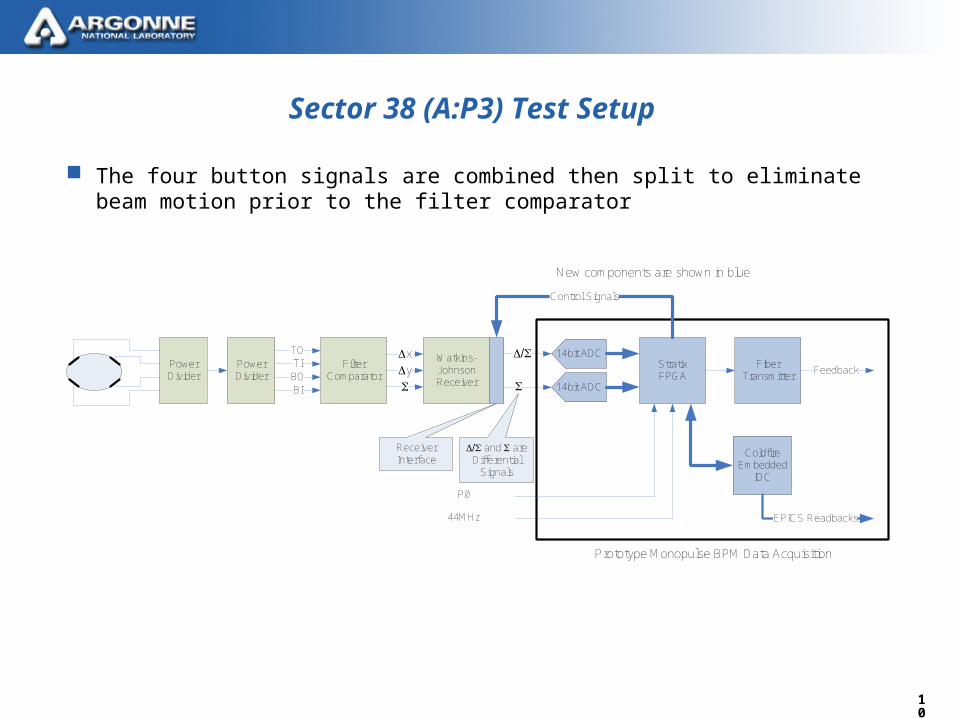
Sector 38 (A:P3) Test Setup
The four button signals are combined then split to eliminate beam motion prior to the filter comparator
Power Divider
Watkins-Johnson Receiver
Filter Comparator
TOTIBOBI
DxDyS
Stratix FPGA
14bit ADC
14bit ADC
D/S
Coldfire Embedded
IOC
EPICS Readbacks
Fiber Transmitter
SFeedback
Prototype Monopulse BPM Data Acquisition
Power Divider
P0
44MHz
D/S and S are Differential
Signals
Receiver Interface
Control Signals
New components are shown in blue

11
Beam Based Calibration
All resolution numbers and graphs were converted to m using a calculated value of 14.28 m/mV
Experiments were performed to determine the calibration of the prototype unit by changing a corrector and measuring the response
Measured response of S35A:P3, S37A:P3 and prototype connected to S38A:P3 buttons
Took average of S35A:P3 and S37A:P3 responses and applied to S38A:P3
14-bit ADC resolution = 122.07V/count
Result:
– Horizontal = 15.3 m/mV
– Vertical = 17.5 m/mV

12
Single Bunch Fill Pattern – 1Hz to 1kHz
5mA stored beam
Back-to-back splitters
5 samples per bunch
13
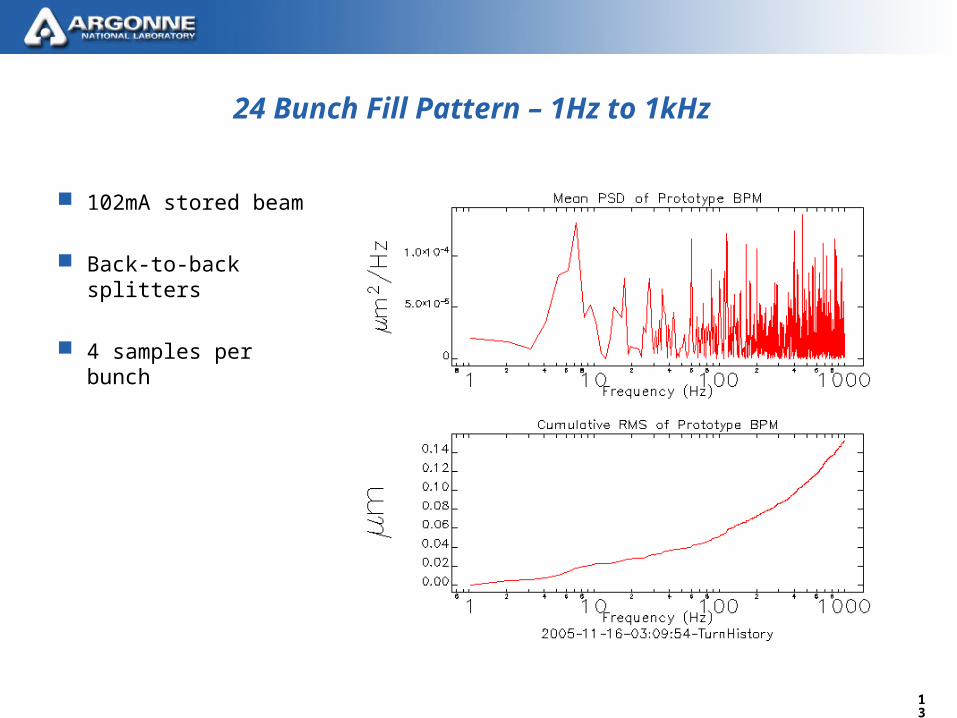
24 Bunch Fill Pattern – 1Hz to 1kHz
102mA stored beam
Back-to-back splitters
4 samples per bunch

14
324 Bunch Fill Pattern – 1Hz to 1kHz
102mA stored beam
Back-to-back splitters
All samples used

15
Long Term Drift – 24 Bunch Fill Pattern
Back-to-back splitters
4 samples per bunch
Result: 0.93m pk-pk per 0.2 °C
4.65m pk-pk
1 °C pk-pk
16
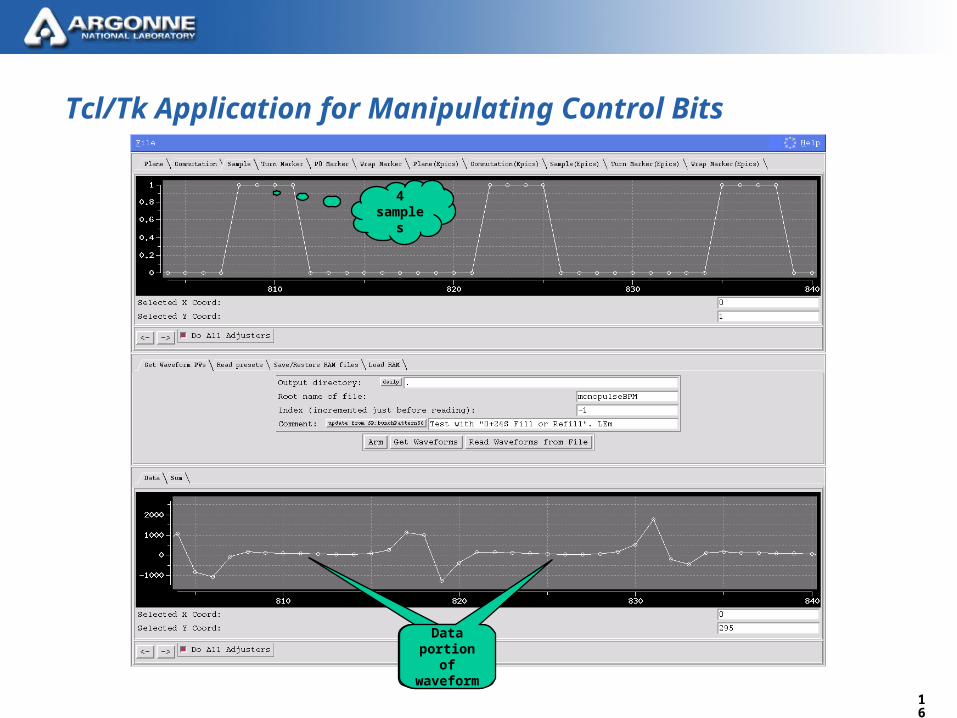
Tcl/Tk Application for Manipulating Control Bits
4 sample
s
Data portion of waveform
Data portion of waveform
17
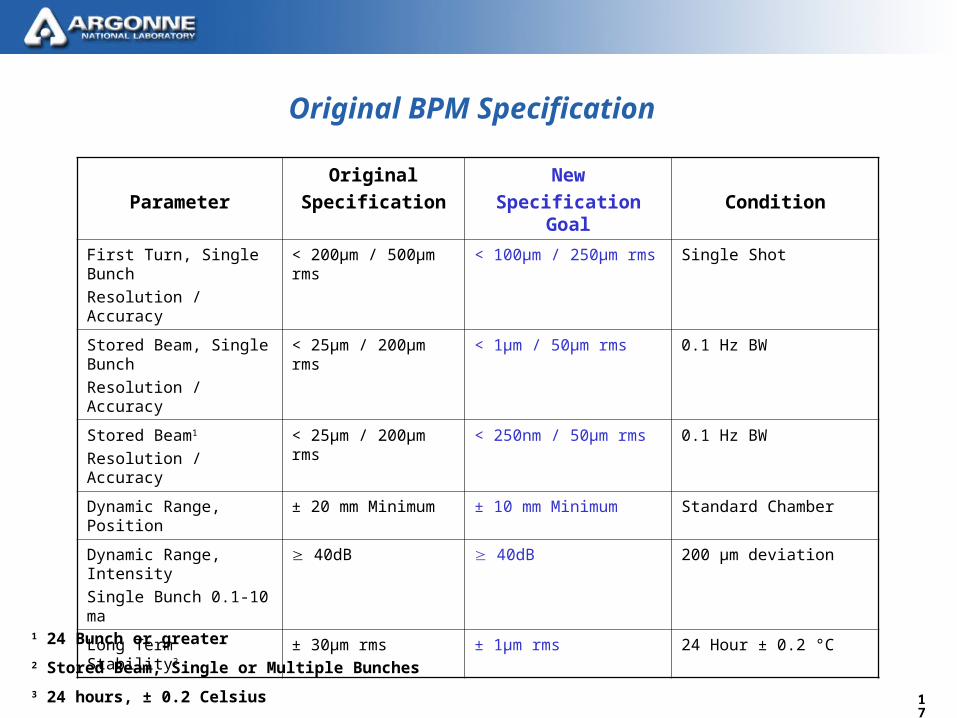
Original BPM Specification
Parameter
Original
Specification
New
Specification Goal Condition
First Turn, Single Bunch
Resolution / Accuracy
< 200μm / 500μm rms < 100μm / 250μm rms Single Shot
Stored Beam, Single Bunch
Resolution / Accuracy
< 25μm / 200μm rms < 1μm / 50μm rms 0.1 Hz BW
Stored Beam1
Resolution / Accuracy
< 25μm / 200μm rms < 250nm / 50μm rms 0.1 Hz BW
Dynamic Range, Position ± 20 mm Minimum ± 10 mm Minimum Standard Chamber
Dynamic Range, Intensity
Single Bunch 0.1-10 ma
40dB 40dB 200 μm deviation
Long Term Stability3 ± 30μm rms ± 1μm rms 24 Hour ± 0.2 °C
1 24 Bunch or greater
2 Stored Beam, Single or Multiple Bunches
3 24 hours, ± 0.2 Celsius

18
BPM Upgrade Specification and Compliance Table
Parameter Specification Goal Condition Compliance
First Turn, Single Bunch
Resolution / Accuracy
< 100μm / 250μm rms Single Shot 127nm rms
Stored Beam, Single Bunch
Resolution / Accuracy
< 1μm / 50μm rms 0.1 Hz BW 20nm rms
Stored Beam1
Resolution / Accuracy
< 250nm / 50μm rms 0.1 Hz BW 10nm rms
Real Time Feedback1
Resolution
< 500nm rms
< 2μm rms
1-30 Hz BW
1-200 Hz BW
1-1000 Hz BW
30nm rms
70nm rms
100nm rms
Bunch-Bunch Oscilloscope mode2
Resolution / Accuracy
< 15μm rms / 50μm rms 10 MHz BW 9.2μm rms
Dynamic Range, Position ± 10 mm Minimum Standard Chamber TBD
Dynamic Range, Intensity
Single Bunch 0.1-10 ma
40dB 200 μm deviation TBD
Long Term Stability3 ± 1μm rms 24 Hour ± 0.2 °C 0.93μm pk-pk per 0.2 °C
1 24 Bunch or greater
2 Stored Beam, Single or Multiple Bunches
3 24 hours, ± 0.2 Celsius