Design of a Non-Contact Condition Monitoring System...
7
Send Orders of Reprints at [email protected] The Open Mechanical Engineering Journal, 2012, 6, (Suppl 2: M6) 155-161 155 1874-155X /12 2012 Bentham Open Open Access Design of a Non-Contact Condition Monitoring System for the Fault Diagnosis of Shaft in Marine Propulsion System Kun Yang *,1 , Xincong Zhou 1 , Songsong Liao 2 , Liyao Li 1 and Li Qin 1 1 Reliability Engineering Institute, School of Energy and Power Engineering, Wuhan University of Technology, Wuhan, 430063, China 2 Shenzhen Yateks Optical Electronic Technology Co. Ltd, Shenzhen, 518057, China Abstract: The working condition of shaft determines whether the ship can continuously acquire propulsive force from diesel engine. It is hard to operate the contact measurement of shaft power and torque neither is it accurate, so the non- contact measurement that is easier and more flexible to use should be the direction to go. A novel contact-less shaft condition monitoring system based on photo-electronic technology is proposed in this paper. Two coding wheels and optoelectronic position sensors are settled to detect the torsion angle of a length of shaft, and the torsion angle of shaft can be quantified by logic circuits in field programmable gate array (FPGA) according to counter frequency and central angle of vane. And then the power and torque on shaft can be worked out in computer. To avoid the drift of optoelectronic device, a logic algorithm was studied to eliminate the bias of trigger point for position detector. The experimental result shows that this method is adequate for measuring the torsion angle of shaft, and gets rid of the redundant optical fiber which might induce danger in online monitoring of rotating shaft system. The design of this monitoring system gives an idea for monitoring and diagnosis of not only the shaft of marine propulsion system but also large rotating machines. Keywords: Condition monitoring, non-contact, fault diagnosis, marine propulsion system, shaft. 1. INTRODUCTION The marine propulsion system mainly includes diesel engine, shaft system and screw propeller. Diesel engine is the source of all the driving power for the vessel. And the rotation of screw propeller in water provides counterforce to drive the ship move forward. The shaft system that connects diesel engine and screw propeller transmits the power of engine to screw propeller to generate kinetic energy of ship. The status of shaft system determines the quality of power transmission from diesel engine to propeller. A major requirement for the shaft system is its reliability and efficiency. Any malfunction, fault or failure on the shaft may induce severe consequences that affect both vessel safety and reliability. Therefore, the monitoring and diagnosis of fault for shaft system is one of the most important sections in power system of ship to ensure against the failure of marine propulsion system. For this reason, various techniques and systems for condition monitoring and fault detection of shaft system have been introduced and applied. The working condition of shaft can be simulated in theory to evaluate the distribution of strain force and distortion [1, 2]. And it also can be monitored by an instrument, which can be used on- line or off-line, for torque and power measurement. Various methods were developed to measure and monitor the working condition of shaft in marine propulsion system. *Address correspondence to this author at the Reliability Engineering Institute, School of Energy and Power Engineering, Wuhan University of Technology, Wuhan, 430063, China; Tel/Fax: +86-027-86549879; E-mails: [email protected], [email protected] They mainly focus on the monitoring of torque, power, and torsion vibration. These methods can be divided into contact and non-contact measurement. Strain gauge is widely used for a long time as a contact method in power and torsion vibration measurement of shaft, like acoustic wire strain gauge [3], and it is still being used in current measurement. Some other strain gauges based on strain foil were developed [4-7], and it makes the measurement of shaft torque and power relatively easier. However, the contact measurement suffered from several fundamentally fatal defects, such as the problems of power supply, signal drifting with surrounding temperature, troublesome in strain gauge positioning and signal transmission. Although some wireless measurement systems for strain gauge are developed in recent years, such as the TT9000 [8], this method is still not able to be used for a long term monitoring. So the non- contact method is preferred and become popular to most condition monitoring applications in nowadays. One of the non-contact monitoring methods for shaft torque measurement is based on laser Doppler accelerometer [9-11]. The laser beams are reflected from 2 points of the same section with Doppler frequency shift. Through proper optical configuration, heterodyne the beams of two different times on the photo electronic detector, therefore the angular acceleration is measured directly, so the information of torsional vibration is obtained. This method is a novel way to measure torsion vibration by the variation of angular acceleration. However, it is easy to be influenced by the surface structure of shaft. Because the shape of shaft cross- section will influence the measured angular speed, it is hard to get a precise result.
-
Upload
doankhuong -
Category
Documents
-
view
215 -
download
0
Transcript of Design of a Non-Contact Condition Monitoring System...

Send Orders of Reprints at [email protected]
The Open Mechanical Engineering Journal, 2012, 6, (Suppl 2: M6) 155-161 155
1874-155X /12 2012 Bentham Open
Open Access
Design of a Non-Contact Condition Monitoring System for the Fault Diagnosis of Shaft in Marine Propulsion System
Kun Yang*,1
, Xincong Zhou1, Songsong Liao
2, Liyao Li
1 and Li Qin
1
1Reliability Engineering Institute, School of Energy and Power Engineering, Wuhan University of Technology, Wuhan,
430063, China
2Shenzhen Yateks Optical Electronic Technology Co. Ltd, Shenzhen, 518057, China
Abstract: The working condition of shaft determines whether the ship can continuously acquire propulsive force from
diesel engine. It is hard to operate the contact measurement of shaft power and torque neither is it accurate, so the non-
contact measurement that is easier and more flexible to use should be the direction to go. A novel contact-less shaft
condition monitoring system based on photo-electronic technology is proposed in this paper. Two coding wheels and
optoelectronic position sensors are settled to detect the torsion angle of a length of shaft, and the torsion angle of shaft can
be quantified by logic circuits in field programmable gate array (FPGA) according to counter frequency and central angle
of vane. And then the power and torque on shaft can be worked out in computer. To avoid the drift of optoelectronic
device, a logic algorithm was studied to eliminate the bias of trigger point for position detector. The experimental result
shows that this method is adequate for measuring the torsion angle of shaft, and gets rid of the redundant optical fiber
which might induce danger in online monitoring of rotating shaft system. The design of this monitoring system gives an
idea for monitoring and diagnosis of not only the shaft of marine propulsion system but also large rotating machines.
Keywords: Condition monitoring, non-contact, fault diagnosis, marine propulsion system, shaft.
1. INTRODUCTION
The marine propulsion system mainly includes diesel engine, shaft system and screw propeller. Diesel engine is the source of all the driving power for the vessel. And the rotation of screw propeller in water provides counterforce to drive the ship move forward. The shaft system that connects diesel engine and screw propeller transmits the power of engine to screw propeller to generate kinetic energy of ship. The status of shaft system determines the quality of power transmission from diesel engine to propeller. A major requirement for the shaft system is its reliability and efficiency. Any malfunction, fault or failure on the shaft may induce severe consequences that affect both vessel safety and reliability. Therefore, the monitoring and diagnosis of fault for shaft system is one of the most important sections in power system of ship to ensure against the failure of marine propulsion system. For this reason, various techniques and systems for condition monitoring and fault detection of shaft system have been introduced and applied. The working condition of shaft can be simulated in theory to evaluate the distribution of strain force and distortion [1, 2]. And it also can be monitored by an instrument, which can be used on-line or off-line, for torque and power measurement.
Various methods were developed to measure and monitor the working condition of shaft in marine propulsion system.
*Address correspondence to this author at the Reliability Engineering
Institute, School of Energy and Power Engineering, Wuhan University of
Technology, Wuhan, 430063, China; Tel/Fax: +86-027-86549879; E-mails:
[email protected], [email protected]
They mainly focus on the monitoring of torque, power, and torsion vibration. These methods can be divided into contact and non-contact measurement. Strain gauge is widely used for a long time as a contact method in power and torsion vibration measurement of shaft, like acoustic wire strain gauge [3], and it is still being used in current measurement. Some other strain gauges based on strain foil were developed [4-7], and it makes the measurement of shaft torque and power relatively easier. However, the contact measurement suffered from several fundamentally fatal defects, such as the problems of power supply, signal drifting with surrounding temperature, troublesome in strain gauge positioning and signal transmission. Although some wireless measurement systems for strain gauge are developed in recent years, such as the TT9000 [8], this method is still not able to be used for a long term monitoring. So the non-contact method is preferred and become popular to most condition monitoring applications in nowadays.
One of the non-contact monitoring methods for shaft torque measurement is based on laser Doppler accelerometer [9-11]. The laser beams are reflected from 2 points of the same section with Doppler frequency shift. Through proper optical configuration, heterodyne the beams of two different times on the photo electronic detector, therefore the angular acceleration is measured directly, so the information of torsional vibration is obtained. This method is a novel way to measure torsion vibration by the variation of angular acceleration. However, it is easy to be influenced by the surface structure of shaft. Because the shape of shaft cross-section will influence the measured angular speed, it is hard to get a precise result.
156 The Open Mechanical Engineering Journal, 2012, Volume 6 Yang et al.
Another non-contact method to measure the torque and power of shaft is to detect the twisted angle of shaft. In other words, it is to detect the relative rotation between two cross sections of shaft. The principle of measurement for the twisted angle of shaft is based on the fact that the cylindrical shaft is not a rigid body. While the rotating force of diesel engine is transmitted through the shaft, as an elastic circular column, it will be twisted because of the resistance force from propeller. The power on shaft has relationship with torque T and rotating speed n. And the T is in direct proportion to twisting force M. However, the twisting force M can be calculated according to twisting angle and the distance L between which the twisting angle is measured by the signal difference from two sensors. The way to measure the twisted angle in a high precision and stability is the key point to the monitoring of shaft status. Moore J, et al. [12] and Witte J [13] developed two kinds of non-contact apparatus for measuring shaft torque. These two apparatuses are similar in basic structure but different sensors and method are used to calculate the torsion angle.
Yu Chengbao, et al. [14] proposed a method to mount an electromagnetic coil on shaft and the variation of magnetic field will induce electronic signal in another coil. The torsion can be worked out from the induced signal according to Faraday’s law of electromagnetic induction. The coils in this method are big and hard to mount in measurement, and the metallic surrounding of marine propulsion system can disturb the electromagnetic signal and introduce error to measurement. Gandarillas C, et al. [15] invented a measurement structure based on magneto elastic non-compliant torque sensor to realize a non-contacting monitoring for rotatable shaft.
N. Whitehead, et al. introduced metallic tuning-fork resonator into the measurement of torque [16]. The instrument structure is similar to vibrating-wire measurement [17], and it is usually clumsy and unwieldy. This will bring trouble to installation and result in erroneous data.
The Kongsberg’s Shaft Power Meter, called MetaPower system, measures torque and power transferred from the main engines to the propellers [18]. This instrument uses optical-fibers to transmit laser signal. And through mounting two optical coding wheels on shaft, the laser signal is modulated to detect the torsion of shaft. However, the long and disorder optical-fibers may bring trouble while monitoring the rotating shaft in high speed. And the optic fiber is usually fragile for the tough environment, especially in the engine room.
A non-contact method for shaft power and torque measurement is proposed in this paper. It uses two optoelectronic position sensors to detector the relative variation of torsion between two code wheels that are mounted on shaft. There isn’t any optical fiber or other long electrical wire in the measurement system, so it may be safer and more convenient for on-line application. And with the help of a high speed logic calculation device, the precision of quantification of torsion angle can be improved. By comparison, the sensitivity of this measurement system is going to be higher than some other methods, so it is not necessary to keep the distance between two coding wheels above 1m like it is requested in Metapower system [18].
2. MECHANICAL STRUCTURE DESIGN AND EXPERIMENT SET UP
The torsion angle on shaft is very small and hard to be observed. The torsional angle is generated while the shaft is rotating, so a dynamic way of measurement is needed to acquire the torsion angle. If we detect the twist of a certain length of shaft, the torsional angle will be amplified to a range that is able to be measured and quantified more accurately.
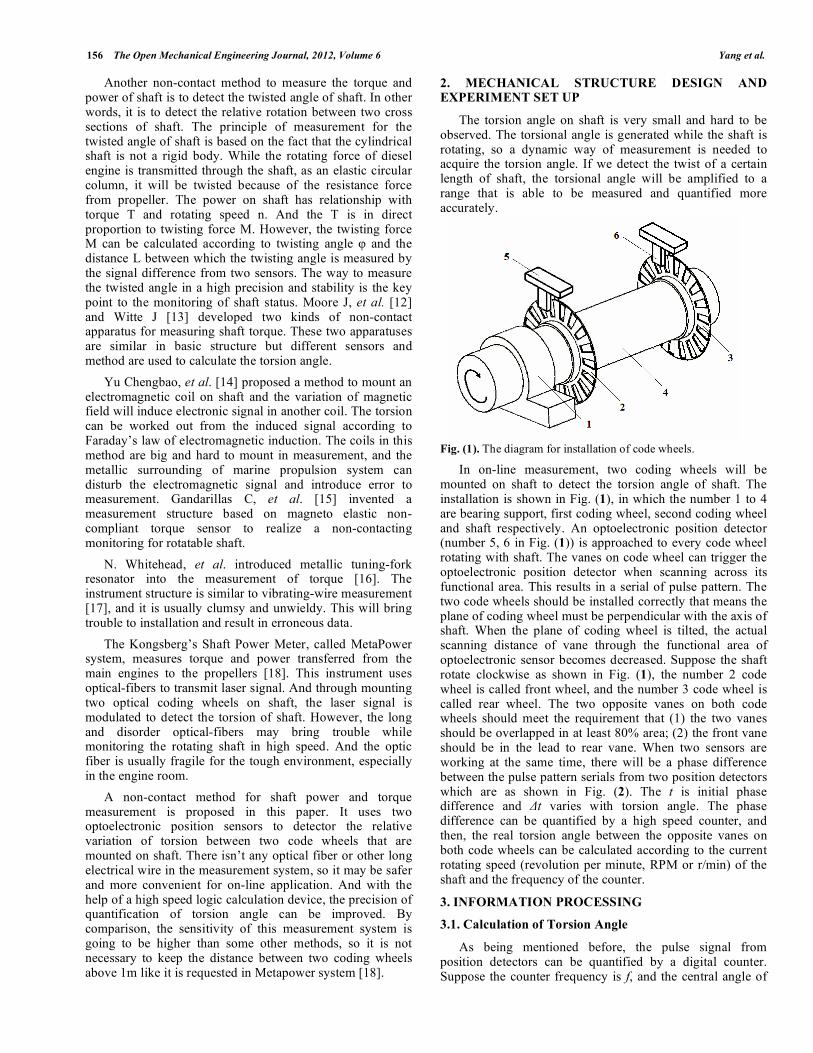
Fig. (1). The diagram for installation of code wheels.
In on-line measurement, two coding wheels will be mounted on shaft to detect the torsion angle of shaft. The installation is shown in Fig. (1), in which the number 1 to 4 are bearing support, first coding wheel, second coding wheel and shaft respectively. An optoelectronic position detector (number 5, 6 in Fig. (1)) is approached to every code wheel rotating with shaft. The vanes on code wheel can trigger the optoelectronic position detector when scanning across its functional area. This results in a serial of pulse pattern. The two code wheels should be installed correctly that means the plane of coding wheel must be perpendicular with the axis of shaft. When the plane of coding wheel is tilted, the actual scanning distance of vane through the functional area of optoelectronic sensor becomes decreased. Suppose the shaft rotate clockwise as shown in Fig. (1), the number 2 code wheel is called front wheel, and the number 3 code wheel is called rear wheel. The two opposite vanes on both code wheels should meet the requirement that (1) the two vanes should be overlapped in at least 80% area; (2) the front vane should be in the lead to rear vane. When two sensors are working at the same time, there will be a phase difference between the pulse pattern serials from two position detectors which are as shown in Fig. (2). The t is initial phase difference and t varies with torsion angle. The phase difference can be quantified by a high speed counter, and then, the real torsion angle between the opposite vanes on both code wheels can be calculated according to the current rotating speed (revolution per minute, RPM or r/min) of the shaft and the frequency of the counter.
3. INFORMATION PROCESSING
3.1. Calculation of Torsion Angle
As being mentioned before, the pulse signal from position detectors can be quantified by a digital counter. Suppose the counter frequency is f, and the central angle of

Non-Contact Shaft Condition Monitoring System The Open Mechanical Engineering Journal, 2012, Volume 6 157
every vane in coding wheel is . These two parameters are available in designing. T in Fig. (2) is proportional to , so the quantification of T means the quantification of . A higher counter frequency F might be used to quantify t and t. Because the numerical relationship between f and F is
known, the initial angle and torsion angle that are related to t and t can be calculated. Therefore, and can be derived from following equations (suppose the numerical relationship between f and F is F = nf, and the quantified values of T, t and t are A, a and a):
=a
nA (1)
=a
nA (2)
Fig. (2). The diagram of output from position detector and phase
difference.
3.2. Preprocessing of Pulse Signal to Eliminate Drift of Phototransistor
From Fig. (2), it can be seen that the phase difference t has an exclusive or relation as shown in equation (3):
t = P1 xor P2 (3)
In practical application, because the optoelectronic position detector is based on a phototransistor, it is possible that the trigger point of phototransistor might drift. That
means the trigger point of phototransistor may vary slowly with surrounding or working conditions, like temperature or the power supply. This will introduce error to the measurement result. Therefore, some logical algorithm should be researched and designed to overcome the situation in this paper.
The two pulse signals A and B in Fig. (4) are from the position detectors, and the two original pulse signals (solid line) which are supposed not to be disturbed by drifting are displayed. The original pulse signal is the initial pulse signal when the apparatus start to work. The width of original pulse signal represents the information of the torsional angle at the temperature that the signal is recorded. However, the current pulse width signals (dot line) in Fig. (4) are easily influenced by drifting. The logical relations between them are displayed in Fig. (4), assuming the shadow parts A and B are caused by drifting and the direction of drift is selected by random. Equation (4) shows the way to eliminate the influence of drift. After this processing, the width of current pulse signal is corrected to the original pulse width. So the output of the torque information is always the measured value in a certain temperature.
A xor B(org) =
A xor B(cur)+ A and B(cur)
A and B(org)
(4)
In hardware design of controller, an FPGA (Field Programmable Gate Array) device was used to do the logic calculation and quantify the initial phase difference generated by torsion angle. The calculation module is composed of counters, multi-channel switches and some other logical units. A 40MHz counter clock which is generated by an active crystal oscillator was input into FPGA as the original clock for all calculation. As it is shown in Fig. (3) one 14-bit counter (Counter1) is built up to regulate the original clock and provide a group of counting clocks with different frequencies which are selectable for quantification of the central angle of vane and the torsion angle. So the frequencies of Clocks signal output from Counter1 should be the 1/2
n of Original Clock. The n is
determined by the nth
bit of the digital output of Counter1. The Mux1 and Mux2 are multi-channel switches. The connection of every channel is controlled by signal Sel1 and
Fig. (3). The diagram of functional module in FPGA.

158 The Open Mechanical Engineering Journal, 2012, Volume 6 Yang et al.
Sel2 which are 3-bit in width. So it is easy to select one divided frequency from Clocks and switch from one counter frequency to another. The clock output from Mux1 is used to drive Counter2 which is used to quantify the pulse generated by the central angle of vane (T in Fig. (2)). And the output clock from Mux2 is input to Counter3 which is used to quantify the pulse of torsion angle (t+ t in Fig. (2)). After processing in FPGA, the digital value of vane angle and torsion angle will be transmitted to PC software through serial interface. The trend of torsional angle, shaft power and torque will be displayed and analyzed in PC software.
4. EXPERIMENT RESULTS AND DISCUSSION
The experiment consists of two parts. One part is to test the variation of measured pulse width by the counter system, so as to see the accuracy and trend feature of the quantification system for torsion angle. This part of experiment gives us a guide to select a counting frequency without bring too much uncertainty to the experiment result. The other part is to test this system in a simulation platform module of shaft. The relationship between quantified torsion angle and the load of shaft can be found out in this experiment.
Fig. (4). The diagram of signal processing to eliminate drift of
phototransistor.
In the first part, eight counter frequencies were used to test the quantification system and verify the validation of this method. The original counter clock input is generated by a 40MHz crystal oscillator. The lowest counter frequency is output from 10
th bit of Counter1 as shown in Fig. (3).
Counter1 is used for frequency division. So the lowest counter frequency is 40MHz/1024 = 39.062 kHz as shown in Table 1. And all the other counter frequencies are 2
m times
of the lowest one. The m is the value between 0 and 7. As mentioned before, the frequencies can be selected by program. So a value of m is sent to micro control unit (MCU) to control a multi-switch element in FPGA to select different frequency for counter. A square series signal was used as a sample signal to simulate the square signal of torsion angle in order to test the feature of counter quantification system. This square signal is generated by MCU, which has a PWM timer as peripherals inside it, to simulate the pulse signal represent the phase difference between the output signals of two photo-electro sensors. And it is assumed that this square signal should have a frequency changed relatively stable, because it is generated by MCU driven with a stable clock. Two groups of data were acquired in experiment. The first group contains 100 pulse width data points under every counting frequency, and in the second one, 200 data were acquired under every counting frequency. The theoretical pulse widths and the relative errors of average pulse width in two data group are shown in Table 1. The theoretical pulse width is calculated according to measured value in lowest counting frequency of the eight ones. This quantified value vibrates between 10 and 11. We evaluate the potential influence to analysis result by choosing different theoretical value, and recognized that it is the same thing when choose 10 or 11 as theoretical value. The relative error of average pulse width data in each counting frequency can be used to analyze the two groups of sampled data and find out the characteristics of the quantification system. The relative errors of related data are plotted in Fig. (5). The x-axis is frequency and y-axis is value of relative error. The x-axis is a log axis because, as mentioned before, all the theoretical pulse widths are 2
m
times of the reference one. We can see that the relative error trend to be stable when the theoretical pulse width is over 44. On the other word, when the counter frequency for pulse width is above 156.25 kHz, the relative error in quantification will not be influenced very much by counter
Table 1. Experimental Result for Different Counter Frequency Used in Quantification
Counting Frequency
(kHz)
Theoretical
Quantified Value
Experiment Result of
1st Group
Relative Error of
1st Group
Experiment Result of
2nd
Group
Relative Error of
2nd
Group
39.062 11 10.82 0.016364 10.83 0.015455
78.125 22 21.71 0.013182 21.735 0.012045
156.25 44 43.37 0.014318 43.475 0.011932
312.5 88 86.83 0.013295 86.79 0.01375
625 176 173.61 0.01358 173.65 0.013352
1250 352 347.23 0.013551 347.215 0.013594
2500 704 694.54 0.013438 694.49 0.013509
5000 1408 1388.95 0.01353 1388.96 0.013523

Non-Contact Shaft Condition Monitoring System The Open Mechanical Engineering Journal, 2012, Volume 6 159
frequency. From this result, we know that the variation of relative error of quantification system is significant in lower counting frequency, and trend to be a stable value in higher counting frequency. So it is better to keep the counter frequency above 156.25 kHz in application to measure the torsion angle for error control of output.
Fig. (5). The variation of relative errors in different sample points.
In second part, we test the measurement system in an experimental platform for shaft of ship. The experimental shaft is driven by a motor controlled by a variable voltage and frequency inverter. The rotating speed of shaft can be changed or not. And there is a load structure that can add friction force to the end of shaft to increase the torque of the shaft, so as to increase the torsional angle of shaft. In this part of experiment, we mounted two coding wheel on the intermediate shaft as it is shown in Fig. (1). The distance between the two coding wheels was 1m. Two optic-electrical sensors were settled approaching to coding wheels like in Fig. (1). The load at the end of shaft was changed gradually and the variation of quantified torsional angle was measure by the developed system. Two groups of data were acquired in experiment. The rotating speed of shaft is stable and we increase the load at first by tuning the screws on the load structure to acquire first group of data and then decrease the load step by step to get second group of data. 500 quantified torsion angle data were acquired in every load point and then averaged. Through this procedure, the torsional vibration signal, which exists while shaft rotating, was decreased. In this experiment, the average torque was measured, and the torsional vibration was ignored. So the average data of torsional angle are proportional to the average torque, and represents the trend of torque changing with load. Plots in Fig. (6a) and Fig. (6b) show that the quantified torsion angle (pulse width) increases with the load increasing and also decreases with the load decreasing.
Because there isn’t a reliable digital monitor for friction force added to the end of shaft, this part of experiment only shows a trend of the variation of torsion angle with the increase and decrease of load. For this reason, it is hard to know the change of load between every tuning, and the point number of average pulse width is different in the two plots of Fig. (6). Therefore the x-axis of two plots in Fig. (6) is a
(a)
(b)
Fig. (6). The plots of quantified pulse width vs different load.
serial number which means the sequence of every acquisit-ion. The quantified value of pulse width of 1
st point in Fig.
(6a) is close to 2nd
one, and the 5th
one is close to the last one, because the load that can be added to the shaft system through the load structure must be in a range, the shaft system is not sensitive to the load structure when the load reaches to a certain value. However, we still think that the load should be a higher value in this moment. It is the same thing for the 3
rd point and the last point in Fig. (6b). The
plots in Fig. (6) prove that the measurement system for torsion angle of shaft can catch up with the variation of shaft load.
The plot in Fig. (7a) is a time series data of torsional angle. It is acquired from the simulation platform too. The frequency of acquisition is 20 Hz, and the quantification frequency is 156.25 kHz. The x-axis is data number in time series, and the y-axis is torsional angle. The data in the plot is from 100 to 1200. The plot shows that, the torsional angle changes from 1.31 to 1.33 degree. The average of the data in the plot is 1.3207. And the standard deviation of the data in plot is 0.003260. The relative error in this measurement is

160 The Open Mechanical Engineering Journal, 2012, Volume 6 Yang et al.
(a)
(b)
Fig. (7). Time series plots of torsional angle.
0.247%. In Fig. (7b), the plot is extended. The big wave in the plot might be generated by motor, because the torque of motor may change repeatedly. And the small vibration that changes with the big wave might be the result of the machining error on the vanes of coding wheel.
5. CONCLUSION
There are many factors that affect the non-contact measurement so that a more preferred method of shaft torque and power measurement has not been found in the world yet. So the non-contact method for high precision and high stability measurement is one of the hottest points that are researched today in various countries.
In the study of this paper, two coding wheels were mounted on shaft and the torsion of shaft resulted in the relative rotation of the opposite vanes in coding wheel. Two optoelectronic position detectors are used to detect the dynamic torsion angle of shaft. The output pulse patterns from position detectors, which carry information of torsion angle, are processed by logic circuit in FPGA. A logic algorithm was put forward in this paper so as to eliminate the drift of photo-electronic detector caused by the instability with temperature of semiconductor device. Experimental
result verifies that this method is able to be applied to quantify the torsion angle in a high precision. And the structure of the apparatus can be used as an on-line measurement device for the shaft system monitoring of ship.
This method is not only suit for the monitoring of shaft in marine propulsion system, but also fit for the monitoring of the working condition of other rotating machines that use shaft to transmit power of rotation, such as turbine system and wind driven electrical power generator. It offers an idea of non-contact measurement to monitoring some large-scale, high speed and high powered mechanical systems.
CONFLICT OF INTEREST
The authors confirm that this article content has no conflict of interest.
ACKNOWLEDGEMENTS
This paper is financially supported by the Fundamental Research Funds for the Central Universities (No. 2011-IV-077). And this project is also sponsored by the grants from the National Natural Sciences Foundation of China (NSFC) (No. 50975213 and No. 51139005). And it is a project supported by a research and development project of Shenzhen Yateks Optical Electronic Technology Co., Ltd.
REFERENCES
[1] B. G. Badalouka, and G. A. Papadopoulos, “Experimental
evaluation of the plastic zone at crack tip by caustics”, The Open Mechanical Engineering Journal, vol. 6, pp. 83-89, 04 May, 2012.
[2] D. P. Liu, H. Zhang, Z. Tao, and Y. F. Su, “Finite element analysis of high-speed motorized spindle based on ANSYS”, The Open
Mechanical Engineering Journal, vol. 5, pp. 1-10, 29 April, 2011. [3] J. W. Drinkwater, “Acoustic Wire Strain Gauges”, U. S. Patent
3,290,930, December 13, 1966. [4] A. Lonsdale, and B. Lonsdale, “Method and Apparatus for
Measuring Strain”, U. S. Patent 5,585,571, December 17, 1996. [5] S. J. Li, and D. F. Liu. Research on measuring and monitoring of
shaft power of naval ship. China Shiprepair, vol. 23, pp. 14-16, 2010.
[6] M. P. Dai, and Y. Q. Ji. “The development of axis power measurement system”, Agricultural Equipment & Vehicle
Engineering, vol. 10, pp. 14-17, 2007. [7] C. M. Zhu, Z. X. Wang, and X. F. Hu. “Design and study of torque
measurement system”, Machinery Design & Manufacture, vol. 5, pp. 30-32, 2009.
[8] TorqueTrak 9000 Digital Telemetry System Users Manual. Binsfeld Engineering Inc., 4571 W. Mactarlande Maple City, MI
49664. [9] S. Rothberg, A. Hocknell, and J Coupland, “Developments in laser
Doppler accelerometry (LDAc) and comparison with laser Doppler velocimetry”, Optics and Lasers in Engineering, vol. 32, pp. 549-
564, 2000. [10] Z. Huang, and B Liu. Research on torsional vibration measurement
based on doppler accelerometer. Acta Metrologica Sinica, vol. 28, pp. 276-279, 2007.
[11] Z. Huang, B. Liu, Q. L. Dong. Research on the torsional vibration measurement based on laser doppler technique. Acta Optica Sinica,
vol. 26, pp. 389-392, 2006. [12] J. D. Moore, and E. C. Moore, “Apparatus for measuring torque on
a rotating shaft”, U. S. Patent 4,520,681, June 4, 1985. [13] J. R. Witte, “Shaft Torque Measurement”, U. S. Patent 5,067,355,
November 26, 1991. [14] C. B. Yu, L. Zhan, X. J. Chen, and F. Zhai. “Research on non-
contact torque measurement based on screw-type differential transformer”, Proceedings of the Eighth International Conference
on Electrical Machines and Systems, ICEMS 2005., vol 3, pp. 2366-2368, 2005.
[15] C. Gandarillas, “Magnetoelastic Non-compliant Torque Sensor and Method of Producing Same”, U. S. Patent 6,516,508 B1, February
11, 2003.

Non-Contact Shaft Condition Monitoring System The Open Mechanical Engineering Journal, 2012, Volume 6 161
[16] N. Whitehead, B. E. Jones, D. Rees. “Non-contact torque measurement on a rotating shaft incorporating a mechanical
resonator”, IEE Colloquium Innovative pressure, force and flow measurements, vol. 10, pp, 1-7, 1999.
[17] Z. Y. Lv. The Study on Ship’s Shaft Power Measurement Based
Vibrating-wire Principle. M. S. thesis, Harbin Engineering University. Harbin, 2008.
[18] Metapower: Torque and power measurement system for rotating shafts. HSB International, vol. 51, pp. 54-55, 2002.
Received: June 11, 2012 Revised: November 5, 2012 Accepted: November 6, 2012
© Yang et al.; Licensee Bentham Open.
This is an open access article licensed under the terms of the Creative Commons Attribution Non-Commercial License (http://creativecommons.org/licenses/by-nc/3.0/)
which permits unrestricted, non-commercial use, distribution and reproduction in any medium, provided the work is properly cited.