Design of a multi-center immunophenotyping analysis of peripheral ...
17
RESEARCH Open Access Design of a multi-center immunophenotyping analysis of peripheral blood, sputum and bronchoalveolar lavage fluid in the Subpopulations and Intermediate Outcome Measures in COPD Study (SPIROMICS) Christine M Freeman 1,3 , Sean Crudgington 3 , Valerie R Stolberg 1 , Jeanette P Brown 3 , Joanne Sonstein 3 , Neil E Alexis 4 , Claire M Doerschuk 5 , Patricia V Basta 6 , Elizabeth E Carretta 6 , David J Couper 6 , Annette T Hastie 7 , Robert J Kaner 8 , Wanda K O’Neal 6 , Robert Paine III 9 , Stephen I Rennard 10 , Daichi Shimbo 11 , Prescott G Woodruff 12 , Michelle Zeidler 13 and Jeffrey L Curtis 2,3,14* Abstract Background: Subpopulations and Intermediate Outcomes in COPD Study (SPIROMICS) is a multi-center longitudinal, observational study to identify novel phenotypes and biomarkers of chronic obstructive pulmonary disease (COPD). In a subset of 300 subjects enrolled at six clinical centers, we are performing flow cytometric analyses of leukocytes from induced sputum, bronchoalveolar lavage (BAL) and peripheral blood. To minimize several sources of variability, we use a “just-in-time” design that permits immediate staining without pre-fixation of samples, followed by centralized analysis on a single instrument. Methods: The Immunophenotyping Core prepares 12-color antibody panels, which are shipped to the six Clinical Centers shortly before study visits. Sputum induction occurs at least two weeks before a bronchoscopy visit, at which time peripheral blood and bronchoalveolar lavage are collected. Immunostaining is performed at each clinical site on the day that the samples are collected. Samples are fixed and express shipped to the Immunophenotyping Core for data acquisition on a single modified LSR II flow cytometer. Results are analyzed using FACS Diva and FloJo software and cross-checked by Core scientists who are blinded to subject data. Results: Thus far, a total of 152 sputum samples and 117 samples of blood and BAL have been returned to the Immunophenotyping Core. Initial quality checks indicate useable data from 126 sputum samples (83%), 106 blood samples (91%) and 91 BAL samples (78%). In all three sample types, we are able to identify and characterize the activation state or subset of multiple leukocyte cell populations (including CD4+ and CD8+ T cells, B cells, monocytes, macrophages, neutrophils and eosinophils), thereby demonstrating the validity of the antibody panel. (Continued on next page) * Correspondence: [email protected] 2 Pulmonary & Critical Care Medicine Section, Medicine Service, VA Ann Arbor Healthcare System, Ann Arbor, MI 48105, USA 3 Pulmonary & Critical Care Medicine Division, Department of Internal Medicine, University of Michigan Health System, Ann Arbor, MI 48109, USA Full list of author information is available at the end of the article © 2015 Freeman et al.; licensee BioMed Central. This is an Open Access article distributed under the terms of the Creative Commons Attribution License (http://creativecommons.org/licenses/by/4.0), which permits unrestricted use, distribution, and reproduction in any medium, provided the original work is properly credited. The Creative Commons Public Domain Dedication waiver (http://creativecommons.org/publicdomain/zero/1.0/) applies to the data made available in this article, unless otherwise stated. Freeman et al. Journal of Translational Medicine (2015) 13:19 DOI 10.1186/s12967-014-0374-z
Transcript of Design of a multi-center immunophenotyping analysis of peripheral ...
Freeman et al. Journal of Translational Medicine (2015) 13:19 DOI 10.1186/s12967-014-0374-z
RESEARCH Open Access
Design of a multi-center immunophenotypinganalysis of peripheral blood, sputum andbronchoalveolar lavage fluid in theSubpopulations and Intermediate OutcomeMeasures in COPD Study (SPIROMICS)Christine M Freeman1,3, Sean Crudgington3, Valerie R Stolberg1, Jeanette P Brown3, Joanne Sonstein3,Neil E Alexis4, Claire M Doerschuk5, Patricia V Basta6, Elizabeth E Carretta6, David J Couper6, Annette T Hastie7,Robert J Kaner8, Wanda K O’Neal6, Robert Paine III9, Stephen I Rennard10, Daichi Shimbo11, Prescott G Woodruff12,Michelle Zeidler13 and Jeffrey L Curtis2,3,14*
Abstract
Background: Subpopulations and Intermediate Outcomes in COPD Study (SPIROMICS) is a multi-center longitudinal,observational study to identify novel phenotypes and biomarkers of chronic obstructive pulmonary disease (COPD). Ina subset of 300 subjects enrolled at six clinical centers, we are performing flow cytometric analyses of leukocytes frominduced sputum, bronchoalveolar lavage (BAL) and peripheral blood. To minimize several sources of variability, we usea “just-in-time” design that permits immediate staining without pre-fixation of samples, followed by centralized analysison a single instrument.
Methods: The Immunophenotyping Core prepares 12-color antibody panels, which are shipped to the six ClinicalCenters shortly before study visits. Sputum induction occurs at least two weeks before a bronchoscopy visit, at whichtime peripheral blood and bronchoalveolar lavage are collected. Immunostaining is performed at each clinical site onthe day that the samples are collected. Samples are fixed and express shipped to the Immunophenotyping Core fordata acquisition on a single modified LSR II flow cytometer. Results are analyzed using FACS Diva and FloJo softwareand cross-checked by Core scientists who are blinded to subject data.
Results: Thus far, a total of 152 sputum samples and 117 samples of blood and BAL have been returned to theImmunophenotyping Core. Initial quality checks indicate useable data from 126 sputum samples (83%), 106 bloodsamples (91%) and 91 BAL samples (78%). In all three sample types, we are able to identify and characterize theactivation state or subset of multiple leukocyte cell populations (including CD4+ and CD8+ T cells, B cells, monocytes,macrophages, neutrophils and eosinophils), thereby demonstrating the validity of the antibody panel.(Continued on next page)
* Correspondence: [email protected] & Critical Care Medicine Section, Medicine Service, VA Ann ArborHealthcare System, Ann Arbor, MI 48105, USA3Pulmonary & Critical Care Medicine Division, Department of InternalMedicine, University of Michigan Health System, Ann Arbor, MI 48109, USAFull list of author information is available at the end of the article
© 2015 Freeman et al.; licensee BioMed Central. This is an Open Access article distributed under the terms of the CreativeCommons Attribution License (http://creativecommons.org/licenses/by/4.0), which permits unrestricted use, distribution, andreproduction in any medium, provided the original work is properly credited. The Creative Commons Public DomainDedication waiver (http://creativecommons.org/publicdomain/zero/1.0/) applies to the data made available in this article,unless otherwise stated.
Freeman et al. Journal of Translational Medicine (2015) 13:19 Page 2 of 17
(Continued from previous page)
Conclusions: Our study design, which relies on bi-directional communication between clinical centers and the Coreaccording to a pre-specified protocol, appears to reduce several sources of variability often seen in flow cytometricstudies involving multiple clinical sites. Because leukocytes contribute to lung pathology in COPD, these analyses willhelp achieve SPIROMICS aims of identifying subgroups of patients with specific COPD phenotypes. Future analyses willcorrelate cell-surface markers on a given cell type with smoking history, spirometry, airway measurements, and otherparameters.
Trial registration: This study was registered with ClinicalTrials.gov as NCT01969344.
Keywords: Human, COPD, Flow cytometry, Sputum, Bronchoalveolar lavage, Immunophenotyping
BackgroundChronic obstructive pulmonary disease (COPD) is achronic disease that is defined by the presence of airflowlimitation that is not fully reversible. COPD is the third-leading cause of death in the United States [1] and isprojected to become the fifth-leading cause of diseaseburden worldwide by the year 2020 [2]. COPD is associ-ated with a persistent inflammatory immune response inthe lungs in response to inhaled oxidants, including in-door air pollution from biomass fuels and cigarettesmoke [3]. However, COPD is a complex disease involv-ing more than just airflow obstruction. In many patients,COPD is associated with systemic manifestations or co-morbidities that can result in reduced quality of life andincreased mortality [4]. There is significant heterogeneitybetween COPD patients with regard to symptoms, clin-ical characteristics and co-morbidities, physiology, im-aging, response to therapy, decline in lung function andsurvival [5]. Identifying subtypes of patients may lead tomore targeted and personalized therapeutic treatment.The Subpopulations and Intermediate Outcomes in
COPD Study (SPIROMICS) is an ongoing multicenterobservational study funded by the National Heart, Lungand Blood Institute, NIH, with a primary goal of identi-fying homogenous subgroups of patients with COPD [6].SPIROMICS is currently assembling a prospective co-hort of 3200 participants for the collection and analysisof extensive phenotypic, biomarker, genetic, genomicand clinical data. In a subset of 300 subjects, peripheralblood, sputum and bronchoalveolar lavage (BAL) is be-ing collected to immunophenotype multiple cell popula-tions using flow cytometry. Cell populations of interest,including neutrophils, monocytes, macrophages, eosino-phils, dendritic cells, T cells and B cells, as well as theiractivation states, are being identified using a 12-colorantibody panel.Immunofluorescence analysis by flow cytometry is the
gold-standard for defining leukocyte populations. How-ever, due to the complexity and sensitivity of flow cy-tometry, there are significant methodological hurdleswhen applied to a multicenter trial. Early studies fromthe Multicenter AIDS Cohort Study (MACS), in which
four flow cytometry laboratories analyzed identical per-ipheral blood specimens, identified the importance ofstandardizing the model of flow cytometer, the antibodyreagents and fluorochromes, the procedure for samplepreparation and the procedure for sample analysis [7].Many multicenter trials continue to stain the sample lo-cally and use the flow cytometry instruments that areavailable at each participating institution [8-10]. Otherstudies have employed fixatives to stabilize receptor ex-pression before staining, particularly in peripheral bloodsamples, with subsequent centralized core staining andflow cytometric analysis has also been explored; howeverpreservation of individual surface markers by this ap-proach was variable [11,12].The goal of this sub-study is to provide state-of-the-
art immunophenotyping of sputum, blood and BAL tobe correlated with the abundance of other clinical, radio-graphic, physiological, genetic and biomarker data beingcollected on this cohort. We took the approach of “just-in-time” provision of reagents from a centralized Immunophe-notyping Core, which prepares the 12-color antibody panelsand ships them to the institutions as needed. On the daywhen samples are collected at each clinical site, they arestained without pre-fixation, then fixed and shipped over-night express on cold packs to the ImmunophenotypingCore for data acquisition and analysis on a single flow cyt-ometer. The choice of leukocyte cell types and their recep-tors was based on a series of pre-specified hypotheses plusresearch interests of the coauthors. This interim reportdemonstrates the feasibility of our approach, which maybe of value in the design of multicenter trials in COPD orother disease states.
Materials and methodsEthics statementAll clinical investigations are conducted according to theprinciples of the Declaration of Helsinki. The studyprotocol was approved by the individual institutionalreview boards (Columbia University; Weill Cornell MedicalCollege; University of California Los Angeles; University ofCalifornia San Francisco; University of Michigan, Universityof Utah; Wake Forest University). All participants

Freeman et al. Journal of Translational Medicine (2015) 13:19 Page 3 of 17
understand the purpose of the study and provide writ-ten informed consent before they undergo any researchactivities or procedures.
Study design and logisticsA subgroup of 50 subjects from each of six clinical sites(total n = 300) is being enrolled from the parent SPIRO-MICS study. The enrollment strata for the bronchoscopysub-study are described in Table 1. Subjects participatein this sub-study during two separate visits. At the firstvisit, a sputum sample is collected by induction. In thesecond visit, which takes place two to four weeks later,peripheral blood and bronchoalveolar lavage samples arecollected.The SPIROMICS clinical sites are broadly distributed
geographically, being located in Ann Arbor (Universityof Michigan); Los Angeles (University of California); NewYork City (Columbia & Cornell Universities); Salt LakeCity (University of Utah); San Francisco (University ofCalifornia); and Winston-Salem (Wake Forest University).To assure efficient communication, we follow a stan-dardized notification process. Study coordinators at theClinical Centers are required to notify both the Immu-nophenotyping Core and their local collaborating la-boratory as soon as the first bronchoscopy sub-studyvisit is scheduled, so that antibody panels can be pre-pared and shipped overnight to that site. Notificationoccurs by email to multiple individuals at both the clinicalsites and the Immunophenotyping Core, to minimize thechance that an absence of one individual will interferewith the tight shipping schedule. The individuals primarilyresponsible for this protocol at both the Clinical Centersand the Immunophenotyping Core follow a strict pol-icy of immediately “replying to all” at both sites, con-firming receipt of each email and repeating back thereceived information, to affirm that the message hasbeen received correctly.Next, assay tubes, each containing all the antibodies
(or isotype controls) for a given cell type or groups of re-lated cell types, are prepared by the Immunophenotyp-ing Core. Each tube is identified using labels supplied bythe SPIROMICS Genomics and Informatics Core (GIC)at the University of North Carolina. These labels are spe-cific to sample type and subject, but do not include theSPIROMICS-wide subject identifier. Thus, the Immuno-phenotyping Core is blinded to any clinical information
Table 1 Planned subject enrollment distribution by strata
Never-smokers Smokers withoutairflow obstruction
Smoking status <1 pack year >20 pack years
Lung function FEV1/FVC >0.7 FEV1/FVC >0.7
Sample size N = 60 (20%) N = 60 (20%)
about the subjects at the time of the flow cytometry ana-lysis, as the only link between sample labels and subjectIDs is held by the GIC.Once antibodies are aliquoted, tubes are capped and
centrifuged at 300 × g for 5 minutes, the tubes are placedin wire tacks, which are wrapped in aluminum foil toshield them from light, and are stored at 4°C until ship-ment. Tubes are affixed with a sample-specific label(which can later be matched by the GIC to specific subjectinformation) and then are shipped from the Immunophe-notyping Core to the Clinical Centers between 3–7 daysbefore the scheduled appointment. The Immunopheno-typing Core notifies the Clinical Center by email that theassay tubes have been shipped and provides the trackinginformation. When assays are shipped, the Immunophe-notyping Core records the assay ID number from the la-bels, plus the date and Clinical Center to which thatparticular assay was shipped. This information is trans-mitted to the GIC.An identical process of email communication between
the Clinical Centers, the Immunophenotyping Core andthe GIC is followed once the sample has been collected,stained and fixed. Thus, the GIC records the date onwhich an assay was shipped; the ImmunophenotypingCore records the date on which it was received, facilitatingprompt location of any assays that become delayed orlost in transit. To reduce the chance that assays will notbe properly chilled during transit, shipping in either dir-ection is permitted only Monday through Thursdays.Additionally, care is taken to assure that the timing ofholidays (especially Federal, given that the Immunophe-notyping Core is a VA facility) is considered before ship-ments are released.
Biospecimen collectionSputum induction was performed according to themethods of Alexis et al. [13]. Personnel at the clinicalsites involved in sputum induction and sample process-ing received onsite, in-person training from Dr. Alexis.Briefly, subjects undergo seven-minute exposures to in-creasing concentrations of aerosolized hypertonic salineby inhaling via a mouthpiece. To minimize oral contam-ination of induced sputum specimens, subjects are askedto rinse their mouths with water, to blow their nosesand to clear their throat at the end of each inhalationperiod, then to “cough from their chest” and immediately
Smokers with mild tomoderate COPD
Smokers with severe COPD
>20 pack years >20 pack years
FEV1 > 50% predicted 50% > FEV1 > 30% predicted
N = 140 (47%) N = 40 (13%)
Freeman et al. Journal of Translational Medicine (2015) 13:19 Page 4 of 17
expectorate into a cup without holding the specimen intheir mouths. To assure subject safety, spirometry is per-formed during the inhalation period and again at the endof each seven minute exposure. The saline concentrationsused and frequency of spirometric testing vary accordingto the subject’s baseline forced expiratory volume in 1 sec-ond (FEV1). Subjects with baseline FEV1 ≥ 50% predictedinhale 3%, 4% and 5% saline, and undergo spirometry twominutes into each exposure and at the end of the expos-ure. By contrast, subjects with baseline FEV1 < 50% pre-dicted inhale 0.9% and 3% saline, and undergo spirometryat 1, 2, 5 and 7 minutes of exposure. If at any point theFEV1 decreases by >20% from baseline, the induction isstopped; otherwise, subjects either continue the currentexposure period or proceed to the next saline concentra-tion. Sputum samples were kept on ice throughout the in-duction procedure and processed for immunophenotypingimmediately following collection.At the second visit, during which blood and BAL are
collected, post-bronchodilator FEV1 is measured beforeany procedures. Only subjects with an FEV1 > 30% pre-dicted that day are allowed to participate in the bron-choscopy visit. At the time of IV placement, blood isdrawn into a 10 ml heparin plasma tube, and immedi-ately to the laboratory for immunophenotyping staining.A complete blood count (CBC) is also collected, andprocessed by the medical center clinical laboratory.The BAL sample for Immunophenotyping is only one
portion of collection of multiple samples that comprisethe entire Bronchoscopy sub-study. BAL is performed inthe right middle lobe and lingula by instilling two aliquotsof 40 mL and one aliquot of 50 mL of sterile saline perlobe (i.e., 130 mL per lobe, total volume = 260 mL persubject), which is withdrawn by gentle manual suction.The BAL return is collected into specifically designatedspecimen traps, kept on ice. The BAL from both lungsites was pooled and used for immunophenotyping.
Antibody panelsWe designed 12-color monoclonal antibody panels withisotype controls to analyze multiple leukocyte popula-tions. The antibody panel, with clones listed in paren-theses, is shown in Table 2. The panels for BAL andsputum differ from the panel for peripheral blood in thatthey do not contain antibodies for basophils or endothelialcells. Additionally, the sputum panel does not containantibodies for dendritic cells or B cells. These choiceswere made based on pilot data from our laboratory indi-cating that these cell types were present in such low fre-quency as to be impractical to identify. Antibodies andisotype-matched controls were directly conjugated toeither fluorescein isothiocyanate (FITC), eFluor 450,phycoerythrin (PE), phycoerythrin-cyanine 5 (PE-Cy5),peridinin chlorophyll protein-cyanin 5.5 (PerCP-Cy5.5),
phycoerythrin Texas red (PE-TR), phycoerythrin-cyanine7 (PE-Cy7), allophycocyanin (APC), allophycocyanin-cyanine 7 (APC-Cy7), BD Horizon™ V500 (V500), PacificBlue, Alexa Fluor 700 (AF 700), and QDot® 655. Vendorsfrom which antibodies were purchased include Biolegend(San Diego, CA), eBioscience (San Diego, CA), BDBiosciences (San Jose, CA), R&D Systems (Minneapolis,MN), Miltenyi Biotec (Auburn CA), and Invitrogen(Carlsbad, CA). Antibodies against CX3CR1, CD133,and their respective isotypes, were purchased unconju-gated, and we used Lightning-Link antibody labeling kit(Novus Biologicals, Littleton, CO) to conjugate these anti-bodies to APC-Cy7 and Atto 700, respectively.Antibodies are centrally prepared for each clinical site
at the Immunophenotyping Core at the VA Ann ArborHealthcare System. Antibodies are aliquoted into flowtubes (BD #352008 and #35203; Becton Dickinson)which are capped, placed in a rack (Fisher #14-793-14),and covered with aluminum foil. Antibodies are shippedovernight in a Styrofoam box with multiple cold packs,frozen to −20°C, and typically arrive at the clinical site1–3 days before the study visit.
Staining of samplesAt each clinical site, mucus plugs from the sputum sam-ple are selected, weighed, and then incubated with 1×Sputolysin® Reagent (EMD Millipore, Billerica, MA) in a37°C water bath for 20 minutes. Samples are washed andfiltered before resuspending the cell pellet in StainingBuffer with FBS (BD #340345; BD Biosciences). The spu-tum assay antibody tubes from the ImmunophenotypingCore are briefly centrifuged and then the entire sputumsample is divided among seven antibody tubes (100 μLper tube). Tubes are covered with aluminum foil andincubated at room temperature for 25 minutes with con-tinuous shaking or rocking (depending on the equip-ment available at the clinical site laboratory). After theincubation, samples are washed with 2 mL StainingBuffer, centrifuged, and resuspended for storage in 2%freshly-prepared formaldehyde in PBS. Tubes are thenstored at 4°C in a rack wrapped in aluminum foil beforebeing shipped back to the Immunophenotyping Core.BAL samples are centrifuged and resuspended in Staining
Buffer, then 100 μL of the BAL sample is added to eachof the BAL assay antibody tubes. Staining then proceedsas described above for sputum samples.Blood tubes are inverted eight times and then 100 μL
of the undiluted blood sample is added to each of theblood assay antibody tubes. Similar to the staining pro-cedure for sputum and BAL, samples are incubated withthe antibodies for 25 minutes. Next, to remove red bloodcells, 2 mL of 1× BD Pharm Lyse (BD Biosciences) areadded to each tube and incubated at room temperaturefor another 25 minutes. Samples are centrifuged and
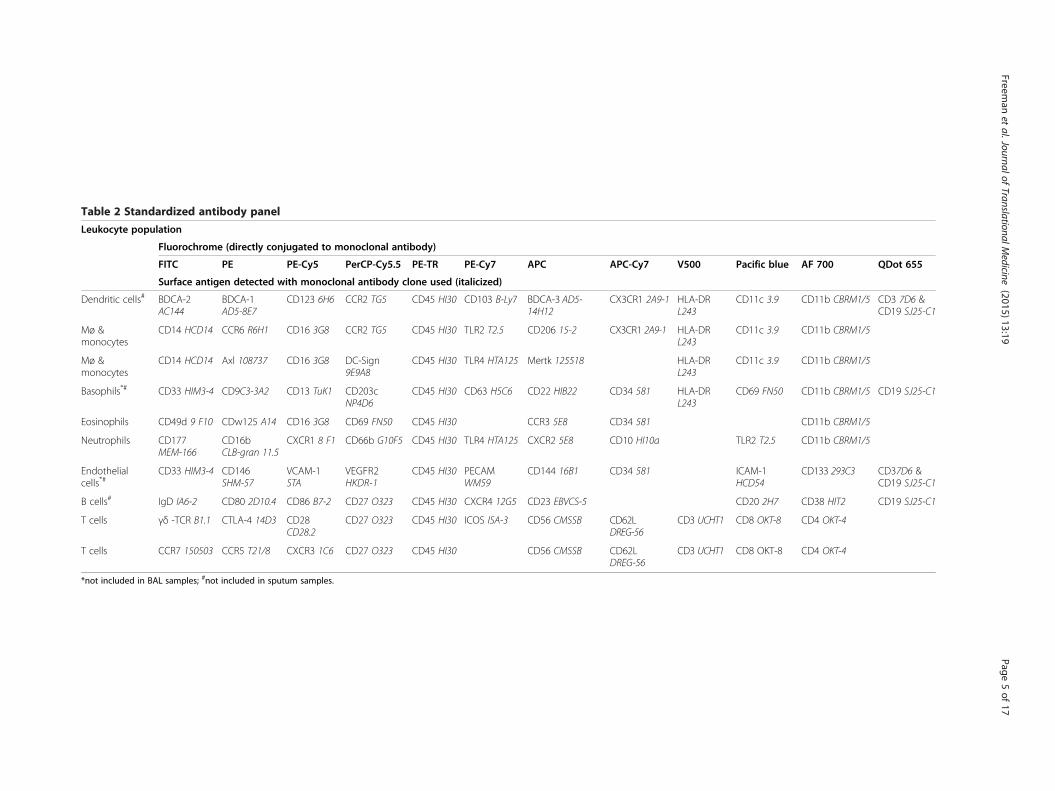
Table 2 Standardized antibody panel
Leukocyte population
Fluorochrome (directly conjugated to monoclonal antibody)
FITC PE PE-Cy5 PerCP-Cy5.5 PE-TR PE-Cy7 APC APC-Cy7 V500 Pacific blue AF 700 QDot 655
Surface antigen detected with monoclonal antibody clone used (italicized)
Dendritic cells# BDCA-2AC144
BDCA-1AD5-8E7
CD123 6H6 CCR2 TG5 CD45 HI30 CD103 B-Ly7 BDCA-3 AD5-14H12
CX3CR1 2A9-1 HLA-DRL243
CD11c 3.9 CD11b CBRM1/5 CD3 7D6 &CD19 SJ25-C1
Mø &monocytes
CD14 HCD14 CCR6 R6H1 CD16 3G8 CCR2 TG5 CD45 HI30 TLR2 T2.5 CD206 15-2 CX3CR1 2A9-1 HLA-DRL243
CD11c 3.9 CD11b CBRM1/5
Mø &monocytes
CD14 HCD14 Axl 108737 CD16 3G8 DC-Sign9E9A8
CD45 HI30 TLR4 HTA125 Mertk 125518 HLA-DRL243
CD11c 3.9 CD11b CBRM1/5
Basophils*# CD33 HIM3-4 CD9C3-3A2 CD13 TuK1 CD203cNP4D6
CD45 HI30 CD63 H5C6 CD22 HIB22 CD34 581 HLA-DRL243
CD69 FN50 CD11b CBRM1/5 CD19 SJ25-C1
Eosinophils CD49d 9 F10 CDw125 A14 CD16 3G8 CD69 FN50 CD45 HI30 CCR3 5E8 CD34 581 CD11b CBRM1/5
Neutrophils CD177MEM-166
CD16bCLB-gran 11.5
CXCR1 8 F1 CD66b G10F5 CD45 HI30 TLR4 HTA125 CXCR2 5E8 CD10 HI10a TLR2 T2.5 CD11b CBRM1/5
Endothelialcells*#
CD33 HIM3-4 CD146SHM-57
VCAM-1STA
VEGFR2HKDR-1
CD45 HI30 PECAMWM59
CD144 16B1 CD34 581 ICAM-1HCD54
CD133 293C3 CD37D6 &CD19 SJ25-C1
B cells# IgD IA6-2 CD80 2D10.4 CD86 B7-2 CD27 O323 CD45 HI30 CXCR4 12G5 CD23 EBVCS-5 CD20 2H7 CD38 HIT2 CD19 SJ25-C1
T cells γδ -TCR B1.1 CTLA-4 14D3 CD28CD28.2
CD27 O323 CD45 HI30 ICOS ISA-3 CD56 CMSSB CD62LDREG-56
CD3 UCHT1 CD8 OKT-8 CD4 OKT-4
T cells CCR7 150503 CCR5 T21/8 CXCR3 1C6 CD27 O323 CD45 HI30 CD56 CMSSB CD62LDREG-56
CD3 UCHT1 CD8 OKT-8 CD4 OKT-4
*not included in BAL samples; #not included in sputum samples.
Freeman
etal.Journalof
TranslationalMedicine
(2015) 13:19 Page
5of
17
Freeman et al. Journal of Translational Medicine (2015) 13:19 Page 6 of 17
washed with Staining Buffer before being stored in 2%formaldehyde in a refrigerator wrapped in aluminum foil.
Flow cytometry instrument setup and data acquisitionSamples are wrapped in aluminum foil and are shippedovernight in a Styrofoam box with cold packs to theImmunophenotyping Core. Upon arrival, samples arephysically inspected and any issues (e.g. cracked tubes,inconsistent volumes, missing tubes) are recorded alongwith the sample ID. Samples are transferred to a 96-wellU-bottom plate and data are acquired on an LSR II flowcytometer (BD Bioscience, San Jose, CA) with a HighThroughput Sampler, equipped with the following fourlasers, listed with their associated fluorochromes and fil-ter sets: 488 nm blue laser (APC-Cy7: 735 nm long-pass(LP), 780/60 nm short band-pass (SBP); AF700: 690 nmLP, 730/45 nm SBP; APC: 660/20 nm SBP); 405 nm vio-let laser (Qdot655: 630 nm LP, 660/20 nm SBP; HorizonV500: 505 LP, 530/30 SBP; Pacific Blue: 450/50 SBP);633 nm red HeNe laser (PerCP-Cy5.5: 685 nm LP, 695/40 SBP; FITC: 505 LP, 530/30 SBP); and a 561 nmyellow-green laser (PE-Cy7: 735 nm LP, 780/60 nm SBP;PE-Cy5: 635 nm LP, 670/30 nm SBP; PE-TR: 600 nm LP,610/20 nm SBP; PE: 582/15 nm SBP).Data are collected using FACSDiva software (BD
Biosciences) with automatic compensation. CS&T Researchbeads (BD Biosciences) are used during instrument setupto maintain baseline performance values, thereby ensuringthat the cytometer performed the same every time.Because cell yields varied, we collect all possible events tomaximize our ability to detect rare populations.Within 1–2 days after the sample has been run on the
flow cytometer, we perform an initial quality check. Werecord the absolute number of CD45+ leukocytes in thesample and also look at the percentage of low side scat-ter cells, indicative of lymphocytes, and high side scattercells, such as macrophages, neutrophils, and monocytes.
Flow cytometry data analysisData are analyzed by two trained individuals (SC, VRS)using FlowJo software v.9.6.2 (Tree Star, Ashland, OR)
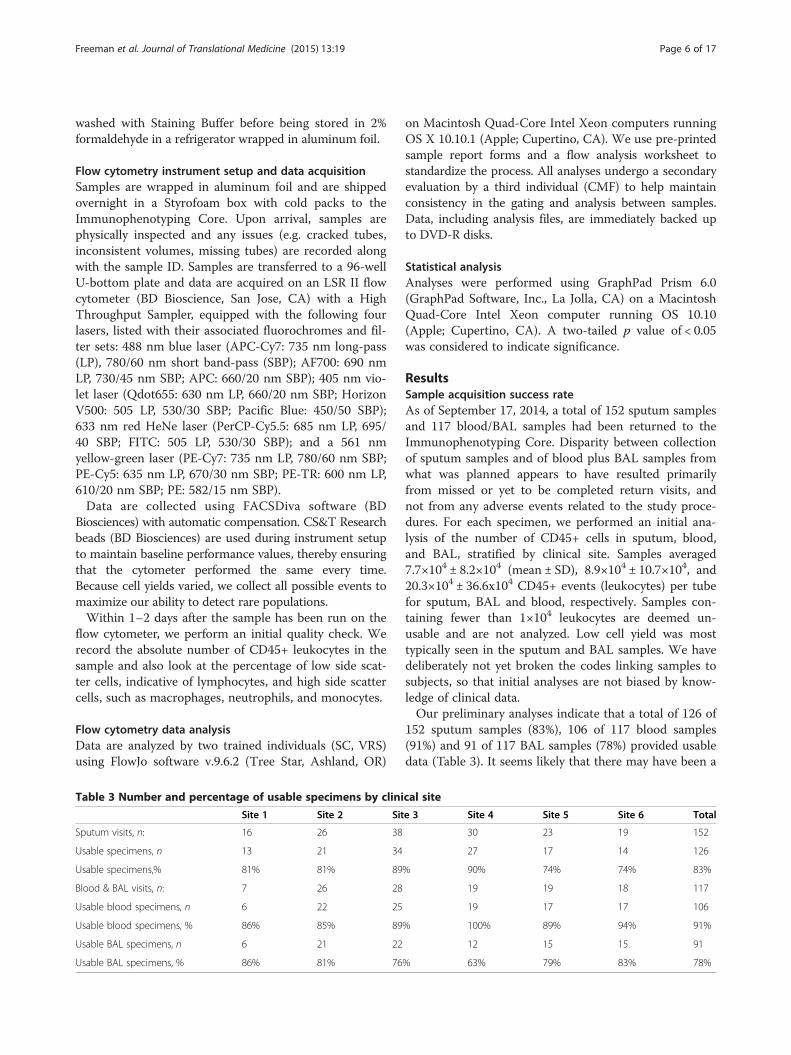
Table 3 Number and percentage of usable specimens by clini
Site 1 Site 2 Sit
Sputum visits, n: 16 26 38
Usable specimens, n 13 21 34
Usable specimens,% 81% 81% 89
Blood & BAL visits, n: 7 26 28
Usable blood specimens, n 6 22 25
Usable blood specimens, % 86% 85% 89
Usable BAL specimens, n 6 21 22
Usable BAL specimens, % 86% 81% 76
on Macintosh Quad-Core Intel Xeon computers runningOS X 10.10.1 (Apple; Cupertino, CA). We use pre-printedsample report forms and a flow analysis worksheet tostandardize the process. All analyses undergo a secondaryevaluation by a third individual (CMF) to help maintainconsistency in the gating and analysis between samples.Data, including analysis files, are immediately backed upto DVD-R disks.
Statistical analysisAnalyses were performed using GraphPad Prism 6.0(GraphPad Software, Inc., La Jolla, CA) on a MacintoshQuad-Core Intel Xeon computer running OS 10.10(Apple; Cupertino, CA). A two-tailed p value of < 0.05was considered to indicate significance.
ResultsSample acquisition success rateAs of September 17, 2014, a total of 152 sputum samplesand 117 blood/BAL samples had been returned to theImmunophenotyping Core. Disparity between collectionof sputum samples and of blood plus BAL samples fromwhat was planned appears to have resulted primarilyfrom missed or yet to be completed return visits, andnot from any adverse events related to the study proce-dures. For each specimen, we performed an initial ana-lysis of the number of CD45+ cells in sputum, blood,and BAL, stratified by clinical site. Samples averaged7.7×104 ± 8.2×10⁴ (mean ± SD), 8.9×10⁴ ± 10.7×10⁴, and20.3×104 ± 36.6x10⁴ CD45+ events (leukocytes) per tubefor sputum, BAL and blood, respectively. Samples con-taining fewer than 1×10⁴ leukocytes are deemed un-usable and are not analyzed. Low cell yield was mosttypically seen in the sputum and BAL samples. We havedeliberately not yet broken the codes linking samples tosubjects, so that initial analyses are not biased by know-ledge of clinical data.Our preliminary analyses indicate that a total of 126 of
152 sputum samples (83%), 106 of 117 blood samples(91%) and 91 of 117 BAL samples (78%) provided usabledata (Table 3). It seems likely that there may have been a
cal site
e 3 Site 4 Site 5 Site 6 Total
30 23 19 152
27 17 14 126
% 90% 74% 74% 83%
19 19 18 117
19 17 17 106
% 100% 89% 94% 91%
12 15 15 91
% 63% 79% 83% 78%
Freeman et al. Journal of Translational Medicine (2015) 13:19 Page 7 of 17
learning curve in obtaining or processing the samples,particularly sputum. The percentage of usable sputumdata has increased from 69% in 2012, to 88% in 2013,and 92% in 2014. BAL samples also showed a modest in-crease: 71% usable samples in 2012, 78% in 2013 and80% in 2014 (data not shown).Processing errors may also account for some of the
unusable data. The most commonly detected processingerror was resuspension of the samples in an incorrectfixative volume, such that the concentration of parafor-maldehyde, which must be held constant to stabilize thelight scatter and antibody labeling, was likely muchlower than the 2% specified in the protocol. Other lesscommon errors result from shipping delays, which re-sulted in samples no longer protected by the ice packs;cracked tubes with low or missing sample; and improp-erly capped tubes, resulting in loss of entire samples. Al-though there was variation between clinical sites in thepercentage of usable samples of different types, no sitewas routinely underperforming compared to the othersites (Table 3), supporting our impression that randomerrors, rather that systematic problems, were responsiblefor lost data.
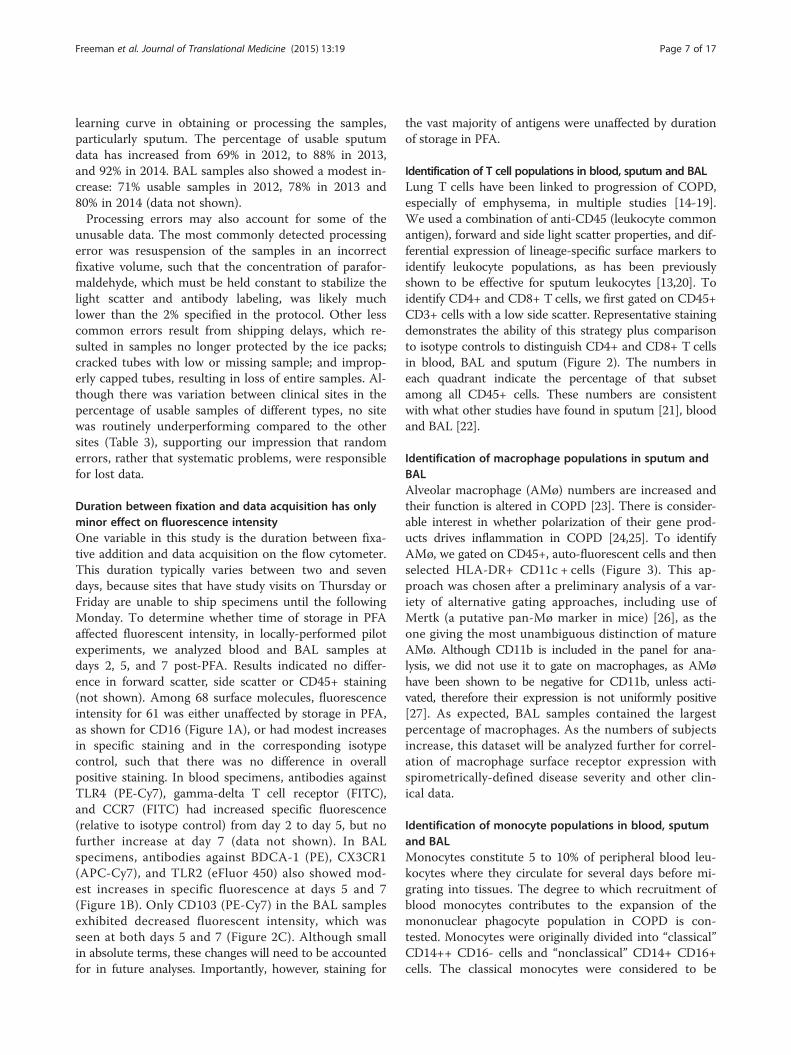
Duration between fixation and data acquisition has onlyminor effect on fluorescence intensityOne variable in this study is the duration between fixa-tive addition and data acquisition on the flow cytometer.This duration typically varies between two and sevendays, because sites that have study visits on Thursday orFriday are unable to ship specimens until the followingMonday. To determine whether time of storage in PFAaffected fluorescent intensity, in locally-performed pilotexperiments, we analyzed blood and BAL samples atdays 2, 5, and 7 post-PFA. Results indicated no differ-ence in forward scatter, side scatter or CD45+ staining(not shown). Among 68 surface molecules, fluorescenceintensity for 61 was either unaffected by storage in PFA,as shown for CD16 (Figure 1A), or had modest increasesin specific staining and in the corresponding isotypecontrol, such that there was no difference in overallpositive staining. In blood specimens, antibodies againstTLR4 (PE-Cy7), gamma-delta T cell receptor (FITC),and CCR7 (FITC) had increased specific fluorescence(relative to isotype control) from day 2 to day 5, but nofurther increase at day 7 (data not shown). In BALspecimens, antibodies against BDCA-1 (PE), CX3CR1(APC-Cy7), and TLR2 (eFluor 450) also showed mod-est increases in specific fluorescence at days 5 and 7(Figure 1B). Only CD103 (PE-Cy7) in the BAL samplesexhibited decreased fluorescent intensity, which wasseen at both days 5 and 7 (Figure 2C). Although smallin absolute terms, these changes will need to be accountedfor in future analyses. Importantly, however, staining for
the vast majority of antigens were unaffected by durationof storage in PFA.
Identification of T cell populations in blood, sputum and BALLung T cells have been linked to progression of COPD,especially of emphysema, in multiple studies [14-19].We used a combination of anti-CD45 (leukocyte commonantigen), forward and side light scatter properties, and dif-ferential expression of lineage-specific surface markers toidentify leukocyte populations, as has been previouslyshown to be effective for sputum leukocytes [13,20]. Toidentify CD4+ and CD8+ T cells, we first gated on CD45+CD3+ cells with a low side scatter. Representative stainingdemonstrates the ability of this strategy plus comparisonto isotype controls to distinguish CD4+ and CD8+ T cellsin blood, BAL and sputum (Figure 2). The numbers ineach quadrant indicate the percentage of that subsetamong all CD45+ cells. These numbers are consistentwith what other studies have found in sputum [21], bloodand BAL [22].
Identification of macrophage populations in sputum andBALAlveolar macrophage (AMø) numbers are increased andtheir function is altered in COPD [23]. There is consider-able interest in whether polarization of their gene prod-ucts drives inflammation in COPD [24,25]. To identifyAMø, we gated on CD45+, auto-fluorescent cells and thenselected HLA-DR+ CD11c + cells (Figure 3). This ap-proach was chosen after a preliminary analysis of a var-iety of alternative gating approaches, including use ofMertk (a putative pan-Mø marker in mice) [26], as theone giving the most unambiguous distinction of matureAMø. Although CD11b is included in the panel for ana-lysis, we did not use it to gate on macrophages, as AMøhave been shown to be negative for CD11b, unless acti-vated, therefore their expression is not uniformly positive[27]. As expected, BAL samples contained the largestpercentage of macrophages. As the numbers of subjectsincrease, this dataset will be analyzed further for correl-ation of macrophage surface receptor expression withspirometrically-defined disease severity and other clin-ical data.
Identification of monocyte populations in blood, sputumand BALMonocytes constitute 5 to 10% of peripheral blood leu-kocytes where they circulate for several days before mi-grating into tissues. The degree to which recruitment ofblood monocytes contributes to the expansion of themononuclear phagocyte population in COPD is con-tested. Monocytes were originally divided into “classical”CD14++ CD16- cells and “nonclassical” CD14+ CD16+cells. The classical monocytes were considered to be
Figure 1 Storage in PFA affects fluorescent intensity of specific surface receptor-monoclonal antibody combinations. After addition ofPFA, BAL samples were divided into three samples and data was acquired after storage at 4°C for either 2, 5, or 7 days. A) CD16 (and the majorityof the surface antigens) showed no change in fluorescent intensity between days 2, 5, and 7. B) TLR2 showed an increase in fluorescent intensityat day 5 and at day 7. C) CD103 was the only receptor to show a decrease in fluorescent intensity at days 5 and 7.
Freeman et al. Journal of Translational Medicine (2015) 13:19 Page 8 of 17
better at secreting proinflammatory cytokines and con-stitute the majority of all monocytes in healthy persons,whereas the nonclassical monocytes more closely resem-ble resident tissue macrophages [28-30]. A third subsetof peripheral blood monocytes, termed “intermediate”monocytes are CD14++ CD16+ [31]. It is not clearwhether these intermediate monocytes have a biologic-ally meaningful role or are an intermediate step in thedifferentiation of monocytes but they have been shownto be increased in certain conditions including rheuma-toid arthritis and severe asthma [32].In our study, monocytes were readily identified in all
three compartments using CD14 and CD16 antibodies,
after gating on CD45+, non-autofluorescent cells with amedium side-scatter that were HLA-DR+, relative to iso-type controls (Figure 4A-4C). We chose to define mono-cytes by HLA-DR+ staining, rather than expression ofCD11b (typically positive on monocytes in peripheralblood) or CD11c (negative on blood monocytes, but po-tentially upregulated in GM-CSF-rich environments suchas the lungs), so that we could independently analyze ex-pression of the latter two markers in samples other thanblood. As shown in the representative staining (Figure 4D),we can easily see distinct populations for the classical,non-classical, and intermediate monocytes in peripheralblood.

Figure 2 Representative staining of CD4+ and CD8+ T lymphocytes in blood, BAL, and sputum. Samples of peripheral blood (A, D), BAL(B, E) and sputum (C, F) were gated on cells that were CD45+, CD3+, and had a low side-scatter. Next, using the isotype control (A-C), quadrantsdenoting specific staining for CD4 (horizontal axis) and CD8 (vertical axis) were determined (D-F). Numbers in the CD4+ and CD8+ quadrantsrepresent the percent of each subset among all CD45+ cells.
Freeman et al. Journal of Translational Medicine (2015) 13:19 Page 9 of 17
In the BAL and sputum, monocytes were distinct fromalveolar macrophages due to their reduced size andgranularity, evident by forward scatter and side scatter(data not shown). Monocytes were again divided intothe three populations: classical, intermediate, and non-classical (Figure 4E, 4F). The populations appear to bemore limited to the classical and intermediate pheno-types, reminiscent of a gating strategy developed byBrittan et al. [33] which uses the terms “inducible” and“resident”, respectively, due to the observation that LPSinhalation resulted in an increase in the CD14++ CD16-population, in comparison to a saline-treated group, butthe CD14++ CD16+ population was unchanged betweengroups [33]. We also found that the monocytes fromBAL and sputum were predominantly CD14++ CD16+,the so-called “resident” monocytes (Figures 4E, 4F).
Identification of myeloid dendritic cell (mDC) populationsin blood, sputum and BALIn the present study, we examined markers of threehuman pulmonary DC subsets: myeloid DC type 1(mDC1), myeloid DC type 2 (mDC2), and plasmacytoidDCs (pDCs). DCs were only analyzed in BAL and blooddue to concerns that they would be too small of a popu-lation to identify in sputum. To identify the DC subsets,we used blood dendritic cell antigen (BDCA) markers,which we and others have previously shown accuratelyidentifies these cell types in lung parenchyma [34,35].First, CD45+ cells were selected followed by exclusion ofcells that were positive for either CD3 or CD19+ cells, andof cells with a high forward scatter or high side-scatter.Next, mDC1 cells were identified as being double-positivefor HLA-DR and BDCA-1 (CD1c), whereas mDC2 cells
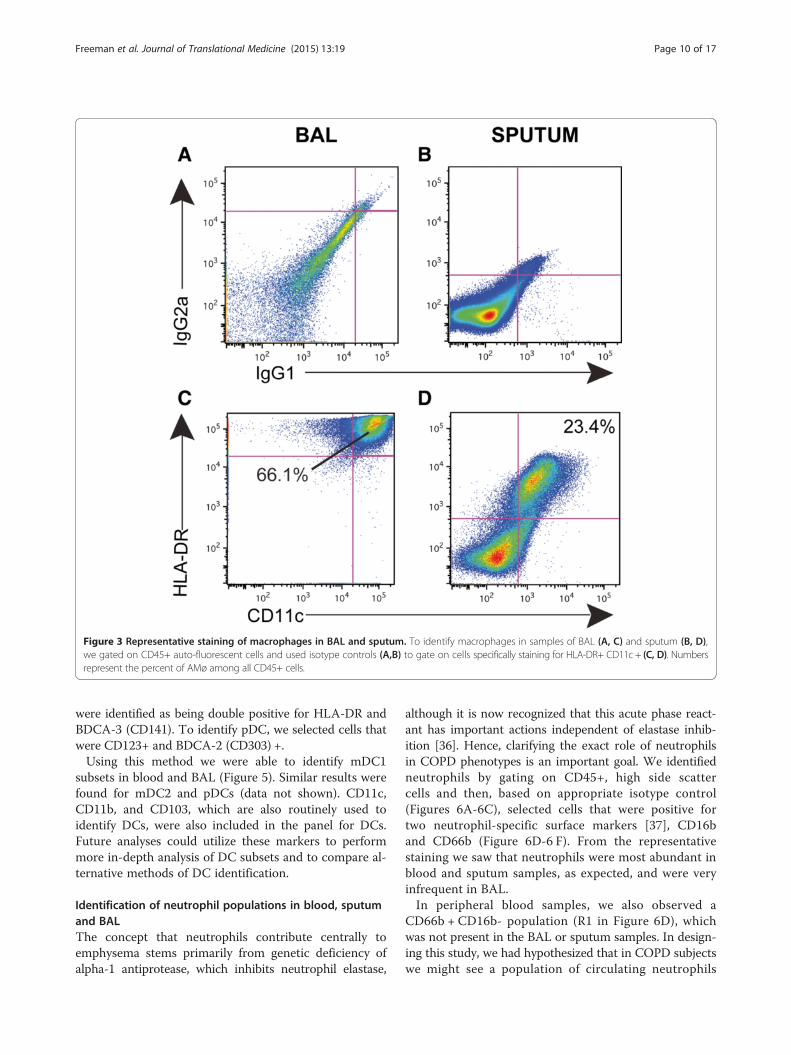
Figure 3 Representative staining of macrophages in BAL and sputum. To identify macrophages in samples of BAL (A, C) and sputum (B, D),we gated on CD45+ auto-fluorescent cells and used isotype controls (A,B) to gate on cells specifically staining for HLA-DR+ CD11c + (C, D). Numbersrepresent the percent of AMø among all CD45+ cells.
Freeman et al. Journal of Translational Medicine (2015) 13:19 Page 10 of 17
were identified as being double positive for HLA-DR andBDCA-3 (CD141). To identify pDC, we selected cells thatwere CD123+ and BDCA-2 (CD303) +.Using this method we were able to identify mDC1
subsets in blood and BAL (Figure 5). Similar results werefound for mDC2 and pDCs (data not shown). CD11c,CD11b, and CD103, which are also routinely used toidentify DCs, were also included in the panel for DCs.Future analyses could utilize these markers to performmore in-depth analysis of DC subsets and to compare al-ternative methods of DC identification.
Identification of neutrophil populations in blood, sputumand BALThe concept that neutrophils contribute centrally toemphysema stems primarily from genetic deficiency ofalpha-1 antiprotease, which inhibits neutrophil elastase,
although it is now recognized that this acute phase react-ant has important actions independent of elastase inhib-ition [36]. Hence, clarifying the exact role of neutrophilsin COPD phenotypes is an important goal. We identifiedneutrophils by gating on CD45+, high side scattercells and then, based on appropriate isotype control(Figures 6A-6C), selected cells that were positive fortwo neutrophil-specific surface markers [37], CD16band CD66b (Figure 6D-6 F). From the representativestaining we saw that neutrophils were most abundant inblood and sputum samples, as expected, and were veryinfrequent in BAL.In peripheral blood samples, we also observed a
CD66b + CD16b- population (R1 in Figure 6D), whichwas not present in the BAL or sputum samples. In design-ing this study, we had hypothesized that in COPD subjectswe might see a population of circulating neutrophils
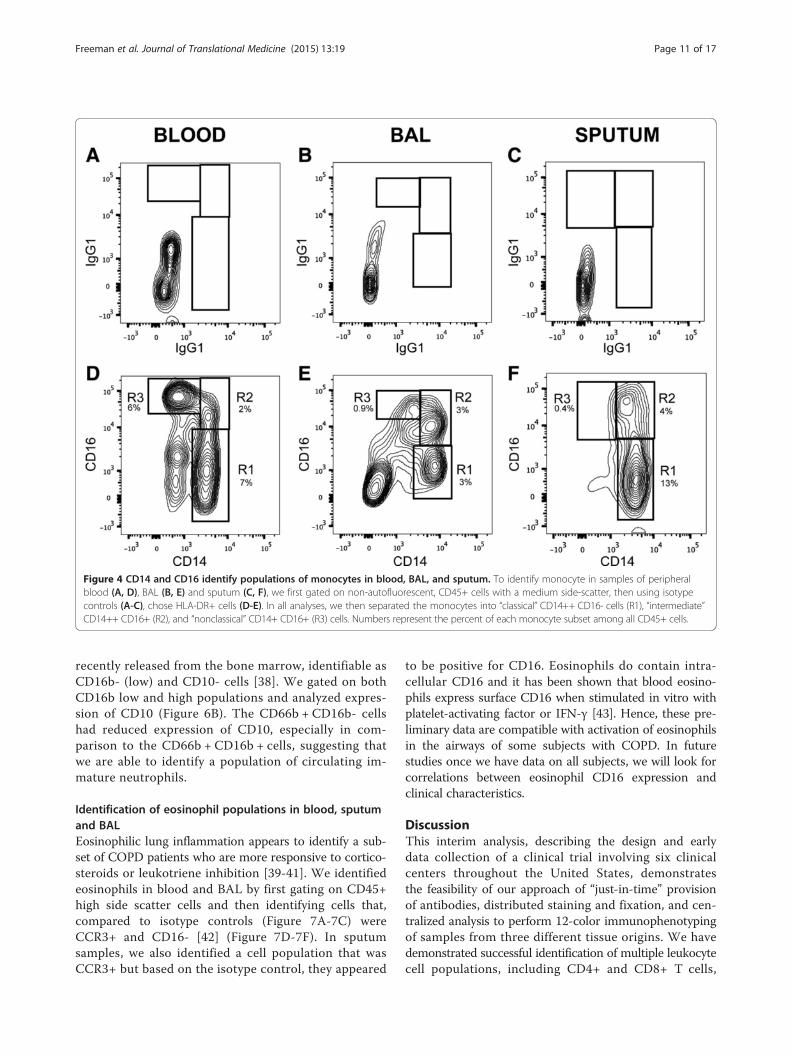
Figure 4 CD14 and CD16 identify populations of monocytes in blood, BAL, and sputum. To identify monocyte in samples of peripheralblood (A, D), BAL (B, E) and sputum (C, F), we first gated on non-autofluorescent, CD45+ cells with a medium side-scatter, then using isotypecontrols (A-C), chose HLA-DR+ cells (D-E). In all analyses, we then separated the monocytes into “classical” CD14++ CD16- cells (R1), “intermediate”CD14++ CD16+ (R2), and “nonclassical” CD14+ CD16+ (R3) cells. Numbers represent the percent of each monocyte subset among all CD45+ cells.
Freeman et al. Journal of Translational Medicine (2015) 13:19 Page 11 of 17
recently released from the bone marrow, identifiable asCD16b- (low) and CD10- cells [38]. We gated on bothCD16b low and high populations and analyzed expres-sion of CD10 (Figure 6B). The CD66b + CD16b- cellshad reduced expression of CD10, especially in com-parison to the CD66b + CD16b + cells, suggesting thatwe are able to identify a population of circulating im-mature neutrophils.
Identification of eosinophil populations in blood, sputumand BALEosinophilic lung inflammation appears to identify a sub-set of COPD patients who are more responsive to cortico-steroids or leukotriene inhibition [39-41]. We identifiedeosinophils in blood and BAL by first gating on CD45+high side scatter cells and then identifying cells that,compared to isotype controls (Figure 7A-7C) wereCCR3+ and CD16- [42] (Figure 7D-7F). In sputumsamples, we also identified a cell population that wasCCR3+ but based on the isotype control, they appeared
to be positive for CD16. Eosinophils do contain intra-cellular CD16 and it has been shown that blood eosino-phils express surface CD16 when stimulated in vitro withplatelet-activating factor or IFN-γ [43]. Hence, these pre-liminary data are compatible with activation of eosinophilsin the airways of some subjects with COPD. In futurestudies once we have data on all subjects, we will look forcorrelations between eosinophil CD16 expression andclinical characteristics.
DiscussionThis interim analysis, describing the design and earlydata collection of a clinical trial involving six clinicalcenters throughout the United States, demonstratesthe feasibility of our approach of “just-in-time” provisionof antibodies, distributed staining and fixation, and cen-tralized analysis to perform 12-color immunophenotypingof samples from three different tissue origins. We havedemonstrated successful identification of multiple leukocytecell populations, including CD4+ and CD8+ T cells,
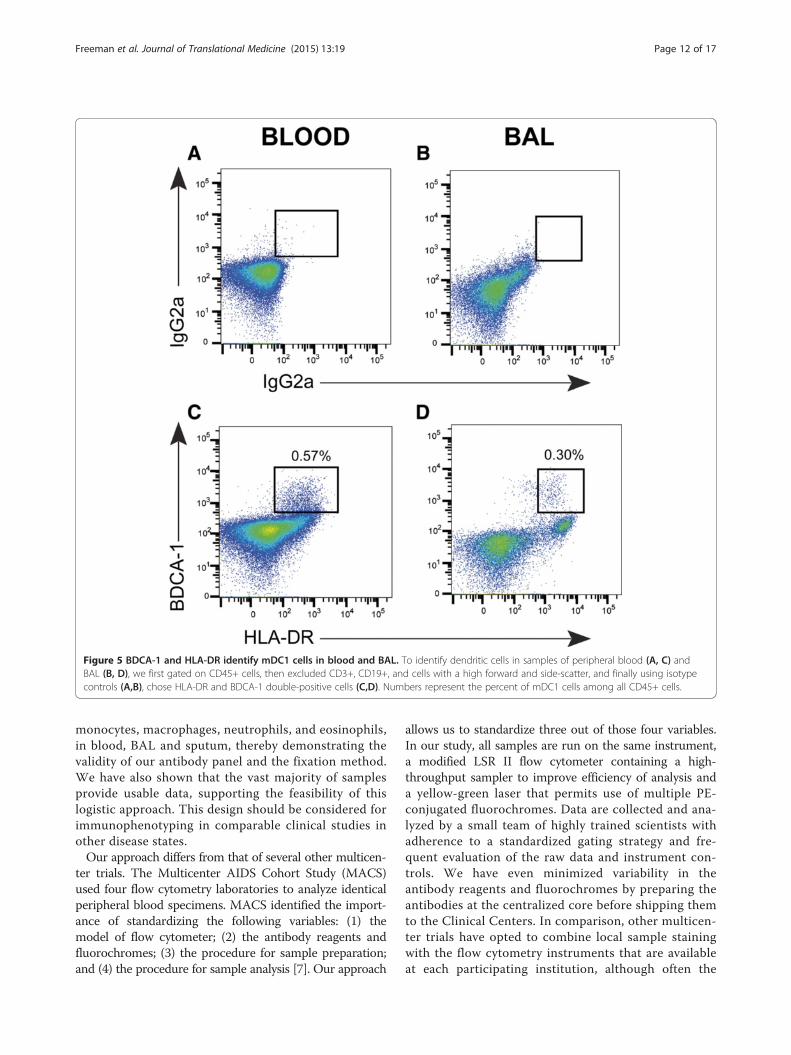
Figure 5 BDCA-1 and HLA-DR identify mDC1 cells in blood and BAL. To identify dendritic cells in samples of peripheral blood (A, C) andBAL (B, D), we first gated on CD45+ cells, then excluded CD3+, CD19+, and cells with a high forward and side-scatter, and finally using isotypecontrols (A,B), chose HLA-DR and BDCA-1 double-positive cells (C,D). Numbers represent the percent of mDC1 cells among all CD45+ cells.
Freeman et al. Journal of Translational Medicine (2015) 13:19 Page 12 of 17
monocytes, macrophages, neutrophils, and eosinophils,in blood, BAL and sputum, thereby demonstrating thevalidity of our antibody panel and the fixation method.We have also shown that the vast majority of samplesprovide usable data, supporting the feasibility of thislogistic approach. This design should be considered forimmunophenotyping in comparable clinical studies inother disease states.Our approach differs from that of several other multicen-
ter trials. The Multicenter AIDS Cohort Study (MACS)used four flow cytometry laboratories to analyze identicalperipheral blood specimens. MACS identified the import-ance of standardizing the following variables: (1) themodel of flow cytometer; (2) the antibody reagents andfluorochromes; (3) the procedure for sample preparation;and (4) the procedure for sample analysis [7]. Our approach
allows us to standardize three out of those four variables.In our study, all samples are run on the same instrument,a modified LSR II flow cytometer containing a high-throughput sampler to improve efficiency of analysis anda yellow-green laser that permits use of multiple PE-conjugated fluorochromes. Data are collected and ana-lyzed by a small team of highly trained scientists withadherence to a standardized gating strategy and fre-quent evaluation of the raw data and instrument con-trols. We have even minimized variability in theantibody reagents and fluorochromes by preparing theantibodies at the centralized core before shipping themto the Clinical Centers. In comparison, other multicen-ter trials have opted to combine local sample stainingwith the flow cytometry instruments that are availableat each participating institution, although often the
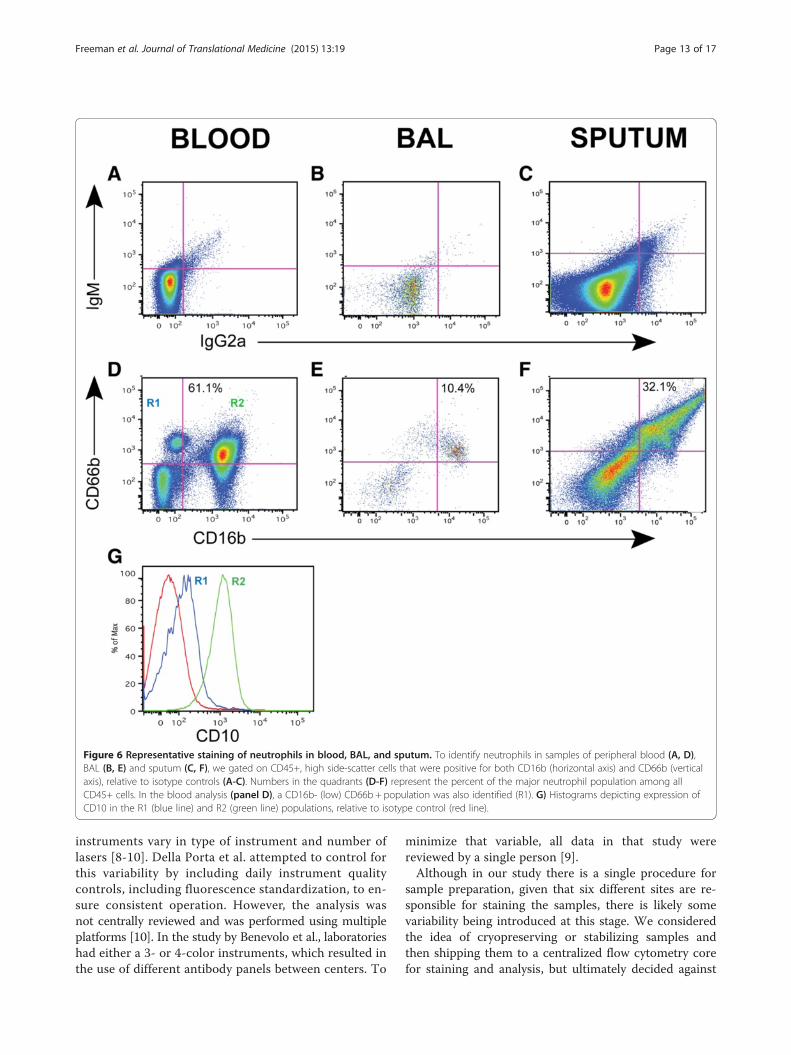
Figure 6 Representative staining of neutrophils in blood, BAL, and sputum. To identify neutrophils in samples of peripheral blood (A, D),BAL (B, E) and sputum (C, F), we gated on CD45+, high side-scatter cells that were positive for both CD16b (horizontal axis) and CD66b (verticalaxis), relative to isotype controls (A-C). Numbers in the quadrants (D-F) represent the percent of the major neutrophil population among allCD45+ cells. In the blood analysis (panel D), a CD16b- (low) CD66b + population was also identified (R1). G) Histograms depicting expression ofCD10 in the R1 (blue line) and R2 (green line) populations, relative to isotype control (red line).
Freeman et al. Journal of Translational Medicine (2015) 13:19 Page 13 of 17
instruments vary in type of instrument and number oflasers [8-10]. Della Porta et al. attempted to control forthis variability by including daily instrument qualitycontrols, including fluorescence standardization, to en-sure consistent operation. However, the analysis wasnot centrally reviewed and was performed using multipleplatforms [10]. In the study by Benevolo et al., laboratorieshad either a 3- or 4-color instruments, which resulted inthe use of different antibody panels between centers. To
minimize that variable, all data in that study werereviewed by a single person [9].Although in our study there is a single procedure for
sample preparation, given that six different sites are re-sponsible for staining the samples, there is likely somevariability being introduced at this stage. We consideredthe idea of cryopreserving or stabilizing samples andthen shipping them to a centralized flow cytometry corefor staining and analysis, but ultimately decided against
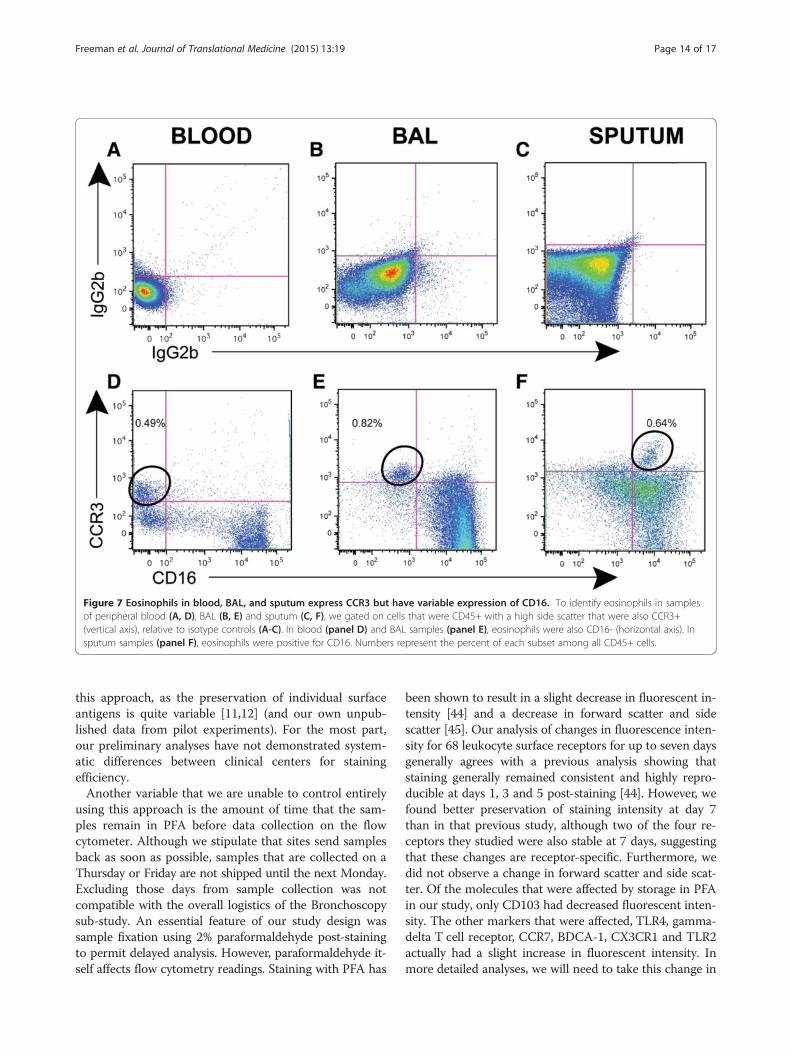
Figure 7 Eosinophils in blood, BAL, and sputum express CCR3 but have variable expression of CD16. To identify eosinophils in samplesof peripheral blood (A, D), BAL (B, E) and sputum (C, F), we gated on cells that were CD45+ with a high side scatter that were also CCR3+(vertical axis), relative to isotype controls (A-C). In blood (panel D) and BAL samples (panel E), eosinophils were also CD16- (horizontal axis). Insputum samples (panel F), eosinophils were positive for CD16. Numbers represent the percent of each subset among all CD45+ cells.
Freeman et al. Journal of Translational Medicine (2015) 13:19 Page 14 of 17
this approach, as the preservation of individual surfaceantigens is quite variable [11,12] (and our own unpub-lished data from pilot experiments). For the most part,our preliminary analyses have not demonstrated system-atic differences between clinical centers for stainingefficiency.Another variable that we are unable to control entirely
using this approach is the amount of time that the sam-ples remain in PFA before data collection on the flowcytometer. Although we stipulate that sites send samplesback as soon as possible, samples that are collected on aThursday or Friday are not shipped until the next Monday.Excluding those days from sample collection was notcompatible with the overall logistics of the Bronchoscopysub-study. An essential feature of our study design wassample fixation using 2% paraformaldehyde post-stainingto permit delayed analysis. However, paraformaldehyde it-self affects flow cytometry readings. Staining with PFA has
been shown to result in a slight decrease in fluorescent in-tensity [44] and a decrease in forward scatter and sidescatter [45]. Our analysis of changes in fluorescence inten-sity for 68 leukocyte surface receptors for up to seven daysgenerally agrees with a previous analysis showing thatstaining generally remained consistent and highly repro-ducible at days 1, 3 and 5 post-staining [44]. However, wefound better preservation of staining intensity at day 7than in that previous study, although two of the four re-ceptors they studied were also stable at 7 days, suggestingthat these changes are receptor-specific. Furthermore, wedid not observe a change in forward scatter and side scat-ter. Of the molecules that were affected by storage in PFAin our study, only CD103 had decreased fluorescent inten-sity. The other markers that were affected, TLR4, gamma-delta T cell receptor, CCR7, BDCA-1, CX3CR1 and TLR2actually had a slight increase in fluorescent intensity. Inmore detailed analyses, we will need to take this change in
Freeman et al. Journal of Translational Medicine (2015) 13:19 Page 15 of 17
fluorescence into account for samples that were unable tobe analyzed within 2 days.An additional limitation of this study is the lack of a
live/dead exclusion gate. FSC and SSC gating was usedto eliminate cell debris, but cannot guarantee that alldead cells were excluded. A final limitation is that theprotocol of the current SPIROMICS Immunophenotyp-ing project does not include staining of intracellularantigens, isolation of specific cell types or in vitro stimu-lation to induce production of gene products such as cy-tokines or inflammatory mediators. We considered thoseundertakings premature until we had both demonstratedthe ability of this multi-center experimental design toproduce usable surface staining data, and had advancedthe characterization of specific cell types in our popula-tion. However, given the technical success illustrated bythese results, we believe that such extension are entirelyfeasible and should be an important goal of future stud-ies in this cohort. For example, it would be of particularinterest to extend previous observations supporting arole for granzyme B in the pathogenesis of emphysema[46,47] by defining which cell types harvested by BALfrom area of radiographically-confirmed emphysema ex-press that cytotoxic molecule.Part of our future analysis strategy will be to correlate
the relative proportions of a given cell type in BAL ver-sus sputum versus blood in the same subject. Other ana-lyses will correlate cell-surface markers on a given celltype with smoking history, spirometry, airway measure-ments, and other parameters. As part of the parentSPIROMICS project, individuals will also be character-ized via physiological, imaging, biochemical, and geneticparameters. These data will also be available for correlat-ing with immunophenotyping analyses.
ConclusionIn conclusion, we have demonstrated the feasibility ofproviding state-of-the-art immunophenotyping of spu-tum, peripheral blood and BAL in a multicenter obser-vational study of COPD biomarkers. Key features of ourapproach that minimize potential sources of experimen-tal variation include “just-in-time” provision of reagentsfrom a centralized Immunophenotyping Core, local im-munostaining and fixation, and return of samples foranalysis on a single flow cytometer. The choice ofleukocyte cell types and their receptors was based on aseries of pre-specified hypotheses plus research interestsof the coauthors. This interim report demonstrates thesuccess of our approach, which may be of value in thedesign of multicenter trials in other disease states. Enroll-ment to this sub-study is anticipated to be completed inthe summer of 2015, so results should be analyzed andpublished over the next two years.
ConsentWritten informed consent was obtained from eachparticipant for the publication of this report and anyaccompanying images.
AbbreviationsBAL: Bronchoalveolar lavage; COPD: Chronic obstructive pulmonary disease;MACS: Multicenter AIDS Cohort Study; PFA: Paraformaldehyde;SPIROMICS: Subpopulations and Intermediate Outcomes in COPD Study.
Competing interestsSC, VRS, JPB, JS, NEA, CMD, PVB, EEC, DJC, ATH, WKO, RJK, RP, DS, MZ:These authors declare that they have no competing interests.CMF and JLC have grant support from MedImmune, Ltd. to analyze lung NKcells in human lungs resected for clinical indications.SIR has received money for service on advisory boards of the followingcompanies: A2B Bio, Almirall, CSL Behring, Dailchi Sanyko, Novartis, Nycomedand Pfizer; and as a consultant to: Almirall, APT Pharma/Brtinall, AstraZeneca,Boehringer Ingelheim, Chiesi, Decision Resource, Dunn Group, Easton Associates,Gerson, GlaxoSmithKline, MedImmune, Novartis, Pearl, Roche, Takeda, Theravance.PGW has a research grant from Pfizer and is a consultant for Genentech,Roche, BI, J&J, NeoStem, Novartis, Astra Zeneca and Merck. He is co-inventoron a patent for asthma biomarkers.
Authors’ contributionsCMF co-designed the antibody panel and the experimental design, wrotethe original manuscript draft and oversaw all aspects of flow cytometric dataanalysis. SC, VRS, JPB and JS participated in assay preparation, coordinationwith clinical sites, data acquisition, and data analysis. NEA, CMD, SIR andPGW participated in study design. PVB, EEC, DJC, and WKO provided datacoordinating support. ATH, JRH, RJK, RP, DS, PGW and MZ oversaw samplecollection and preparation at the clinical sites. JLC conceived of the study,participated in its design and helped prepare the manuscript. All authorsread and approved the final manuscript.
AcknowledgmentsWe are grateful to SPIROMICS participants for their willingness to participatein this study and to the Study Coordinators and staff who though their hardwork make this study possible. SPIROMICS is funded by the National Heart,Lung, and Blood Institute NHLBI (NHLBI-HR-08-08) with support from avariety of industry partners whose representatives serve on the SPIROMICSExternal Scientific Board. Specifically, SPIROMICS is funded by contract fromthe NHLBI: HHSN268200900013C, HHSN268200900014C,HHSN268200900015C, HHSN268200900016C, HHSN268200900017C,HHSN268200900018C, HHSN2682009000019C, HHSN268200900020C. Privatesector contributions to SPIROMICS are facilitated by the Foundation for theNational Institutes of Health (www.fnih.org). CMF and JLC are supported inpart by funding from the Clinical Research & Development Service,Department of Veterans Affairs.
Author details1Research Service, VA Ann Arbor Healthcare System, Ann Arbor, MI, 48105, USA.2Pulmonary & Critical Care Medicine Section, Medicine Service, VA Ann ArborHealthcare System, Ann Arbor, MI 48105, USA. 3Pulmonary & Critical CareMedicine Division, Department of Internal Medicine, University of MichiganHealth System, Ann Arbor, MI 48109, USA. 4Center for Environmental Medicine,Asthma, and Lung Biology, Chapel Hill, NC 27599, USA. 5Center for AirwaysDisease, Department of Medicine, University of North Carolina at Chapel Hill,Chapel Hill, NC 27599, USA. 6Marsico Lung Institute/University of North CarolinaCystic Fibrosis Center, University of North Carolina at Chapel Hill, Chapel Hill, NC27599, USA. 7Center for Genomics and Personalized Medicine, Wake ForestUniversity, Winston-Salem, NC 27157, USA. 8Division of Pulmonary and CriticalCare Medicine, Departments of Medicine and Genetic Medicine, Weill CornellMedical College, New York, NY 10021, USA. 9Division of Pulmonary, Departmentof Internal Medicine, University of Utah Health Sciences Center, Salt Lake City,UT 84112, USA. 10Pulmonary, Critical Care, Sleep and Allergy Division,Department of Internal Medicine, University of Nebraska Medical Center,Omaha, NE 68198, USA. 11Department of Medicine, Columbia UniversityMedical Center, New York, NY 10032, USA. 12Division of Pulmonary, Critical Care,Sleep and Allergy, Department of Medicine, University of California at San
Freeman et al. Journal of Translational Medicine (2015) 13:19 Page 16 of 17
Francisco, San Francisco, CA 94143, USA. 13Division of Pulmonary, Critical Care,and Sleep Medicine, David Geffen School of Medicine, University of California atLos Angeles, Los Angeles, CA 90095, USA. 14Pulmonary and Critical CareMedicine Section (506/111G), Department of Veterans Affairs Healthsystem,2215 Fuller Road, Ann Arbor, MI 48105-2303, USA.
Received: 27 November 2014 Accepted: 26 December 2014
References1. Minino AM, Xu J, Kochanek KD. Deaths: preliminary data for 2008. Natl Vital
Stat Rep. 2010;59:1–72.2. Murray CJ, Lopez AD. Alternative projections of mortality and disability by
cause 1990–2020: global burden of disease study. Lancet. 1997;349:1498–504.3. Hogg JC, Chu F, Utokaparch S, Woods R, Elliott WM, Buzatu L, et al. The
nature of small-airway obstruction in chronic obstructive pulmonary disease.N Engl J Med. 2004;350:2645–53.
4. Barnes PJ, Celli BR. Systemic manifestations and comorbidities of COPD. EurRespir J. 2009;33:1165–85.
5. Han MK, Agusti A, Calverley PM, Celli BR, Criner G, Curtis JL, et al. Chronicobstructive pulmonary disease phenotypes: the future of COPD. Am J RespirCrit Care Med. 2010;182:598–604.
6. Couper D, Lavange LM, Han M, Barr RG, Bleecker E, Hoffman EA, et al.Design of the subpopulations and intermediate outcomes in COPD study(SPIROMICS). Thorax. 2013;69:491–4.
7. Giorgi JV, Cheng HL, Margolick JB, Bauer KD, Ferbas J, Waxdal M, et al.Quality control in the flow cytometric measurement of T-lymphocyte subsets:the multicenter AIDS cohort study experience. Clin Immunol Immunopathol.1990;55:173–86.
8. Bradstock K, Matthews J, Benson E, Page F, Bishop J. Prognostic value ofimmunophenotyping in acute myeloid leukemia. Blood. 1994;84:1220–5.
9. Benevolo G, Stacchini A, Spina M, Ferreri AJ, Arras M, Bellio L, et al. Finalresults of a multicenter trial addressing role of CSF flow cytometric analysisin NHL patients at high risk for CNS dissemination. Blood. 2012;120:3222–8.
10. Della Porta MG, Picone C, Pascutto C, Malcovati L, Tamura H, Handa H, et al.Multicenter validation of a reproducible flow cytometric score for thediagnosis of low-grade myelodysplastic syndromes: results of a EuropeanLeukemiaNET study. Haematologica. 2012;97:1209–17.
11. Ng AA, Lee BT, Teo TS, Poidinger M, Connolly JE. Optimal cellularpreservation for high dimensional flow cytometric analysis of multicentretrials. J Immunol Methods. 2012;385:79–89.
12. Davis C, Wu X, Li W, Fan H, Reddy M. Stability of immunophenotypic markersin fixed peripheral blood for extended analysis using flow cytometry.J Immunol Methods. 2011;363:158–65.
13. Alexis N, Soukup J, Ghio A, Becker S. Sputum phagocytes from healthyindividuals are functional and activated: a flow cytometric comparison withcells in bronchoalveolar lavage and peripheral blood. Clin Immunol.2000;97:21–32.
14. Majori M, Corradi M, Caminati A, Cacciani G, Bertacco S, Pesci A.Predominant Th1 cytokine pattern in peripheral blood from subjects withchronic obstructive pulmonary disease. J Allergy Clin Immunol.1999;103:458–62.
15. Grumelli S, Corry DB, Song LZ, Song L, Green L, Huh J, et al. An immunebasis for lung parenchymal destruction in chronic obstructive pulmonarydisease and emphysema. PLoS Med. 2004;1:e8.
16. Sullivan AK, Simonian PL, Falta MT, Mitchell JD, Cosgrove GP, Brown KK,et al. Oligoclonal CD4+ T cells in the lungs of patients with severeemphysema. Am J Respir Crit Care Med. 2005;172:590–6.
17. Freeman CM, Curtis JL, Chensue SW. CC chemokine receptor 5 and CXCchemokine receptor 6 expression by lung CD8+ cells correlates with chronicobstructive pulmonary disease severity. Am J Pathol. 2007;171:767–76.
18. Lee SH, Goswami S, Grudo A, Song LZ, Bandi V, Goodnight-White S, et al.Antielastin autoimmunity in tobacco smoking-induced emphysema. NatMed. 2007;13:567–9.
19. Freeman CM, Martinez FJ, Han MK, Washko Jr GR, McCubbrey AL, ChensueSW, et al. Lung CD8+ T cells in COPD have increased expression of bacterialTLRs. Respir Res. 2013;14:13.
20. Lay JC, Peden DB, Alexis NE. Flow cytometry of sputum: assessinginflammation and immune response elements in the bronchial airways.Inhal Toxicol. 2011;23:392–406.
21. Leckie MJ, Jenkins GR, Khan J, Smith SJ, Walker C, Barnes PJ, et al. Sputum Tlymphocytes in asthma, COPD and healthy subjects have the phenotype ofactivated intraepithelial T cells (CD69+ CD103+). Thorax. 2003;58:23–9.
22. Heron M, Grutters JC, ten Dam-Molenkamp KM, Hijdra D, van Heugten-Roeling A, Claessen AM, et al. Bronchoalveolar lavage cell pattern fromhealthy human lung. Clin Exp Immunol. 2012;167:523–31.
23. Hiemstra PS. Altered macrophage function in chronic obstructivepulmonary disease. Ann Am Thorac Soc. 2013;10(Suppl):S180–5.
24. Woodruff PG, Koth LL, Yang YH, Rodriguez MW, Favoreto S, Dolganov GM,et al. A distinctive alveolar macrophage activation state induced bycigarette smoking. Am J Respir Crit Care Med. 2005;172:1383–92.
25. Shaykhiev R, Krause A, Salit J, Strulovici-Barel Y, Harvey BG, O'Connor TP,et al. Smoking-dependent reprogramming of alveolar macrophagepolarization: implication for pathogenesis of chronic obstructive pulmonarydisease. J Immunol. 2009;183:2867–83.
26. Gautier EL, Shay T, Miller J, Greter M, Jakubzick C, Ivanov S, et al. Gene-expression profiles and transcriptional regulatory pathways that underlie theidentity and diversity of mouse tissue macrophages. Nat Immunol.2012;13:1118–28.
27. Guth AM, Janssen WJ, Bosio CM, Crouch EC, Henson PM, Dow SW. Lungenvironment determines unique phenotype of alveolar macrophages. Am JPhysiol Lung Cell Mol Physiol. 2009;296:L936–46.
28. Ziegler-Heitbrock L. The CD14+ CD16+ blood monocytes: their role ininfection and inflammation. J Leukoc Biol. 2007;81:584–92.
29. Chow A, Brown BD, Merad M. Studying the mononuclear phagocyte systemin the molecular age. Nat Rev Immunol. 2011;11:788–98.
30. Moniuszko M, Bodzenta-Lukaszyk A, Kowal K, Lenczewska D, Dabrowska M.Enhanced frequencies of CD14++CD16+, but not CD14 + CD16+, peripheralblood monocytes in severe asthmatic patients. Clin Immunol. 2009;130:338–46.
31. Ziegler-Heitbrock L, Hofer TP. Toward a refined definition of monocytesubsets. Front Immunol. 2013;4:23.
32. Hijdra D, Vorselaars AD, Grutters JC, Claessen AM, Rijkers GT. Phenotypiccharacterization of human intermediate monocytes. Front Immunol.2013;4:339.
33. Brittan M, Barr L, Conway Morris A, Duffin R, Rossi F, Johnston S, et al. Anovel subpopulation of monocyte-like cells in the human lung afterlipopolysaccharide inhalation. Eur Respir J. 2012;40:206–14.
34. Demedts IK, Brusselle GG, Vermaelen KY, Pauwels RA. Identification andcharacterization of human pulmonary dendritic cells. Am J Respir Cell MolBiol. 2005;32:177–84.
35. Freeman CM, Martinez FJ, Han MK, Ames TM, Chensue SW, Todt JC, et al.Lung dendritic cell expression of maturation molecules increases withworsening chronic obstructive pulmonary disease. Am J Respir Crit CareMed. 2009;180:1179–88.
36. Jonigk D, Al-Omari M, Maegel L, Muller M, Izykowski N, Hong J, et al.Anti-inflammatory and immunomodulatory properties of alpha1-antitrypsinwithout inhibition of elastase. Proc Natl Acad Sci U S A. 2013;110:15007–12.
37. Wright AK, Rao S, Range S, Eder C, Hofer TP, Frankenberger M, et al. Pivotaladvance: expansion of small sputum macrophages in CF: failure to expressMARCO and mannose receptors. J Leukoc Biol. 2009;86:479–89.
38. Orr Y, Taylor JM, Bannon PG, Geczy C, Kritharides L. Circulating CD10-/CD16lowneutrophils provide a quantitative index of active bone marrow neutrophilrelease. Br J Haematol. 2005;131:508–19.
39. Brightling CE, McKenna S, Hargadon B, Birring S, Green R, Siva R, et al.Sputum eosinophilia and the short term response to inhaledmometasone in chronic obstructive pulmonary disease. Thorax.2005;60:193–8.
40. Brightling CE, Monteiro W, Ward R, Parker D, Morgan MD, Wardlaw AJ, et al.Sputum eosinophilia and short-term response to prednisolone in chronicobstructive pulmonary disease: a randomised controlled trial. Lancet.2000;356:1480–5.
41. Siva R, Green RH, Brightling CE, Shelley M, Hargadon B, McKenna S, et al.Eosinophilic airway inflammation and exacerbations of COPD: a randomisedcontrolled trial. Eur Respir J. 2007;29:906–13.
42. Stein ML, Villanueva JM, Buckmeier BK, Yamada Y, Filipovich AH, Assa'ad AH,et al. Anti-IL-5 (mepolizumab) therapy reduces eosinophil activation ex vivoand increases IL-5 and IL-5 receptor levels. J Allergy Clin Immunol.2008;121:1473–83. 1483 e1471-1474.
43. Davoine F, Labonte I, Ferland C, Mazer B, Chakir J, Laviolette M. Role andmodulation of CD16 expression on eosinophils by cytokines and immunecomplexes. Int Arch Allergy Immunol. 2004;134:165–72.

Freeman et al. Journal of Translational Medicine (2015) 13:19 Page 17 of 17
44. Atar OD, Eisert C, Pokov I, Serebruany VL. Stability validation ofparaformaldehyde-fixed samples for the assessment of the platelet PECAM-1,P-selectin, and PAR-1 thrombin receptor by flow cytometry. J ThrombThrombolysis. 2010;30:79–83.
45. Stewart JC, Villasmil ML, Frampton MW. Changes in fluorescence intensity ofselected leukocyte surface markers following fixation. Cytometry A.2007;71:379–85.
46. Hodge S, Hodge G, Nairn J, Holmes M, Reynolds PN. Increased airwaygranzyme B and perforin in current and ex-smoking COPD subjects. COPD.2006;3:179–87.
47. Kim WD, Chi HS, Choe KH, Oh YM, Lee SD, Kim KR, et al. A possible role forCD8+ and non-CD8+ cell granzyme B in early small airway wall remodellingin centrilobular emphysema. Respirology. 2013;18:688–96.
Submit your next manuscript to BioMed Centraland take full advantage of:
• Convenient online submission
• Thorough peer review
• No space constraints or color figure charges
• Immediate publication on acceptance
• Inclusion in PubMed, CAS, Scopus and Google Scholar
• Research which is freely available for redistribution
Submit your manuscript at www.biomedcentral.com/submit