
DESIGN AND IMPLEMENTATION OF ENERGY MANAGEMENT …
120
DESIGN AND IMPLEMENTATION OF ENERGY MANAGEMENT SYSTEM USING HIGH SCALE SCADA A thesis Submitted By Muhammad Aamir In fulfillment of the requirements for the degree of Doctor of Philosophy In Electronic Engineering Department of Electronic Engineering Faculty of Electrical, Electronic and Computer Engineering MEHRAN UNIVERSITY OF ENGINEERING & TECHNOLOGY JAMSHORO 2014
Transcript of DESIGN AND IMPLEMENTATION OF ENERGY MANAGEMENT …

DESIGN AND IMPLEMENTATION OF ENERGY MANAGEMENT SYSTEM USING HIGH SCALE SCADA
A thesis Submitted By
Muhammad Aamir
In fulfillment of the requirements for the degree of
Doctor of Philosophy
In
Electronic Engineering
Department of Electronic Engineering
Faculty of Electrical, Electronic and Computer Engineering
MEHRAN UNIVERSITY OF ENGINEERING & TECHNOLOGY
JAMSHORO
2014

ii
DEDICATED TO MY PARENTS, FAMILY, TEACHERS
AND FRIENDS


iv
ACKNOWLEDGMENTS
Starting with the name of ALLAH, most gracious, beneficent and merciful.
First of all I bow my head before Almighty Allah with humble thanks for giving me
courage and support in order to accomplish the task of my PhD Thesis. Allah helps
me a lot in all the phases giving me understanding, intelligence and everything I
needed to accomplish my research work with full concentration and motivation.
I would like to thank my PhD supervisor Prof. Dr. Muhammad Aslam Uqaili for
guiding me and giving exceptional idea of RTU development using FPGA which
resulted in timely completion of my PhD research work with desired impact.
This research work has become possible with the help, motivation, support and
patience of my co-supervisor, Prof. Dr. B.S. Chowdhry whose good advice and
kindness has been precious on both academic and personal level, for which I am
enormously grateful to him.
I would like to acknowledge the academic and technical support of my Spanish
supervisor Dr. Javier Poncela who was allocated to me during my mobility period to
University of Malaga under Erasmus Mundus Scholarship Program. Dr. Javier
Poncela provided the necessary technical facilities, training sessions on FPGAs and
helped to a great extent in extracting publications from my research work.
I am also grateful to my best friend Mr. Nishat Ahmad Khan (Manager, Advanced
Engineering and Research Organization) for his kind assistance, technical and moral
support during accomplishment of this research work with a remark that his support
has been indispensable. His colleague Mr. Muhammad Ashraf Khan Niazi (Manager,
Advanced Engineering and Research Organization) also supported me to address
technical aspect of FPGA based design.
I would also like to acknowledge the kind and positive support of Prof. Dr. Bilal Alvi,
the chairman of Electronic Engineering department, SSUET and Prof. Dr. Mukhtiar
Ali Unar, Director IICT, MUET, Jamshoro.

v
I am most grateful to all of my friends, colleagues and above all my family members,
especially my mother, without whom this effort would have been nothing. Special
thanks are due for my colleague Mr. Anees-ur-Rehman and my friend Mr. Faisal
Rafique for providing me assistance in producing few high quality diagrams for the
draft.

vi
TABLE OF CONTENTS
LIST OF ABBREVIATION…………………………………………………… ix LIST OF TABLES……………………………………………………………… x LIST OF FIGURES…………………………………………………………….. xi ABSTRACT…………………………………………………………………….. xiii Chapter 1 INTRODUCTION……………………………………........... 1 1.1 BACKGROUND…………………………………………………………. 1 1.2 MOTIVATION…………………………………………………………… 1 1.3 LITERATURE SURVEY………………………………………………… 2 1.4 PREVIOUS WORK DONE………………………………………………. 8 1.5 PROPOSED RESEARCH METHODOLOGY………………………….. 10 1.6 RESEARCH OBJECTIVES……………………………………………… 12 1.7 THESIS ORGANIZATION……………………………………………… 13 Chapter 2 BASIC CONCEPTS OF SCADA BASED ENERGY MANAGEMENT SYSTEM…………………………………………………… 15
2.1 INTRODUCTION………………………………………………………... 15 2.2 FUNCTIONS OF ENERGY MANAGEMENT SYSTEM………………. 17 2.2.1 Basic Functions……………………………………………………… 18 2.2.1.1 Alarm Processing……………………………………………….. 18 2.2.1.2 Sequence of Events and Database……………………………… 19 2.2.2.3 Load Shedding and Safety Management……………………….. 19 2.2.2 Generation Functions………………………………………………... 20 2.2.2.1 Load Forecasting and Unit Commitment……………………….. 20 2.2.2.2 Economic Dispatch and Automatic Gain Control (AGC)……… 21 2.2.2.3 Interchange Transaction Scheduling and Current Operating Plan 21 2.2.3 Network Related Functions………………………………………….. 22 2.2.3.1 Topology Processing Function…………………………………. 22 2.2.3.2 State Estimation and Network Parameter Adaptation Function... 22 2.2.3.3 Dispatcher Power Flow and Network Sensitivity Function…….. 23 2.2.3.4 Security Analysis and Security Dispatch Function…………… 23 2.2.3.5 Voltage Control Function………………………………………. 24 2.2.3.6 Optimal Power Flow Function………………………………….. 24 2.2.4 Provision of Operator Training……………………………………… 25 2.3 Components of High Scale SCADA……………………………………… 25 2.3.1 RTU Adaptation Work………………………………………………. 26 2.3.2 Telecommunication System………………………………………… 27 2.4 CONCLUSION………………………………………………………….. 31 Chapter 3 MODEL OF OPTIMIZED ENERGY MANAGEMENT SYSTEM…………………………………………………………………………
32
3.1 INTRODUCTION………………………………………………………... 32 3.2 CONTINGENCY CONDITION…………………………………………. 33

vii
3.3 SYSTEM DESIGN PLATFORM………………………………………… 35 3.4 SYSTEM DESIGN TOOLS……………………………………………… 35 3.4.1 Transmission Loading Relief (TLR)………………………………… 35 3.5 DEVELOPMENT OF PROPOSED FRAMEWORK……………………. 37 3.5.1 Power Flow Model…………………………………………………... 37 3.5.2 Contingency Analysis……………………………………………….. 38 3.5.2.1 N-1-1 Contingency Analysis Overview………………………… 39 3.5.3 Calculation of TLR Sensitivities…………………………………….. 41 3.5.4 Determination of Good Locations…………………………………... 42 3.5.5 Generation Scheme………………………………………………….. 42 3.5.6 Optimal Power Flow………………………………………………... 43 3.6 MATHEMATICAL MODEL FOR CONGESTION MANAGEMENT…. 43 3.7 PROPOSED INTEGRATED MODEL OF OPTIMIZED EMS………….. 45 3.8 CONCLUSION…………………………………………………………… 48 Chapter 4 OPTIMAL DESIGN OF REMOTE TERMINAL UNIT (RTU)……………………………………………………………………………
49
4.1 INTRODUCTION……………………………………………………….. 49 4.2 STRUCTURAL DESIGN OF RTU……………………………………... 50 4.3 RTU DESIGN USING FPGA DEVELOPMENT KIT………………….. 53 4.4 PERFORMANCE COMPARISON……………………………………… 55 4.4.1 Performance Issues of PLC based RTU…………………………….. 55 4.4.2 Features of FPGA based RTU………………………………………. 56 4.5 RELIABILITY COMPARISON…………………………………………. 57 4.6 OPTIMIZATION OF WIRELESS LINK FOR RTU…………………….. 58 4.6.1 Operating Frequency and Format of Terrain Data…………………... 61 4.6.2 Link Examination and Network Properties………………………….. 61 4.6.3 Simulation for RF Link Optimization……………………………….. 62 4.7 BENCH MARKING OF DATA COMMUNICATION PROTOCOL…… 63 4.8 RESULTS AND DISCUSSIONS………………………………………… 65 4.9 CONCLUSION………………………………………………………….. 69 Chapter 5 IMPLEMENTATION AND TESTING OF RTU HARDWARE …………………………………………………………………...
70
5.1 INTRODUCTION………………………………………………………... 70 5.2 FEATURES OF DEVELOPED RTU…………………………………….. 71 5.3 PHASES OF IMPLEMENTATION USING FPGA……………………... 72 5.3.1 System Initialization Phase………………………………………….. 73 5.3.2 Interrupt Routine Service……………………………………………. 74 5.3.2.1 Analog Power Inputs & ADC Computation……………………. 75 5.3.3 Functional Verification using Main System Thread………………… 77 5.3.3.1 Functional Qualification of RTU I/Os………………………….. 78 5.3.3.2 Functional Qualification of Complete System………………….. 80 5.3.4 Process Synthesis with Finalized RTL Code………………………... 81

viii
5.3.5 Programming Device………………………………………………… 82 5.3.6 Integration of CIM (MHX-2400)……………………………………. 84 5.4 RESULTS AND DISCUSSIONS………………………………………… 85 5.5 HARDWARE TESTING USING SELECTED SCENARIO……………. 88
5.6 COMPARISON WITH COMMERCIALLY AVAILABLE HARDWARE…………………………………………………………………
91
5.7 CONCLUSION…………………………………………………………… 92 Chapter 6 CONCLUSION & FUTURE WORK……………………………... 93 6.1 SUMMARY………………………………………………………………. 93 6.2 FUTURE WORK…………………………………………………………. 96 6.3 CONCLUSION…………………………………………………………… 96 REFERENCES…………………………………………………………………. 98

ix
LIST OF ABBREVIATIONS
AGC = Automatic Gain Control
CA = Contingency Analysis
CIM = Communication Interface Module
DMS = Distribution Management System
EMS = Energy Management System
EIRP = Effective Isotropic Radiated Power
ETLR = Equivalent Transmission Loading Relief
FPGA = Field Programmable Gate Array
HDL = Hardware Description Language
MTU = Master Terminal Unit
OPF = Optimal Power Flow
PMP = Packet Miss Percentage
PLC = Programmable Logic Controller
RTL = Register Transfer Level
RTU = Remote Terminal Unit
SCK = Serial Clock
SCADA = Supervisory Control and Data Acquisition
SPI = Serial Peripheral Interface
TCI = Tele Control Interface
TLR = Transmission Loading Relief
WTLR = Weighted Transmission Loading Relief

x
LIST OF TABLES
Table 1.1: Projection for demand & supply………………………………………. 2 Table 3.1: Contingency Analysis Showing Three Violations…………………….. 41 Table 3.2: A Sample TLR Calculation Using PowerWorld………………………………………………………………………..
42
Table 3.3: Ranking of Violated Elements on the Basis of Aggregated Percent Overload……………………………………………………………………….......
42
Table 3.4: Validation of proposed optimized EMS algorithm……………………. 47 Table 4.1: Performance comparison of PLC based RTU versus FPGA based RTU……………………………………………………………………………......
57
Table 4.2: Reliability comparison of PLC based RTU versus FPGA based RTU.. 58 Table 4.3: Comparison of available topologies for optimal solution…………….. 60 Table 4.4: Table of Optimized parameters for RF coverage plot between Mehran University (MUET) and LUMHS………………………………………………….
66
Table 4.5: Bench Marking Results for percentage Packet Miss and Packet Error (Erroneous Situation)………………………………………………………………
67
Table 4.6: Bench Marking Results for Downlink Refresh Rate (Expected and Actual)……………………………………………………………………………..
68
Table 5.1: Features of Developed RTU…………………………………………... 71 Table 5.2: Calculation of the ADC inputs in Megawatts Representations……….. 76 Table 5.3: Design summary for RTU design having 32 I/Os…………………….. 86 Table 5.4: Projected device utilization Summary for RTU design having 232 I/Os………………………………………………………………………………...
87
Table 5.5: Comparison of Developed RTU with commercially available RTUs… 91

xi
LIST OF FIGURES
Figure 1.1: Overview of AMR with the provision of controlling at meters……… 5 Figure 1.2: Implementation Overview of SCADA System………………………. 8 Figure 2.1: Typical Components of SCADA System…………………………….. 16 Figure 2.2: Load Profile with Respect to Codes………………………………….. 21 Figure 2.3: RTU Parameterization Tool………………………………………….. 27 Figure 2.4: Snap Shot of Various Windows of RTU Parameterization Tool…….. 27 Figure 2.5: Power Line Carrier (PLC) Communication………………………….. 28 Figure 2.6: Fiber Optic communication for Wide Area Operation………………. 30 Figure 2.7: MSP 1+1 Normal Working…………………………………………... 30 Figure 2.8: MSP 1+1 Faulty Working……………………………………………. 30 Figure 3.1: Normal Operation Example………………………………………….. 34 Figure 3.2: Example of Weak Element Visualization……………………………. 34 Figure 3.3: Calculation of TLR Sensitivities Using PowerWorld………………... 36 Figure 3.4: Flow Diagram Representing Proposed Framework………………….. 37 Figure 3.5: Real scenario of Power Flow Analysis………………………………. 38 Figure 3.6: N-1-1 Contingency Analysis Overview……………………………… 40 Figure 3.7: Cross Section View of a Power System with 05 Buses……………… 41 Figure 3.8: Example of Injection for Congestion Management………………….. 44 Figure 3.9: Powerworld Optimal Model Integration with External Program Using SIMAUTO (Automation Server)…………………………………………...
46
Figure 3.10: Illustration of Integration of Powerworld Simulator with External Program using SIMAUTO…………………………………………………………
47
Figure 4.1: Structural Design of a Remote Terminal Unit (RTU)………………... 51 Figure 4.2: Block Diagram representing each section of Communication Interface Module…………………………………………………………………...
52
Figure 4.3: A Pictorial view of 16 channels Digital Input, 8 channels Analog Input & 8 channels Relay Output RTU Board (Digital Logic outlined in Red implemented using FPGA)………………………………………………………...
53
Figure 4.4: A conceptual view of RTU board implemented using FPGA………... 54 Figure 4.5: A cross sectional of FPGA Development Kit used in RTU Design…. 54 Figure 4.6: Basic PLC Operation…………………………………………………. 55 Figure 4.7: A general block diagram of SCADA components including TCI…… 59 Figure 4.8: Four RTUs communicating with one MTU………………………….. 59 Figure 4.9: Snapshot of properties to predict the attitude of the Proposed Network……………………………………………………………………………
60
Figure 4.10: RF coverage plot for optimized communication between RTU & MTU……………………………………………………………………………….
62
Figure 4.11: A view of Map Property Dialog Box……………………………….. 63 Figure 4.12: Scenario used for Bench Marking of Data Communication Protocol. 64 Figure 4.13: The Master – Node Communication Timing Diagram…………… 65 Figure 4.14 (a): Bench Marking Graphical Results – Erroneous Situation………. 68

xii
Figure 4.15 (b): Bench Marking Graphical Results – Optimized………………... 69 Figure 5.1: Project development flow diagram showing phases of RTU Implementation…………………………………………………………………….
72
Figure 5.2: System Initialization and Interrupt Service Routine combining in Main System Thread with provision of Telecontrol Interface (CIM)……………..
74
Figure 5.3: Analog to Digital Conversion Interface……………………………… 75 Figure 5.4: FPGA Design Flow…………………………………………………... 77 Figure 5.5: RTL top level view of Energy management System………………… 78 Figure 5.6: Analog to Digital Converter SPI Control for RTU…………………... 79 Figure 5.7: Analog to Digital Converter Communication Timing……………….. 79 Figure 5.8: Timing of the serial clock (SCK) and data signals for ADC………… 79 Figure 5.9: Behavioral simulation for digital I/Os………………………………... 80 Figure 5.10: Simulation results of complete RTU for energy management algorithm…………………………………………………………………………...
81
Figure 5.11: Internal RTL level schematic of developed RTU…………………... 82 Figure 5.12: Detailed configuration options……………………………………… 83 Figure 5.13: Programming of device (FPGA)……………………………………. 84 Figure 5.14: Resource utilization within FPGA for RTU design………………… 88 Figure 5.15: Screen shot of GUI used for hardware testing of RTU……………... 90

xiii
ABSTRACT
For energy deficit countries like Pakistan, an optimal energy management program is
essential to make sure reliability in energy supply and discover energy saving
opportunities by minimizing costs related to generation and transmission of energy.
SCADA based management and supervision systems capitalize on the deployment of
the on hand power management facility by interactive review of the electrical power
network to check for system damages and outages.
This thesis has contributed in low cost development and implementation of a Remote
Terminal Unit (RTU) with provision of wireless connectivity with an aim to optimize
the energy management system based on SCADA. This particular design of RTU is
based on FPGA and its performance is better than commercially available RTUs
based on Programmable Logic Controllers (PLCs) and it is also well comparable with
other commercially available modern RTUs for power related applications. The
characteristics and features of developed RTU have been verified by means of
hardware testing. Moreover, a model for optimized energy management system was
also proposed and demonstrated by means of simulations. The provision of wireless
connectivity in the developed RTU has been optimized and benchmarking was also
done for further verification.
Initially, the modeling of the power system outages and the system adjustments using
contingency analysis using PowerWorld simulator is discussed which is followed by
consideration of optimal power flow (OPF) tool to determine effective system
corrections to execute in either the base case followed by a primary contingency or
any of the secondary contingencies. It also incorporates two major functionalities
namely Minimum Cost and Minimum Control Change which are available in OPF. It
is then supplemented by mathematical model for congestion management to prove
that the power flow can be affected not only by either varying voltage magnitudes or
the power angle but it can also be affected by changing reactance of the transmission
line. Therefore, either power angle or voltage magnitude may be used for congestion
management. An integrated framework has been proposed after the development of
model for power system outages and adjustments, OPF and mathematical model for

xiv
congestion management. This framework can provide a simulation platform for
detailed study of power system to overcome issues like execution of restoration
scheme by adding renewable energy resources.
For development of RTU, a comparative assessment of performance of both
methodologies of RTU design is executed, one based on PLCs and other one based on
FPGAs which finalized for development of RTU due to its better performance and
reliability. The hardware implementation and verification of this RTU design is done
using a starter kit based on XILINX Spartan-3 Series FPGA with 500K logic gates
and the MHX-2400 frequency-hopping 2.4 GHz spread-spectrum communications
module which had been examined and found suitable as Communication Interface
Module for this development. The FPGA based RTU offers flexibility in terms of
I/Os, CPU and radio related configurations and expansion can be accommodated
quickly if needed as FPGA based designs are reconfigurable.
The design of link optimization has been implemented using Radio Mobile Simulator,
a well known simulation platform for point to multipoint link optimization. The data
transmitted from RTU is being received through Communication Interface Module for
data integrity and graphical representation for which further benchmarking is done for
Data Communication Protocol to further verify that the proposed solution is well
suited for optimized energy management in countries having shortfall of energy.
The implementation practical RTU hardware using FPGA include design
initialization, main system thread, design modeling and qualification, process
synthesis, programming of device and integration of communication interface module
(MHX-2400) which interfaced with Spartan 3E using header available on starter kit.
Finally, simulation of field inputs (variation in load) and control outputs (circuit
breaker and isolators) connected with RTU from test panels has been done in
hardware testing phase which allows sample inputs to be varied over the entire input
range using a Graphical User Interface (GUI) followed by the suggestions for future
work so that the research work may be extended to integrate new features and tools to
contribute in the developed RTU hardware.

1
CHAPTER 1
INTRODUCTION 1.1 BACKGROUND
The power segment in Pakistan is a combination of thermal units and hydroelectricity
mainly governed by two generation companies, Water and Power Development
Authority (WAPDA) and K-Electric formerly known as Karachi Electric Supply
Corporation (KESC). Both the companies have vertically integrated approach in terms
of generation, transmission and distribution. Besides hydro and thermal generation,
two nuclear power plants KANUPP at Karachi and CHANUPP at Chashma are also
producing electricity. In addition the government of Pakistan had allowed
independent power producers (IPPs) and small power producers (SPPs) to contribute
in generation which was initiated in year 1994. [1]
For countries like Pakistan where demand of energy is being increased every year, an
optimal energy management program is mandatory to ensure a reliable energy supply,
discover energy saving opportunities and minimize costs related to generation and
transmission of energy. Establishing an energy supervision scheme to execute
productive energy conservation openings conclude in cost-effective production,
increased profit and useful advantage for the energy producer. Moreover, saving in
energy utilization may be resulted in considerable environmental improvements.
1.2 MOTIVATION
SCADA based management and supervision systems capitalize on the deployment of
the on hand power management facility by interactive review of the electrical power
network to check for system damages and outages [2]. Increasing demand of load all
together with an enduring deregulation of electricity utility producing companies in
many countries usually lead to the disruption in transmission systems such that they
operate very close to their limits. Power systems have now become more susceptible
to collapse due to violation of limits for a maximum allowed transmission for any
passage of the power distribution network.

2
The following table is taken from Pakistan Energy Overview, compiled by South
Asian Regional Initiative for energy.
Table 1.1: Projection for demand & supply. (Source: Ministry of Water and Power, Pakistan)
S. No. Year Firm Supply (MW) Peak Demand (MW) Surplus/(Deficit) (MW) 01 1999-2000 13445 11296 2149 02 2000-2001 13716 11852 1864 03 2001-2002 13693 12443 1250 04 2002-2003 14336 13071 1265 05 2003-2004 15046 13831 1215 06 2004-2005 15082 14642 440 07 2005-2006 15072 15483 (441) 08 2006-2007 15091 16548 (1457) 09 2007-2008 15055 17689 (2634) 10 2008-2009 15055 19080 (4025) 11 2009-2010 15055 20584 (5529) 12 2010-2011 15600 20728 (5128) 13 2011-2012 16302 22235 (5933) 14 2012-2013 16302 23805 (7503) 15 2013-2014 16302 25479 (9177)
Note: Current Shortfall is more than 9000 MegaWatt for summer season.
According to the above-mentioned table, the shortfall in terms of supply is being
increased, so effective monitoring and controlling is essential in country like Pakistan;
this may be possible through implementing high scale SCADA system for energy
management.
1.3 LITERATURE SURVEY
There are many commercially available systems which have been developed with the
aim of implementing energy management systems. This section also presents a review
of selected scholarly articles which had contributed well in the field of energy
management. XA/21 [3] is a SCADA based energy management system (EMS)
commercially available solution which is well known in field having excellent
functions. It is particularly developed to meet complex needs of current electric
utilities. It has continued to modernize the industry since its entrance in the market as
the first open energy management system (EMS) in early 1990. Most of the world has
great trust over XA/21 because of its recognized reputation of field performance,
more than five million hours of field operation, premier utilities with the management

3
of their critical generation and transmission resources. XA/21’s module based
software and open system flexible architecture blended with GE Energy’s team of
professionals from all over the world had resulted in enhanced reliability and service
performance, while it is conforming strict compliance with industry requirements
which are always changing.
Establishing an energy management program and identifying energy savings
opportunities is a guidebook [4] for small manufacturers which is funded by New
Jersey state department of environmental protection. The purpose of this guide is to
encourage manufacturers to develop a strategic plan for energy policy-making, just
like the rest of their critical business decisions. A focus on energy management
program is a self-assessment to determine the energy-saving opportunities. Establish
energy management plan and implement cost-effective energy-saving opportunities,
leading to more profitability and competitive advantage manufacturers. Also
significantly, reducing energy use can produce significant environmental
improvements.
Energy management handbook, sixth edition [5] is an important source of literature
survey. The sixth edition includes heat pumps with ground source, sustained
management and a new chapter related to intelligent building management
transforming to green buildings added with detailed revision of control systems.
Detailed coverage about effective energy management, including economic analysis,
energy audits, Heating Ventilation and Air Conditioning systems (HVAC),
maintenance of Control systems, industrial insulation per two components, lighting,
energy systems, alternative energy, indoor air quality, locational marginal pricing,
storage of thermal energy, industry standards related to management of power
systems, provision of natural gas for generation, practical deregulation, energy
security, financing, commissioning, measurement and certification of energy-saving
achievements. Detailed illustrations, tables, charts, and many other useful tools
provided throughout.

4
The load dispatch system of K-Electric [6] has been upgraded by Siemens including
the installation of SCADA systems and automatic meter reading systems up to the
level of K-Electric’s transmission grid to perform the following objectives [7]:
1. Well-organized management and supervision of power system operations.
2. Smart decisions in order to minimize losses and damages due to outages.
3. Collecting Readings of meters from 40 energy interchange points and 11KV
incoming and outgoing feeders which are 1420 in total.
The central control center had setup in a dedicated building located at GIZRI inside
the premises of K- Electric’s head office. This upgrade accomplished in 2010 to
provide LDCs and DCC i.e. it includes two levels of hierarchy.
We can have four different models and concepts related to automated meter reading
system. The first concept is limited to monitoring the load on the outdoor pole
mounted transformer. Control function for transformer operated meters can’t be
executed by remotely located AMR as the deployed concept is just limited for
monitoring purpose. The second concept introduced metering management system as
a separate unit. All control devices (RTU, converters, circuit breakers, etc.) have been
installed in each PMT and measurement location. The status of all Pole Mounted
Transformer (PMTs) is available on operator console in graphical representation
providing enhanced control capabilities. Transducers are used to send meter data to
the SCADA system and the meters are able to send data to the meter reading system.
AMR system is using multiple choices like the sun secure global desktop (SSGD),
SCADA systems and integration of customer data, translation AMR technological
addresses (TA) to conform to the SCADA system in terms of compatibility. The third
function integrates AMR concepts described in the control devices (RTU, circuit
breakers and converters) installed within distribution network and additional
distribution management system (DMS) system installed with limited control.
Automatic meter reading operation is being done by the different systems and special
functions can be obtained from the key in the control room to the position
measurement values and multiplying the calculated value for all other PMTs.

5
The fourth concept involves full control and use of geographic information systems
(GIS), and has enhanced DMS functionality for monitoring. AMR smart grid systems
provide significant advantages, including efficient power system management and
supervision. [8]
AMR smart grid systems provide efficient and more intelligent system control and
monitoring functions [9]. Wireless communication link are resulting in the quick
installation of and synchronization of system with new generation.
Fig. 1.1: Overview of AMR with the provision of controlling at meters.
With the deployment of such smart solution, a single measurement system can
manage and generate an ‘All in one report’, containing detail about correct generation,
transmission and energy loss data and distribution at all levels works faster thus
providing required reliability by avoiding integration issues. As all installed meters
from the power station to the consumer level are the time synchronized with a single
clock, so there is no loss of contrast and no chance of the calculation errors in the
data. High scale SCADA system is improved by the use of integration of different
allocation functionality of the application. It also includes meter reading system and
GIS integration fulfilling the needs of smart grid systems by which monitoring and
control at all measurement locations (which are geographically distributed) of
network is possible to quickly identify and correct errors.

6
An experimental platform was designed and developed at Victorian network
switching center by Amanullah Maung [10] et al which performs analysis of
distributed network protocol (DNP3) over a wide area network (WAN) performance
characteristics. In this experiment, the use of real-time data is transmitted from the
WAN to the intelligent electronic device utility control center. Experimental work has
shown that the measured WAN latency by means of DNP3 is high because this type
of network is much more complex in terms of routing and additional exchange. This
requires further development in DNP3 protocol to communicate reliably via WAN
(IEPS-W) used for embedding information in the power system. Therefore Optimized
Network Engineering Tool (OPNET) is selected for further development of DNP3.
OPNET is the research and development of the industry's leading specialized
networks. Finally, the modified protocol is based on the development of reliable and
secure DNP3 protocol to transmit power system data for IEPS-W.
Jian Wu et al [11] described that the Supervisory Control and Data Acquisition
(SCADA) systems are used for communication and control system monitoring,
operation and maintenance of energy infrastructure grid. Compared with traditional
applications, SCADA systems have a deadline for demanding mission-critical. There
are special time constraints for real-time database for use in SCADA systems. In the
SCADA real-time database extends the traditional database-memory database to
include. Such real-time database management is designed to operate in harsh
environments in real-time systems, strict requirements on the use of resources, and is
ready to provide a real-life application of the required performance and reliability. In
this paper, the main principles of real-time database have been introduced. In the
implementation of the power system SCADA systems are discussed and a brief
introduction sample database is also covered.
Juan García et al [12] described that the deployment of advanced communication
technology, highly integrated control and programming platform greatly improves the
performance of industrial control systems. A particular example is the case of
Motronic where collaboration between local industry and academia has led to
advanced distributed network control system.
7
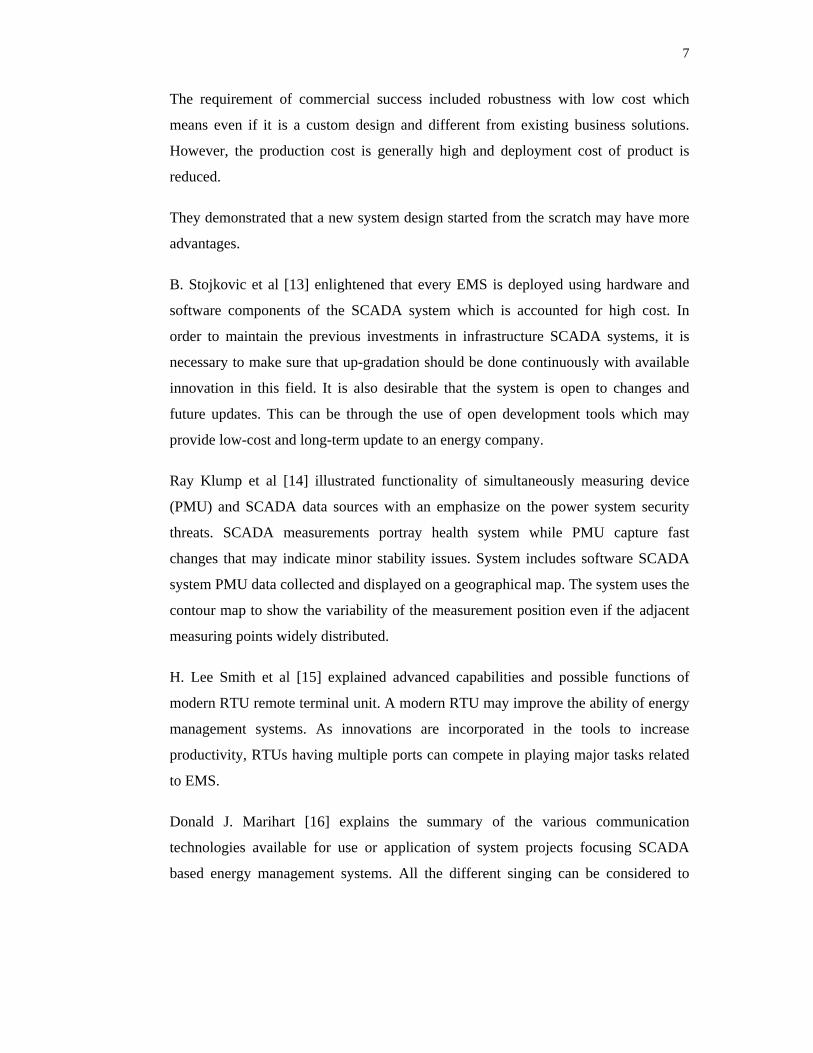
The requirement of commercial success included robustness with low cost which
means even if it is a custom design and different from existing business solutions.
However, the production cost is generally high and deployment cost of product is
reduced.
They demonstrated that a new system design started from the scratch may have more
advantages.
B. Stojkovic et al [13] enlightened that every EMS is deployed using hardware and
software components of the SCADA system which is accounted for high cost. In
order to maintain the previous investments in infrastructure SCADA systems, it is
necessary to make sure that up-gradation should be done continuously with available
innovation in this field. It is also desirable that the system is open to changes and
future updates. This can be through the use of open development tools which may
provide low-cost and long-term update to an energy company.
Ray Klump et al [14] illustrated functionality of simultaneously measuring device
(PMU) and SCADA data sources with an emphasize on the power system security
threats. SCADA measurements portray health system while PMU capture fast
changes that may indicate minor stability issues. System includes software SCADA
system PMU data collected and displayed on a geographical map. The system uses the
contour map to show the variability of the measurement position even if the adjacent
measuring points widely distributed.
H. Lee Smith et al [15] explained advanced capabilities and possible functions of
modern RTU remote terminal unit. A modern RTU may improve the ability of energy
management systems. As innovations are incorporated in the tools to increase
productivity, RTUs having multiple ports can compete in playing major tasks related
to EMS.
Donald J. Marihart [16] explains the summary of the various communication
technologies available for use or application of system projects focusing SCADA
based energy management systems. All the different singing can be considered to

8
select the most appropriate communication technology to establish communication
link between RTU and SCADA master.
1.4 PREVIOUS WORK DONE
Basic concept for this project has been taken from the research work containing
Performance Analysis of Wide area operation, control and protection using High
Scale SCADA System by Muhammad Aamir et al [17]. As an important and
necessary part of SCADA, Remote Terminal Units (RTUs) acquire current, voltage
and frequency measurements for SCADA system. RTUs are installed at selected
locations of different grid stations to acquire complete analog and digital data of the
station. These RTUs are getting digital data from field instruments connected with
relays to show and operate live status of Circuit breakers or isolators, however for
analog data, transducers are connected with CT and PT.
Fig. 1.2: Implementation Overview of SCADA System.
Second encouragement was provided by the successful and low cost implementation
of FPGA in real time remote monitoring system that acquires data from any kind of
sensor to be transmitted by radio frequency to a computer with an interface module,
situated within a 900 m radius designed by Joshua Mendoza-Jasso et al [18]. Such
monitoring and control in above mentioned scenarios is very significant to support
important applications like energy management. However, the cost of RTU is a real
concern when numerous sites to be monitored and controlled. Therefore the main

9
outcome of this particular work is the design and implementation of a low cost remote
terminal unit which is an essential of any SCADA system.
EASHY Yang [19] portrayed the queuing model for performance monitoring and
evaluation of SCADA system. With focus on the application of queuing model, two
SCADA Systems had been designed and analyzed. On the basis of parallel processing
concept, the dual-processor-based SCADA operation was described in detail. The
result of this analysis reveals that the cost effective and best possible performance can
be achieved by using a queuing model.
Craig Crider et al [20] described the progress in the automation of transmission and
distribution systems for energy management. Two-way automatic control system
solutions, such as SCADA systems and load management are used to reduce system
losses and improve service reliability to customers.
Qiu Bin et al [21] described that the decline in the frequency causes occurrence of
load shedding conditions or loss of generating capacity and should be treated as an
emergency measure. Especially in isolation (island) system, due to the low moment of
inertia and limited stock, frequency attenuation due to the resulting loss rate can be
more pronounced. Therefore, a more elaborate scheme requires fewer loads than on
an island in a large system of interconnected systems.
C.pimpa et al [22] described the expert system used to control the 22 kV voltage
power supply system based on the type of SCADA system level in Thailand.
Currently, the operator must control the voltage through their knowledge and
experience to make decisions. This expert system is capable of processing data from
SCADA systems and help operators to find buses having unusual circumstances.
M. Kezunovic et al [23] evaluated the measurement results that are traditionally
transmitted to the energy management system (EMS) every 2-10 seconds using
supervisory control and data acquisition system. This is considered to be sufficient,
because the environmental management system is designed primarily for Tracking
normal and alarm status. The rapid development of advanced computers,
communication Networks, database technology and substation Intelligent Electronic

10
Devices (IED), as well as the new demands of the electricity market, make the
development of a new generation of EMS highly desirable. Development by electric
utilities impulse, the need to adapt to new developments to provide perfect service and
(among other things) the penetration of smart grid and distributed generation of smart
sensors (DG) driven is in practice. This leads to the need for a higher time resolution
SCADA measurements and precise time synchronization, as well as more powerful to
deal with emerging monitoring, control and protection needs.
In numerous practical implementations, Programmable Logic Controllers are being
used at remote locations which have several limitations to be discussed in chapter 4 in
much detail. For example João Figueiredo et al [24] presented an energy management
platform for intelligent buildings using a SCADA system in which control strategy
implements an hierarchical cascade controller where inner loops are performed by
local PLC (Programmable Logic Controller), and the outer loop is managed by a
centralized SCADA system, which interacts with the entire local PLC network.
1.5 PROPOSED RESEARCH METHODOLOGY
Overall configuration of the system under investigation is divided into two main
networks namely Transmission Network and Distribution Network. It may either
consists of complete supervision and management capability on overall network up to
user end or make a division in transmission and distribution networks.
SCADA system can spread over various segments ranging from full management and
supervision features on high voltage side e.g. up to 11kV bus bars. However these
management and supervision features are also made available on voltages below
11kV which is expressed as distribution network.
The actual work has been carried out on voltages below 11kV i.e. in the distribution
network
The following directions are formulated by extensive discussion with the supervisors
which may be considered as basis for proposed design of Energy Management
System:

11
a. One significant consideration was to reduce the cost of the distribution
network. First, an ideal case can be modeled assuming no loss using a
simulation platform like “Power world” and then a real case can be considered
which also includes transmission losses. This may lead to modeling of outages
and the system adjustments using Contingency Analysis in Power World.
b. One significant direction is to model the behaviour of users (electricity
consumers) in terms of consumption which can be used for forecasting of
demand for different slots (Morning, Evening, Night) and different Seasons
(summer and winter). In Spain, conventional energy meters will be replaced
by the Intelligent Energy Meters to introduce multi tariff system by year 2020.
It will optimize the transmission and electricity cost. This may lead to the
Development of Optimized EMS using Optimal Power Flow (OPF) and
Contingency Analysis (CA).
c. Another direction is to include concept of smart grid (Intelligent Grid) which
includes self sustainability of each block if load demand increases, therefore
sustainability challenges have to be addressed.
d. One more direction is given by Dr. Chowdhry in which allowed load for
consumers can be monitored and intelligent circuit breakers should be capable
of switching off certain devices instead of complete shut down for an area. But
this approach would further require infrastructure with intelligent energy
meters or Automatic Meter Reading. Therefore this option is out of the scope
of this particular research work.
In the light of above-mentioned research directions, the following phases of
methodology had been proposed:
I. An efficient and low cost Remote Terminal Unit (RTU) has been developed
by selecting optimized design parameters. It could be either based on FPGA
(Field Programmable Gate Array) or high speed Microcontroller. The
preference is being given to FPGA based design which exhibits capability of
developing it as reconfigurable system.
II. Parameterization software has been developed for the RTU which is interfaced
with energy management system in real time using GUI.

12
III. Optimization of Radio Frequency Communication Link for RTU has been
done considering Radio-Mobile software platform by means of simulations.
IV. Mathematical Model for Congestion Management and integration framework
has been proposed.
V. Implementation and simulation based testing of FPGA based RTU Hardware
has been done which mainly includes behavioral simulation.
1.6 RESEARCH OBJECTIVES
SCADA systems have been transformed to intelligent systems to overcome all
violations of power outages and network performance related issues in very smart
manner. Various functions of the SCADA system makes it intelligent enough to
handle all the key issues of system operation to provide opportunities to improve
network performance by itself. SCADA system not only provides basic control and
supervisory monitoring, but also different applications to run in parallel to provide
additional functionality to address energy management, statistics and network
application, performance management system and problems distribution.
The following research objectives have been accomplished during this particular
doctoral work:
a) To model the power system outages and the system adjustments using
Contingency Analysis in Power World simulator.
b) Development of Optimized Energy Management System using Optimal Power
Flow (OPF) and Contingency Analysis.
c) Design of an efficient and low cost Remote Terminal Unit (RTU) with
Optimized Radio Frequency Link.
d) Mathematical Model for Congestion Management and integration framework.
e) Implementation and simulation based testing of proposed RTU Hardware.
The accomplishment of above mentioned objectives led to the fact that a careful
design of SCADA system can overcome most of the problems related to electric
power instability, outages and network performance.

13
1.7 THESIS ORGANIZATION
The thesis is resulted in publication of two impact factor journal papers, two
conference papers and a fifth paper that has been submitted and accepted in an impact
factor journal. The thesis is divided into six chapters where each chapter is written to
describe a particular phase of research.
Chapter 1 gives a general overview to the background of the research problem,
foundation, detailed literature review and available solutions and it also contains
several research directions. It also presents research objectives and methodologies and
a formal insight to the problems associated with previous work done. The rest of the
thesis has the following structure.
Chapter 2 outlines basic concepts of high scale SCADA based energy management
by describing functions of energy management system in detail. It also contains
description about components of high scale SCADA system.
Chapter 3 gives the complete understanding of the concepts involved and research
carried out to model an optimized energy management system using Power World
platform. It provides the details of system design tools and optimized power flow
model. Results are described and discussed with practical considerations of power
flow models.
Chapter 4 introduces general design understandings of RTUs followed by RTU
Design using Field Programmable Gate Array Development kit. The next section of
this chapter presents performance comparison of both approaches of RTU design.
Optimization of Reliability comparison is discussed in section 5, while optimization
of RF link to implement wireless SCADA is described in section 6. The last section
describes conclusion by presenting importance of the low cost RTU Design along
with optimization of wireless link.
Chapter 5 describes Phases of Implementation OF Remote Terminal Unit (RTU)
using FPGA. It also includes behavioral modeling using ISE web pack of XILINX for
the purpose of testing functionality of developed RTU. Features of developed RTU

14
are also compared with commercially available hardware considering its cost
effectiveness.
Chapter 6 reviews the contributions of this particular research work and also portrays
the future research directions and possible extensions to the presented work.

15
CHAPTER 2
1 BASIC CONCEPTS OF SCADA BASED ENERGY MANAGEMENT SYSTEM
2.1 INTRODUCTION
Highly proficient, effective and fast control systems have emerged as an essential
requirement in both service and manufacturing industry. Sequential control system are
preferred by industries having small dimensions to offer useful supervision and
control due to certain advantages of sequential control systems which make it suitable
for process industry. Wide area operations like involves coverage of large
geographical area like Karachi to implement supervision and effective management of
complicated and distributed functions. SCADA system deployment can be useful for
both service and manufacturing facilities or related to monitoring of some critical
infrastructure in community or private sectors depending upon particular scenario.
Both service and manufacturing automation systems (SCADA systems) are
combination of both hardware and software modules to provide supervision and
control of various processes.
SCADA is a short form for Supervisory Control and Data Acquisition. Stuart A.Buyer
[25] described that SCADA systems are utilized to monitor and control a plant or
equipment in industries for instance energy, oil and gas refining, telecommunications,
water and waste control, and transportation. These systems include the transfer of data
between a SCADA Master Terminal Unit (MTU) and a number of Remote Terminal
Units (RTUs) and/or Programmable Logic Controllers (PLCs), and the MTU to the
operator workstation.
SCADA systems consist of:
• One or more field data interface devices which are usually termed as RTUs, or
PLCs, to interface field sensing devices and local control switchboxes and
valve actuators.

16
• A communications system (means of telemetry) utilized to transmit data
between field data interface devices and control units and the computers in the
MTU of SCADA. It can be radio, telephone, cable, satellite, etc., or any
combination of these.
• A central host computer server or collection of servers, sometimes called a
SCADA Center, master station, or Master Terminal Unit (MTU)
• A collection of standard and/or custom software, sometimes called Human
Machine Interface (HMI) software used to provide the MTU and operator
terminal application, support the communications system, and monitor and
control remotely located field data interface devices.
The typical components of a SCADA system along with software are shown in
Fig.2.1.
Fig. 2.1: Typical Components of SCADA System.
In general, there are five activities in any SCADA system. Each of these activities
executes its specific part of processing.
• Input/ Output Activity: This activity is responsible to provide interface
between the control and monitoring system and the field devices (installed on
plant floor).

17
• Alarm Activity: This significant activity supervises all alarms by sensing
digital alarm spots and equating the values of analog alarm spots to alarm
thresholds.
• Trends Activity: This particular activity manages to gather data to be
monitored over some specific time interval.
• Reports Activity: This activity produces reports from field devices (installed
on plant floor). This report production activity can be executed either in
periodic or event triggered manner. Alternatively the operator can produce
report in manual manner.
Display Activity: This significant activity supervises all monitoring and
control actions requested by the operator in accordance with data collection.
In case of energy management systems, M. Aamir et al [17] explained that SCADA
based EMS usually deployed in various stages spanned over complete management
and supervision functions on transmission bus bars in the range of 11Kv. However
management and supervision functions are also offered on distribution network which
is below 11kV.
All functions of an energy management system are covered in next section of this
chapter.
2.2 FUNCTIONS OF ENERGY MANAGEMENT SYSTEM
For energy management systems, the supervisor are required to take dispatching
decisions (both short term and long term) to manage the daily operation and interrupt
scheduling in case of unplanned outages. In addition, they must be vigilant, and do
respond to probable emergencies. Several hardware and software features are needed
to function as the support tool for carrier operation [27]. In general words, we can
deal with these features using the classification given below:
• Basic Functions
• Generation Functions
• Network Analysis Functions
• Provision of Operator Training

18
Each function is briefly described in this particular section.
2.2.1 Basic Functions Basic functional requirements of the environmental management system include:
• The ability to monitor the entire power system equipment in real-time data
collection.
• Processing the raw data in the data distribution system and the central control.
Data acquisition function (DAQ) involves data collection from remote terminal units
(RTU) using special hardware based control center in real time from the entire server
all over the system. This occurs in the processing and distribution substation alarm
function by the DAQ. In addition, for protection and operation of the main circuit
breaker, transformer tap, a number of line isolator and other equipment in substation
provide temporal resolution sequence of events.
The DAQ function involves collection of data, management and periodic scanning of
the RTU and rendering the identity of the original analog and digital data to a data
processing function of information gathered from a remote terminal. It also converts
the analog value into engineering units and checks the status of digital point for a
probable change since the previous scan (which can raise the alarm due to change in
state). Calculations can be carried out and operational constraints can target any
continuous time value so that an alarm message can be initiated if a threshold limit is
crossed.
A supervision and management function permits the operator to control all remotely
located circuit breakers on the system together with some line isolators from master
control center. Such control of devices can be executed as single events or a line
circuit can be put into service in or out of service.
2.2.1.1 Alarm Processing
Alarm processing software is responsible for notifying variations in the attributes of
an EMS or computer based control arrangement to the operator. All detected alarms
are classified according to specific criteria and specific priority and then sent to an
appropriate operator.

19
The typical set of predetermined alarm operation may conclude from a single reason.
For illustration, any transmission line in the operation with a fault is automatically
taken out of service by means of automatic circuit breaker and tripping of the
protection relay in the substation. Coverage will be involved in determining protective
relays (tripped) and circuit breakers (opened). If these are defined as an early warning
system, the alarm processor will issue a priority 1 of this alarm with combined logic
circuit correctly tripped to cause a specific power protection. Other than combined
logic, the individual alarm will then be arranged as a lower priority display. If no
reasonable combination is feasible under certain circumstances, all alarms are
transformed separately to the high-priority scheduling (dispatching). Further, the
alarm output can be used as a logical index of a sequence switching process.
Therefore, EMS may read its special protection relays and recovery service which
was operated after transient fault to restore a line. [28, 29].
2.2.1.2 Sequence of Events and Database
All protection relays, trip relays and circuit breakers are termed as chain of actions
having discrete points. This data is gathered and time stamped in order to specify an
accurate decision between points may become achievable within any substation unit
and the whole range of the system. Each sequence of events data buffer until data
collection RTU acquire it automatically or on demand.
The required data is obtained by the system and stored in the historical record using
database function. Then, it can be transformed as a table or graphical trend display to
view. The data is stored in the online system immediately and periodically transmitted
to a standard relational database system. Under normal circumstances, this function
allows the use of all the features of such a database query and reporting.
2.2.1.3 Load Shedding and Safety Management
The load shedding facility makes it possible to identify the specific load blocks and
send commands to operate the appropriate circuit breaker involved in an automatic
manner. Further, the block load can be determined in advance which may be used to
plan load shedding list. Loading amount involved in each block were monitored so as
to be loaded in a specific quantity of a system emergency shed, the operator can enter
the value, and instructs the system to get rid of the corresponding block.

20
Security management provision is a feature of EMS and specific to each utility. A
system can be specified on the label and provides the chart of paper equivalent system
on the screen of operator. The software allows engineers, with open and closed
ground isolation switch on the transmission system in order to specify security
guarantees. Furthermore, symbols may be placed freely applied to the screen based
diagrams. A database system is linked to the diagram system in order to records the
details of plant outages and security documentation. The system will automatically
mark the security file of ground switch or each isolator that are currently listed on the
use of secure documents and records each isolator or ground switch. The above listed
details are directly available at any operating position when the substation chart is
displayed.
2.2.2 Generation Functions The major functions that are relevant with operational scheduling of the generation
subsystem include the following:
• Load forecasting and Unit commitment
• Economic dispatch and automatic generation control (AGC)
• Interchange transaction scheduling and Current Operating Plan
Each of these functions is discussed briefly here.
2.2.2.1 Load Forecasting and Unit Commitment
The total load demand can be decomposed into a base load and control load. It is
satisfied by the tracking generating unit. In some systems, there is a significant
demand from providing storage heater under economic tariffs. The radio tele-
switching can be used in required time to make necessary alterations. This makes the
total demand by changing the shape of the curve to these customers using power tool.
This is done by making the overall cost of electricity as much as compatible with the
economic and environmental goals. Another part of the demand by the uncontrolled
use of electricity is known as a natural demand. This is necessary to be able to predict
both respectively. Historical load data can be used with meteorological data to make
prediction of base demand.

21
The unit commitment function formulates timetable for generation operation, load
management modules and exchange transactions which can be dispatched.
Fig. 2.2: Load Profile with Respect to Codes.
As shown in Fig 2.2, x- axis is time (e.g. 1 week) and y axis is Power in KW. This
simulation is presenting very useful information to operator, like Peak load, Load
shedding or a fault condition in the network.
2.2.2.2 Economic Dispatch and Automatic Gain Control (AGC) Economic Dispatch (ED) function allocates commitment generating unit output in
order to reduce fuel costs while meeting the system limitations like spinning reserve.
It also calculates the recommended economic base point, the entire manual control
unit, as well as the economic basis points which may be directly controlled by the
EMS unit. The software portion related to Automatic Generation Control (AGC) is
responsible for implementing scheduling functions, including regulating the output
power generators, power generation costs and system monitoring reserves. It is
created by the control commands in response to changes in system frequency resulted
in relation to load fluctuations. [30].
2.2.2.3 Interchange Transaction Scheduling and Current Operating Plan This feature allows the operator to define the power transmission scheduling with
neighboring utilities on secured lines. In many cases, the function of such transfer is
to calculate the loading and economic impact.

22
Current Operating Plan (COP) is s typical utility containing set of information which
is part of both the fuel dispatch and generation. [31].
Generation and fuel scheduling functions as a typical and practical part of the energy
management system is a set of information which is termed as the Current Operating
Plan (COP). It contains the latest load forecasting, scheduling, and average hourly
power generation unit for all units with their expected running. The COP is usually
updated every 4-8 hours or it changes as necessary in accordance with the load
forecast, and / or as per availability of generating units.
2.2.3 Network Related Functions Network related applications can be divided into real time operations and study
function. The real time operations are managed by real time sequence control which
permits a specific function or a series of functions to be executed in a periodic manner
or by execution of well defined events manually. The study functions basically used
to duplicate the real time function in order to study any number of conditions
mandatory to execute required actions. The associated functions which can be
performed are:
• Topology Processing Function.
• State Estimation and Network Parameter Adaptation Function.
• Dispatcher Power Flow and Network Sensitivity Function.
• Security Analysis and Security Dispatch Function.
• Voltage Control Function.
• Optimal Power Flow Function.
2.2.3.1 Topology Processing Function Topology processing module is also referred to as model updating. It is used to
establish a network of the current configuration by processing the state of telemetry
switch (circuit breakers and isolators) to identify existing connections in order to
establish a branch node representation of the system.
2.2.3.2 State Estimation and Network Parameter Adaptation Function State estimation function takes all the power system as measured by telemetry of
SCADA to provide precise solutions for the network power flow. Then it is used to

23
determine the probable presence of missing or bad measurements by means of
redundant measurement in its calculations. The output from the state estimator is
given on a line graph (one line diagram) and used as input to other applications like
Optimal Power Flow (OPF).
On the other hand, the Network Parameter Adaptation module generates bus bar
voltage and load forecasting. The forecast is regularly updated in real time. This
makes the state estimator to plan voltages and loads at such bus bars where no
measurements are available.
2.2.3.3 Dispatcher Power Flow and Network Sensitivity Function A dispatcher power flow is used to check the stability of the network status. The
solution provides information on network bus voltage (kV), transmission lines and
transformers flow (MVA) is. Control Center dispatchers use this information to detect
violations of the system (over / under voltage, overloaded branch) following load,
generation, and changes in the system topology.
While in network sensitivity function, the state estimator output is used to determine
the change in the network losses arising sensitivity patterns or tie-line exchange. The
sensitivity parameters are then transformed into the penalty factor for the purpose of
economic dispatch.
2.2.3.4 Security Analysis and Security Dispatch Function The Security Analysis is one of the main applications of real-time being set by
network analysis. It is planned to help out system dispatchers in estimating system
security under particular single contingency and multiple contingency criteria. It helps
operators to study the behavior of the system under the contingent conditions. Each
contingency power flow solution performs security analysis and formulates
recommendations of probable overloads or voltage limit violations. The list of
potential problems features automatically, ranks them in order of their impact, and
possibility of reallocating the generation. It is intended to operate the network closer
to its full capability, and allow proper evaluation of risk during maintenance or
unplanned outages. More details about Contingency Analysis will be presented in
Chapter 03.

24
Security Dispatch Functions allows the operator to rearrange the pattern generated by
the reduction or elimination of overloads. The tool runs on real-time network in its
current state rather than for each contingent condition. This function uses the optimal
power flow and provides a constraint on economic dispatch of generation resources
system offering viable security scheduling.
2.2.3.5 Voltage Control Function The voltage control (VC) function is utilized for elimination or reduction of voltage
violations, MVA overburdens and/or curtailment in transmission line losses by means
of transformer set point controls, generator MVAR, load shedding, capacitor/reactor
switching and transaction MW.
2.2.3.6 Optimal Power Flow Function The main goal of Optimal Power Flow (OPF) is to calculate the recommended set
points for power system control by maintaining tradeoff between safety and economy.
The prime concern is to find a set of system states in the region described by
operational constraints like branch flow and voltage limits. The second task is related
with cost function optimization within region of operation. Typically, the cost
function is defined to include active power with economic dispatch by identifying the
network operating constraints. For OPF, an important limitation is that it does not
optimize the switching configuration.
OPF can be used as an integral part of EMS functions in either preventive or
corrective mode. In the prevention mode, OPF plays an important role by providing
recommendations for improvement for the selected contingent scenarios. These may
be the worst case scenarios determined by either planned outages of contingency
analysis.
In the correction mode, an OPF is executed after major changes in configuration of
the system. This is the scenario where state estimation control of active and reactive
power output indicates serious violations resulting in requirement of rescheduling
both controls by means of OPF.
It is significant to understand that the optimization is only possible, if the network is
controllable, i.e. the control center must have desired control over equipment such as

25
generating units, or tap changing set point. This requirement may offer a challenge to
an EMS that does not contain direct control of all generators. To obtain the reactive
power flow and voltage distribution in an optimal manner, it is mandatory to control
all voltage regulating generators.
The EMS network analysis functions (such as Security Analysis and Dispatcher
Power Flow) are the typical tools for making many decisions such as outage
scheduling. These tools can accurately forecast whether a specific device (such as
transformers, generators or transmission lines) will cause any interruption in the
system irregularities abnormal voltage or branch overloaded terms.
In a typical utility system, outage requirements are filtered on the basis of system
violation indications from both security analysis and dispatcher power flow studies.
The final approval for staff scheduling is granted after reviewing results of both
security analysis and dispatcher power flow.
2.2.4 Provision of Operator Training An energy management system also contains a training simulator that provides
facilities of training of operators under normal operating conditions and simulated
power system emergencies. System reinstatement may also be worked out during
training. It is significant to understand that main power system actions are relatively
infrequent, and generally engage only one shift team out of six. However, real skills
to handle with emergencies develop rather slowly.
The operator interface looks similar to the normal control interface. The Simulator
relies on two models: one in the power system, and the other representing the control
center. Other software is the same as the one which is used in real-time. Scenario
Builder can be used to simulate all kind of emergencies by means of training. The
training instructor controls the scheme and participates as operator within the system.
[32].
2.3 COMPONENTS OF HIGH SCALE SCADA
Different possible arrangements are utilized to enhance High Scale SCADA system
by making it more effective and efficient. It is possible to deploy either complete

26
supervision or management facility on entire system up to level of end user or make a
divide in transmission network and distribution network.
SCADA based EMS usually deployed in various stages spanned over complete
management and supervision functions on transmission bus bars in the range of 11Kv.
However management and supervision functions are also offered on distribution
network which is below 11kV.
Implementation of SCADA system initiates with intensive and steadfast site study of
various substation sites for maximum possible information gathering related to
accessibility of signals type and media type for communication purpose plus state of
installed equipment etc. Implementation can be divided into 03 main subgroups: RTU
adaptation work, deployment of communication network and provision of Master
Control for supervision purpose.
RTUs are deployed with time synchronization having high accuracy of one
microsecond at different positions of selected grid stations to obtain digital and
continuous analog data from grid. These Remote Terminal Units can show and
operate live status of Circuit breakers or isolators by receiving digital data from field
devices wired with relays. On the other hand, transducers are wired with Current
Transformer (CT) and Potential Transformer (PT) for analog data.
2.3.1 RTU Adaptation Work Advanced RTU platform demonstrates high level flexibility and functionality in
operation that may become feasible by using steadfast and resent technologies.
For such platform, the technical prerequisites are being produced by system concept
which is known as ACP (Automation, Control and Protection. It permits automated,
flexible combination of communication tasks and telecontrol. Moreover, an optimal
version of the requisites of the entire process is obtained by addition of scalable
execution with redundant configurations.

27
Fig. 2.3: RTU Parameterization Tool.
RTU is composed of power supply module, process and communication unit, master
control unit and other peripheral modules. It can offer a wide range of choices for
online supervision and analysis as displayed in Fig. 2.3 and 2.4. Advanced RTUs
further offer flexible communication using IEC protocols including IEC 60870-5-
101/103 and IEC 60870-5-104 and it may also use other third party protocols [33, 34].
It is available as open system architecture providing flexible parameterization
toolbox.
Fig. 2.4: Snap Shot of Various Windows of RTU Parameterization Tool.
2.3.2 Telecommunication System All the data fetched by RTUs is then sent to central server mostly by means of
unguided media for supervision and control purpose. However, various
communication techniques can be deployed to transmit this field data to the central
server considering supported protocols. Either wireless or wired media are being used

28
subject to available techniques, geographical surroundings structure of data. It is
considered that Power Line Carriers (PLC) is already widely installed with power
network so it may be used for data communication in general scenario [35]. Power
line communication for Wide Area Operation is depicted in Fig. 2.5.
Fig. 2.5: Power Line Carrier (PLC) Communication.
The power line technique allows broadcast of telecontrol, teleprotection, speech and
data signals with carrier frequency using high voltage overhead power cables
provided that the carrier frequency equipment is compatible with technical features of
the power cable carrying high voltage. The same equipment is expandable by adding
modules like modem or any other teleprotection for applications such as voice, data
and protection signal.
The high frequency bandwidth can be varied between 2 kHz and 8 kHz for each
transmission. It is configured and divided into the sub channels for the services to be
transmitted. The transmission of analog signals is possible between 300Hz to 3840Hz
for which voice frequency modules are utilized.
The following modules are available with power line communication:
• VFM which is Voice Frequency Interface E&M
• VFS which is Voice Frequency Interface FXS
• VFO which is Voice Frequency Interface FXO
PABX systems using either 2 or 4 wires are connected via the Voice Frequency
Interface E&M to the Power line in this configuration. Voice Frequency Interface

29
FXO may be utilized to connect a modem. The 4-wire data interface or integrated
FSK interface is used for transmission of data.
Polling remote terminal equipment, together with the protection signal transmission
remains a core requirement and may use Power Link. This is why the RTU is
provided polling in many different ways. Under normal circumstances, some RTU
systems distributed across multiple substations and control centers connected in a
daisy chain to a centralized (SCADA). The Power Link can be operated in analog
mode or by FSK channel in digital mode by executing data pump for RTU
transmission information. Integrated multiplexer and Station Link feature provides
remote terminal unit-point and multipoint operation.
The substations can be equipped with Synchronous Digital Hierarchy (SDH) [30]
multiplexer using STM-1 interfaces to other substations and E1 interface cards
providing connected to teleprotection equipment and Multiplexer. In this way,
communication can be established using Fiber Optic link rather than power line
communication. Fiber Optic communication for Wide Area Operation is depicted in
Fig. 2.6.
This SDH equipment offers protection for better availability, high reliability and has a
minimum of 21 protected access ports for E1 line supplied with 120 ohms. Each E1
line i.e. 2 Mbps signals are connected to PABX, FMX-9S and teleprotection
equipment.
The FMX-9S is used in duplicate as converter and connector module which is also
protected. There is no duplication of the Operation and Maintenance Management and
Interface GIE Card as its failure does not interrupt the traffic.

30
Fig. 2.6: Fiber Optic communication for Wide Area Operation.
The protection of network traffic is mandatory to establish a highly reliable network.
The SDH Multiplexer provides combination of an access panel for protection
functions and provides opportunity to the carriers to guarantee a good availability
level to their subscribers for all offered services [36, 37]. The Multiplex Section
Protection (MSP) is achieved by replicating the fiber optic cable (1+1) and the STM-1
module. The transmission is carried over two channels which are the main channel
and the backup channel. There is an automated swap to protection connection
according to the norm expressed in ITU-T recommendation G.823 [38]. This
deployed protection approach has a change over time ranged between 15 ms and 50
ms. The normal and faulty operations of multiplex section protection are displayed in
Fig. 2.7 and 2.8.
Fig. 2.7: MSP 1+1 Normal Working.
Fig. 2.8: MSP 1+1 Faulty Working.

31
The Subnet Connection Protection (SNCP) is a fast switching path based fast
protection switching mechanism. In case of such protection, a ring topology used
including the use of ring two aspects: one is the normal path, and the other for backup
path. Monitoring the communications network has been established in a modular
software design principles by sticking to independent functional software modules.
Each module implements a subset of the full product functionality. Network
monitoring software, including its implementation to achieve its core management
functions for operators and key management functions demonstrate functional client
application.
2.4 CONCLUSION
This chapter has outlined basic concepts of high scale SCADA based energy
management by describing functions of energy management system in detail. It also
contains description about components of high scale SCADA system.
Power control using SCADA system provides an efficient and intelligent system
having a variety of control and monitoring functions. Optical fiber communication is
making the system more efficient because it is highly reliable technique as compared
to the other available means of communication. On the other hand, power line
communication can also be achieved using the infrastructure already installed. The
main RTU control equipment is used to obtain and transmit information and
instructions to/from the main control system. The operational benefits such as
prevention of power outages, protection using relevant applications and management
of load shedding can be achieved using High Scale SCADA.

32
CHAPTER 3
MODEL OF OPTIMIZED ENERGY MANAGEMENT SYSTEM
3.1 INTRODUCTION
The main objective of this chapter is to propose a model that helps optimize
development and implementation of renewable energy resources focusing on their
probable advantages to improve both the electricity system and the environment. The
results of this analysis will be helpful in determining the performance issues related to
generation, transmission and green technology. Prime locations inside system may be
identified where adequate renewable generation may efficiently address transmission
crisis.
Supervisory Control and Data Acquisition based controlling and monitoring systems
capitalize on the deployment of the on hand power system by online assessment of the
network towards available capacities of the system. Increasing load demand
simultaneously with an ongoing deregulation of electricity markets in many countries
often leads to the disturbance of transmission systems and their operation very close
to their limits. Power systems are then more sensitive to failures that occur and limits
for a maximal transmission through some corridors of the network are reached. This
emerging congestion is crucial and may be addressed by accumulating few available
green resources to the power grid.
In Pakistan, the energy deficit in terms of supply is being increased, so effective
monitoring and controlling is essential; which may be possible through implementing
smart energy management system using high scale SCADA [39]. It is equally
significant to analyze the system for probable addition of renewable resources. Such
analysis will be helpful to address performance constraints by identifying possible
locations where renewable energy can be easily added to the available capacity. It is
important to mention that the intended addition of renewable resources will be
supervised using powerful monitoring and controlling features of SCADA. Therefore

33
the analysis will also support designing phase of any SCADA system planned for
energy management.
The section 2 introduces concept of contingency condition and section 3 of this
chapter presents detail about the System Design Platforms followed by System
Design Tools discussed in section 4. Development of the framework is discussed in
section 5 by describing various steps in detail along with Optimal Power Flow.
Mathematical model for congestion management is introduced in section 6 where as
the next section proposes Integrated Model of Optimized Energy Management System
followed by Conclusion.
3.2 CONTINGENCY CONDITION
A contingency condition is a failure of any device (line or transformer). Contingency
analysis specifies to the operator what may take place in the system upon occurrence
of unintended equipment outage. The inspiration to implement contingency analysis
tools in an Energy Management System is due to its property of forewarning the
operator to initiate preventive action.
The key intention of power system engineers is to device a reliable operation of power
system. It figures out that the system should survive in case of any failure of device or
equipment and must carry on its normal operation.
The Contingency Analysis tools available within PowerWorld Simulator’s may
examine the system in any statistically likely contingent situation [40]. This feature is
available in addition to the analysis of power system in normal operation topology.
The industry based criterion for normal operation is frequently referred to as the n-1
rule, which imposes a binding that a system is required to operate in a stable and
secure manner even in case of any single transmission or generation outage. This
feature of determining contingency conditions can be implemented in PowerWorld in
addition to the analysis of power system in normal operation topology.

34
Fig. 3.1: Normal Operation Example.
In scenario depicted in Fig. 3.1, each transmission line is operating within allowed
limits thus this is an example of normal operation having no contingency.
Considering Fig. 3.2, suppose there is a fault and the line between bus three and bus
four is disconnected, then this line gets overloaded (is a weak element) and this is a
serious problem for the system.
Fig. 3.2: Example of Weak Element Visualization.
This feature of determining contingency conditions can be implemented in
PowerWorld in addition to the analysis of power system in normal operation
topology. In next section, a frame work is being proposed with prime objective of
100 MW
50 MW
280 MW 187 MW
110 MW 40 Mvar
80 MW 30 Mvar
130 MW 40 Mvar
40 MW 20 Mvar
1.00 pu
1.01 pu
1.04 pu1.04 pu
1.04 pu
0.9930 pu1.05 pu
A
MVA
A
MVA
A
MVA
A
MVA
A
MVAA
MVA
A
MVA
A
MVA
67 MW
67 MW
33 MW 32 MW
57 MW 58 MW
21 MW
21 MW
66 MW 65 MW
11 MW
11 MW
23 MW
42 MW
43 MW 28 MW 29 MW
23 MW
23 MW
150 MW
200 MW 0 Mvar
200 MW 0 Mvar
A
MVA
29 MW 28 MW
OneThree
Four
Two
Five
Six Seven
23 MW
87%
A
MV A
82%
A
MV A
1 0 0 M W
5 0 M W
2 8 0 M W 1 8 8 M W
1 1 0 M W 4 0 M v a r
8 0 M W 3 0 M v a r
1 3 0 M W 4 0 M v a r
4 0 M W 2 0 M v a r
1 .0 0 p u
1 .0 1 p u
1 .0 4 p u1 .0 4 p u
1 .0 4 p u
0 .9 6 7 5 p u1 .0 5 p u
A
M V A
A
M V A
A
M V A
A
M V A
A
M V A
A
M V A 4 5 M W
4 5 M W
5 5 M W 5 3 M W
0 M W 0 M W
5 8 M W
5 6 M W
5 2 M W 5 1 M W
2 6 M W
2 5 M W
4 3 M W
3 6 M W
3 7 M W 2 4 M W 2 5 M W
3 0 M W
3 0 M W
1 5 0 M W
2 0 0 M W 0 M v a r
2 0 0 M W 0 M v a r
A
M V A
2 5 M W 2 4 M W
O n eT h re e
F o u r
T w o
F iv e
S ix S e v e n
4 4 M W
8 3 %
A
M V A
8 3 %
A
M V A
9 5 %
A
M V A
1 5 6 %
A
M V A

35
optimization by adding renewable energy sources at suitable location determined by
software visualization.
3.3 SYSTEM DESIGN PLATFORM
This research involves impact analysis to determine performance of an energy deficit
system which can be optimized by accumulating renewable energy. An optimized
framework can be developed using various tools available with “Power World” which
is power system visualization, simulation, and analysis tool [41].Various types of
analyses can be performed using “PowerWorld”. However, Power Flow simulation,
Contingency analysis, weak element visualization and Transmission Loading Relief
(TLR) Sensitivity for both normal and congestion situations are of high interest.
It is imperative to mention that necessary equations to calculate above mentioned
parameters like Transmission Loading Relief (TLR) Sensitivity for both normal and
congestion situations are already embedded in the “PowerWorld”. TLR sensitivities
are used to estimate the sensitivity of a single monitored element to many different
power transfers. [42].
It is also pointed out above mentioned various analyses are really helpful in designing
energy grids due to stand alone capability of “PowerWorld” for power flow analysis.
3.4 SYSTEM DESIGN TOOLS
A large number of tools are available in PowerWorld Software for different analyses.
However, major contribution is made by TLR sensitivities and Contingency Analysis
for development of proposed framework.
3.4.1 Transmission Loading Relief (TLR) TLR is an effective tool which is used to prevent overload situations by managing
transmission utilization. It is very useful to reduce the risk of system failure. For
instance, if a transmission line is loaded beyond its thermal limit then a TLR plan will
be initialized forcing that all transactions on the overloaded element be curtailed thus
keeping the exchanged power flow within designated thermal limit. The TLR
sensitivity evaluation in “Power World” is useful indication of those transactions that
would be condensed. TLR can be represented by the following expression:

36
iBus
jkBRANCHjkBRANCHiBUS nMWInjectio
MWFlowTLR
∆∆
=, (3.1)
This equation (3.1) is already integrated with “Power World” as very useful tool for
calculating TLR for each bus.
Fig. 3.3: Calculation of TLR Sensitivities Using PowerWorld.
It can be observed from the Fig.3.3, that sensitivities are calculated for each bus.
Therefore in view of the fact that a TLR is considered for every bus, the TLR may be
used to grade locations. Good or weak location may be identified by analyzing TLR.
Reference to analyze Contingencies, Contingency Transmission Loading Relief
(TLR) Sensitivity is the change in the flow of a line due to an injection at a bus
assuming a contingency condition.
It can be expressed by the following equation:
iBusCONTcjkBRANCHiBUS nMWInjectio
CONTcjkBRANCHContMWFlowTLR
∆∆= ,
,, (3.2)
The Equivalent Transmission Loading Relief (ETLR) of selected Transmission Lines
of Transformers is the algebraic sum of the TLRs of each individual element either
with or without contingency and described by equations (3.1) and (3.2). It can be
expressed by the equation (3.3). The ETLR provides a measure of the simultaneous
MW change in multiple elements, and thus the overall effect in flows on the element
of the set.

37
(3.3)
While the Weighted Transmission Loading Relief (WTLR) is used to weight the
current MW flow in a particular element [43].
3.5 DEVELOPMENT OF PROPOSED FRAMEWORK
As described in the previous section, different tools available in PowerWorld
Simulator are being used to design the desired structure. The steps of the proposed
framework are depicted in Fig. 3.4.
Fig. 3.4: Flow Diagram Representing Proposed Framework.
This framework helps in the process of integration of renewable energy resources
with existing grid capacity and transmission policy can be optimized considering
results of analyses for various locations.
3.5.1 Power Flow Model It refers to the identification of weak elements in the power scheme by simulating
impacts from loss of capacity or transmission. More significantly, potential locations
in system can be easily identified where injection of renewable generation can provide
, ,
Overloaded Contingencies that Elements overloaded branch
,
Contingent Violations
ETLR = TLR
TLR
BUS BUS BRANCH CONT
BUS CONTVIOL
i i jk c
jkjk
i v
v
∈
∈
=
∑ ∑
∑

38
grid reliability [44]. A real scenario is considered for step-wise development of
framework. This real case information is presented in Fig.3.5
Fig. 3.5: Real scenario of Power Flow Analysis.
3.5.2 Contingency Analysis The Contingency Analysis has been implemented to achieve the following goals:
• Determine performance characteristics for generation, transmission and
renewable technology
• Identify locations within system where sufficient renewable generation can
effectively address transmission problems
• The following terms are related with contingency analysis:
• Base Case: The power system in its regular stable condition, functioning with
all essential elements in operation that are likely to be in service.
• Primary Contingency: A failure of one or more system components (line or
transformer) that takes place first. A Primary Contingency can either be
planned or unplanned occurrence.
• Secondary Contingency: A contingency that takes place after the occurrence
of Primary Contingency not necessarily caused by the primary contingency.
This is generally an unintended event.
• System Adjustments: A set of remedial procedures performed automatically
by a control system or by a system operator manually to relieve the effects of a
contingency or improve the system to survive in case of a possible future
contingency.
• N-1-1 Contingency: A series of actions comprised of the initial failure of a
single generator or transmission component (Primary Contingency). It is then

39
followed by system adjustments, followed by another loss of a single
generator or transmission component (Secondary Contingency).
• Model Criteria: An assessment of system conditions in Simulator that if met,
would cause a conditional system adjustment to occur.
3.5.2.1 N-1-1 Contingency Analysis Overview An overview of a suggested analysis process is shown in Figure 3.6. Contingency
analysis can be used to model the complete process shown in Figure 3.6. To conduct
N-1 analysis (orange sub-process), it is sufficient to define all the primary
contingencies in the instrument for contingency analysis of the simulator and run.
System adjustments can be included as actions to be taken in case of contingency.

40
Fig. 3.6: N-1-1 Contingency Analysis Overview.
In congestion scenario, the weak elements tend to get overloaded causing system
failure. Transmission planning can be prioritized by proper ranking of equipment
being used. Single element or multiple element contingencies can be defined in
PowerWorld Simulator. Only one contingent action is associated with single element
contingency. A seven bus power system is depicted in Fig.3.7 for which contingency
analysis is processed.

The contingency analysis for the above mentioned scenario is resulted in detecti
three Violations and zero Unsolvable Contingencies which can be seen violation
column in Table. 3.1. In this way, potential weak elements can be determined and
renewable generation may be injected in case of congestion. This phase is considered
as a
3.5.3These calculations are used to determine the sensitivity of the MW flow of
device with respect to a change of real power through each bus. It is assumed that the
power is introduced at each bus and absorbed at the transactor object while transactor
type is consumer/buyer. When the transactor type is supplier/seller, then
that the power is injected at each transactor object and absorbed at each bus. For the
sample case, the sensitivities calculated by the simulator are depicted in Table 3.2
taken transactor type as buyer.
The contingency analysis for the above mentioned scenario is resulted in detecti
three Violations and zero Unsolvable Contingencies which can be seen violation
column in Table. 3.1. In this way, potential weak elements can be determined and
renewable generation may be injected in case of congestion. This phase is considered
as a major contributor of the proposed framework.
3.5.3 These calculations are used to determine the sensitivity of the MW flow of
device with respect to a change of real power through each bus. It is assumed that the
power is introduced at each bus and absorbed at the transactor object while transactor
type is consumer/buyer. When the transactor type is supplier/seller, then
that the power is injected at each transactor object and absorbed at each bus. For the
sample case, the sensitivities calculated by the simulator are depicted in Table 3.2
taken transactor type as buyer.
The contingency analysis for the above mentioned scenario is resulted in detecti
three Violations and zero Unsolvable Contingencies which can be seen violation
column in Table. 3.1. In this way, potential weak elements can be determined and
renewable generation may be injected in case of congestion. This phase is considered
major contributor of the proposed framework.
Calculation of TLR Sensitivities These calculations are used to determine the sensitivity of the MW flow of
device with respect to a change of real power through each bus. It is assumed that the
power is introduced at each bus and absorbed at the transactor object while transactor
type is consumer/buyer. When the transactor type is supplier/seller, then
that the power is injected at each transactor object and absorbed at each bus. For the
sample case, the sensitivities calculated by the simulator are depicted in Table 3.2
taken transactor type as buyer.
Fig.
The contingency analysis for the above mentioned scenario is resulted in detecti
three Violations and zero Unsolvable Contingencies which can be seen violation
column in Table. 3.1. In this way, potential weak elements can be determined and
renewable generation may be injected in case of congestion. This phase is considered
major contributor of the proposed framework.
Table
Calculation of TLR Sensitivities These calculations are used to determine the sensitivity of the MW flow of
device with respect to a change of real power through each bus. It is assumed that the
power is introduced at each bus and absorbed at the transactor object while transactor
type is consumer/buyer. When the transactor type is supplier/seller, then
that the power is injected at each transactor object and absorbed at each bus. For the
sample case, the sensitivities calculated by the simulator are depicted in Table 3.2
taken transactor type as buyer.
Fig. 3
The contingency analysis for the above mentioned scenario is resulted in detecti
three Violations and zero Unsolvable Contingencies which can be seen violation
column in Table. 3.1. In this way, potential weak elements can be determined and
renewable generation may be injected in case of congestion. This phase is considered
major contributor of the proposed framework.
Table
Calculation of TLR Sensitivities These calculations are used to determine the sensitivity of the MW flow of
device with respect to a change of real power through each bus. It is assumed that the
power is introduced at each bus and absorbed at the transactor object while transactor
type is consumer/buyer. When the transactor type is supplier/seller, then
that the power is injected at each transactor object and absorbed at each bus. For the
sample case, the sensitivities calculated by the simulator are depicted in Table 3.2
taken transactor type as buyer.
3.7: Cross Section View of a Power System with 05 Buses.
The contingency analysis for the above mentioned scenario is resulted in detecti
three Violations and zero Unsolvable Contingencies which can be seen violation
column in Table. 3.1. In this way, potential weak elements can be determined and
renewable generation may be injected in case of congestion. This phase is considered
major contributor of the proposed framework.
Table 3
Calculation of TLR Sensitivities These calculations are used to determine the sensitivity of the MW flow of
device with respect to a change of real power through each bus. It is assumed that the
power is introduced at each bus and absorbed at the transactor object while transactor
type is consumer/buyer. When the transactor type is supplier/seller, then
that the power is injected at each transactor object and absorbed at each bus. For the
sample case, the sensitivities calculated by the simulator are depicted in Table 3.2
taken transactor type as buyer.
: Cross Section View of a Power System with 05 Buses.
The contingency analysis for the above mentioned scenario is resulted in detecti
three Violations and zero Unsolvable Contingencies which can be seen violation
column in Table. 3.1. In this way, potential weak elements can be determined and
renewable generation may be injected in case of congestion. This phase is considered
major contributor of the proposed framework.
3.1: Contingency Analysis Showing Three Violations.
Calculation of TLR Sensitivities These calculations are used to determine the sensitivity of the MW flow of
device with respect to a change of real power through each bus. It is assumed that the
power is introduced at each bus and absorbed at the transactor object while transactor
type is consumer/buyer. When the transactor type is supplier/seller, then
that the power is injected at each transactor object and absorbed at each bus. For the
sample case, the sensitivities calculated by the simulator are depicted in Table 3.2
taken transactor type as buyer.
: Cross Section View of a Power System with 05 Buses.
The contingency analysis for the above mentioned scenario is resulted in detecti
three Violations and zero Unsolvable Contingencies which can be seen violation
column in Table. 3.1. In this way, potential weak elements can be determined and
renewable generation may be injected in case of congestion. This phase is considered
major contributor of the proposed framework.
: Contingency Analysis Showing Three Violations.
Calculation of TLR Sensitivities These calculations are used to determine the sensitivity of the MW flow of
device with respect to a change of real power through each bus. It is assumed that the
power is introduced at each bus and absorbed at the transactor object while transactor
type is consumer/buyer. When the transactor type is supplier/seller, then
that the power is injected at each transactor object and absorbed at each bus. For the
sample case, the sensitivities calculated by the simulator are depicted in Table 3.2
: Cross Section View of a Power System with 05 Buses.
The contingency analysis for the above mentioned scenario is resulted in detecti
three Violations and zero Unsolvable Contingencies which can be seen violation
column in Table. 3.1. In this way, potential weak elements can be determined and
renewable generation may be injected in case of congestion. This phase is considered
major contributor of the proposed framework.
: Contingency Analysis Showing Three Violations.
These calculations are used to determine the sensitivity of the MW flow of
device with respect to a change of real power through each bus. It is assumed that the
power is introduced at each bus and absorbed at the transactor object while transactor
type is consumer/buyer. When the transactor type is supplier/seller, then
that the power is injected at each transactor object and absorbed at each bus. For the
sample case, the sensitivities calculated by the simulator are depicted in Table 3.2
: Cross Section View of a Power System with 05 Buses.
The contingency analysis for the above mentioned scenario is resulted in detecti
three Violations and zero Unsolvable Contingencies which can be seen violation
column in Table. 3.1. In this way, potential weak elements can be determined and
renewable generation may be injected in case of congestion. This phase is considered
: Contingency Analysis Showing Three Violations.
These calculations are used to determine the sensitivity of the MW flow of
device with respect to a change of real power through each bus. It is assumed that the
power is introduced at each bus and absorbed at the transactor object while transactor
type is consumer/buyer. When the transactor type is supplier/seller, then it is assumed
that the power is injected at each transactor object and absorbed at each bus. For the
sample case, the sensitivities calculated by the simulator are depicted in Table 3.2
: Cross Section View of a Power System with 05 Buses.
The contingency analysis for the above mentioned scenario is resulted in detecti
three Violations and zero Unsolvable Contingencies which can be seen violation
column in Table. 3.1. In this way, potential weak elements can be determined and
renewable generation may be injected in case of congestion. This phase is considered
These calculations are used to determine the sensitivity of the MW flow of selected
device with respect to a change of real power through each bus. It is assumed that the
power is introduced at each bus and absorbed at the transactor object while transactor
it is assumed
that the power is injected at each transactor object and absorbed at each bus. For the
sample case, the sensitivities calculated by the simulator are depicted in Table 3.2
The contingency analysis for the above mentioned scenario is resulted in detection of
three Violations and zero Unsolvable Contingencies which can be seen violation
column in Table. 3.1. In this way, potential weak elements can be determined and
renewable generation may be injected in case of congestion. This phase is considered
selected
device with respect to a change of real power through each bus. It is assumed that the
power is introduced at each bus and absorbed at the transactor object while transactor
it is assumed
that the power is injected at each transactor object and absorbed at each bus. For the
sample case, the sensitivities calculated by the simulator are depicted in Table 3.2
41
on of
three Violations and zero Unsolvable Contingencies which can be seen violation
column in Table. 3.1. In this way, potential weak elements can be determined and
renewable generation may be injected in case of congestion. This phase is considered
selected
device with respect to a change of real power through each bus. It is assumed that the
power is introduced at each bus and absorbed at the transactor object while transactor
it is assumed
that the power is injected at each transactor object and absorbed at each bus. For the
sample case, the sensitivities calculated by the simulator are depicted in Table 3.2

42
Table 3.2: A Sample TLR Calculation Using PowerWorld.
3.5.4 Determination of Good Locations Generation can be positioned to alleviate weak element contingency overloads. The
Collective MVA Overload and a related field, the Aggregate Percent Overload of a
transmission line or transformer are measures of the weakness of transmission line on
the grid.
Table 3.3: Ranking of Violated Elements on the Basis of Aggregated Percent Overload.
This measure can be displayed in case information menu of simulator and counter
flow can be produced to mitigate weak element. It will result in identification of good
location after proper mitigation.
It can be observed from last column of Table3.3 that the ranking of elements with
violation is possible. In above scenario, the line from 11 to 33 has more aggregate
percent overload so priority must be given to this line while injecting renewable
energy at overloaded elements.
3.5.5 Generation Scheme As discussed in section 3.4.1, the Weighted Transmission Loading Relief (WTLR) is
used to weight the current MW flow in a particular element. A WTLR of 5.0 at an
element (bus) suggests that 10MW of new generation inserted at this particular bus is

43
expected to decrease 5.0 MW of overload in transmission elements during
contingencies. Thus, if we insert some potential renewable energy resources at high
impact buses, re-dispatch the system, and rerun the contingencies, the overloads will
decrease. Therefore, the generation policy can be optimized by analyzing the system
in accordance with the proposed frame work.
As described earlier in section 3.5.2, the Contingency Analysis has been implemented
to determine performance characteristics for generation, transmission and renewable
technology. Moreover, locations within system can be identified where sufficient
renewable generation can effectively address transmission problems.
These above mentioned goals may be augmented by applying OPF to formulate
system adjustments which is being described in next section.
3.5.6 Optimal Power Flow The OPF tool has been used to execute contingency analysis which helps in
determining effective system corrections to take place in either the base case followed
by a Primary Contingency or any of the Secondary Contingencies. In the standard
mode, the simulator is implementing Newton - Raphson flow algorithm to solve
power flow equations. However, the simulator OPF is capable to solve these
equations using linear programming (LP) for implementation of Optimal Power Flow
[45].
Currently two main functionalities are available in Simulator Optimal Power Flow
that is Minimum Cost and Minimum Control Change.
• Minimum Cost function attempts to minimize the sum of the total generation
costs in specified areas.
• Minimum Control Change attempts to minimize the alteration in the
generation in the particular areas.
3.6 MATHEMATICAL MODEL FOR CONGESTION MANAGEMENT
The power flow Pjk through the transmission line j – k is a function of voltage
magnitudes Vj, Vk and the line reactance Xjk. This power flow is also dependent upon

44
the phase angle between the sending and receiving end voltages denoted by δj, δk as
described in equation 3.4.
)( kjjk
kjjk X
VVP δδ −= sin
(3.4)
It is evident from numerator of equation (4) that power flow can be affected by either
varying voltage magnitudes or the power angle. It can also be affected by changing
reactance of the transmission line [46].
The reactance of the line can be reduced through series compensation while voltage
magnitudes can be varied with support of VAR. The power angle can be changed by
varying injection at either bus, e.g. generation or load changes.
Each bus k is categorized into one of the following three bus types:
PQ buses - here, the real power |P| and reactive power |Q| are specified. It is also
known as Load Bus.
PV buses - here, the real power |P| and the voltage magnitude |V| are specified. It is
also known as Generator Bus.
Slack bus - to balance the active and reactive power in the system. It is also known as
the Reference Bus or the Swing Bus.
Fig. 3.8: Example of Injection for Congestion Management.

45
Reference to fig: 3.8, consider injection process at Bus “k” where Active and Reactive
Power produced by Generators and Renewable Generators. Also load at bus “k”
consumes amount of power to be deducted from injection part.
So Active Power and Reactive Power at Bus k are given by equations:
Pk = PkG + Pk
W - PkL (3.5)
Qk = QkG + Qk
W - QkL (3.6)
In this particular work, either power angle or voltage magnitude may be used for
congestion management. As an example, containment using TLR sensitivities may be
implemented by which all transactions on the overloaded element can be curtailed
thus keeping the exchanged power flow within designated thermal limit [47].
The next section will describe proposed integrated model of Optimized Energy
Management System.
3.7 PROPOSED INTEGRATED MODEL OF OPTIMIZED EMS
Since Supervisory Control and Data Acquisition (SCADA) is the essential part of
power system operation in smart cities. An integrated framework has been proposed
which is capable of providing a simulation platform for detailed study of power
system to overcome issues like susceptibility of failure, critical situations and
restoration scheme by adding renewable energy resources. The Automation Server
“SIMAUTO” of Powerworld simulator is quite capable of integrating Powerworld
with other external simulators like MATLAB. The Simulator Automation Server can
be used to extend the functionality of Powerworld Simulator to any customized
external program. It can be used to launch and control Powerworld Simulator from a
different application, thus allow accessing the data of any Simulator case, to perform
specific Simulator functions and more manipulations of data. Finally it may send
results back the original application like MATLAB or Excel spreadsheet. This
integration will result in a simulation platform useful for analyzing power system
operations in smart cities [48]. In general, the SNMP (Simple Network Management
Protocol) based RTUs (Remote Terminal Units) are essential part of SCADA system
[49]. The proposed framework is presented in figure 3.9, which utilizes MATLAB as
an external program. The SIMAUTO works as COM (Component Object Model)

46
object which can be retrieved through many Windows based programming languages
therefore making the platform very flexible and accessible.
Fig. 3.9: Powerworld Optimal Model Integration with External Program Using SIMAUTO (Automation Server).
The proposed framework addresses accomplishment of following objectives:
a) An emergent fault in the grid can be projected before its occurrence and
sustainability of the power system will be improved. This improvement is
mandatory in case of smart grid operation and it is achieved by implementing
congestion relief option based on TLR sensitivity method. Other options
include VAR support and Economic Load Management.
b) Restoration schemes may be determined in advance by improving operational
algorithms without disrupting the critical infrastructure of power system
operation again based on TLR sensitivity method. Other options include VAR
support and Economic Load Management.
It should be noted that the proposed model will have mathematical and SNMP based
implementation of the devices in consumers’ premises, ICT technologies, market
trends and Electricity providers. Adequate detail of power flow equations is already
discussed in section 3.6.
Optimal algorithms for power system operational can be developed after its careful
analysis using proposed framework. An illustration of this integrated framework is
also described in figure 3.10.

47
Fig. 3.10: Illustration of Integration of Power world Simulator with External Program using SIMAUTO.
The workflow described in fig: 3.9 and 3.10 have been implemented using MATLAB
interface tool which provides access to the Powerworld functionality via SimAuto.
For validation of proposed Integrated Model of Optimized EMS, the summary of load
published the Pakistan Electric Power Company (PEPCO) for the year 2012-13 was
considered. The data involves load, losses and system demand. The sustainability of the
power system will be improved by implementing congestion relief option based on
TLR sensitivity method. Table 3.4 shows significant reduction in transmission,
distribution and other losses for selected data log.
Table 3.4: Validation of proposed optimized EMS algorithm
Year
Description
Summary of load for the 2012-13 without Integrated Model of Optimized EMS
Summary of load for the 2012-13 with Integrated Model of Optimized EMS
Improvement in Percentage
Load 19225 19225 -------
Transmission
Losses
1105 851 23%
Distribution Losses 2642 2166 18%
Auxiliary Losses 834 713 14.5%
Total Losses 4581 3730 18.57%
System Demand 23805 23805 -------

48
It was validated from table 3.4 that the proposed algorithm works well and resulted in
significant reduction of losses thus improving sustainability of the power system.
An important scenario is determination of Locational Marginal Price (LMP) which is
a mechanism for using market-based prices for managing transmission congestion.
[50]
LMPs are determined from the result of a security constrained least-cost dispatch also
known as security constrained optimal power flow. However optimal power flow
without security constrained or just power flow without optimization may also be
used depending upon the situation.
The outcome of this section is the comparative analysis of three congestion relief
methods using the IEEE 24 bus single area reliability rest scenario. It was determined
that VAR support serves the maximum load but it is more expensive than other
options. On the other hand, the Economic Load Management serves minimum load
but it is more cost effective than TLR sensitivity which is simple to implement as it
didn’t include choices of customers and offers more load as compared to Economic
Load Management.
3.8 CONCLUSION
The proposed model is capable of analyzing emerging trends in power system
operation to make it more reliable. It is used to make comparative analysis of three
congestion relief methods using the IEEE 24 bus single area reliability rest scenario. It
can also be used to develop operational algorithms to optimize the generation,
transmission and distribution schemes and taking advantage of smart infrastructure in
a more effective manner. The calculation of LMPs is mandatory as prices vary by
location in case of congestion. It will result in more economic dispatch of electricity
as most of the contingent conditions will be resolved in proactive manner. The
availability of smart meters will allow multiple tariff plans and load can be managed
more easily according to the demand. It will result in environmental friendly
generation scheme and it can also be enhanced by considering green ICT to make it
more cost effective and more environmental friendly.

49
CHPATER 4
2 OPTIMAL DESIGN OF REMOTE TERMINAL UNIT (RTU)
4.1 INTRODUCTION
The main purpose of this investigation is to suggest a design outline taking major
parameters into account that supports low cost and optimized development and
implementation of a Remote Terminal Unit (RTU) with provision of wireless
connectivity. In addition to an optimal RTU design, the method of comparative
research is executed on the wireless link so that communication may also take place in
optimized manner. This phase includes the RF spectrum considering various options
to work out best solution after detailed comparison. The outcome of this research
section focuses to optimize the design of wireless link for the planned RTU. A
situation representing multiple RTUs communicating with one Tele-Control Interface
(TCI) is developed to address optimized implementation of wireless SCADA. It is
further verified by means of benchmarking.
A well-organized SCADA system is necessary to manage and supervise physically
spread electrical power system in countries having energy short fall [51]. In such
countries, it is compulsory to operate electrical power system very close to their
highest threshold value resulting in more probability of failures because of ever
increasing trend of load. The SCADA system has now become very intelligent and
speedy to outweigh majority of the issues associated with electrical energy like
handling of power outages, instability and network performance [52]. The functions
of the SCADA are intelligent enough to manage all major problems and offer more
opportunities to improve network performance of distributed at operator level.
SCADA system not only presents basic monitoring function, but it is capable of
executing various applications in parallel to resolve the energy management problems
by means of additional functionality.
SCADA systems comprise one or more Field Data Interface (FDI) devices that are
generally designated as Remote Terminal Units (RTUs), to connect field sensing

50
devices; means of telemetry in the form of a communications system (utilized to relay
data between RTUs and control units designated as Tele-Control Interface (TCI)
[52]); a central host computer server or group of servers, sometimes referred as a
master station, SCADA Center or Master Terminal Unit (MTU); a set of software
packages, sometimes termed as Human Machine Interface (HMI) software installed to
support the MTU and operator terminal application, the telemetry system, and manage
and supervise remotely located Field Data Interface (FDI) devices.
As SCADA systems are extensively coupled with energy management solutions
therefore a low cost optimal design of an RTU is highly desirable predominantly in
countries having energy shortfall.
The section 2 of this chapter introduces general structural design of RTUs followed
by RTU Design using FPGA Development kit in section 3. The section 4 includes
comparative assessment of performance of both methodologies of RTU design.
Optimization of Reliability comparison is described in section 5 while optimization of
RF link to implement wireless SCADA is described in section 6. The last section
describes conclusion by presenting importance of the low cost RTU Design along
with optimization of wireless link.
4.2 STRUCTURAL DESIGN OF RTU
Remote Terminal Units (RTUs) are employed as remote field data interface
appliances. However, this type of appliance may include a Programmable Logic
Controller [53, 54] to function as traditional classification of automated programming.
Similar to a PLC, the RTU operates at the desired remote location as a major
appliance of a SCADA system implemented for either equipment monitoring or
control. In contrast to PLCs, additional hardware features such as power supply,
master control element, process and communication elements, peripheral elements
diagnostic displays and support for battery backup make it more powerful than PLCs.
A generalized structural design of an RTU is depicted in Fig.4.1.

51
Fig. 4.1: Structural Design of a Remote Terminal Unit (RTU).
Reference to Fig.4.1, a generalized structure of an RTU includes Digital and Analog
Input modules, Digital output modules and a communication Interface module. The
basic functionality of an RTU can be implemented using above mentioned modules.
These modules are used as reference for intended design approaches of implementing
RTUs using FPGAs [55] and PLCs. Field sensors can be interfaced with Input
modules depending upon their type whereas Actuators can be operated by interfacing
them with Digital Output Module.
The Communication Interface Module is capable of sending data from the RTU to the
SCADA centre utilizing several means of telemetry. However, this paper is focused
on RTU for wireless SCADA so a wireless link can be seen in Fig.4.1.
A digital input also known as a discrete input, is an input that is either in a HIGH or
LOW condition. The LOW condition means a logic 1 or ON. The HIGH condition

52
means a logic 0 or OFF. Examples are: Pushbuttons, Limit Switches, and Proximity
Switches.
A digital output is an output that is either in an ON or OFF condition. Digital output
can also be regarded as a discrete output. Examples are: Solenoids, contactor coils,
and lamps.
An analog input is an input signal that has a continuous signal. Examples are:
Temperature Sensor, Level Sensor.
An analog output is an output signal that has a continuous signal. Examples are:
Analog Meters to display speed, weight etc. In basic configuration of an RTU, analog
output is generally not implemented and most of the actuators are handled by means
of digital output modules.
As shown from Fig. 4.2, the Communication Interface Module is composed of two
main sections namely the transmitter and the receiver. However each section has
various blocks as described by means of Fig. 4.2. Time Division Multiple Access
(TDMA) technique is used to develop communication at the receiver section. Level
conversion is also mandatory at each section. Moreover, different stages of filters and
amplifiers are implemented for desired signal conditioning.
Fig. 4.2: Block Diagram representing each section of Communication Interface Module.
Interface from Embedded
Groups
Level Converter
RS-232 to TTLIF Amplifier
Modulator & Encoder
FilterPower
Amplifier
Synthesizer
Level Converter TTL
to RS-232Filter Demodulator
& DecoderIF Amplifier TDMA
Multiple Aircraft Data
PLL Based
2 – 2.5GHz
BPF or LPFFSK or BPSKClass A or Class B
Type Amplifier
From Embedded
System or RTU
TRANSMITTER
SECTION
Class A or Class B
Type Amplifier
BPF or LPF
To Embedded
System
RECEIVER
SECTION
Class C Type Amplifier
Antenna

53
In the next section, the implementation of this structural design of an RTU using
FPGA is being discussed.
4.3 RTU DESIGN USING FPGA DEVELOPMENT KIT
A basic design of an RTU is already elaborated in the previous section. The same or
more powerful RTU in terms of features is being designed using an FPGA. The
designed RTU can be used in wireless SCADA for an energy management
application.
The hardware implementation and verification of this RTU design has been done
using a development kit based on XILINX Spartan-3 Series FPGA [56] with 500000
logic gates. A pictorial view of 16 channels Digital Input, 8 channels Analog Input &
8 channels Relay Output RTU Board is shown in Fig.4.3. This conceptual view is
based on digital logic which is further implemented using the power FPGA
development kit.
Fig. 4.3: A Pictorial view of 16 channels Digital Input, 8 channels Analog Input & 8 channels Relay Output RTU Board (Digital Logic outlined in Red
implemented using FPGA).
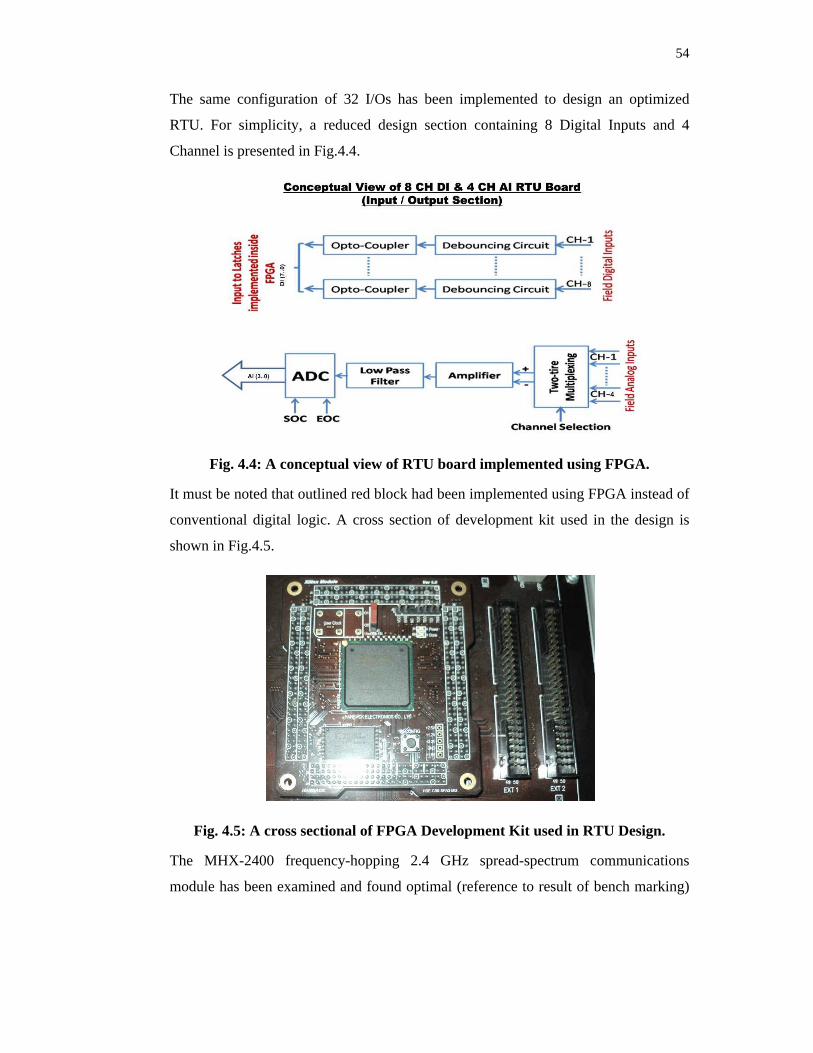
54
The same configuration of 32 I/Os has been implemented to design an optimized
RTU. For simplicity, a reduced design section containing 8 Digital Inputs and 4
Channel is presented in Fig.4.4.
Fig. 4.4: A conceptual view of RTU board implemented using FPGA.
It must be noted that outlined red block had been implemented using FPGA instead of
conventional digital logic. A cross section of development kit used in the design is
shown in Fig.4.5.
Fig. 4.5: A cross sectional of FPGA Development Kit used in RTU Design.
The MHX-2400 frequency-hopping 2.4 GHz spread-spectrum communications
module has been examined and found optimal (reference to result of bench marking)

55
as Communication Interface Module for this particular RTU focusing on Energy
Management System. It provides Multi-master and remote diagnostic modes which
are highly desirable for deployment of SCADA.
MHX-2400 module uses a subset of standard AT style commands, very similar to
those used by traditional telephone line modems.
The FPGA based design has significant advantages over conventional or PLC based
RTUs which will be discussed in the next section.
4.4 PERFORMANCE COMPARISON
A comparative study between features of PLCs based RTUs and FPGA based RTUs
was carried out which clearly shows that PLCs provide semi optimal solution to
complex SCADA systems where as solutions provided by FPGA based RTUs are
more attractive and desired by modern SCADA systems
4.4.1 Performance Issues of PLC based RTU PLCs were originally designed to replace relay logic [57, 58]. PLCs acquire digital
and/or analog data through input modules, and execute a loop of control program by
scanning the inputs and taking actions based on these inputs. A block diagram of
basic PLC operation is shown in Fig.4.6.
Fig. 4.6: Basic PLC Operation.
CPUCENTRAL
PROCESSING UNIT
Input Module
Output Module
Sensor-1
Sensor-2
Actuator-1
Actuator-2
Programming Device
RUN Actuator 1
Fault RUN Actuator 2
TI ST UY
Operator Interface

56
PLCs can give optimal performance when used in implementation of cyclic
processing based control applications with requirement of high discrete I/O data
counts. However, PLCs suffer from excessively complex design resulting in restricted
CPU performance, insufficient communication capability, and deficiency in terms of
scalability while adding future requirements other than just number of I/O.
In general, PLCs are not able to fulfill the following three current trend of modern
Industry:
• System level intelligence and very high performance are required in modern
day Industry for optimized RTU functions but even very high grade PLCs cannot
fulfill all needs.
• Most of the scenarios require exclusive communication mediums from dial-up
phone lines to broadband wired/wireless IP (mainly not fulfilled by PLCs).
• Lack of configurability and higher maintenance costs compared to fully
integrated units is another critical factor.
The features of FPGA based reconfigurable RTUs are being discussed in upcoming
sections, then a comparative study to evaluate performance and reliability both
designs is presented.
4.4.2 Features of FPGA based RTU
In contrast to the PLC based RTUs, the features of FPGA based RTU are more
attractive and provide a powerful platform to implement energy management related
scenarios [59]. The main hardware specifications of the designed RTU are listed
below:
• The FPGA based design provides flexibility in terms of I/Os, CPU and radio
related configurations. It resulted in focused performance and expansion can be
accommodated quickly if needed.
• More intelligence is added to the power management aspect resulting in
optimized alarm.

57
• The industrial temperature range of Spartan-3 FPGA is -40°C to 100°C which
is wide to withstand in harsh environment. The same temperature may be offered by a
high end performance PLC but it will have much higher cost as compared to any CPU
of Siemens S7-200 family selected here to make this comparison.
• It also supports third generation (Networked Approach) SCADA.
The following table shows performance comparison of PLC based RTU versus FPGA
based RTU. CPU226 of S7-200 PLC family is chosen to make comparison with
Spartan-3 FPGA.
Table 4.1: Performance comparison of PLC based RTU versus FPGA based RTU
Features FPGA based RTU PLC based RTU Temperature Range -40°C to +100°C -20°C to +60°C
Clock Rate 32bit; 5MHz to over 300 MHz
16/32 bit; 50MHz to 100 MHz
RAM 72KB/ 648KB 32KB/ 256KB Remote software
diagnostics YES NO
Encryption Support YES NO Provision of RF Optimization YES NO
Configurable Logic Blocks YES NO 10/100 Ethernet Media
Access Controller (MAC) YES NO
Integrated Software Environment (ISE) YES NO
Digital Clock Managers (DCMs) YES NO
4.5 RELIABILITY COMPARISON
To determine the reliability of both designs, another comparative study was carried
out considering the evaluation of the most significant parameter involved, i.e. the
Mean Time Between Failures [60]. The term MTBF is related to modules,
components, parts, subsystems, systems and whole plants. In current comparison, the
stress factor temperature of 40 degrees centigrade is used as a basis.

58
As described earlier, the same XILINX Spartan-3 Series FPGA development kit was
used for the purpose of reliability comparison. While CPU226 of Siemens Simatic S7
family [61] was referred for PLC based design. It must be noted that the MIL-HDBK-
217-F [62] standard was followed considering appropriate Quality and Environmental
factors and resulting values also verified from manuals of both the Siemens and the
Xilinx.
For calculation of predicted reliability, another significant parameter Mean Down
Time (MDT) is utilized which is the time required for renewal or repair. It is also
known as the Mean Time to Repair (MTTR).
It is evident from the Table 2, that the predicted reliability of both options is not an
issue while selecting any device. However, the Mean Time Between Failures for
FPGA based RTU would surely be resulted in an optimized design of RTU.
Table 4.2: Reliability comparison of PLC based RTU versus FPGA based RTU
Features FPGA based RTU PLC based RTU
MTBF Predicted 488009.33 Hours (55.708 Years)
192720.00 Hours (22.0 Years)
Failure Rate Predicted 2.049141 failures per
million hours
5.188875 failures per million hours
Reliability Predicted (Considering a Mean Down Time of 8.76
Hours)
0.999982 0.999954
4.6 OPTIMIZATION OF WIRELESS LINK FOR RTU
The data communication among different RTUs would be through Communication
modules using CSMA/CD technique. The sensors carry data to the processing section
of the FPGA with RTU concept implementation.
The other monitoring end for management information system would be implemented
through TCI module. The interface would be RS-232 for the monitoring module on
the console. A general block diagram of SCADA components including TCI is shown
in Fig.4.7.

59
Fig. 4.7: A general block diagram of SCADA components including TCI.
There are two types of communication systems:
a. Indoor Communication system among multiple RTUs.
b. Outdoor Communication System among remote sites.
The scheme of link optimization would be implemented on both type of
communication system using Radio Mobile Simulator [63], a well known simulation
platform for Point to Multipoint Link Optimization. A scenario containing fours
RTUs communicating with one MTU is presented in Fig.4.8.
Fig. 4.8: Four RTUs communicating with one MTU.
In the field implemented RTUs, the location and environment play an important role.
For indoor network, it is important to evaluate the type of walls and pre-existing
Electromagnetic signals for interference calculations.

60
Fig. 4.9: Snapshot of properties to predict the attitude of the Proposed Network.
The other topologies that can be used while evaluating a link can be Data Net, Star
topology (Master/Slave) and Voice net.
The technical features of the different topologies are compared below in Table 4.3.
Table 4.3: Comparison of available topologies for optimal solution
Data net Cluster (Node / Terminal)
Data net, Star Topology (Master / Slave)
Voice Net (Command / Subordinate/Rebroadcast)
This topology accords the communication among all nodes without necessary presence of some Master node. The data communication continues even if any node goes down.
In this topology, all the RTUs share data with each other through Master unit. Peer to peer communication would fail if the Master unit switches off or goes unserviceable.
This is not feasible for smart RTU design and optimization due to its limited applicability on data networks.
In Node / Terminal scenario, the nodes have communication algorithm among each other and use of Omni-directional antennae enables the dynamic entry of any new node (Point to Multi-point) with any specific reconfiguration.
In Master / Slave configuration, there is the need of every slave having antenna pointing towards Master unit for data sharing (Point to Point Link). Use of Omni-direction antennae with every slave unit id the waste of resource.
There is no option of re-broadcast in this scheme as voice information retry does not exist in general.
This is a generalized smart solution with data sharing of nodes / Terminals and can be deployed as relay nodes as well where required.
It is a workable solution where data security and authenticated access to network is required through centralized status of Master unit.
It is not recommended for design of smart RTU.
The following phases executed to achieve optimization of wireless link for RTU.

61
4.6.1 Operating Frequency and Format of Terrain Data
The simulation setup consists of 03 locations situated around Hyderabad city namely:
• Mehran University of Engineering and Technology (MUET) Jamshoro.
• ISRA university hospital
• Liaquat University of Medical and Health Sciences (LUMHS) Jamshoro.
The working frequency in ISM band is selected such that:
• Minimum Frequency: 2420MHz
• Maximum Frequency: 2460MHz
The Terrain profile containing required data is being obtained in the form of Shuttle
Radar Topographic Mission (SRTM) for the selected locations. Mehran University of
Engineering and Technology (MUET) Jamshoro is selected as a Central Station
(MTU) while Liaquat University of Medical and Health Sciences (LUMHS) Jamshoro
and ISRA university hospital are designated as Slave locations.
4.6.2 Link Examination and Network Properties
In this segment of RF optimization, transmission path between the Master Terminal
Unit location and different RTUs locations is investigated to determine optimal
parameters by integrating terrain profile of intended areas in Radio Mobile Software
which generates RF coverage plot for these locations which is shown in Fig.4.10.
The interactivity of the platform gives liberty to maximize the engineering effect
through proper parameterization of the modules and installations required.
The Communication Modules [64] in RTU need to be optimized for the high
definition system specifications. This step would optimize the link for indoor as well
as the outdoor system. An example is presented in Fig.4.10.

62
Fig. 4.10: RF coverage plot for optimized communication between RTU & MTU.
The RTU network [65] has been planned and optimized with the flexibility of
including new RTU node whenever required. The data transmitted from RTU would
be received through TCI module for data integrity and graphical representation. It can
be observed from Fig.4.10 that numerous design parameters may be input to obtain
optimized link design.
4.6.3 Simulation for RF Link Optimization
As described earlier that Radio Frequency Coverage plot is generated by the software
for the required regions to obtain an interactive link instantly. This can be initiated by
using Map property dialog box from the menu “File” which selects the format of data
which is SRTM for this particular setup and gives the source of Elevation data. These
steps to install terrain data are presented in Fig. 4.11.

63
Fig. 4.11: A view of Map Property Dialog Box.
The Network property dialog box is also available in menu “File” comprising
different tabs such as Topology, Parameters, Membership, Style and Systems are
available in Network property dialog box. It is required to state the technical features
of radio equipment using the tab “Network Property System” while other tabs of
Network Property are being used to define intended networks so that their
specifications can be included.
Bench Marking of Data Communication Protocol using a particular scenario is
explained in next section 4.7 while results of both sections 4.6 and 4.7 are presented
and discussed in section 4.9.
4.7 BENCH MARKING OF DATA COMMUNICATION PROTOCOL
The post optimization bench marking of data communication protocol has been done
considering MHX-2400 frequency-hopping 2.4 GHz spread-spectrum
communications module so that it can be finalized as optimal candidate as TCI
module upon qualifying the test.
The proposed scenario for bench marking is described in Fig. 4.11.

64
Fig. 4.12: Scenario used for Bench Marking of Data Communication Protocol.
• In the proposed configuration of TDMA, the Master transmits Data in
Broadcast manner i.e. Master can send data to all Nodes at the same time.
• The Master allows data reception with only one Node at a time.
• In the proposed configuration, the "Master" will first communicate with the
"Node-1" for the predefined hop interval. (Here 12 ms).
• After 12 mS, the "Master" will then increment the unit address of the Node
and now it will communicate with the "Node-2" for next 12 ms.
• Similarly the "Master" will go to communicate with "Node-3" for next 12 ms.
• This pattern continues until the TDMA Max Address i.e. the total number of
Node modules is reached.
After communicating the last Node Module in the Network, the "Master" Module will
go to "Node-1" again for next TDMA cycle. The Master – Node communication
timing diagram is expressed as Fig. 4.13.

65
Fig. 4.13: The Master – Node Communication Timing Diagram.
The bench marking process executed to check post optimization functionality of
communication link considering parameters like Packet Miss Percentage (PMP),
Downlink Packet Miss Rate, Downlink Packet Failure Rate and other relevant
parameters. The results of bench marking are shown in next section graphical format
along with results obtained from Radio-Mobile software.
4.8 RESULTS AND DISCUSSIONS
The data transmitted from RTU would be received through TCI module for data
integrity and graphical representation. This section deals with results related to RF
link optimization and bench marking of data communication protocol.
It can be observed from Fig.4.9, that numerous design parameters (e.g. Radiated
Power and Antenna Gain) may be input to obtain optimized link design [66]. It should
be noted that details about simulation have already been explained in section 4.6.3.

66
From Fig 4.10, it can be seen that the transmitting frequency can be varied between
2420MHz and 2460MHz giving minimum and maximum ranges while transmitter
power is one watt, transmitting antenna gain and height are 6dBi and 64.5 meters
respectively. Similarly optimal height receiving antenna is computed as 66.5 meters.
Radio link pane also accounts for any obstruction to maintain Line of Sight (LOS) to
further modify the parameters including height of an antenna. The performance
parameters for RF link optimization also include Free Space loss and Path loss,
Elevation angle, Azimuth, Receiver level and Receiver relative, Worst Fresnel and
Distance in kilometer.
Optimal transmission path between MUET and LUMHS has been simulated for
which results are shown in Table.4.4. the transmitting antenna frequency can be
varied between 2420MHz and 2460MHz giving minimum and maximum ranges
while transmitter power is one watt, transmitting antenna gain and height are 6dBi and
64.5 meters respectively while Line loss is 2.5dB, Effective Isotropic Radiated Power
(EIRP) is 2.24W and Effective Radiated Power (ERP) is 1.37W.
Table 4.4: Table of Optimized parameters for RF coverage plot between Mehran University (MUET) and LUMHS
Azimuth angle 209.8o
Elevation angle 0.024o
Clearance at 17.79Km
Worst Fresnel 1.6F1
Distance 32.77Km
Free Space 130.5dB
Obstruction 4.4dB
Urban 3.3dB
Forest 0.0dB
Statistics 3.7dB
Path loss 133.1dB
E Field 45.3dBµV/m
Rx Level -96.1dBm
Rx Level 3.50µV
Rx Relative 3.9dB
Similarly optimal height receiving antenna is computed as 66.5 meters and receiving
antenna frequency can be varied between 2420MHz and 2460MHz giving minimum
and maximum ranges. It can be concluded for these optimal values that we need to
input network specifications for any scenario to get optimized values of RF coverage
plot.
The MHX-2400 is an embedded wireless data transceiver selected for this particular
research work. Its range of operating frequency is between 2.4000 to 2.4835 GHz i.e.
ISM band. This frequency-hopping spread-spectrum module provides reliable

67
wireless data transfer between almost any types of equipment which uses an
asynchronous serial interface. The compact size and high performance of this module
make it ideal for many applications including SCADA, Traffic Control, Remote
Monitoring, Telemetry and many more.
Reference to section 4.7, the proposed scenario for bench marking is described in Fig.
4.11, which depicts one TCI module (which is MHX-2400 in this case),
communicating with 08 nodes. The details about this TDMA operation with sequence
had already explained in section 4.7.
Initially, the "Master" communicated with the "Node-1" for the predefined hop
interval of 8 ms for which optimal packet size in 14 bytes which is less than 40 bytes
size of our intended packet containing 32 bytes for analog inputs, 2 bytes for 16
digital inputs, 1 byte for digital outputs, 2 bytes for SPI communication and 3 spare
bytes. As optimal packet size for 8 ms time slot is only 14 bytes so it is short to
accommodate 40 bytes. Thus it has resulted in erroneous situation which is described
in Table 4.5 and Fig. 4.14(a) showing that the downlink Packet Miss Percentage
(during the communication) is between 1% and 2.5 % of expected packets. We are
showing the state of Data in erroneous situation in Table.4.5, and it is plotted in Fig.
4.14 (a). This erroneous situation for data transfer can be optimized by increasing hop
interval to 12 ms.
Table 4.5: Bench Marking Results for percentage Packet Miss and Packet Error
(Erroneous Situation) Number of nodes Downlink Packet Miss % Downlink Packet Error %
1 2.03 0 2 2.21 1.63 4 2.19 0.47 6 2.01 0 7 1.3 0

68
Fig. 4.14 (a): Bench Marking Graphical Results – Erroneous Situation. (Packet Miss and Packet Error)
The bench marking procedure is further continued to find the best possible
performance and maximum packet size at different modes of operation. The setup
assumes a baud rate of 115k, no retries and no retransmissions and it can support
maximum packet size of 255 bytes.
In actual scenario, the Master transmits Data in Broadcast manner using TDMA mode
i.e. Master can send data to all Nodes at the same time. The Master allows data
reception with only one Node at a time. In the proposed configuration, the "Master"
will first communicate with the "Node-1" for the hop interval equivalent to 12 ms for
which optimal packet size in 14 bytes which is greater than 40 bytes size of our
intended packet. After 12 ms, the "Master" will then increment the unit address of the
Node and now it will communicate with the "Node-2" for next 12 ms. Similarly the
"Master" will go to communicate with "Node-3" for next 12 ms. This pattern
continues until the TDMA Max Address i.e. the total number of Node modules is
reached. The results of are shown in Table.4.6 and Fig.4.14 (b).
Table 4.6: Bench Marking Results for Downlink Refresh Rate (Expected and Actual)
Number of nodes
Downlink Refresh Rate
P/sec
Downlink Expected
Refresh Rate P/sec
Downlink_Packet_Failure_Rate P/sec
1 4.89 5 0 2 9.77 10 0.16 4 19.56 20 0.09 6 29.39 30 0 7 34.55 35 0

69
Fig. 4.14 (b): Bench Marking Graphical Results – Optimized.
(Packet Miss and Packet Error)
From Table.4.6 and Fig.4.14 (b), it is revealed that most of the time, packet error
percentage (PCER+PLER) is less than 0.5% which shows high performance of
selected TCI module and the downlink refresh rate is very close to the expected
refresh rate which also endorsed the selection of MHX-2400. Each experiment has
been repeated 5 to 10 times to ensure the authenticity of results. However, MHX-2400
module can support 25 nodes for a refresh rate of 5 Hertz (200 ms) for 8 ms which has
been decreased to 16 nodes while bench marking had applied by selecting 12 ms hop
interval and optimal packet size equivalent to 66 bytes.
4.9 CONCLUSION
The planned design of Remote Terminal Unit (RTU) using FPGA has proved as an
optimized solution to implement wireless SCADA which may cater energy
management applications. It has evaluated that the Conventional PLC based RTUs
have many limitation to execute complex developments like energy management
using wireless SCADA. Hence FPGA based reconfigurable and reliable RTUs have
become more suitable as compared to PLC based systems. In addition to optimal
hardware solution using FPGA, this research study also focused on optimization of
wireless link related with operation of RTU. The proposed solution is best suited for
optimized energy management in countries having shortfall of energy. This particular
design of RTU has major advantages resulting in a more powerful and optimized
solution for implementation of wireless based SCADA.
-0.5
0
0.5
1
1.5
2
2.5
0 2 4 6 8
Downlink Packet Miss %
Downlink Packet Error %
Number of Nodes
%

70
CHAPTER 5
3 IMPLEMENTATION AND TESTING OF RTU HARDWARE
5.1 INTRODUCTION
Design of an optimal Remote Terminal Unit (RTU) is a key step in implementation of
Wireless SCADA which had presented in previous chapter. This chapter presents
Implementation and Testing of an RTU design which is suitable for wide area
operation essential for controlling and monitoring oil and gas sector, water and power
industries. This particular implementation is based on FPGA which confers reliability
and reconfigurability properties to the RTU design. It has significant advantages
resulting in a more powerful and optimized solution for execution of wireless based
SCADA. The main objective of this research work is to implement and verify a
design considering performance parameters which assists in optimized development
and inexpensive implementation of an RTU, also featured with wireless
communication.
It also includes behavioral modeling using ISE web pack of XILINX for the purpose
of testing functionality of developed RTU. Features of developed RTU are also
compared with commercially available hardware considering its cost effectiveness.
This particular design and implementation is made up of four major sections including
analog input, digital input, digital output and communication interface module.
Technical features of developed Remote Terminal Unit are presented in section 2. The
design initialization, main system thread, design modeling and qualification, process
synthesis, programming of device and integration of communication interface module
are different phases of RTU hardware implementation using FPGA as described in
section 3. The section 4 of this chapter includes Prototype Testing using Selected
Scenario followed by comparison with commercially available hardware in section 5.
Results and discussions are presented in section 6 while last section describes
conclusion by presenting significance of the low cost RTU implementation.

71
5.2 FEATURES OF DEVELOPED RTU
The developed RTU provides flexibility in terms of I/Os, CPU and radio related
configurations. It resulted in focused performance and expansion can be
accommodated quickly if needed. More intelligence is added to the power
management aspect resulting in optimized alarm.
The following table shows features of developed RTU in detail:
Table 5.1: Features of Developed RTU.
Features of FPGA based developed RTU Serial Interfaces 02 (RS232) Ethernet Ports 01 Integrated I/Os
16 Binary Inputs; 08 Binary Outputs and 08 Analog Inputs.
Extension I/Os
Binary Inputs/Outputs; Analog Inputs/Outputs
Clock Rate 50MHz on board oscillator and auxiliary clock oscillator socket
Liquid Crystal Display (LCD) 2-line by 16-character LCD VGA Display Port 01 (Via DB15 Connector) PS/2 Mouse / Keyboard Port 01 (Via 06 pin mini DIN connector) Digital to Analog Converter 04 Channel serial DAC Analog to Digital Converter 02 Channel ADC with pre-amplifiers
DDR SDRAM 512 Mbit (32M x 16) Micron Technology DDR SDRAM (MT46V32M16)
Expansion Connectors Hirose 100-pin FX2 Connector, J3 43 I/O connections, high-performance
Digital Clock Managers (DCMs) 04 Temperature Range -40°C to +100°C Telecontrol Interface Support
MHX-2400 is an embedded wireless data transceiver interfaced with RTU.
Encryption Key Support Available in MHX-2400 Provision of RF Optimization YES Configurable Logic Blocks 1.164 Integrated Software Environment (ISE) YES Remote software diagnostics YES
The features of developed RTU described in Table 5.1 are comparable with
commercially available RTUs for which details are discussed in next section of this
chapter.

72
5.3 PHASES OF IMPLEMENTATION USING FPGA
The hardware implementation and verification of RTU design described in previous
chapter is done using a development kit based on XILINX Spartan-3 Series FPGA
with 500K logic gates [67].
The overall project development flow diagram is simplified in the form of Fig. 5.1.
Fig. 5.1: Project development flow diagram showing phases of RTU Implementation.
It can be seen from Fig. 5.1 that RTL (Register Transfer Level) code is taking design
specifications from the input and inputs files for which specifications had already
been finalized in section 4.2. RTL is an outline of concept which is used to represent
a digital circuit essentially synchronous as the transformations (logic) is being
described between clock-edges (registers). The functionality of RTU for an energy
management system also involves constraints (due to congestion in power system

73
operation) which are being considered for overall implementation. The RTL code is
then synthesized in combination with processes for implementation and it is used for
RTL simulation. On the other hand, a test bench is utilized for functional simulation
resulting is design verification which is mandatory before programming the device.
5.3.1 System Initialization Phase
This phase includes initialization of controller, serial communication, serial peripheral
interface communication controller and analog to digital controller. It is described in
left hand portion of Fig. 5.2 where as interrupt service routine can be seen in the right
hand side of same figure.
The FPGA starts loading its configuration memory when power is applied. It
internally declares the Global Set-Reset (GSR) to resets all I/O bank storage elements
to a Low state in synchronous fashion. The data for configuration of FPGA is being
loaded in it when initialization phase executed. The selected kit used in implementing
RTU has two built in serial ports (RS-232) which are also initialized in this phase and
the user guide of starter kit board of Xilinx Spartan 3E can be referred for connector
and other details [68]. In the same phase, the Serial Peripheral Interface (SPI)
communication controller is also initialized to interconnect digital values to four
available DAC channels. The SPI bus is utilized for communication which is a
synchronous and full-duplex bus employed as four wire interface [69]. This particular
FPGA kits has an analog section to capture analog values comprised of a
programmable pre amplifier for scaling and an analog to digital converter (ADC).

74
Fig. 5.2: System Initialization and Interrupt Service Routine combining in Main System Thread with provision of Telecontrol Interface (CIM).
After successful execution of system initialization phase, the configured ports are sent
to main system thread which is also getting values from interrupt service routine for
implementing overall functionality. In summary, the system initialization phase
involved RTL Code in VHDL input, different port are initialized along with main
controller, serial communication modules, SPI module for ADC and the code for
initializing ADC.
5.3.2 Interrupt Routine Service
The interrupt service routine is initiated to read analog to digital conversion values for
available channels at one second intervals and places them in scratch pad memory. If
we again refer to Fig. 5.2, then it can be seen that it reads Analog to digital converter
channels 0 and 1 actually to check for analog power input in this particular
implementation of energy management scheme. Therefore it executes SPI

75
communication routine to analog to digital conversion. The main system thread takes
the values from scratch pad memory and executes required calculations before taking
further action which is deployment of wireless system interface for this particular
work.
The interrupt service routine is deployed here to for checking Power inputs, compute
input values and digital conversion, store these values in internal scratch pad memory
and it also passes these values to Main thread for transmitting through UART
5.3.2.1 Analog Power Inputs & ADC Computation
As described in section 2.3 that potential transformer (PT) and current transformer
(CT) are used for analog data so this section is associated with checking for analog
power inputs by reading analog channels available.
For analog power inputs check, the built in ADC and pre-amp of selected FPGA kit
are being used for which interface details are shown in Fig. 5.3.
Fig. 5.3: Analog to Digital Conversion Interface.
The ADC is a LTC 1407A-1 and the pre-amp is a LTC 6912-1. Both analog channels
are sampled simultaneously. The range of ADC is ±1.25Vp-p still less than 1.65V
(which is mid range of +3.3V). From the data sheet using gain equals to -1 [70].
It was determined that 34 SCK cycles (SPI clock) are required to convert a sample
analog input to digital data which should include both acquisition time and conversion

76
time thus resulting in maximum operational frequency of 50MHz. The Pre-Amp has a
clock limitation of 10MHz, so the maximum system clock to SCK ratio is 5:1.
A gain of -1 from the data sheet was preferred because it supported the largest range
for input voltage thus resulted in easier scaling of CT and PT. The output of ADC is a
two’s complement value the output can be evaluated by:
81921.25
1.65)(VputDigitalOut
- IN ×= (5.1)
Now considering electrical power, the calculation of the ADC inputs in Megawatts
representations are described in Table. 5.2.
Table 5.2: Calculation of the ADC inputs in Megawatts Representations.
VIN MW VIN-1.65 (VIN-1.65)*Gain (-1) A1/1.25 B1*8192 Approx
Dec Approx
hex A1 B1
0.1 1 -1.55 1.55 1.24 10158.08 10158 27AE
0.2 2 -1.45 1.45 1.16 9502.72 9502 251E
0.3 3 -1.35 1.35 1.08 8847.36 8847 228F
0.4 4 -1.25 1.25 1 8192 8192 2000
0.5 5 -1.15 1.15 0.92 7536.64 7536 1D70
0.6 6 -1.05 1.05 0.84 6881.28 6881 1AE1
0.7 7 -0.95 0.95 0.76 6225.92 6225 1851
0.8 8 -0.85 0.85 0.68 5570.56 5570 15C2
0.9 9 -0.75 0.75 0.6 4915.2 4915 1333
1 10 -0.65 0.65 0.52 4259.84 4259 10A3
1.1 11 -0.55 0.55 0.44 3604.48 3604 0E14
1.2 12 -0.45 0.45 0.36 2949.12 2949 0B85
Reference to table 5.1; it is quite evident that ADC output computations are resulted
in pre-calibration for intended measurement of power system which is ranging
between 1 and 12 Megawatt for the selected scheme. It should be noted that FPGA is
required converted values in hexadecimal so the value in the right most column are
significant for execution of further control operations. As stated earlier, these values
are being stored in internal scratch pad memory which passes these values to Main
thread for transmitting through UART.

77
5.3.3 Functional Verification using Main System Thread
The design stream (main system thread) using ISE web pack includes design entry,
synthesis, implementation, and programming Xilinx device as mandatory steps. On
the other hand, the design verification contains verification of functionality and timing
verification i.e. behavioral simulation also known as RTL simulation and functional
simulation also known as gate level simulation [71, 72]. Such verifications occur at
various stages during the flow of main system thread which can be seen in Fig. 5.4.
Fig. 5.4: FPGA Design Flow.
The above mentioned Fig.5.4 can be compared with Fig. 5.1 to conclude that the
design stream is associated with verification of design. Behavioral modeling or
simulation has been done before design synthesis where as functional simulation is
being done after finalizing RTL code for design implementation. However both types
of simulations are being used for functional verification of intended RTU. As
behavioral modeling is the verification of RTL code so it is also known as RTL
modeling or simulation.
RTL Level Schematic (Top Level) developed in HDL for actual implementation of
RTU for Energy Management System using Spartan-3 Series FPGA is shown in Fig.
5.5.

78
Fig. 5.5: RTL top level view of Energy management System.
The behavioral modeling is particularly performed here to verify RTL/behavioral
code developed for RTU and to prove that our design is being functioned according to
required attributes. The behavioral simulation can be executed on a source file called
HDL Test benches which had made available in the behavioral simulation view of
ISE web pack before design synthesis [73].
5.3.3.1 Functional Qualification of RTU I/Os
Block diagram for functional qualification of analog to digital converter for analog
inputs used in RTU is represented as Fig. 5.6.

The description of analog to digital conversion to check power inputs of developed
RTU is already available in section 5.2.1.1. Each
completes in 2 clock cycles and our design is using built in 50MHz clock source so
the real SPI bit rate can be verified as shown in Fig. 5.7 which keeps the design small
and flexible. Here 12 instructions have been shown whic
[74].
The following traces of the SPI signals have been observed using oscilloscope that
shows timing of the serial clock (SCK) and data
Fig.
The description of analog to digital conversion to check power inputs of developed
RTU is already available in section 5.2.1.1. Each
completes in 2 clock cycles and our design is using built in 50MHz clock source so
the real SPI bit rate can be verified as shown in Fig. 5.7 which keeps the design small
and flexible. Here 12 instructions have been shown whic
The following traces of the SPI signals have been observed using oscilloscope that
shows timing of the serial clock (SCK) and data
Fig.
Fig.
The description of analog to digital conversion to check power inputs of developed
RTU is already available in section 5.2.1.1. Each
completes in 2 clock cycles and our design is using built in 50MHz clock source so
the real SPI bit rate can be verified as shown in Fig. 5.7 which keeps the design small
and flexible. Here 12 instructions have been shown whic
Fig.
The following traces of the SPI signals have been observed using oscilloscope that
shows timing of the serial clock (SCK) and data
Fig. 5.
Fig.
The description of analog to digital conversion to check power inputs of developed
RTU is already available in section 5.2.1.1. Each
completes in 2 clock cycles and our design is using built in 50MHz clock source so
the real SPI bit rate can be verified as shown in Fig. 5.7 which keeps the design small
and flexible. Here 12 instructions have been shown whic
Fig. 5
The following traces of the SPI signals have been observed using oscilloscope that
shows timing of the serial clock (SCK) and data
.8: Timing of the serial clock (SCK) and data signals for ADC.
Fig. 5.6
The description of analog to digital conversion to check power inputs of developed
RTU is already available in section 5.2.1.1. Each
completes in 2 clock cycles and our design is using built in 50MHz clock source so
the real SPI bit rate can be verified as shown in Fig. 5.7 which keeps the design small
and flexible. Here 12 instructions have been shown whic
5.7: Analog to Digital Converter Communication Timing.
The following traces of the SPI signals have been observed using oscilloscope that
shows timing of the serial clock (SCK) and data
: Timing of the serial clock (SCK) and data signals for ADC.
6: Analog to Digital Converter SPI Control for RTU.
The description of analog to digital conversion to check power inputs of developed
RTU is already available in section 5.2.1.1. Each
completes in 2 clock cycles and our design is using built in 50MHz clock source so
the real SPI bit rate can be verified as shown in Fig. 5.7 which keeps the design small
and flexible. Here 12 instructions have been shown whic
: Analog to Digital Converter Communication Timing.
The following traces of the SPI signals have been observed using oscilloscope that
shows timing of the serial clock (SCK) and data
: Timing of the serial clock (SCK) and data signals for ADC.
: Analog to Digital Converter SPI Control for RTU.
The description of analog to digital conversion to check power inputs of developed
RTU is already available in section 5.2.1.1. Each
completes in 2 clock cycles and our design is using built in 50MHz clock source so
the real SPI bit rate can be verified as shown in Fig. 5.7 which keeps the design small
and flexible. Here 12 instructions have been shown whic
: Analog to Digital Converter Communication Timing.
The following traces of the SPI signals have been observed using oscilloscope that
shows timing of the serial clock (SCK) and data signals.
: Timing of the serial clock (SCK) and data signals for ADC.
: Analog to Digital Converter SPI Control for RTU.
The description of analog to digital conversion to check power inputs of developed
RTU is already available in section 5.2.1.1. Each
completes in 2 clock cycles and our design is using built in 50MHz clock source so
the real SPI bit rate can be verified as shown in Fig. 5.7 which keeps the design small
and flexible. Here 12 instructions have been shown whic
: Analog to Digital Converter Communication Timing.
The following traces of the SPI signals have been observed using oscilloscope that
signals.
: Timing of the serial clock (SCK) and data signals for ADC.
: Analog to Digital Converter SPI Control for RTU.
The description of analog to digital conversion to check power inputs of developed
RTU is already available in section 5.2.1.1. Each instruction of the controller
completes in 2 clock cycles and our design is using built in 50MHz clock source so
the real SPI bit rate can be verified as shown in Fig. 5.7 which keeps the design small
and flexible. Here 12 instructions have been shown which complete in 24 clock cycles
: Analog to Digital Converter Communication Timing.
The following traces of the SPI signals have been observed using oscilloscope that
signals.
: Timing of the serial clock (SCK) and data signals for ADC.
: Analog to Digital Converter SPI Control for RTU.
The description of analog to digital conversion to check power inputs of developed
instruction of the controller
completes in 2 clock cycles and our design is using built in 50MHz clock source so
the real SPI bit rate can be verified as shown in Fig. 5.7 which keeps the design small
h complete in 24 clock cycles
: Analog to Digital Converter Communication Timing.
The following traces of the SPI signals have been observed using oscilloscope that
: Timing of the serial clock (SCK) and data signals for ADC.
The description of analog to digital conversion to check power inputs of developed
instruction of the controller
completes in 2 clock cycles and our design is using built in 50MHz clock source so
the real SPI bit rate can be verified as shown in Fig. 5.7 which keeps the design small
h complete in 24 clock cycles
The following traces of the SPI signals have been observed using oscilloscope that
: Timing of the serial clock (SCK) and data signals for ADC.
79
The description of analog to digital conversion to check power inputs of developed
instruction of the controller
completes in 2 clock cycles and our design is using built in 50MHz clock source so
the real SPI bit rate can be verified as shown in Fig. 5.7 which keeps the design small
h complete in 24 clock cycles
The following traces of the SPI signals have been observed using oscilloscope that

80
It is evident from Fig. 5.8 that the serial clock timing matches prediction and
execution of complete read cycle takes just over 16µs which is clear indication of
successful functional testing of analog inputs of RTU.
On the other hand the behavioral simulation for digital I/Os are presented in Fig. 5.9.
Fig. 5.9: Behavioral simulation for digital I/Os.
After execution of RTL simulation, the results are displayed as Fig. 5.9. As no
stimulus is present which is the indication of our design compilation without error and
it then loaded in the simulator.
5.3.3.2 Functional Qualification of Complete System
The functional qualification of complete system involves three major sections
including analog inputs, digital inputs and digital outputs. However the interfacing of
Telecontrol interface (CIM) is also significant which is being presented in section
5.2.6.
Fig. 5.10 shows the simulation results of complete RTU for energy management
controller algorithm using VHDL using Xilinx ISE web pack.
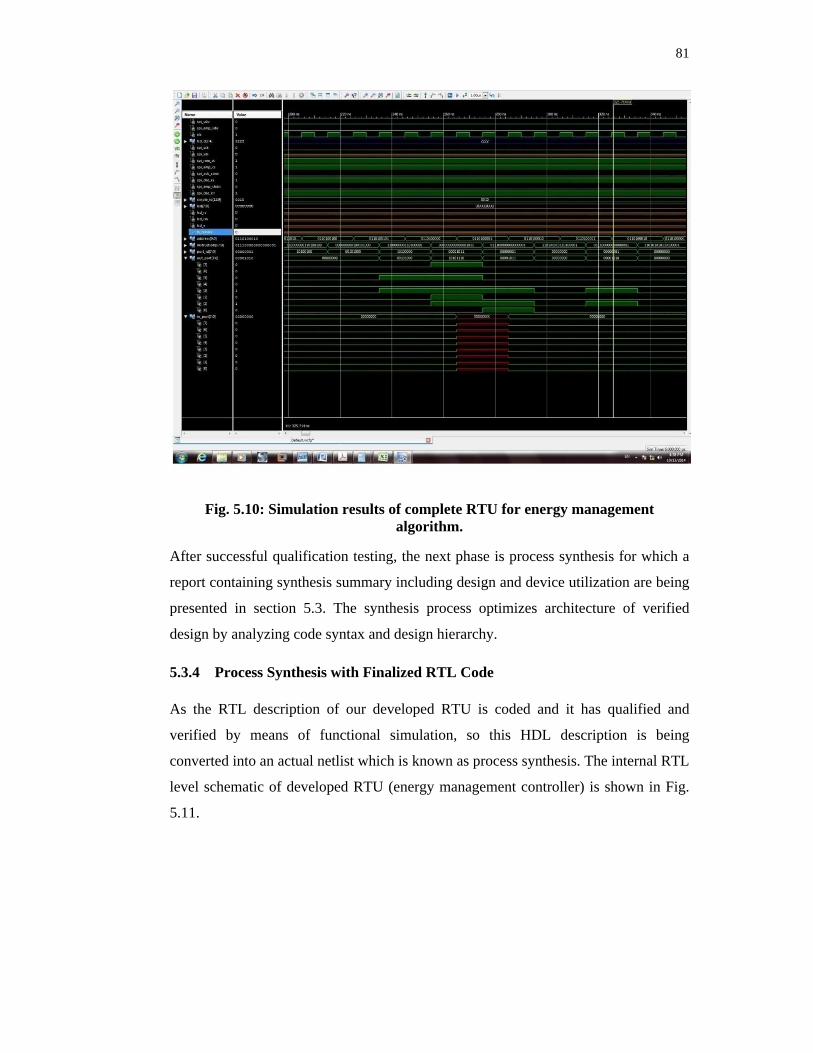
81
Fig. 5.10: Simulation results of complete RTU for energy management algorithm.
After successful qualification testing, the next phase is process synthesis for which a
report containing synthesis summary including design and device utilization are being
presented in section 5.3. The synthesis process optimizes architecture of verified
design by analyzing code syntax and design hierarchy.
5.3.4 Process Synthesis with Finalized RTL Code
As the RTL description of our developed RTU is coded and it has qualified and
verified by means of functional simulation, so this HDL description is being
converted into an actual netlist which is known as process synthesis. The internal RTL
level schematic of developed RTU (energy management controller) is shown in Fig.
5.11.

82
Fig. 5.11: Internal RTL level schematic of developed RTU.
However, a clear picture of resource utilization in FPGA, design summary, device
usage statistics and other results relevant with Spartan-3E Starter Kit for development
of our designed RTU are available in section 5.3.
5.3.5 Programming Device
Once the programming file also known as bit stream file is generated, the file has
been downloaded to the Spartan3E xc3s500e-5fg320 device from host-computer
using the iMPACT tool and the USB cable using our laptop. It is mandatory to make
sure that the jumpers on selected Spartan-3E board are installed correctly particularly

83
the configuration options which are available at the top of the board near the RS232
interfaces. Configuration options are outlined in Fig. 5.12.
Fig. 5.12: Detailed configuration options.
Upon correct setting of jumpers, the PC has recognized the USB connection to the
Spartan-3E board, the Process Configure Target Device is being used to start up the
iMPACT tool to program the FPGA [75]. We can skip several steps to directly
describe last step which involves Boundary Scan which is the technique that is used
with FPGAs for uploading the bit file to the Xilinx part through the USB cable. In the
iMPACT screen you should now see the following window that shows the
programmable chips and the associated bit files or bypass configurations. In the ISE
iMPACT window select the XC3S500E FPGA (it turned green), right click, and select
program as shown in Fig. 5.13.

84
Fig. 5.13: Programming of device (FPGA).
After creating a design source, the Implement Design process converted the logical
design represented in that source (and all sources in the hierarchy from that source
down) into a physical file format that has been implemented for the targeted device.
5.3.6 Integration of CIM (MHX-2400)
As described earlier in sections 4.7 and 4.8 that MHX-2400 is an embedded wireless
data transceiver selected for this particular research work. Its range of operating
frequency is between 2.4000 to 2.4835 GHz i.e. ISM band.
This frequency-hopping spread-spectrum module provides reliable wireless data
transfer between almost any types of equipment which uses an asynchronous serial
interface. There are several parameters that must be set in order to establish
communication between a pair of MHX-2400 modules. The module may be
configured as Master, Slave or Repeater module based on the intended use. Every
network must have a Master; however the number of slave nodes may be in any
number up to 200 in the desired network [76].
The module can be interfaced with the FPGA module through headers available on
training board, serial (RS-232) interface and RS-485 interface [77]. In this practical
scenario, MHX-2400 has been interfaced with Spartan 3E using header available on
starter kit. References to technical manual of MHX-2400, various S Registers affect

85
its operating characteristics ranging from S 101 to S 110 [78] For example S register
101 and 102 are being used for setting operation modes and serial baud rate
respectively. Whereas S registers 103 and 104 deals with wireless link rate and
network address. We have set fast link rate with forward error correction and
maximum allowable serial baud rate which 115200 for which bench marking had
already done in previous chapter. The other S registers are intended to set unit
address, hopping patterns, encryption key, output power level, hopping interval, data
format, packet size and packet size control.
The MHX-2400 has been configured in TDMA mode for communication. The
operation of MHX-2400 had been verified in benchmarking described in section 4.8.
However, the link between RF module and FPGA has been verified in lab
benchmarking using simple steps described below:
The LED indicators on the development board housing the slave unit are being
observed in order to check the availability of communication link. As the link is
established with good reception then up to three RSSI (received signal strength
indicator) LEDs on the Slave modem have become active along with the RX/Sync
LED. On the other hand, these LED’s will be in either inactive or in scanning mode if
the link is open due to configuration or any other fault at either end.
To check transfer of data, characters typed at the master terminal appeared at the
slave’s terminal, and vice versa. It is also noted that the Reception LED (RX) blinks
as packets of data are received at the Master modem. As data is sent from slave to
master, the receiver indicator is being blinked on as correct packets of data are
received. At this point, the master’s LED for RSSI indication has also become active
[79, 80]. This scenario has explained the testing of link between RF module and
FPGA.
5.4 RESULTS AND DISCUSSIONS
This section mainly presents design summary, HDL synthesis report and device
utilization summary. After design implementation, it is necessary to verify the device
utilization by reviewing the “Design Summary” section at the top of the Map Report.

86
For our design of RTU containing 32 I/Os, the device utilization summary is given in
Table. 5.3.
Table 5.3: Design summary for RTU design having 32 I/Os
Device Utilization Summary
Logic Utilization Used Available Utilization
Number of Slice Flip Flops 135 9,312 1%
Number of 4 input LUTs 199 9,312 2%
Number of occupied Slices 135 4,656 2%
Number of Slices containing only related logic 135 135 100%
Number of Slices containing unrelated logic 0 135 0%
Total Number of 4 input LUTs 226 9,312 2.5%
Number used as logic 131
Number used as a route-thru 27
Number used for Dual Port RAMs 16
Number used for 32x1 RAMs 52
Number of bonded IOBs 42 232 18%
Number of RAMB16s 1 20 5%
This design is implemented without any errors and warnings which is an indicator that the
developed RTU qualifies for its intended functionality.
Reference to Table 5.2, it must be noted that 32 IOBs out of 42 bonded IOBs have been used
for implementing 32 I/Os which are combination of both analog and digital. While 08 IOBs
are used for port interface handling in SPI communication and remaining 02 are used to
enable/disable this interface connection. In total 226 LUTs have used in development of ALU
module and routing purpose within the design. The breakup clarifies that 199 LUTs have been
used for ALU development and 27 have been utilized for routing i.e. connectivity with
interfaces. This energy management controller (RTU) is based on soft core logic and all
internal connections in FPGA are logically related and implemented by means of occupied
slices which are 135 in this particular case. On the other hand, of slice flip flops are being
used for sampling and quantization of analog data for two ADC inputs.

87
The HDL synthesis report is generated as:
HDL Synthesis Report ----------------------------------------------------------------------------------------------------------------- Macro Statistics # Counters : 2 26-bit up counter : 1 9-bit up counter : 1 # Registers : 17 1-bit register : 14 4-bit register : 1 8-bit register : 2 # Multiplexers : 1 8-bit 3-to-1 multiplexer : 1 # Tristates : 1 4-bit tristate buffer : 1
Now we need to check for the device utilization summary which is being presented in
Table 5.4, after synthesis to see if it is similar or close to the design summary already
discussed.
Table 5.4: Projected device utilization Summary for RTU design having 232I/Os.
Projected Device Utilization Summary
Logic Utilization Used Available Utilization
Number of Slice Flip Flop 1049 9,312 22.5%
Number of Slice Flip Flops 976 9,312 10.5%
Total Number of 4 input LUTs 1124 9,312 12%
Number used as logic 652
Number used as RAMs 472
Number of bonded IOBs 82 232 36%
Number of RAMB16s 7 20 35%
Number of BUFGMUXs 6 24 25%
The comparative study of Table 5.3 and Table 5.4 concludes that the selected
XC3S500E FPGA is also suitable to develop RTU with 232 I/Os. The RTL internal
schematic of developed RTU (with 32 I/Os) is already presented as Fig. 5.10. For
reliability estimation, the predicted reliability and MTBF had already presented in

88
Table 4.2 whereas Table.4.1 included Performance comparison of PLC based RTU
versus FPGA based RTU.
The resource utilization of FPGA for developed RTU is presented in Fig. 5.14.
Fig. 5.14: Resource utilization within FPGA for RTU design.
The results and discussions related to benchmarking of MHX-2400 and its interfacing
with FPGA had already presented in section 4.7 and section 5.2.6 respectively. The
developed solution is well suited for optimized energy management in countries
having shortfall of energy.
5.5 HARDWARE TESTING USING SELECTED SCENARIO
Running a system on Chip (SOC) design on FPGA based model is a certain way to
ensure that it is functionally correct. This compares with designers who rely solely on
software simulations to verify that hardware design is sound. Simulation speed and
modeling accuracy limitation may prevent this development [81].
FPGA hardware testing allows much more time in the area of software development
and testing at the integration of software - hardware. This allows many unexpected

89
software errors that appear due to the current variety of operating systems,
applications and hardware [82]. It also allows the developer to ensure that all your
system IP technologies work well together offstage simulation and real way.
Hardware testing has the added advantage as demonstration platforms to customers of
SOC, which in early interest. This speeds up the development cycle and allows
greater overall performance in the characteristics of chips.
As described earlier, hardware implementation and verification of this RTU design is
done using a starter kit based on XILINX Spartan-3 Series FPGA with 500K logic
gates. The developed RTU contains 16 channels Digital Input, 8 channels Analog
Input and 8 channels Relay/Digital Output. This section covers testing at the
integration of software – hardware. As the developed hardware is intended for energy
management applications therefore a related scenario is being described to verify
hardware functionality.
The hardware testing involved energy management related parameters such as
Frequency, Available Transfer Capability (ATC) and Current Peak Demand of Load.
We have employed dummy inputs to adjust and vary these parameters and a
Graphical User Interface (GUI) is also developed using WebPHY™ [82]. The
WebPHY™ DATABUS IP core supports an interface for web in drop down style
facilitating the control of user FPGA address space directly from any web browser.
These GUI controls send DMA-style read and write commands to the core, allowing
reads and writes of data between user address space in the FPGA and the web client.
With GUI implementation, we can monitor variation in above mentioned parameters
on screen of PC in real time. Also, the corrective actions are being taken either
intelligently or manually according to requirement of operation. Examples of
corrective actions are adding some renewable energy resource to address congestion
in power distribution network due to increase in peak demand of load and isolating
some faulty bus to restore power system operation at other locations which had also
disturbed due to fault occurrence.
This GUI developed for this particular scenario is installed the laptop using
WebPHY™ platform consisted of circuit breaker and isolator as control elements in
the form of buttons where it is capable of displaying Frequency, Available Transfer
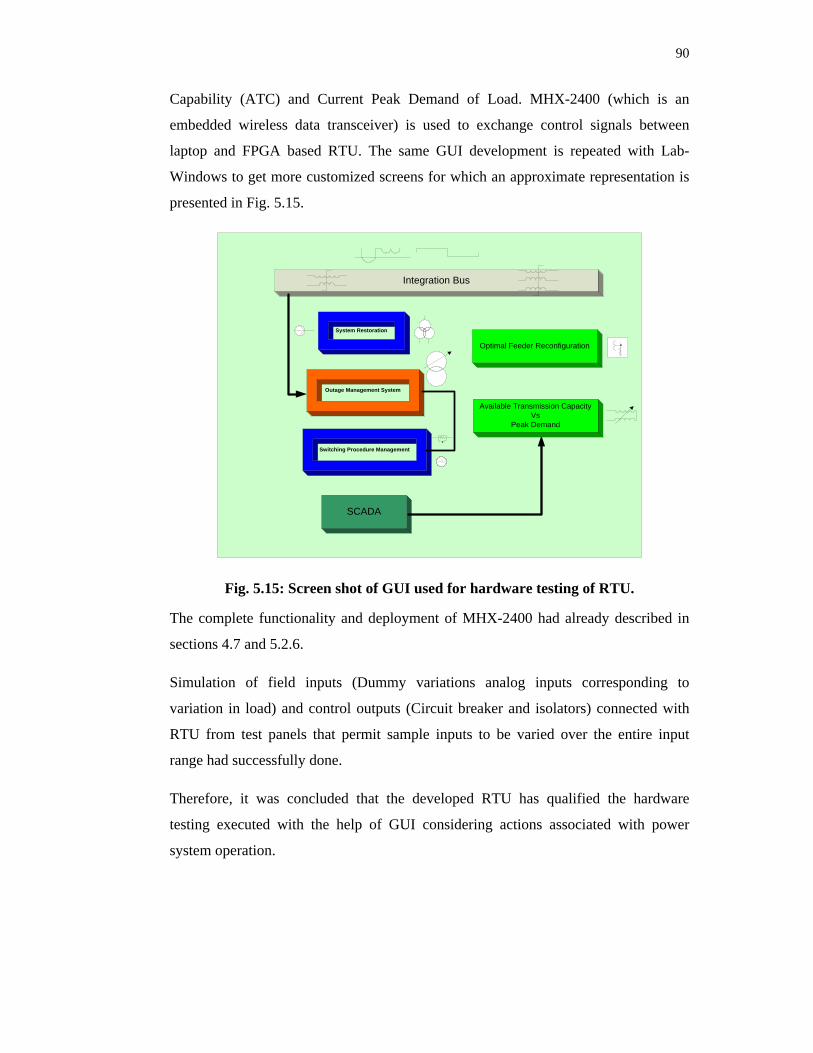
90
Capability (ATC) and Current Peak Demand of Load. MHX-2400 (which is an
embedded wireless data transceiver) is used to exchange control signals between
laptop and FPGA based RTU. The same GUI development is repeated with Lab-
Windows to get more customized screens for which an approximate representation is
presented in Fig. 5.15.
Integration Bus
System Restoration
Outage Management System
Switching Procedure Management
SCADA
Available Transmission Capacity Vs
Peak Demand
Optimal Feeder Reconfiguration
Fig. 5.15: Screen shot of GUI used for hardware testing of RTU.
The complete functionality and deployment of MHX-2400 had already described in
sections 4.7 and 5.2.6.
Simulation of field inputs (Dummy variations analog inputs corresponding to
variation in load) and control outputs (Circuit breaker and isolators) connected with
RTU from test panels that permit sample inputs to be varied over the entire input
range had successfully done.
Therefore, it was concluded that the developed RTU has qualified the hardware
testing executed with the help of GUI considering actions associated with power
system operation.

91
5.6 COMPARISON WITH COMMERCIALLY AVAILABLE HARDWARE
This particular development of RTU has been done using Spartan 3E FPGA having
reconfigurable features. For comparison purpose, we have selected RTU540 series for
grid automation solution manufactured by ABB Group which is a global leader in
power and automation technologies. A careful comparative study has resulted in
compilation of Table 5.5 which shows features of our developed RTU and RTU540
series of ABB.
Table 5.5: Comparison of Developed RTU with commercially available RTUs.
Features Developed RTU 560CMG10 560CIG10 Serial Interfaces 02 (RS232) 03 03 Ethernet Ports 01 01 01
Integrated I/Os
16 Binary Inputs; 08 Binary Outputs and 08 Analog Inputs.
-----
16 Binary Inputs; 08 Binary Outputs and 08 Analog Inputs.
Extension I/Os
Binary Inputs/Outputs;
Analog Inputs/Outputs
Binary Inputs/Outputs;
Analog Inputs/Outputs
Binary Inputs/Outputs;
Analog Inputs/Outputs
DDR SDRAM
512 Mbit (32M x 16) Micron Technology
DDR SDRAM (MT46V32M16)
64 MByte 64 MByte
Temperature Range
-40°C to +100°C
-25°C to +70°C
-25°C to +70°C
Telecontrol Interface Support
MHX-2400 is an embedded wireless
data transceiver interfaced with RTU.
RER601 wireless transceiver interfaced
with RTU
RER601 wireless transceiver interfaced
with RTU
Encryption Key Support
Available in MHX-2400
Available in RER601 Available in RER601
Configurable Logic Blocks
1.164 Not Applicable Not Applicable
Integrated Software Environment (ISE)
YES NO NO
Remote software diagnostics
YES NO NO
In case of ABB product line of 540RTU, additional I/O modules should be arranged
for a possible expansion. However, the developed RTU is a reconfigurable design
based on FPGA so we may plan more I/Os as described in results and discussions
92
section. This comparative analysis of features shows that our particular RTU is well
comparable with commercially available RTUs for power related applications.
However, more powerful RTUs are also commercially available but they are not more
expensive as expected so beyond the scope of this particular comparison.
5.7 CONCLUSION
The main purpose of this research work has been achieved which involved
verification of our developed RTU by considering performance parameters which
assists in optimized development. The developed RTU has been proved as a reliable
one and can be implemented at a relatively low cost as compared with commercially
available RTUs. The commercially available RTUs with similar configuration are
available at higher prices say starting from 4000 Euros per unit but the same RTU can
be developed as low as 400 Euros per unit so this low cost RTU design may get
considerable appreciation. With available interfaces for telemetry using MHX-2400,
the developed RTU has also become a valuable candidate to be incorporated in
Wireless based SCADA system.

93
CHAPTER 6
4 CONCLUSION & FUTURE WORK
In conclusion, this thesis has supported low cost optimal development and
implementation of a Remote Terminal Unit (RTU) with provision of wireless
connectivity with an aim to address the energy management system based on
SCADA. The provision of wireless connectivity in the developed RTU has been
optimized and benchmarking was also done for further verification. The developed
RTU is based on FPGA and not only performed well as compared to commercially
available RTUs based on programmable logic controllers (PLCs) but it is well
comparable with commercially available RTUs for power related applications. The
characteristics and features of developed RTU have been verified by means of
hardware testing. Moreover, a model for optimized energy management system was
also proposed and demonstrated by means of simulations.
6.1 SUMMARY
One significant research objective dealt with modeling of the power system outages
and the system adjustments using contingency analysis using PowerWorld simulator
focusing to improve both the electricity system and the environment. It is capable of
forewarning the operator to initiate preventive action by visualizing weak elements at
early stages. The results of contingency analysis may be helpful in determining the
performance issues related to generation, transmission, distribution and green
technology. Prime locations inside system may be identified where addition of
adequate renewable generation may result in efficient handling of distribution crisis.
Transmission Loading Relief (TLR) is another tool of PowerWorld simulator which
had added in the model to prevent overload situations by managing transmission
utilization. It is very useful to reduce the risk of system failure. For instance, if a
transmission line is loaded beyond its thermal limit then a TLR plan should be
initialized forcing that all transactions on the overloaded element be curtailed thus
keeping the exchanged power flow within designated thermal limit.

94
To further strengthen the proposed model based on contingency analysis, optimal
power flow (OPF) tool is utilized to determine effective system corrections to take
place in either the base case followed by a primary contingency or any of the
secondary contingencies. Moreover, two major functionalities are available in OPF
which are minimum cost and minimum control change. Minimum cost function has
attempted to minimize the sum of the total generation costs in specified areas whereas
minimum control change has attempted to minimize the alteration in the generation in
the particular areas thus resulting in OPF.
The OPF is supplemented by mathematical model for congestion management which
had proved that the power flow is being affected not only by either varying voltage
magnitudes or the power angle but it can also be affected by changing reactance of the
transmission line. Therefore, either power angle or voltage magnitude may be used for
congestion management.
After development of model for power system outages and adjustments, OPF and
mathematical model for congestion management, an integrated framework has been
proposed which is capable of providing a simulation platform for detailed study of
power system to overcome issues like susceptibility of failure, critical situations and
restoration scheme by adding renewable energy resources. This integration has
resulted in a simulation platform useful for analyzing power system operations in
smart cities as well. Operational algorithms to optimize the generation, transmission
and distribution schemes may also be developed by taking advantage of smart
infrastructure in a more effective manner.
As an essential component of SCADA, a low cost optimal design of an RTU is highly
desirable which was accomplished in this particular dissertation by comparative
assessment of performance of both methodologies of RTU design, one based on PLCs
and other one based on FPGAs which has been found more suitable for the
implementation and functionality. The hardware implementation and verification of
this RTU design is being done using a starter kit based on XILINX Spartan-3 Series
FPGA with 500K logic gates and the MHX-2400 frequency-hopping 2.4 GHz spread-
spectrum communications module had been examined and found suitable as

95
Communication Interface Module for designed RTU. In contrast to the PLC based
RTU, it was found that the features of FPGA based RTU are more attractive both in
terms of functionality and reliability and provide a powerful platform to implement
energy management related scenarios. The FPGA based RTU offers flexibility in
terms of I/Os, CPU and radio related configurations and expansion can be
accommodated quickly if needed as FPGA based designs are reconfigurable.
The design of link optimization has been implemented using Radio Mobile Simulator,
a well known simulation platform for Point to Multipoint Link Optimization. The data
transmitted from RTU is being received through communication interface module for
data integrity and graphical representation for which further benchmarking is done for
data communication protocol. From bench marking experiment, it was also revealed
that most of the time, packet error percentage (PCER+PLER) is less than 0.5% which
shows high performance of selected MHX-2400. The proposed solution is best suited
for optimized energy management in countries having shortfall of energy.
Finally, the main accomplishment of this research work is implementation and
verification of design considering performance parameters assisted in optimized
development and inexpensive implementation of an RTU, also featured with wireless
communication. Different phases of practical RTU hardware implementation using
FPGA have been presented which include design initialization, main system thread,
design modeling and qualification, process synthesis, programming of device and
integration of communication interface module (MHX-2400) with developed RTU
which has been interfaced with Spartan 3E using header available on starter kit and
configured in TDMA mode for communication. In hardware testing phase, simulation
of field inputs (variation in load) and control outputs (circuit breaker and isolators)
connected with RTU from test panels that permit sample inputs to be varied over the
entire input range using a Graphical User Interface (GUI) had successfully done
which facilitated the control of user FPGA address space directly from any web
browser.

96
6.2 FUTURE WORK
A careful design of RTU and integration of wireless transceiver involves in depth
research for selection of appropriate devices before proceeding towards actual
hardware implementation. In future, the RTU hardware can be enhance by adding
Power over Ethernet (PoE). Our particular design doesn’t possess this feature
although some RTU manufacturers like “DPS Telecom” launched such editions of
RTU hardware [85]. This feature can be added in future by selecting SmartFusion2
FPGA development kit manufactured by MicroSemi [86].
One future direction which was not considered in this work is to implement clusters of
remote RTUs by connecting them through VHF radio and they all are also connected
with central monitoring station through a microwave or satellite link.
On the other hand, the development of optimized EMS using optimal power flow
(OPF) and contingency analysis can be enhanced by model the behavior of users
(electricity consumers) in terms of consumption which can be used for forecasting of
demand for different slots (Morning, Evening, Night) and different Seasons (summer
and winter).
One more future direction involves continuous monitoring of consumer load and
intelligent circuit breakers should be capable of switching off certain devices in case
of congestion instead of complete shut down for an area. But this approach would
further require infrastructure with smart energy meters. Therefore this option is out of
the scope of this particular research work.
6.3 CONCLUSION
All significant design aspects of FPGA based remote terminal unit for wireless
SCADA have been analyzed so that a reconfigurable RTU can be developed at low
cost which was done as low as 400 Euros per unit. This important research work also
opens avenues to further improve RTU design by using different performance ranges
of available FPGAs. The integration of RF transceiver module is a value addition to
this development as it distinguished this design from many commercially available

97
RTUs using external transceivers for communication. The commercially available
RTUs with almost similar features are available at higher prices starting from 4000
Euros per unit and their training cost is also ranging between 1500 Euros and 3000
Euros. It is also determined that the selected XC3S500E FPGA is also suitable to
reconfigure the developed RTU with 232 I/Os as compared to the current design
which is limited to 32 I/Os. Therefore the developed RTU has become a valuable
candidate for wide area operations such as SCADA based energy management
system.

98
REFERENCES
[1] Energy Sector Overview: South Asian Regional Initiative for Energy. www.sari-
energy.org/PageFiles/Countries/Pakistan_Energy_Overview.asp (last accessed on
21-oct-2014)
[2] M Zima, T Krause, G Andersson, “Evaluation of system protection schemes, wide
area monitoring and control systems”, in Proc. 2003, Sixth International
Conference on Advances in power system control, operation and management. pp.
754-759.
[3] XA/21* SCADA Energy Management System by General Electric XA/21* – A
reliable, field-proven, secure and adaptable solution for optimizing the operation
of generation and transmission assets. Published by General Electric Company,
2006.
[4] Pollution Prevention Through Energy Conservation, Rutgers, The State University
of New Jersey New Jersey State Department of Environmental Protection, 2007.
[5] Wayne C. Turner and Steve Doty, “Energy Management Handbook”, 2009.
[6] Technical Overview of KESC AMR Project, PTD Energy Automaton, Karachi,
February 2008.
[7] Moreno-Munoz, A, Oterino, D. Carmona, A. de la Rosa, J.J.G,“Automated Meter
Reading Systems in Outage Management” in Compatibility in Power Electronics,
2007. CPE '07, pp.1-4.
[8] Sridharan, K. Schulz, N.N., “Outage management through AMR systems using an
intelligent datafilter” in IEEE Transactions on Power Delivery, 2001, pp.669-675
[9] Mahmood, A. Aamir, M. Anis, M.I. ,“Design and Implementation of AMR
Smart Grid System” Electric Power Conference, 2008. EPEC 2008. IEEE Canada,
pp.1-6.
[10] Amanullah M.T.O, Kalam A. and Zayegh A., “Information embedded power
system: the effective communication system of the 21st century power system
industry” AUPEC 04, September 26-29, Brisbane, Australia.
[11] Jian Wu, Yong Cheng, and Noel N., “Overview of Real-Time Database
Management System Design for Power System SCADA System”. SoutheastCon,
2006. Proceedings of the IEEE , vol., no., pp.62,66.

99
[12] Juan García, Francisco Rogelio Palomo, Antonio Luque, Member, IEEE,
Carmen Aracil, José M. Quero, Member, IEEE, Daniel Carrión, Francisco Gámiz,
Plácido Revilla, Juan Pérez- Tinao, Manuel Moreno,Pedro Robles, and Leopoldo
G. Franquelo, Senior Member, IEEE “Reconfigurable Distributed Network
ControlSystem for Industrial Plant Automation” 6, December 2004.
[13] B. Stojkovic and M. Vukasovic, “A new SCADA System design in the
PowerSystem of Montenegro – ICCP/TASE.2 andWeb-based real-time electricity
demand metering extensions”2006 IEEE.
[14] Ray Klump, Ph.D., Robert E. Wilson, Ph.D. Kenneth E. Martin, “Visualizing
Real-Time Security ThreatsUsing Hybrid SCADA / PMU Measurement Displays”
Proceedings of the 38th Hawaii International Conference on System Sciences –
2005.
[15] H. Lee Smith and Thomas J. Modzelewski “Enhancing Energy Management
Systems with Advanced RTU Capabilities” 0895-0156/89,1989 IEEE.
[16] Donald J.Marihart, “Communications Technology guidelines EMS/SCADA
System” IEEE Transactions on Power Delivery Vol.16, No.2, April 2001.
[17] Aamir, M., Mahmood, A., “Performance Analysis of Wide area operation,
control and protection using High Scale SCADA” Electric Power Conference,
2008. EPEC 2008. IEEE Canada.
[18] Joshua Mendoza-Jasso, Gerardo Ornelas-Vargas, Rodrigo Castañeda-Miranda,
Eusebio Ventura-Ramos, Alfredo Zepeda-Garrido, Gilberto Herrera-Ruiz.,
“FPGA-based real-time remote monitoring system” ScienceDirect International
Journal on Computers and Electronics in Agriculture, Volume 49, Issue 2,
November 2005, Pages 272–285.
[19] EASHY Yang, “Performance Evaluation and Design of Supervisory Control
and Data Acquisition (SCADA) Systems”. IEEE Transactions on Industrial
Electronics, Vol. IE-31, No. 4.
[20] Craig Cider and Michael Hauser “Real Time T&D Applications at Virginia
Power” 0895-0156/90/0700-0025,1990 IEEE.
[21] Bin Qiu, Yilu Liu, Eng Kiat Chan, Lawrence L.J. Cao, “LAN Based control
for load shedding”, IEEE Computer Applications in Power, July 2001, pp.1

100
[22] S.Premrudeepreechacharn, C. Pimpa, “Voltage control in power system using
expert system Based on SCADA system”, 2002, pp.1
[22] M. Kezunovic, J. McCalley, T.J. Overbye, “Smart Grids and Beyond:
Achieving the Full Potential of Electricity Systems,” Proceedings of the IEEE,
Special Centennial Issue, Vol.100, pp.1329-1341, May 13 2012.
[23] João Figueiredo, José Sá da Costa., “A SCADA system for energy
management in intelligent buildings” ScienceDirect International Journal on
Energy and Buildings, Volume 49, June 2012, Pages 85–98.
[24] Stuart A.Buyer, SCADA: Supervisory Control and Data Acquisition, 4th
Edition, North Carolina: ISA, 2010, pp. 9-21.
[25] Srinivas Medida, Industrial Automation Pocket Guide, 1st Edition, IDC
Technologies, 2007, pp. 118- 139.
[26] Paramasivam, S.; Thillainathan, L.; Zeynal, H.; Diana, N., "Cost-effective and
real-time SCADA home energy monitoring system," IEEE 8th International
Conference on Power Engineering and Optimization (PEOCO), vol., no., pp.585,
590, 24-25 March 2014.
[27] Vivaldi, A.; de Moraes, C.H.V.; de Almeida Costa, C.I.; Lambert-Torres, G.,
"Smart alarm and event processing," Power and Energy Society General Meeting,
2012 IEEE , vol., no., pp.1,8, 22-26 July 2012.
[28] Leitao, A.; Mota Pinto, C.; Santos, V.; Dias, P.; Viegas, P.; Marsh, D.;
Bizarro, P., "Smart alarm processing," Electricity Distribution (CIRED 2013),
22nd International Conference and Exhibition on , vol., no., pp.1,3, 10-13 June
2013.
[29] Apostolopoulou, D.; Sauer, P.W.; Domínguez-García, A.D., "Automatic
Generation Control and Its Implementation in Real Time," System Sciences
(HICSS), 2014 47th Hawaii International Conference on , vol., no., pp.2444,2452,
6-9 Jan. 2014.
[30] Zhu, Y.; Tomsovic, K., "Analysis and control of Distributed Energy
Resources," Power and Energy Society General Meeting, 2011 IEEE , vol., no.,
pp.1,6, 24-29 July 2011.

101
[31] Bolborici, D., "ExpDTS — Hybrid dispatcher training simulator expert system
for operator assistance and evaluation," PowerTech, 2009 IEEE Bucharest , vol.,
no., pp.1,5, June 28, 2009-July 2, 2009.
[32] IEC International Standard Guide for Transmission protocols – Companion
standard for basic tele-control tasks, IEC Standard 60870-5-101/103, 2003.
[33] IEC International Standard Guide for Transmission protocols – Companion
standard for basic tele-control tasks, IEC Standard 60870-5-104, 2003.
[34] IEEE Guide for Power-Line Carrier Applications, 2005, Power System
Communications Committee of the IEEE Power Engineering Society.
[35] Cherng, P.S. Fletcher, R, “SDH rings for distributed cross-connect
functionality” in Proc. 1993, Fourth IEE Conference on Telecommunications. pp.
109-114.
[36] Rados, I., "Availability of the optical bidirectional self-healing ring with four
fibers with the multiplex section protection," Software, Telecommunications and
Computer Networks, 2008. 16th International Conference on , vol., no.,
pp.362,369, 25-27 Sept. 2008.
[37] ITU-T Standard Guide for Transmission Series G: Transmission Systems and
Media Systems and Networks, ITU-T G.823, March. 10, 2000.
[38] Nagesh, D.Y.R.; Krishna, J.V.V.; Tulasiram, S.S., "A real-time architecture
for smart energy management," Innovative Smart Grid Technologies (ISGT),
2010, pp.1-4.
[39] Peter W. Sauer Karl E. Reinhard Thomas J. Overbye, “Extended Factors for
Linear Contingency Analysis” 34th Hawaii International Conference on System
Sciences – 2001.
[40] PowerWorld Corporation, “User’s Guide for PowerWorld Version 14, 2001,
South First Street Champaign, IL 61820.
[41] Tak Niimura, Satoshi Niioka, Ryuichi Yokoyama, “Transmission Loading
Relief Solutions for Congestion Management” Power Systems Research, Volume
67, Issue 2, November 2003.
[42] Grijalva, S.; Visnesky, A.M., Jr; “Visualizations for power system
contingency analysis data” IEEE Power Engineering Society General Meeting,
2005.

102
[43] The European Electricity Grid Initiative (EEGI) Roadmap 2010-18 and
Detailed Implementation Plan 2010-12, Brussels, May 25, 2010.
[44] E. Lobato, L. Rouco, M. I. Navarrete, R. Casanova and G. Lopez, “An LP-
based optimal power flow for transmission losses and generator reactive margins
minimization”, in Proc. of IEEE porto power tech conference, Portugal, Sept.
2001.
[45] M Aamir, MA Uqaili, S Amir, BS Chowdhry, F Rafique, J Poncela,
“Framework for Analysis of Power System Operation in Smart Cities”, Springer
Journal on Wireless Personal Communications, June 2014, Volume 76, Issue 3, pp
399-408.
[46] Bin Liu; Nan Jiang; Yan Zheng; Yuanwei Jing, "Simulation of cost optimal
control of the transmission congestion management in electricity systems,"
Control and Decision Conference (CCDC), 2011 Chinese , vol., no.,
pp.3610,3615, 23-25 May 2011
[47] Srivastava, S.C.; Kumar, P., "Optimal power dispatch in deregulated market
considering congestion management," Electric Utility Deregulation and
Restructuring and Power Technologies, 2000. Proceedings. DRPT 2000.
International Conference on , vol., no., pp.53,59, 2000.
[48] SNMP Tutorial, the Fast Track Introduction to SNMP Alarm Monitoring by
Marshall DenHartog, DPS Telecom. 4955 East Yale Avenue, Fresno, California
93727.
[49] Li, Hongyan & Sun, Junjie & Tesfatsion, Leigh S., 2009. "Separation and
Volatility of Locational Marginal Prices in Restructured Wholesale Power
Markets," Staff General Research Papers 13075, Iowa State University,
Department of Economics.
[50] Aamir, M, Poncela, J, Chowdhry, BS and Uqaili, MA. “Impact Analysis of
Renewable Energy in National Grids for Energy Deficit Countries”
Communications in Computer and Information Science, 1, Volume 281, Emerging
Trends and Applications in Information Communication Technologies, Pages 1-9.
[51] Aamir, M.; Uqaili, M.A.; Poncela, J.; Khan, N.A.; Chowdhry, B.S.,
"Implementation and testing of optimal design of RTU hardware for Wireless
SCADA", 4th International Conference on Wireless Communications, Vehicular

103
Technology, Information Theory and Aerospace & Electronic Systems (VITAE),
2014, pp.1-5.
[52] W.Bolton, Programmable Logic Controllers, 5th Edition, Elsevier Newnes,
2009, pp. 1-20
[53] James A. Regh, Glenn J. Sartori, “Programmable Logic Controllers”, Second
Edition, 2009, Prentice Hall.
[54] Scott Hauck, André DeHon, “Reconfigurable computing: the theory and
practice of FPGA-based computation”, Elsevier Newnes, 2008
[55] Spartan-3 Generation FPGA User Guide available at: www.xilinx.com,
UG331 (v1.8) June 13, 2011.
[56] Denis Collins, Eamon Lane, “Programmable Controllers: A Practical Guide”,
First Edition, 2000, McGraw-Hill Book Company.
[57] White paper on SCADA produced by Motorola, 2007.
[58] Wayne C. Turner and Steve Doty, “Energy Management Handbook”, 2007,
the Fairmont Press, Inc.
[59] Riccardo Manzini, Alberto Regattieri, Hoang Pham and Emilio Ferrari.
“Maintenance Information System and Failure Rate Prediction” Springer Series in
Reliability Engineering, 2010, Maintenance for Industrial Systems, Pages 189-
217.
[60] Yao Yupeng, “Design of Digital PLC Experimental Teaching System” Lecture
Notes in Electrical Engineering, 1, Volume 112, Engineering Education and
Management, Pages 361-366.
[61] Massimo Lazzaroni, Loredana Cristaldi, Lorenzo Peretto, Paola Rinaldi and
Marcantonio Catelani. “Reliability Prediction Handbooks: Evaluation of the
System Failure Rate” 2011, Reliability Engineering, Pages 77-83.
[62] Rabus, B., M. Eineder, A. Roth, R. Bamler, The shuttle radar topography
mission- a new class of digital elevation models acquired by spaceborne radar,
Photogramm. Rem. Sens., v. 57, p. 241-262, 2003.
[63] Mauricio G.C Resende and Panos M. Pardalos, Handbook of Optimization in
Telecommunication, Springer Science Plus Business Media, Inc., 2006

104
[64] IEEE Recommended Practice for Data Communications Between Remote
Terminal Units and Intelligent Electronic Devices in a Substation, IEEE Std 1379-
2000 (Revision of IEEE Std 1379-1997), 21 September 2000.
[65] Muhammad Aamir, Javier Poncela, Muhammad Aslam Uqaili, B. S.
Chowdhry, and Nishat Ahmad Khan. 2013. Optimal Design of Remote Terminal
Unit (RTU) for Wireless SCADA System for Energy Management. Wirel. Pers.
Commun. 69, 3 (April 2013), 999-1012. DOI=10.1007/s11277-013-1060-9
http://dx.doi.org/10.1007/s11277-013-1060-9
[66] Xilinx Spartan3E FPGA Datasheet, Available online at:
http://www.xilinx.com/support/documentation/data_sheets/ds312.pdf (last
accessed on 21-Oct- 2014).
[67] Diligent Spartan 3E Starter User Guide, Available online at:
http://www.digilentinc.com/Data/Products/S3EBOARD/S3EStarter_ug230.pdf
(last accessed on 21-Oct- 2014).
[68] Frederic Leens, An Introduction to I2C and SPI Protocols, IEEE
Instrumentation & Measurement Magazine, Feb 2009.
[69] Ken Chapman, “Amplifier and A/D Converter Control for Spartan 3E Starter
Kit, Xilinx Limited, 26th February 2006.
[70] Hansen, S.G.; Koch, D.; Torresen, J., "Simulation framework for cycle-
accurate RTL modeling of partial run-time reconfiguration in VHDL,"
Reconfigurable and Communication-Centric Systems-on-Chip (ReCoSoC), 2013
8th International Workshop on , vol., no., pp.1,8, 10-12 July 2013.
[71] Banerjee, S.; Gupta, T., "Design aware scheduling of dynamic testbench
controlled design element accesses in FPGA-based HW/SW co-simulation
systems for fast functional verification," Quality Electronic Design (ASQED),
2010 2nd Asia Symposium on , vol., no., pp.175,181, 3-4 Aug. 2010.
[72] Muralikrishna, B.; Madhumati, G.L.; Khan, Habibulla; Deepika, K.Gnana,
"Reconfigurable System-on-Chip design using FPGA," Devices, Circuits and
Systems (ICDCS), 2014 2nd International Conference on , vol., no., pp.1,6, 6-8
March 2014.

105
[73] Kudtongngam, J.; Tiwatthanont, P.; Lewlomphaisarl, U., "The development of
high performance Remote Terminal Unit using RT-Linux for distribution system,"
ICCAS-SICE, 2009 , vol., no., pp.5653,5657, 18-21 Aug. 2009
[74] Morgan, F.; Cawley, S.; Callaly, F.; Agnew, S.; Rocke, P.; O'Halloran, M.;
Drozd, N.; Kepa, K.; McGinley, B., "Remote FPGA Lab with Interactive Control
and Visualisation Interface," Field Programmable Logic and Applications (FPL),
2011 International Conference on , vol., no., pp.496,499, 5-7 Sept. 2011
[75] Gujare, Santosh; Jagtap, Gaurav; Gharpure, Damayanti; Ananthakrishnan, S.,
"FPGA based data acquisition and analysis system," Physics and Technology of
Sensors (ISPTS), 2012 1st International Symposium on , vol., no., pp.177,180, 7-
10 March 2012.
[76] Muralikrishna, B.; Madhumati, G.L.; Khan, Habibulla; Deepika, K.Gnana,
"Reconfigurable System-on-Chip design using FPGA," Devices, Circuits and
Systems (ICDCS), 2014 2nd International Conference on , vol., no., pp.1,6, 6-8
March 2014
[77] Arshak, Khalil; Jafer, E.; Ibala, C.S., "FPGA Based System design suitable for
Wireless Health Monitoring Employing Intelligent RF module," Sensors, 2007
IEEE , vol., no., pp.276,279, 28-31 Oct. 2007.
[78] “MHX-2400 2.4 GHz Spread Spectrum OEM Transceiver”, Operating
Manual, Revision 1.56, April 7, 2006, Microhard Systems Inc.
[79] K. Doerksen, J. F. Levesque, I. Mas, “Design, Modeling and Evaluation of a
2.4GHz FHSS Communications System for NarcisSat,” Proceedings of 17th
Annual AIAA/USU Conference on Small Satellites, SSC03-VII-3, Aug. 2003.
[80] White paper on SCADA produced by Motorola, 2007.
[81] Wayne C. Turner and Steve Doty, “Energy Management Handbook”, 2007,
the Fairmont Press, Inc.
[82] WebPHY™ DATABUS IP core Datasheet, Available online at:
http://www.webphyfpga.com/WebPHY_DATABUS.html (last accessed on 22-
Oct-2014).
[83] ABB Product line of 540 RTU for Grid Automation Solutions.

106
[84] NetGuardian RTU models with PoE, Available online at:
http://www.dpstele.com/dpsnews/poe_rtus_power_over_ethernet.php pdf (last
accessed on 21-ct- 2014).
[85] SmartFusion2 FPGA development kit, Available online at:
http://www.microsemi.com/products/fpga-soc/design-resources/dev-
kits/smartfusion2/smartfusion2-development-kit (last accessed on 21-ct- 2014).


