Smart Systems: Experts think tech-enhanced homes, appliances ...

Journal of Engineering Volume 23 March 2017 Number 3
61
Design and Implementation of Enhanced Smart
Energy Metering System
Dr. Oday A.L.A Ridha Dhurgham M. Jasim
Assistant professor
College of Engineering -Baghdad University College of Engineering -Baghdad University
Email: [email protected] Email: [email protected]
ABSTRACT
In this work, the design and implementation of a smart energy metering system has been
developed. This system consists of two parts: billing center and a set of distributed smart
energy meters. The function of smart energy meter is measuring and calculating the cost of
consumed energy according to a multi-tariff scheme. This can be effectively solving the
problem of stressing the electrical grid and rising consumer awareness. Moreover, smart energy
meter decreases technical losses by improving power factor. The function of the billing center
is to issue a consumer bill and contributes in locating the irregularities on the electrical grid
(non-technical losses). Moreover, it sends the switch off command in case of the consumer bill
is not paid. For implementation of smart energy meter, the microcontroller (PIC 18F45K22) is
used. For communication between billing center and smart energy meters, ZigBee technology
is adopted. The necessary program for smart energy meter is written in MicroC PRO, while the
program for billing center is written in visual C#.
Key words: smart energy meter, billing center, ZigBee, power factor correction
ةهطوس تطاقت ركي هنظوهت هقاييستصوين وتنفيز
ضشغام هحوذ جاسن أ. م. د. عذي عبذ اللطيف عبذ الشضا
والاحصالاث يتالانكخشو قغى انهذعت والاحصالاث يتهذعت الانكخشوانقغى
كهيت انهذعت/جايعت بغذاد كهيت انهذعت/ جايعت بغذاد
الخلاصت
في هزا انعم حى حصيى وحفيز يظىيت يقياط طاقت ركيت حخكى ي يشكض جبايت و يجىعت ي انقاييظ انزكيت
نهطاقت انىصعت. وظيفت يقياط انطاقت انزكي هي قياط وحغاب كيت انطاقت انغخههكت و حكهفخها وفق ظاو
جهاد عهى انشبكت انكهشبائيت وصيادة وعي انغخههك. اضافت انخعشفت انخعذدة. وهزا يغاهى بشكم فعال في حقهيم الا
حقهيم انخغائش انخقيت ي خلال ححغي عايم انقذسة. وظيفت يشكض انجبايت فيانى رنك يغاهى يقياط انطاقت انزكي
هي اصذاس فاحىسة انغخههك وانغاهت في انكشف وححذيذ يكا وجىد انخانفاث عهى انشبكت انكهشبائيت
ورنك انغخههك انى انقذسة انخاصت بقطع او حىصيم عاصاث لاياسعال اعهى يقىو ايضا كا خغائش غيش انخقيت(.ان)
. كا ( في حفيز يقياط انطاقت انزكيPIC18F45K22عخادا عهى دفع انفاحىسة. اعخخذو انغيطش انذقيق )ا
يظ انطاقت انزكيت. حج كخابت انبشايج كىعيهت احصال بي يشكض انجبايت ويقاي ZigBeeواعخذث حقيت ال
شكض انجبايت فخج انخاصت ب ( بيا انبشايج MikroC Proداخم انقياط انزكي بىاعطت نغت ) نهغيطش انذقيق
(.#Visual Cبىاعطت نغت ) اكخابخه

Journal of Engineering Volume 23 March 2017 Number 3
62
1. INTRODUCTION
Smart grid combines renewable energy with information technology to provide a quality power
for consumers. The existence of two-way flow energy and information between consumer and
provider enables a variety of advanced utility applications; such as energy management
services, advanced metering and reporting, power quality management, and many other
functions, RAHMAN, and MTO, 2011. Smart grid helps in decreasing the transmission and
distribution losses and improves power quality by managing the power consumption of the
consumer. Smart energy meter is considered essential component to smart grid that reduces
technical and Nontechnical losses, Pedro, 2009. It performs real time calculations of consumed
energy and its price according to a multi-tariff scheme to mitigate the problem of peak demand.
The problem of peak demand can be mitigated by increasing the number of power plants but
the disadvantage of this approach is not only the high cost but also increasing CO2 emission.
Onother approach to mitigate peak demand problem is applying a multi tariff in smart energy
meter for calculating the consumed energy, imposition punitive tariff at peak demand time
pushes the consumer for switching off unnecessary appliance at peak demand time, Depuru, et
al, 2011. There are two main methods for achieving multi tariff scheme, the first method is
done by receiving notification signal from billing center each time zone as in Anjana, and
Prasanna, 2014, but this way is inefficient when the number of consumers' nodes is increased
to a more realistic number. In this case, the network will suffer from high collisions and may
break down. Onother approach for achieving multi tariff scheme is done by smart energy meter
using real time clock (RTC) module, RTC module is used to keep track of time, support multi-
tariff scheme and it can be used to provide historical peak demand, in addition a RTC module is
used to determine the day of sending data to the billing center, a table of tariffs are stored in the
smart energy meter that can be updated by billing center via ZigBee. This method is more
expensive compared with the first method but it is efficient.
On other side, the network load is inductive, i.e., load contains inductive component such as air
conditioner, refrigerator, induction motor and etc. which causes poor power factor where up to
0.7 in summer in Iraq. Smart energy meter improves power quality by achieving residential
power factor correction (PFC). Residential PFC is becoming more popular in some regions of
the world. In 2001, a distributer of electrical energy in Peru performed a project to improve
power factor for a limited region including 26,000 households. It was found that improving
power factor from 0.84 to 0.93 led to saving of around 19, 300 MWh per year that means a cost
saving of close to 900,000$. The advantages of residential PFC go far beyond the energy
savings; because PFC reduces the current of loading that leads to reduce losses in transmission
line ( ) and increases the grid capacity, Alexandre, 2007. The proposed smart energy meter
achieved power factor correction based on developed algorithm and capacitors bank in order to
compensate reactive power, thus bringing power factor near to 0.95.
2. RELATED WORKS
With the development of electronic chips and programming languages, smart energy meters
evolved gradually with more hardware and software capabilities. So many researches have
been conducted to develop a general purpose of smart energy meter in both hardware and
software.

Journal of Engineering Volume 23 March 2017 Number 3
63
Smart energy meter was designed and develop to measure energy consumption by consumer
and send it to the service provider. Both ZigBee and GSM technologies are used to perform Bi-
directional communication between service provider and consumer. ZigBee technology is used
to transmit information from meter to the base station where the bill is calculated. GSM
network is installed at base station for messaging all consumers and service provider
employees, Vivek, and Ranthkenthiwar, 2014. Advanced metering infrastructure based on
power line carrier (PLC) is proposed to automatically collect information from different kinds
of meters. Energy consumption, water and gas can be measured by the meters and then data is
sent to the gateway through PLC. A gateway reads different data and communicates with data
acquisition center (DAC) through GSM. The gateway consists of two parts Neuron Core and
Transceiver. Transceiver is used to transfer data on the PLC while Neuron Core represents the
processing unit, Popa, 2011. Smart energy meter is designed and implemented to vehicle-to-
grid. This energy meter is interface between electric vehicles and smart grid. It is able to
measure bi-directional consumed energy, voltage and current. This energy meter also achieves
bi-direction measurement when the difference in phase angle between voltage and current
determines the direction of energy consumption, Libiao, et al, 2011. A remote meter-reading
system is designed to get data from the sensors and meters and control on the appliance in
residence area. The structure of this system consists of sensors, measure meters, intelligent
terminal, management center and wireless communication network. Bluetooth technology is
used to send and receive data and control signal between intelligent terminal and meters, while
GSM network is used to communicate between intelligent terminal and management center,
Liting, et al, 2006.
Automatic meter reading system based on GSM technology is implemented enables the
consumer to check the status of electricity from anywhere. It also enables utility to cut off and
reconnect the meter connection by SMS, Zahid Iqbal, 2014. Wireless sensor and actuator
network are implemented for monitoring the energy consumption of appliances in the home.
The structure of the network consists of energy measurement nodes and central server, the
central server displays the reading from measurement nodes via user interface in real time and
enables user to remotely power on or power off individual device. This system presents a
practical way to control the energy consumption in home, Edwin, et al, 2013. The prepaid
electricity meter is designed to be able to conduct money transactions remotely in order to
enable the consumer to recharge his account from home, besides; the proposed meter helps
utility companies to eliminate electricity theft, Sai, et al, 2014. A power factor corrector is
designed and implemented using PIC microcontroller, it can improve power quality by
compensating excessive reactive components. The system includes sensing and measuring
power factor value of the load. A proper algorithm is used to determine and trigger sufficient
capacitors to improve power factor, Nader, 2007.
In this paper, the proposed system provide a low cost smart energy meter, monitoring and
improving power quality by developing a proper algorithm, achieving multi tariff with proper
solution by using a dedicated IC (DS1307), bi-directional communication is achieved to ensure
sending and receiving data and commands between smart energy meter and billing center by
using ZigBee technology.

Journal of Engineering Volume 23 March 2017 Number 3
64
3. PROPOSED SMART METERING SYSTEM
The proposed system consists of two parts, smart energy meter for the consumer and the billing
center for the service provider.
3.1. Smart Energy Meter
Smart energy meter provides the real time measurement and calculation of amount and cost of
consumed energy and displays related information for consumer. When the inductive load
undermines power quality as result of poor power factor, the smart energy meter can improve
power quality by switching on the capacitors bank for continuously keeping the power factor of
the load near unity. Moreover, the smart energy meter can be used to detect the irregularities on
the electrical grid. Smart energy meter is composed of the analog unit, controller unit (PIC
microcontroller), real time clock and calendar (RTCC), liquid crystal display, wireless
communication module and capacitors bank. The hardware architecture of the proposed smart
energy meter is shown in the Fig.1.
3.1.1 Analog unit
Smart energy meter interfaces to the relatively high voltage while the acceptable input voltage
of PIC microcontroller is 5V, so the analog unit scales and converts the voltage and current to
voltages which are sufficiently small and cannot cause damage to delicate electronics. The
voltage of power line is usually 220 Vrms (-312 to 312 Vp-p), therefore it is scaled by the
voltage divider to a level and dynamic range is compatible with the analog to digital (ADC) of
PIC microcontroller, a low power consumption resistors are used to divide measured voltage.
The values of current are sensed by using current sensor IC (ACS712). ACS712 current sensor
is a precise, low offset, linear hall sensor circuit. Current sensor IC converts applying AC
current flowing through two of its pins into proportional voltage using integrated Hall IC.
3.1.2 Controller unit
The values sensed by the voltage and current sensors are provided to the analog channel of the
PIC microcontroller. The processing unit calculations of PIC microcontroller rescales all the
measurements by sensors to get the original value and performs all the power parameters
calculations. All the calculated values are displayed on display unit as shown in Fig.2. The
controller unit selected for smart energy meter design is the PIC18F45K22 microcontroller
from Microchip, due to it's multiple on-chip resources, low cost and suitable processing
accuracy that can reduce and simplify the design appropriately. PIC18F45K22 microcontroller
has 10 bit ADC with a multiple of channels. The multiplexer provides the capability of
connecting multi-analog signals to a single ADC. It has a multiple of timers that are used to
provide interrupt to notify the CPU every time interval. Regular interrupt is important to
execute a certain instructions at a certain time. This technique enables to create multitasking
easily which executes multiple application programs. The built-in serial port of the
microcontroller represents smart energy meter communication port. This is used with aid of
ZigBee module to send and receive data.

Journal of Engineering Volume 23 March 2017 Number 3
65
3.1.3 Real time clock and calendar (RTCC)
The proposed smart energy meter contains a tiny real time clock and calendar module (RTCC)
to keep track of time, support multi-tariff scheme and it can be used to provide historical Peak
demand, in addition a tiny RTCC module is used to determine the day of sending data to the
billing center. A tiny RTCC module is based on the chip DS1307 which supports the I2C
protocol. This tiny RTCC module provides seconds, minutes, hours, day, month, and year
information. The end of the month date is automatically adjusted for months with fewer than 31
days, including corrections for leap year. The clock operates in either the 24-hour or 12-hour
format with AM/PM indicator. A Tiny RTCC module contains Lithium cell battery (CR1225)
to save time and 56-Byte Nonvolatile (NV) RAM for data storage. A tiny RTCC module uses
the I2C bus to communicate with PIC microcontroller.
3.1.4 Power quality and size of capacitors bank.
Usually the network load is inductive, i.e., load contains inductive component. PFC removes
inductive component by adding (equal in magnitude) capacitive component through connecting
a capacitor. Due to the load of the home is varied, fixed capacitors is inappropriate to improve
the power factor and may led to overcompensation, so automatic switching of capacitors is a
good method of obtaining the full electrical benefits from a capacitor installation. In order to
calculate the amount of required capacitor compensation for improving power factor, an
effective algorithm for switching sufficient capacitors bank has been developed (in PIC
microcontroller).
In this work, PFC is performed in smart energy meter by using capacitors bank. The capacitor
banks consist of eight capacitors of different values, the values of these capacitors are chosen in
such away like the weight of binary digits representing a decimal number. These values are
128, 64, 32, 16, 8, 4, 2 and 1 ㎌as shown in Fig.3. The value of chosen capacitors provide a
high value of micro farad reach to 255 ㎌, so the number of capacitors can be reduced
according to the expected loads in each and individual home.
4. BILLING CENTER
The main function of the billing center as the name implies is to bill consumers according to
the amount of consumed energy. It receives a consumption data from the smart energy meter
which represent the amount and the cost of the consumed energy to issue a consumer bill and
the other measurements to give a good estimate of the grid status. Moreover, the billing center
can send the commands of switching on or off the electrical power. It sends the switch off
command when the bills are not paid, and it sends the switch on command when the bills are
paid.
Detection and localization of a faulty meter, irregularities on the electrical grid, and leakages
can be determined at billing center by using a master meter with each group of home meters. A
difference between the power reading of the master meter of the group and the summation
power of individual home meters within the same group means either one or more meters are
faulty, or there is an irregularity, or a leakage in the electrical grids.

Journal of Engineering Volume 23 March 2017 Number 3
66
The billing center is implemented by using personal computer (PC), communication transceiver
(ZigBee module) and the interfacing circuit which is used to establish the proper connection
between the communication transceiver and the personal computer as shown in Fig.4. The
transceiver used in the billing center is the same as in the smart energy meter. The difference in
the two ZigBee modules is in the addresses in the network and some of setting which makes the
billing center represents a coordinate, while smart energy meter represent node. The data from
the meters is received through ZigBee module then sends it to PC.
5. SOFTWARE DESIGN OF THE PROPOSED SYSTEM
The software used in the proposed metering system consists of two parts; first part is executed
in smart energy meter whereas the second part is executed in the billing center.
5.1 Software of the Smart Energy Meter
The software of smart energy meter is responsible for initializing and managing the operation
and interaction among hardware modules of the smart energy meter. The software operations of
the smart energy meter are illustrated in the flowchart of the main program shown in Fig.5 and
the flowchart of interrupt service routine shown in Fig.6. Interrupt service routine (ISR) occur
once every 2 msec in order to sample voltage and current at regular time. ISR ensures that the
sampling rate (Fs) to be 500 Hz which provides 10 samples per cycle. ISR is also responsible
for the flags condition. Flags conditions are required for executing the operations in the main
program as shown in Fig.6. First, for sampling rate (Fs) and N samples of the power line
source, the RMS voltage can be calculated by using Eq. (1).
√∑
Where N is the number of samples, is the sampled voltage.
As mentioned early the voltage of power line is scaled to level that is compatible with delicate
electronics, so the measured value must be rescaled to the engineering value (actual voltage) in
the processing unit calculations. To do so, the sampled voltage in Eq. (1) multiplies by voltage
proportionality constant for the circuit design ( ) as shown in Eq. (2).
√∑
The time taken to calculate the RMS voltage can be reduced by modifying Eq. (2) to Eq. (3):

Journal of Engineering Volume 23 March 2017 Number 3
67
√∑
Where
√
The divisions and multiplications are reduced to one operation in Eq. (3) for each RMS voltage
calculation. In this Eq. (3), T can be calculated offline.
The same above procedure is used for RMS current and energy calculations using Eq. (4) and
Eq. (5), respectively.
√∑
∑
where is sampling frequency and is ith
sampled of the current.
The second part of the program represents subroutine for displaying where the parameters on
the screen are updated every 1 sec.
The third part of program is responsible for measuring and correcting power factor of the load
where the smart energy meter enters this subroutine every 3 seconds. The flowchart shown in
Fig.7 illustrates the operations of power factor correction.
The power factor (PF) of the load can be calculated by dividing the active power (P) by
apparent power (S), when the PF of the load is equal to 0.9 or more, no need to add capacitors
to the load, if the PF of the load is less than 0.9, the processing unit of PIC microcontroller
calculates the desired capacitances to improve the power factor of the load.
The reactive power utilized in the load ( 𝑎𝑟𝐿) is calculated as:
𝑎𝑟 √
In order to improve PF to 0.95, new reactive power is calculated as:

Journal of Engineering Volume 23 March 2017 Number 3
68
𝑎𝑟
: The phase angle between voltage and current that is chosen for obtaining PF=0.95.
Now, the reactive power is required to compensate 𝑎𝑟 :
𝑎𝑟 𝑎𝑟 𝑎𝑟
The required capacitors to improve power factor to be 0.95 is
𝑎𝑟
After calculating the required capacitances, the control unit sends control signal to the relay
unit to connect the required capacitors.
The last part of the program is responsible for sending data to the billing center which is
executed every month. The accumulated amount of consumed energy and the cost are delivered
to the billing center.
During its operation, the smart energy meter checks whether there is a command message from
the billing center that requests switching on or off the building as shown in flow chart of
interrupt service routine in Fig.6.
In order to perform the functions of the smart energy meter, the control unit is programmed
with MikroC PRO programming language.
5.2 Software of the Billing Center
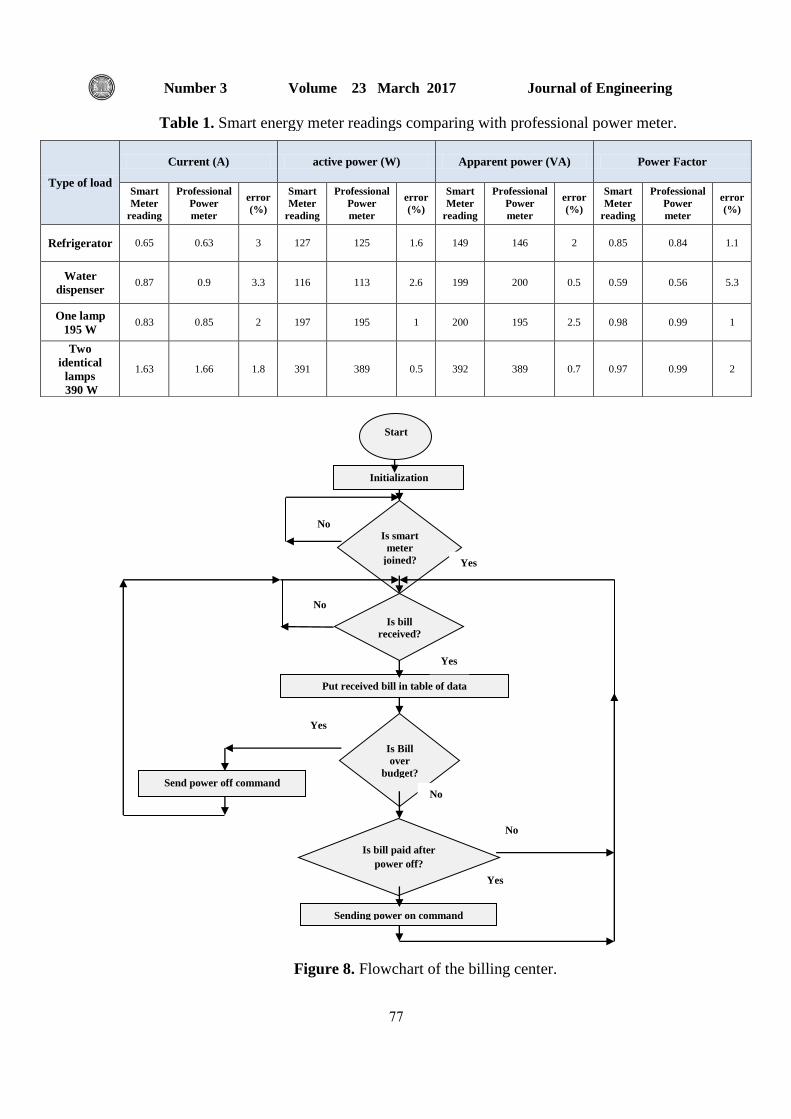
The flowchart in Fig.8 shows the methodology of performing billing center functions.
1. First the billing center enters the initialization routine, in which:
The transceiver communication module parameters are initialized.
Communication network is established.
Smart energy meters are joined to the network.
2. Second, after receiving the data, the billing center creates a table that stores the data and
indicates the current status of the each consumer.
3. Third, the billing center sends command signal to the smart energy meter to reset energy
counter.

Journal of Engineering Volume 23 March 2017 Number 3
69
4. Forth, the billing center checks the budget and the bill of the consumer, where it has
ability to send a command to the smart energy meter for switching the power on or off at
any time.
Any failure in communication between the billing center and the smart energy meter is
unacknowledged and retransmitted. The programming language Visual C# is used to create a
GUI for the billing center to facilitate the operation of the billing and controlling the status of
the consumer, Fig.9 shows the GUI for billing center. The table in the bottom left of the
figure is related to the multi-tariff and the time zones, where the rectangles labeled
''Currently'' indicate the current time zone and tariff. The text boxes "Time zone" indicate the
duration of the time zone, where all the four time zones, in this work, has the same period (6
hours). The text boxes "Price" indicate the price of consumed energy in the corresponding
time zone. It must be mention that the price must be proportional to the energy demand.
6. MEASUREMENT ERRORS
Reducing the error to the minimum possible level in any measurement system is extremely
important. Instrumental error is a common source of the measurement errors that are inherent in
manufacture of an instrument. It arises due to the operation principle of instrument such that
arises in the analog to digital convertor (ADC), Morris, 2001. The accuracy of ADC has an
effect on overall measurement system performance and efficiency. Systematic errors arise in
ADC due to the sampling operation, STMicroelectronics, 2003, the effect of sampling error
( ) in power measurement is inversely proportional to the sampling frequency, sampling errors
can be calculated as shown in the equation below, Gerard, 1984:
Where
, , samples interval in
radian, N : number of samples.
Quantization errors affect measurement accuracy in sampled-data-acquisition systems. Mean
square value of error quantization is
Where
, is amplitude value of signal, n is number of bit, It is also known as
successive approximation register.
And

Journal of Engineering Volume 23 March 2017 Number 3
70
It is clear from the Eq. (12) that the error caused by quantization is reduced when the resolution
of ADC (n) increases, Istevan, 1985. In this research the proposed smart energy meter: fs =500
Hz, N= 25, n = 10 bit. The accuracy is proportional to the number of taken energy samples per
period, where a number of eight samples per period (fs =400) of the power line give a
percentage of error of less than 1%. The total errors due to the sampling process and
quantization can be calculated by adding the two errors together.
Limiting error is considered another type of measurement error that arises in electrical circuit
due to the tolerance in the circuit components such as resistors, capacitors, etc. This error can
be reduced by choosing components with low tolerance. For precise measurement systems, the
error in passive components is compensated using calibration. Calibration here means applying
a signal with a known value then adjusts the meter (resistors or parameters) until getting
compatibility between the signal value and the meter’s reading. This calibration may
implemented by the hardware or software, Microchip, 2005.
The temperature coefficient of circuit components must be taken into account in the design and
implementation of the smart energy meter, especially in the case of device works in extremely
hot conditions, as in Iraq.
7. IMPLEMENTATION AND TESTING
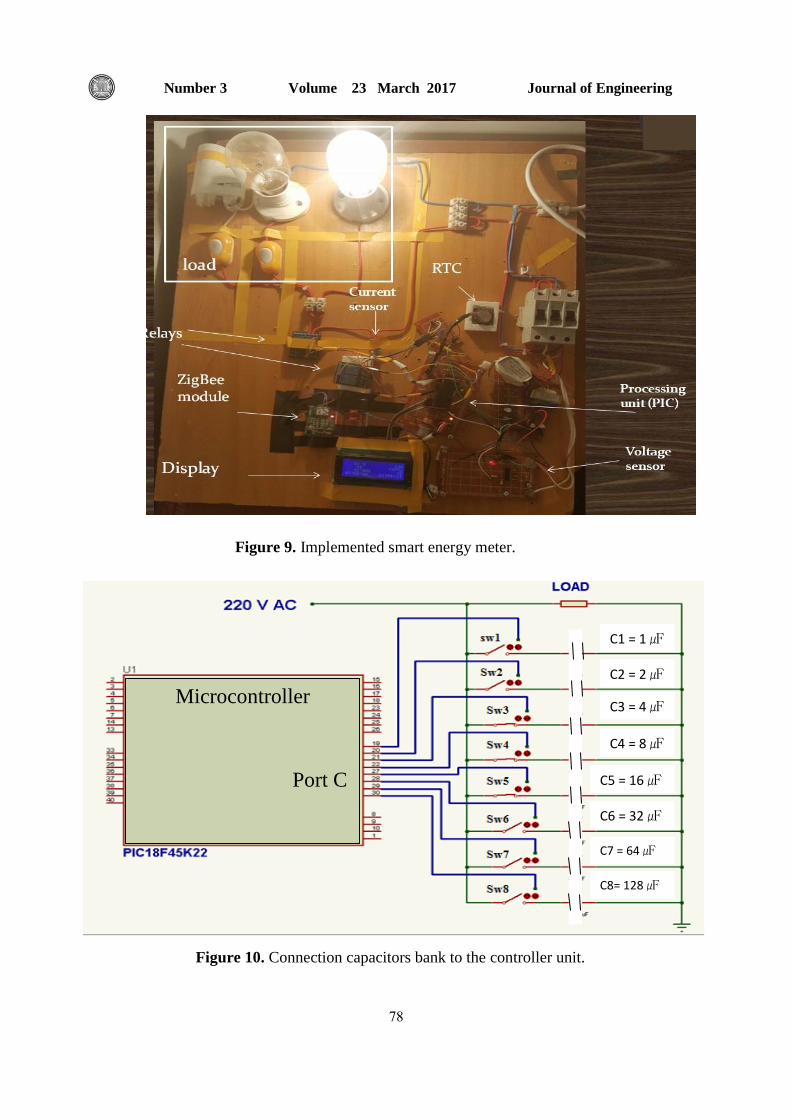
Fig.10 shows the Proteus simulation of smart energy meter. Voltage and current sensor of
smart energy meter are connected to the resistor and inductor load which are connected in
series to measure all power parameters, and then trying to correct power factor by using
capacitors bank.
The smart energy meter is tested in real scenarios by using real loads as shown in Fig.11, where
the smart energy meter is connected to some of household appliance to test different cases of
the loads, the accuracy of the smart energy meter readings were compared with the professional
power clamp meter as shown in Table 1. The measurement values by analog unit are given to
the PIC microcontroller, and then displaying on LCD screen. The readings that are displayed on
LCD are compared with that are received in billing center. The connecting and disconnecting
of smart energy meter to the wireless network is also checked.
8. CONCLUSIONS
The characteristics of the metering system are investigated and there are several facts that had
become clear when testing overall implemented system. These facts are: firstly, implementation
of smart metering system can be constructed in Iraq by using available local market
components. Secondly, smart metering system can play an important role in increasing the
consumers’ awareness through displaying instantaneous power consumption and its cost.
Moreover, the system can effectively improve power factor of electrical grid. Increasing
consumers’ awareness and improving power factor can effectively reduce wasted energy and
consequently ensure reliable power supply. Thirdly, ability of real time calculating of the
consumed energy and its cost enables implementing a multi tariff scheme. This scheme cannot
be achieved in a traditional meter. Finally, the smart metering system can be effectively detect
and locate irregularities on the electrical grid and a malfunction smart energy meter(s).

Journal of Engineering Volume 23 March 2017 Number 3
71
9. REFERENCES
Anjana Shree M, Prasanna Vadana D, 2014, Smart Meter for Power Factor
Enhancement in Real Time. International Conference on Embedded Systems,
IEEE, Vol.3, No.14.
Alexandre José, 2007,Homecap: Residential Power Factor Correction, TDK
EPCOS Worldwide Company, Peru, Application Note.
Cao Liting, Tian Jingwen, And Zhang Dahang, 2006. Networked Remote
Meter-Reading System Based On Wireless Communication Technology,
International Conference on Information Acquisition, Shandong, China,
IEEE, No. 6, pp. 172-176, August .
Edwin Chobot, Daniel Newby, Renee Chandler, 2013.
Design And Implementation Of A Wireless Sensor And Actuator Network For
Energy Measurement And Control At Home.International Journal of
Embedded Systems and Applications, Vol. 3, No. 1, pp. 1-15, March .
Gerard N. Stenbakken, 1984. Wideband Sampling Wattmeter, IEEE, Vol. 103,
No. 10, pp. 2919-2926, October .
H. M. Zahid Iqbal, M. Waseem, 2014. Automatic Energy Meter Reading using
Smart Energy, Conference paper, IEEE, Vol. 1, No. 11.
Istevan Kollar, 1985.Programming Error introduced by digital power/energy
measurement. International Journal of Technical University of Budapest, pp. 1-7.
Libiao Qiao, Xiaojun Liu, 2011. Design and Implementation of the Smart
Meter in Vehicle-to-Grid, ,International Conference on electric utility and
power technology, IEEE, Vol. 2, No. 11, pp. 618-621, August .
MD M RAHMAN, and AMANULLAH MTO, 2011. Technologies Required
for Efficient Operation of a Smart Meter Network, Conference on industrial
electronics and application, IEEE Vol.3, No.8, PP.125-130.
Microcontroller Division Applications, 2003. UNDERSTANDING AND
MINIMISING ADC CONVERSION ERRORS, STMicroelectronics Technology
Inc., U.S.A., Application Note.
Pedro Antmann, 2009. Reducing Technical And Non‐Technical Losses In The
Power Sector, The Energy Unit Of The World Bank, Background Paper.
Popa Mircea, 2011.Smart Meters Reading Through Power Line
Communications, Journal Of Next Generation Information Technology, Vol.
2, No. 3, pp. 92-100, August.
Reddy, Sreenadh,Soma Shekara Depuru, Lingfeng Wang, And Nikhil Gudi,
2011.Smart Meters For Power Grid – Challenges,Issues, Advantages And
Status, ELSEVIER, No. 11, pp. 1-7.

Journal of Engineering Volume 23 March 2017 Number 3
72
R. Barsoum Nader, 2007.Programming of PIC Micro-Controller for Power
Factor Correction, In International Conference on Modeling & Simulation,
Malaysia.
Sai Kiran Ellenki 1 , Srikanth Reddy G 2014 . An Advanced Smart Energy
Metering System for Developing countries , International Journal Of Scientific
Research And Education, Vol. 2, No. 1, pp. 242-258.
S., Morris Alan, 2001. Measurement and Instrumentation Principles, Third
Edition Ed.: ELSEVIER.
Sandip chattopadhyay, 2005. Designing Energy Meters with the PIC16F873A,
Microchip Technology Inc., U.S.A., Application Note.
Vivek A. Dongre And Prof. A P. Rathkanthiwar., 2014. Zigbee And Gsm
Based Wireless Meter With Tamper Detection And Control System,
International Journal of engineering research and application, International
Conference on Industrial Automation and Computing (ICIAC-12-13th) pp.
37-48, April.

Journal of Engineering Volume 23 March 2017 Number 3
73
Voltage
Current
Control Unit
LCD displa
y
Zigbee modul
e
Analog unit
Load
N L
Capacitor bank
Switch RTCC
Battery
Figure 1. Block diagram of smart energy meter.
Figure 2. Two page of smart energy meter's LCD screen.

Journal of Engineering Volume 23 March 2017 Number 3
74
Figure 3. Flowchart of main program of smart energy meter.
start
Initialization
Read t
Has 0.5
Sec
Elapsed?
Calculating all the power parameters, Energy and cost according to the zone ID. Flag1=0
No Yes
Has 1 Sec
Elapsed?
Updating display, Flag2=0
No Yes
Has 3 Sec
Elapsed?
Power factor calculation and correction, Flag3=0
No Yes
Has
Month
Elapsed?
Sending data to billing center, Flag4=0
No Yes

Journal of Engineering Volume 23 March 2017 Number 3
75
Figure 4. Flowchart of interrupt service routine.
Interrupt service routine
Sample voltage and
current
Have 250
samples been
Increment Counter1
Counter1 =2
(1 Sec)
Counter1 =0, Increment counter2
Counter2=0
Counter2 =3
(3 Sec)
Has Month
Elapsed?
Flag4=1
Off
Command
Power off
command
Return
from
Y
N
Y
Y
N
N
Y
N
Y
N

Journal of Engineering Volume 23 March 2017 Number 3
76
Figure 6. The GUI of the billing center.
Figure 7. Flowchart of power factor correction.
Calculating power factor
Is PF > 0.9
No power factor correction(C=0)
Calculating reactive power
Calculating desired value of capacitor (C) to PF correction
Return
Yes
No
Figure 5. Block diagram of the billing center.
Processing Unit (PC) USB / UART
converter
Communication
transceiver
Journal of Engineering Volume 23 March 2017 Number 3
77
Type of load
Current (A) active power (W) Apparent power (VA) Power Factor
Smart
Meter
reading
Professional
Power
meter
error
(%)
Smart
Meter
reading
Professional
Power
meter
error
(%)
Smart
Meter
reading
Professional
Power
meter
error
(%)
Smart
Meter
reading
Professional
Power
meter
error
(%)
Refrigerator 0.65 0.63 3 127 125 1.6 149 146 2 0.85 0.84 1.1
Water
dispenser 0.87 0.9 3.3 116 113 2.6 199 200 0.5 0.59 0.56 5.3
One lamp
195 W 0.83 0.85 2 197 195 1 200 195 2.5 0.98 0.99 1
Two
identical
lamps
390 W
1.63 1.66 1.8 391 389 0.5 392 389 0.7 0.97 0.99 2
Table 1. Smart energy meter readings comparing with professional power meter.
Figure 8. Flowchart of the billing center.
No
Start
Initialization
Is smart
meter
joined?
Is bill
received?
Put received bill in table of data
Is Bill
over
budget? Send power off command
Is bill paid after
power off?
Sending power on command
Yes
Yes
No
No
Yes
Yes
No
Journal of Engineering Volume 23 March 2017 Number 3
78
Figure 9. Implemented smart energy meter.
Figure 10. Connection capacitors bank to the controller unit.
Microcontroller
Port C
C1 = 1 ㎌
C2 = 2 ㎌
C3 = 4 ㎌
C4 = 8 ㎌
C5 = 16 ㎌
C6 = 32 ㎌
C7 = 64 ㎌
C8= 128 ㎌

Journal of Engineering Volume 23 March 2017 Number 3
79
Cap
acit
or
Ban
k
Mic
roco
ntr
olle
r
P
ort
C
Fig
ure
11. P
rote
us
sim
ula
tion o
f sm
art
ener
gy m
eter
.