Deriving household indebtedness indicators by linking ... · 4 Deriving Household Indebtedness...
35
IFC workshop on “Combining micro and macro statistical data for financial stability analysis. Experiences, opportunities and challenges” Warsaw, Poland, 14-15 December 2015 Deriving household indebtedness indicators by linking micro and macro balance sheet data 1 Ilja Kristian Kavonius, European Central Bank Juha Honkkila, Statistics Finland 1 This paper was prepared for the meeting. The views expressed are those of the authors and do not necessarily reflect the views of the BIS or the central banks and other institutions represented at the meeting.
Transcript of Deriving household indebtedness indicators by linking ... · 4 Deriving Household Indebtedness...

IFC workshop on “Combining micro and macro statistical data for financial stability analysis. Experiences, opportunities and challenges”
Warsaw, Poland, 14-15 December 2015
Deriving household indebtedness indicators by linking micro and macro balance sheet data1
Ilja Kristian Kavonius, European Central Bank
Juha Honkkila, Statistics Finland
1 This paper was prepared for the meeting. The views expressed are those of the authors and do not necessarily reflect the views of the BIS or the central banks and other institutions represented at the meeting.
Deriving Household Indebtedness Indicators by Linking Micro and Macro Balance Sheet Data 1
Deriving Household Indebtedness Indicators by Linking Micro and Macro Balance Sheet Data1
Ilja Kristian Kavonius, European Central Bank
Juha Honkkila, Statistics Finland
Abstract
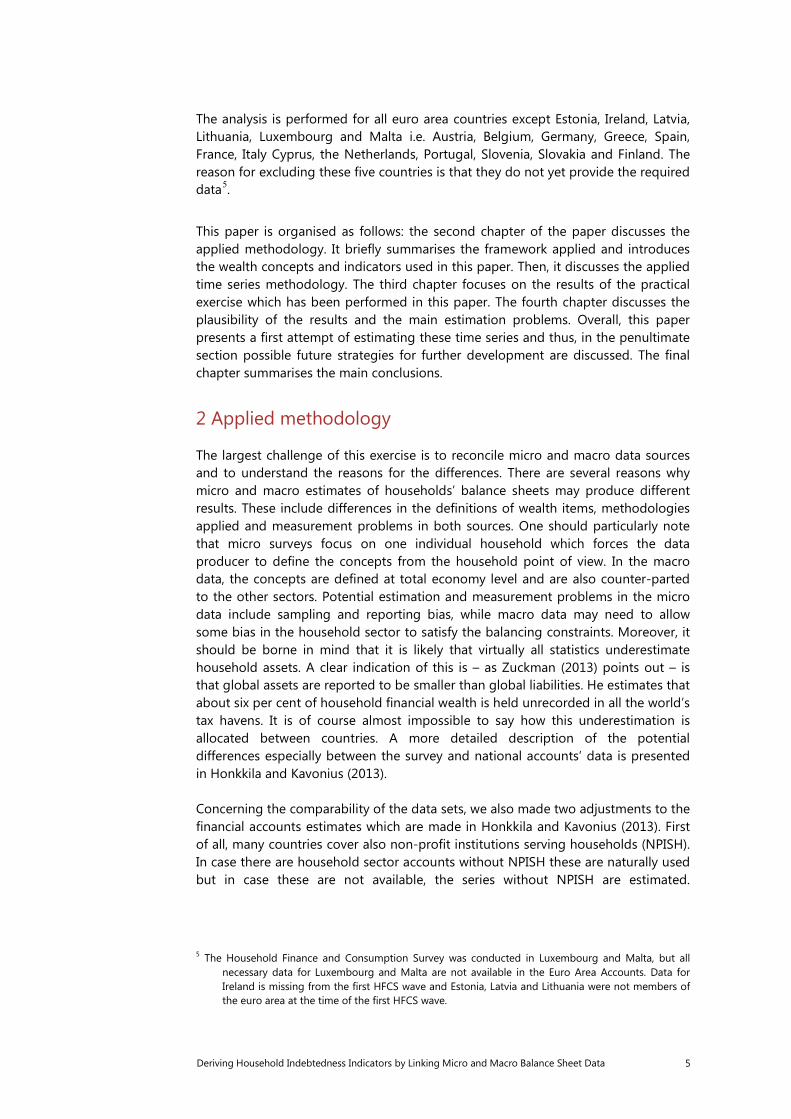
Since 2008, when the U.S. subprime mortgage crisis triggered the financial crisis, financial stability analysis has been increasingly interested in the leverage and indebtedness of households along with the vulnerability of different household groups. The reason for this interest is that the household balance sheet and thus, also their risks, are typically analogous with those of financial institutions. This was seen in the subprime crisis and is a source of macro-prudential systemic risk. Moreover, several reports, for example the IMF/FSB report to the G-20 Finance Ministers and Central Bank Governors concerning data gaps2, emphasise the need for household data which is broken down by different household types. However, none of the reports specify how, in practice, the accounts should be used.
This paper uses the micro-macro linkage of wealth and income accounts and thus creates a set of macroeconomic wealth accounts broken down by household groups, using micro data available at the national level. The paper discusses the methodical and data source limitations of having a full set of accounts. Due to these limitations, it applies a hybrid concept - a mixture of national accounts and survey approaches. The aim of the project is to derive a framework where indebtedness indicators can be optimally estimated in a timely manner and at a quarterly frequency. This paper makes the first attempt to estimate annual time series and highlights problems related to time series estimation and suggests how these estimations could be developed further.
Keywords: wealth distribution, income distribution, wealth survey, national accounts, balance sheets, micro-macro link, indebtedness, household debt, household leverage
JEL classification: E21, E01, D14, D31
1 The views expressed are those of the authors and do not necessarily reflect the views or policy the
European Central Bank (ECB) or Statistics Finland.
The authors wish to thank Andrew Kanutin, Marshall Reindorf, Roberto Rosales and Peter van de Ven for providing helpful comments without implicating them for any remaining errors.
2 IMF/FSB report to the G-20 Finance Ministers and Central Bank Governors.

2 Deriving Household Indebtedness Indicators by Linking Micro and Macro Balance Sheet Data
Contents
1 Introduction .................................................................................................................................. 3
2 Applied methodology............................................................................................................... 5
3 The results of the estimation ................................................................................................. 8
Debt to income and financial leverage ...................................................................... 10
Leverage ratios ..................................................................................................................... 10
Impact of the crisis ............................................................................................................. 11
4 Plausibility of results................................................................................................................ 13
5 Conclusions ................................................................................................................................. 19
References ....................................................................................................................................... 21

Deriving Household Indebtedness Indicators by Linking Micro and Macro Balance Sheet Data 3
1 Introduction
Since 2008, when the U.S. subprime mortgage crisis triggered the current financial crisis, there has been increasing emphasis on financial stability analysis. The analysis has focused not only on the banking balance sheets but also the balance sheets of other economic sectors (counter-part sectors) and on capturing a risk of insolvency as well as to understand how potential shocks caused by insolvency would be transmitted through balance sheets to the other agents in economy (see for instance: Castrén and Kavonius 2013). The central role of specific household groups in triggering the crisis also increased central banks’ interest in distributional issues. One of the several reflections of this is that the European Central Bank President Mr. Mario Draghi emphasised, in his speech held on 14 May 2015 in Washington DC, that monetary policy inaction has clear distributional effects. Additionally, monetary policy always has distributional consequences.
So far, this type of analysis has been limited by data availability. There have been several high-level initiatives like ‘the IMF/FSB report to the G-20 Finance Ministers and Central Bank Governors’ and ‘the Report on the Measurement of Economic Performance and Social Progress’ by Stiglitz, Fitoussi and Sen which suggest developing macroeconomic accounts covering household consumption, income and wealth broken by different household types. This would allow timely analysis of the distributional aspects of income, consumption and wealth. Thomas Piketty’s (2014) book on Capital in the Twenty-First Century also emphasised the importance of distributional analysis. From this point of view, it can be said that the interests of two rather different worlds: monetary and financial stability as well as social fairness are motivating the analysis of household indebtedness.
These reports have been acted upon by several European and international groups. In order to establish the micro-macro linkage and disparities in national accounts, the OECD and European Commission established an Expert Group on Disparities in National Accounts investigate this linkage and other possible ways to disaggregate national accounts. The first group has now finished its work. Subsequently the OECD has decided to continue its work on income, consumption and saving. However, the expansion of the mandate to wealth was considered to be too extensive. The new group covers two areas of work: (1.) improving the consistency of the estimates, and (2.) trying to develop a methodology to arrive at more timely estimates by extrapolating short term macroeconomic data.
Independent of these international initiatives, there are, and have been in the past, a number of independent initiatives investigating the linkage between micro and macro statistics. The focus has been mostly on income and consumption and the motivation has been to understand the differences between the two sources and thus analyse the reliability of the two statistics or to alternatively, create macroeconomic accounts by household type. From the wealth point of view Henriques and Hsu (2012) have recently written a paper on the linkage between the Survey of Consumer Finances and Flows and of Funds Accounts in the U.S. It discusses the coverage issues of these two statistics and how well they are matching by analysing the time series. Additionally, Antoniewich (2000) has compared the household sector in the U.S. flows of funds statistics and the Survey of Consumer of

4 Deriving Household Indebtedness Indicators by Linking Micro and Macro Balance Sheet Data
Finances. A similar data evaluation is undertaken by Avery, Ellienhausen and Kennickell (1988) in their article. Analyses using European data are considerably rarer as this type of data is relatively new in Europe. Antoniewicz et al. (2005) have investigated the linkage in Cyprus, Canada, Italy and the United States. Also Durier and Lucile (2012) have recently investigated the micro and macro sources for French wealth data.
The purpose of this paper is to develop a framework in which timeliness of national accounts and some of detail of the Household Finance and Consumption Survey (HFCS) is integrated within the same framework. As for central banks, indebtedness and the breakdown of indebtedness is an important tool that can be used to define policy reactions. This paper does so by focusing on the indebtedness measures, i.e. to estimate debt to income, leverage (debt to assets) and financial leverage (debt to financial assets) ratios by household type. These are typical measures that are also used in the analysis of macroprudential policies3. The adopted approach is different, for instance, from the one taken by the OECD which develops a complete accounting framework covering time series for consumption and income. In this paper we apply a micro-macro linkage framework which was also presented in Honkkila and Kavonius (2013) and Kavonius and Honkkila (2013) where the linkage between Household Finance and Consumption Survey (HFCS) and Euro Area Accounts (EAA) is analysed.4 This linkage is used here to derive these indicators at an annual frequency but, in the future, this framework could be used to have quarterly indebtedness indicators. The advantage of the approach is that it would allow the estimation of timely data rather than having to wait for the whole framework broken down by household types. However, as will be discussed later in this paper, both approaches have similar problems such as having stable time series. Therefore, this paper discusses also how these kinds of estimators could be further developed.
This framework is done mostly for the purpose of macroprudential policy analysis and to allow the analysis of indebtedness in different types of households. From the macroprudential and monetary policy point of view, there are two main arguments for this type of data. First, this framework would allow timely distributional data. The nature of the monetary and macroprudential policies is such that timely information on potential risks in different household groups is required. As also shown by the U.S. subprime mortgage crisis, the macroeconomic aggregates often hide risks and potential problems. These data already exist but unfortunately the survey data are typically published with a time lag of a few years. Second, these types of accounts also help to understand different reactions of the household to the macroprudential and monetary policy analysis overall. The risk transmission and the risk of the households depend a lot on the households’ income and portfolio and correspondingly, this affects how the households react as a result of different economic stimuli.
3 See for instance: ECB (2015). Bi-annual Financial Stability Review uses the indebtedness measures in the
standard macroprudential analysis. 4 Ampudia, Pavlickova, Slaclek and Vogel (2014) have used similar kind of framework to update the HFCS
data and they applied it in the analysis of household heterogeneity in the euro area during the recession.
Deriving Household Indebtedness Indicators by Linking Micro and Macro Balance Sheet Data 5
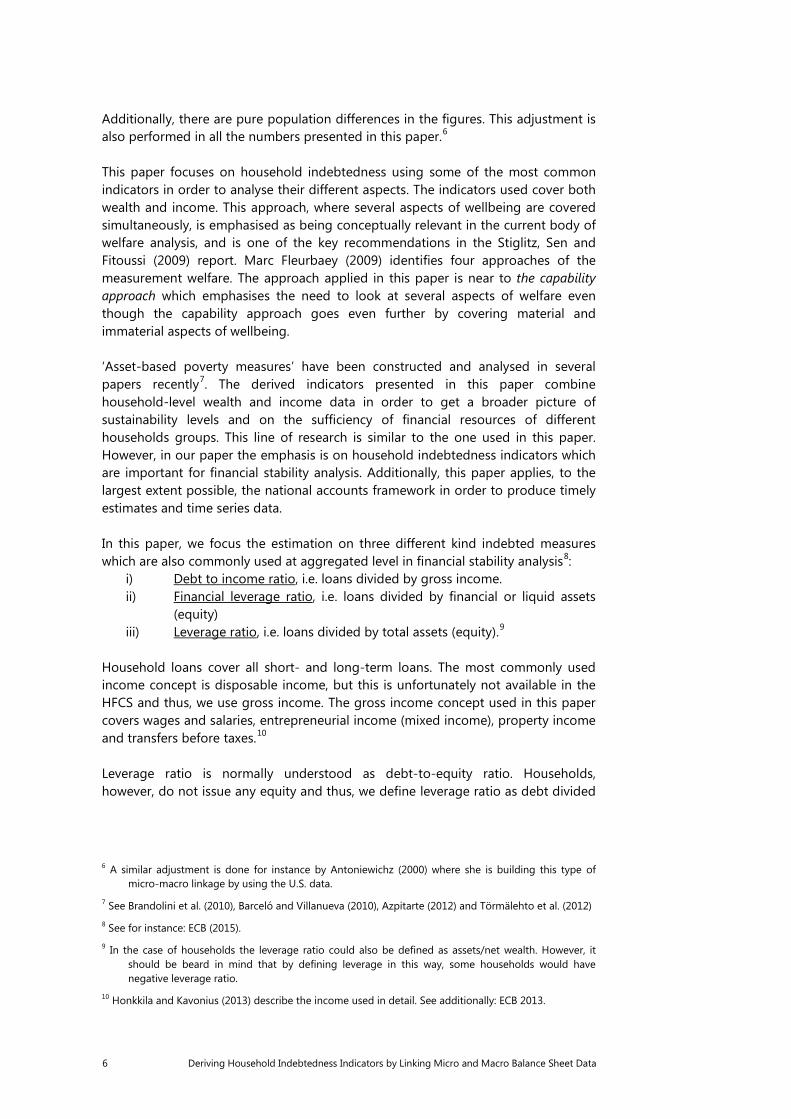
The analysis is performed for all euro area countries except Estonia, Ireland, Latvia, Lithuania, Luxembourg and Malta i.e. Austria, Belgium, Germany, Greece, Spain, France, Italy Cyprus, the Netherlands, Portugal, Slovenia, Slovakia and Finland. The reason for excluding these five countries is that they do not yet provide the required data5.
This paper is organised as follows: the second chapter of the paper discusses the applied methodology. It briefly summarises the framework applied and introduces the wealth concepts and indicators used in this paper. Then, it discusses the applied time series methodology. The third chapter focuses on the results of the practical exercise which has been performed in this paper. The fourth chapter discusses the plausibility of the results and the main estimation problems. Overall, this paper presents a first attempt of estimating these time series and thus, in the penultimate section possible future strategies for further development are discussed. The final chapter summarises the main conclusions.
2 Applied methodology
The largest challenge of this exercise is to reconcile micro and macro data sources and to understand the reasons for the differences. There are several reasons why micro and macro estimates of households’ balance sheets may produce different results. These include differences in the definitions of wealth items, methodologies applied and measurement problems in both sources. One should particularly note that micro surveys focus on one individual household which forces the data producer to define the concepts from the household point of view. In the macro data, the concepts are defined at total economy level and are also counter-parted to the other sectors. Potential estimation and measurement problems in the micro data include sampling and reporting bias, while macro data may need to allow some bias in the household sector to satisfy the balancing constraints. Moreover, it should be borne in mind that it is likely that virtually all statistics underestimate household assets. A clear indication of this is – as Zuckman (2013) points out – is that global assets are reported to be smaller than global liabilities. He estimates that about six per cent of household financial wealth is held unrecorded in all the world’s tax havens. It is of course almost impossible to say how this underestimation is allocated between countries. A more detailed description of the potential differences especially between the survey and national accounts’ data is presented in Honkkila and Kavonius (2013). Concerning the comparability of the data sets, we also made two adjustments to the financial accounts estimates which are made in Honkkila and Kavonius (2013). First of all, many countries cover also non-profit institutions serving households (NPISH). In case there are household sector accounts without NPISH these are naturally used but in case these are not available, the series without NPISH are estimated.
5 The Household Finance and Consumption Survey was conducted in Luxembourg and Malta, but all
necessary data for Luxembourg and Malta are not available in the Euro Area Accounts. Data for Ireland is missing from the first HFCS wave and Estonia, Latvia and Lithuania were not members of the euro area at the time of the first HFCS wave.
6 Deriving Household Indebtedness Indicators by Linking Micro and Macro Balance Sheet Data
Additionally, there are pure population differences in the figures. This adjustment is also performed in all the numbers presented in this paper.6 This paper focuses on household indebtedness using some of the most common indicators in order to analyse their different aspects. The indicators used cover both wealth and income. This approach, where several aspects of wellbeing are covered simultaneously, is emphasised as being conceptually relevant in the current body of welfare analysis, and is one of the key recommendations in the Stiglitz, Sen and Fitoussi (2009) report. Marc Fleurbaey (2009) identifies four approaches of the measurement welfare. The approach applied in this paper is near to the capability approach which emphasises the need to look at several aspects of welfare even though the capability approach goes even further by covering material and immaterial aspects of wellbeing. ‘Asset-based poverty measures’ have been constructed and analysed in several papers recently7. The derived indicators presented in this paper combine household-level wealth and income data in order to get a broader picture of sustainability levels and on the sufficiency of financial resources of different households groups. This line of research is similar to the one used in this paper. However, in our paper the emphasis is on household indebtedness indicators which are important for financial stability analysis. Additionally, this paper applies, to the largest extent possible, the national accounts framework in order to produce timely estimates and time series data. In this paper, we focus the estimation on three different kind indebted measures which are also commonly used at aggregated level in financial stability analysis8:
i) Debt to income ratio, i.e. loans divided by gross income. ii) Financial leverage ratio, i.e. loans divided by financial or liquid assets
(equity) iii) Leverage ratio, i.e. loans divided by total assets (equity).9
Household loans cover all short- and long-term loans. The most commonly used income concept is disposable income, but this is unfortunately not available in the HFCS and thus, we use gross income. The gross income concept used in this paper covers wages and salaries, entrepreneurial income (mixed income), property income and transfers before taxes.10 Leverage ratio is normally understood as debt-to-equity ratio. Households, however, do not issue any equity and thus, we define leverage ratio as debt divided
6 A similar adjustment is done for instance by Antoniewichz (2000) where she is building this type of
micro-macro linkage by using the U.S. data. 7 See Brandolini et al. (2010), Barceló and Villanueva (2010), Azpitarte (2012) and Törmälehto et al. (2012) 8 See for instance: ECB (2015). 9 In the case of households the leverage ratio could also be defined as assets/net wealth. However, it
should be beard in mind that by defining leverage in this way, some households would have negative leverage ratio.
10 Honkkila and Kavonius (2013) describe the income used in detail. See additionally: ECB 2013.
Deriving Household Indebtedness Indicators by Linking Micro and Macro Balance Sheet Data 7
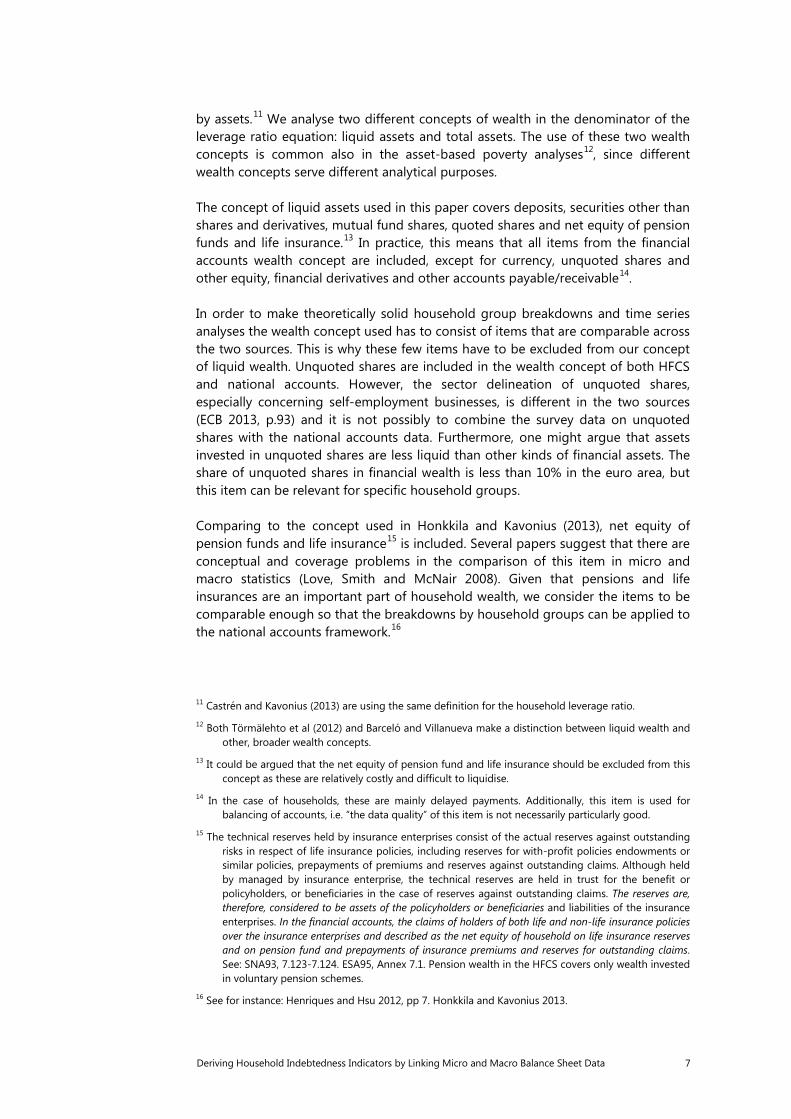
by assets.11 We analyse two different concepts of wealth in the denominator of the leverage ratio equation: liquid assets and total assets. The use of these two wealth concepts is common also in the asset-based poverty analyses12, since different wealth concepts serve different analytical purposes. The concept of liquid assets used in this paper covers deposits, securities other than shares and derivatives, mutual fund shares, quoted shares and net equity of pension funds and life insurance.13 In practice, this means that all items from the financial accounts wealth concept are included, except for currency, unquoted shares and other equity, financial derivatives and other accounts payable/receivable14. In order to make theoretically solid household group breakdowns and time series analyses the wealth concept used has to consist of items that are comparable across the two sources. This is why these few items have to be excluded from our concept of liquid wealth. Unquoted shares are included in the wealth concept of both HFCS and national accounts. However, the sector delineation of unquoted shares, especially concerning self-employment businesses, is different in the two sources (ECB 2013, p.93) and it is not possibly to combine the survey data on unquoted shares with the national accounts data. Furthermore, one might argue that assets invested in unquoted shares are less liquid than other kinds of financial assets. The share of unquoted shares in financial wealth is less than 10% in the euro area, but this item can be relevant for specific household groups. Comparing to the concept used in Honkkila and Kavonius (2013), net equity of pension funds and life insurance15 is included. Several papers suggest that there are conceptual and coverage problems in the comparison of this item in micro and macro statistics (Love, Smith and McNair 2008). Given that pensions and life insurances are an important part of household wealth, we consider the items to be comparable enough so that the breakdowns by household groups can be applied to the national accounts framework.16
11 Castrén and Kavonius (2013) are using the same definition for the household leverage ratio. 12 Both Törmälehto et al (2012) and Barceló and Villanueva make a distinction between liquid wealth and
other, broader wealth concepts. 13 It could be argued that the net equity of pension fund and life insurance should be excluded from this
concept as these are relatively costly and difficult to liquidise. 14 In the case of households, these are mainly delayed payments. Additionally, this item is used for
balancing of accounts, i.e. “the data quality” of this item is not necessarily particularly good. 15 The technical reserves held by insurance enterprises consist of the actual reserves against outstanding
risks in respect of life insurance policies, including reserves for with-profit policies endowments or similar policies, prepayments of premiums and reserves against outstanding claims. Although held by managed by insurance enterprise, the technical reserves are held in trust for the benefit or policyholders, or beneficiaries in the case of reserves against outstanding claims. The reserves are, therefore, considered to be assets of the policyholders or beneficiaries and liabilities of the insurance enterprises. In the financial accounts, the claims of holders of both life and non-life insurance policies over the insurance enterprises and described as the net equity of household on life insurance reserves and on pension fund and prepayments of insurance premiums and reserves for outstanding claims. See: SNA93, 7.123-7.124. ESA95, Annex 7.1. Pension wealth in the HFCS covers only wealth invested in voluntary pension schemes.
16 See for instance: Henriques and Hsu 2012, pp 7. Honkkila and Kavonius 2013.
8 Deriving Household Indebtedness Indicators by Linking Micro and Macro Balance Sheet Data
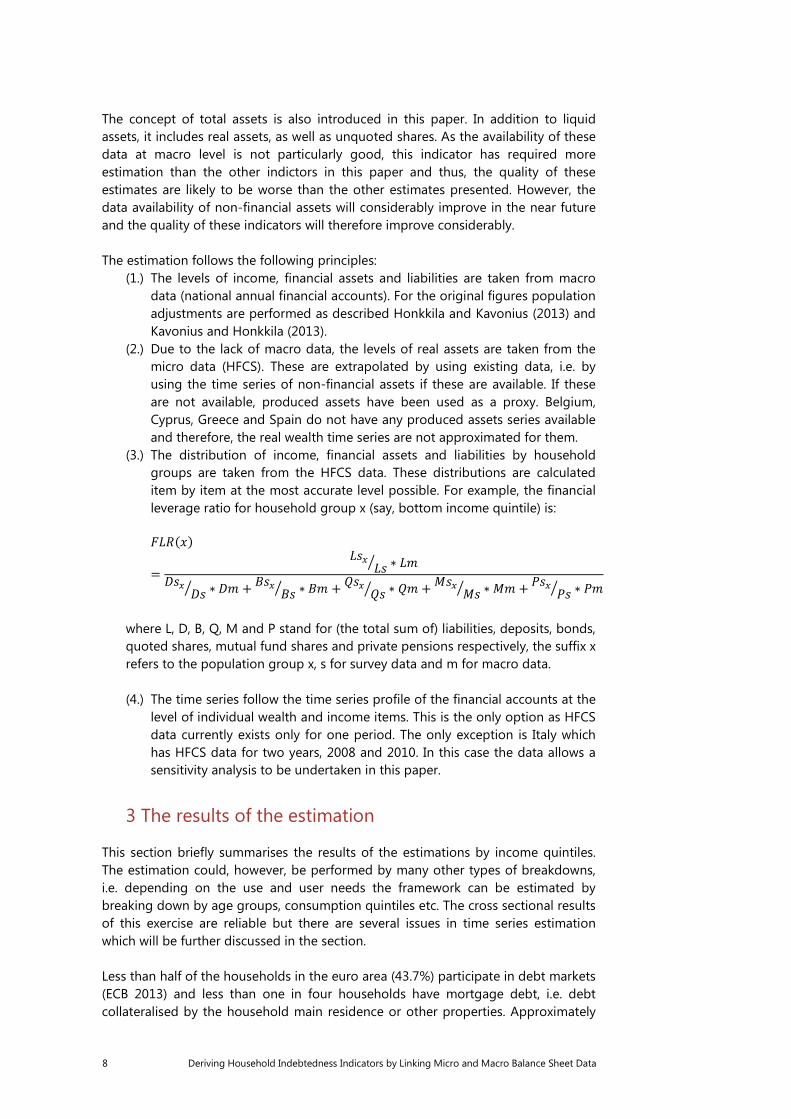
The concept of total assets is also introduced in this paper. In addition to liquid assets, it includes real assets, as well as unquoted shares. As the availability of these data at macro level is not particularly good, this indicator has required more estimation than the other indictors in this paper and thus, the quality of these estimates are likely to be worse than the other estimates presented. However, the data availability of non-financial assets will considerably improve in the near future and the quality of these indicators will therefore improve considerably. The estimation follows the following principles:
(1.) The levels of income, financial assets and liabilities are taken from macro data (national annual financial accounts). For the original figures population adjustments are performed as described Honkkila and Kavonius (2013) and Kavonius and Honkkila (2013).
(2.) Due to the lack of macro data, the levels of real assets are taken from the micro data (HFCS). These are extrapolated by using existing data, i.e. by using the time series of non-financial assets if these are available. If these are not available, produced assets have been used as a proxy. Belgium, Cyprus, Greece and Spain do not have any produced assets series available and therefore, the real wealth time series are not approximated for them.
(3.) The distribution of income, financial assets and liabilities by household groups are taken from the HFCS data. These distributions are calculated item by item at the most accurate level possible. For example, the financial leverage ratio for household group x (say, bottom income quintile) is: 𝐹𝐹𝐹𝐹𝐹𝐹(𝑥𝑥)
=𝐹𝐹𝐿𝐿𝑥𝑥
𝐹𝐹𝐿𝐿� ∗ 𝐹𝐹𝐿𝐿𝐷𝐷𝐿𝐿𝑥𝑥
𝐷𝐷𝐿𝐿� ∗ 𝐷𝐷𝐿𝐿 + 𝐵𝐵𝐿𝐿𝑥𝑥𝐵𝐵𝐿𝐿� ∗ 𝐵𝐵𝐿𝐿 + 𝑄𝑄𝐿𝐿𝑥𝑥
𝑄𝑄𝐿𝐿� ∗ 𝑄𝑄𝐿𝐿 + 𝑀𝑀𝐿𝐿𝑥𝑥𝑀𝑀𝐿𝐿� ∗ 𝑀𝑀𝐿𝐿 + 𝑃𝑃𝐿𝐿𝑥𝑥
𝑃𝑃𝐿𝐿� ∗ 𝑃𝑃𝐿𝐿
where L, D, B, Q, M and P stand for (the total sum of) liabilities, deposits, bonds, quoted shares, mutual fund shares and private pensions respectively, the suffix x refers to the population group x, s for survey data and m for macro data.
(4.) The time series follow the time series profile of the financial accounts at the
level of individual wealth and income items. This is the only option as HFCS data currently exists only for one period. The only exception is Italy which has HFCS data for two years, 2008 and 2010. In this case the data allows a sensitivity analysis to be undertaken in this paper.
3 The results of the estimation
This section briefly summarises the results of the estimations by income quintiles. The estimation could, however, be performed by many other types of breakdowns, i.e. depending on the use and user needs the framework can be estimated by breaking down by age groups, consumption quintiles etc. The cross sectional results of this exercise are reliable but there are several issues in time series estimation which will be further discussed in the section. Less than half of the households in the euro area (43.7%) participate in debt markets (ECB 2013) and less than one in four households have mortgage debt, i.e. debt collateralised by the household main residence or other properties. Approximately
Deriving Household Indebtedness Indicators by Linking Micro and Macro Balance Sheet Data 9
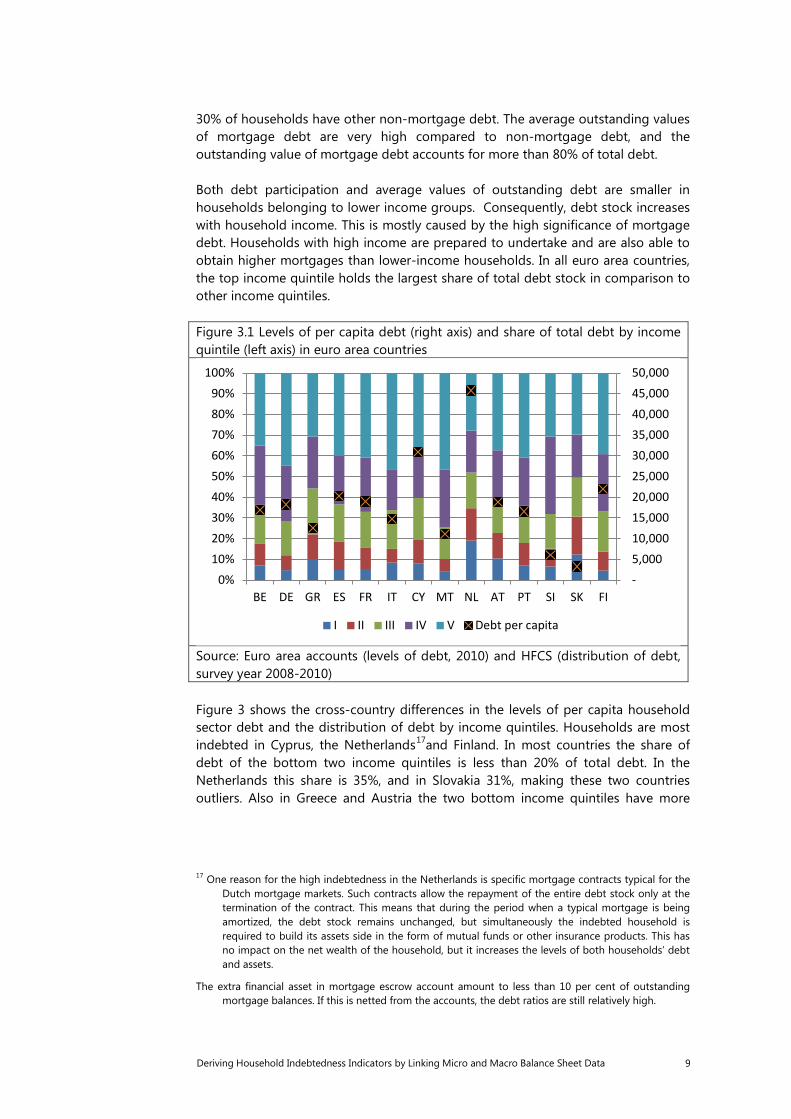
30% of households have other non-mortgage debt. The average outstanding values of mortgage debt are very high compared to non-mortgage debt, and the outstanding value of mortgage debt accounts for more than 80% of total debt. Both debt participation and average values of outstanding debt are smaller in households belonging to lower income groups. Consequently, debt stock increases with household income. This is mostly caused by the high significance of mortgage debt. Households with high income are prepared to undertake and are also able to obtain higher mortgages than lower-income households. In all euro area countries, the top income quintile holds the largest share of total debt stock in comparison to other income quintiles. Figure 3.1 Levels of per capita debt (right axis) and share of total debt by income quintile (left axis) in euro area countries
Source: Euro area accounts (levels of debt, 2010) and HFCS (distribution of debt, survey year 2008-2010) Figure 3 shows the cross-country differences in the levels of per capita household sector debt and the distribution of debt by income quintiles. Households are most indebted in Cyprus, the Netherlands17and Finland. In most countries the share of debt of the bottom two income quintiles is less than 20% of total debt. In the Netherlands this share is 35%, and in Slovakia 31%, making these two countries outliers. Also in Greece and Austria the two bottom income quintiles have more
17 One reason for the high indebtedness in the Netherlands is specific mortgage contracts typical for the
Dutch mortgage markets. Such contracts allow the repayment of the entire debt stock only at the termination of the contract. This means that during the period when a typical mortgage is being amortized, the debt stock remains unchanged, but simultaneously the indebted household is required to build its assets side in the form of mutual funds or other insurance products. This has no impact on the net wealth of the household, but it increases the levels of both households’ debt and assets.
The extra financial asset in mortgage escrow account amount to less than 10 per cent of outstanding mortgage balances. If this is netted from the accounts, the debt ratios are still relatively high.
- 5,000 10,000 15,000 20,000 25,000 30,000 35,000 40,000 45,000 50,000
0%10%20%30%40%50%60%70%80%90%
100%
BE DE GR ES FR IT CY MT NL AT PT SI SK FI
I II III IV V Debt per capita

10 Deriving Household Indebtedness Indicators by Linking Micro and Macro Balance Sheet Data
than 20% of total debt. The debt share of the bottom quintile is lowest in Malta and Germany. In the remaining part of this chapter, the values of debt by income quintiles are analysed from a broader perspective. First, in relation to the income levels, secondly to the holdings of financial assets and finally to total wealth.
Debt to income and financial leverage
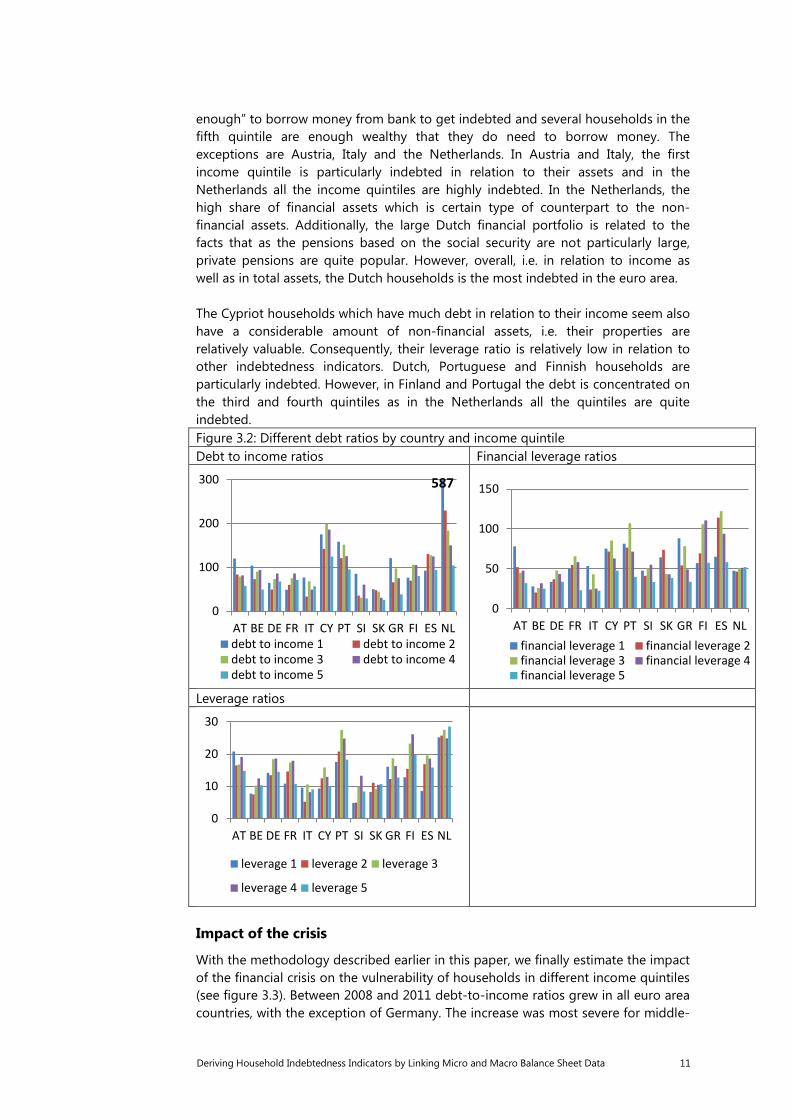
Figure 3.2 shows the debt-to-income ratios and financial leverage ratios by country and by income quintile. As can be seen, cross-country differences in the levels of these indicators can be observed. The debt to income ratio of the entire household sector is more than 100% in Cyprus, the Netherlands and Portugal and Spain. Highest financial leverage ratios are observed in Spain, Cyprus and Finland. In Finland the underlying reason is that the pensions are based mostly on social security and therefore, the share of private pensions – which are the ones which are included in the national accounts’ pension item – is low. Technically speaking, this implies that the government saves on behalf of the households. Slovenia and Slovakia are countries with relatively low debt levels in comparison with income levels, while the debt levels of Belgian and Italian households are low compared to their financial wealth stock. In the Netherlands, the debt to income ratio is extremely high, but financial leverage ratios may be assessed as reasonable. This can be partially explained by the specific mortgage contracts in the Netherlands as mentioned earlier which lead to unusually large debt stocks that are offset by financial assets held for the purpose of repaying the entire mortgage after a longer period. With regard to the differences between income groups, several patterns can be distinguished. First of all, high-income households have relatively low debt-to-income ratios as well as financial leverage ratios in all countries. Somewhat surprisingly, relatively low debt-to-income ratios are observed also for the second lowest income quintile. This seems to be a combination of low debt stock and sufficient income vis-à-vis the poorest income group. In the second income quintile, high debt-to-income ratios are not observed very frequently. Somewhat of an outlier is Spain, where the highest debt to income ratio is observed in the second income quintile, and where the financial leverage ratio is also very high in this group. Depending on the country, the most vulnerable income groups with regard to high indebtedness in relation to income and financial leverage are the bottom quintile or the third and fourth income quintiles. The bottom income quintiles have highest debt to income ratios in most countries. In Cyprus, Greece and Portugal the debt ratio in the first income quintile is particular high.
Leverage ratios
The ratio of the debt stock to total assets, including real wealth, varies between nine and 26% in the euro area countries. The causality between income and leverage ratio is not very systematic (see figure 3.2). Overall, the indebtedness in relation to the total assets seems to be highest in the third and fourth quintiles. The reason for this might be that there are several households in the first quintile are not “wealthy
Deriving Household Indebtedness Indicators by Linking Micro and Macro Balance Sheet Data 11
enough” to borrow money from bank to get indebted and several households in the fifth quintile are enough wealthy that they do need to borrow money. The exceptions are Austria, Italy and the Netherlands. In Austria and Italy, the first income quintile is particularly indebted in relation to their assets and in the Netherlands all the income quintiles are highly indebted. In the Netherlands, the high share of financial assets which is certain type of counterpart to the non-financial assets. Additionally, the large Dutch financial portfolio is related to the facts that as the pensions based on the social security are not particularly large, private pensions are quite popular. However, overall, i.e. in relation to income as well as in total assets, the Dutch households is the most indebted in the euro area. The Cypriot households which have much debt in relation to their income seem also have a considerable amount of non-financial assets, i.e. their properties are relatively valuable. Consequently, their leverage ratio is relatively low in relation to other indebtedness indicators. Dutch, Portuguese and Finnish households are particularly indebted. However, in Finland and Portugal the debt is concentrated on the third and fourth quintiles as in the Netherlands all the quintiles are quite indebted. Figure 3.2: Different debt ratios by country and income quintile Debt to income ratios Financial leverage ratios
Leverage ratios
Impact of the crisis
With the methodology described earlier in this paper, we finally estimate the impact of the financial crisis on the vulnerability of households in different income quintiles (see figure 3.3). Between 2008 and 2011 debt-to-income ratios grew in all euro area countries, with the exception of Germany. The increase was most severe for middle-
587
0
100
200
300
AT BE DE FR IT CY PT SI SK GR FI ES NLdebt to income 1 debt to income 2debt to income 3 debt to income 4debt to income 5
0
50
100
150
AT BE DE FR IT CY PT SI SK GR FI ES NLfinancial leverage 1 financial leverage 2financial leverage 3 financial leverage 4financial leverage 5
0
10
20
30
AT BE DE FR IT CY PT SI SK GR FI ES NL
leverage 1 leverage 2 leverage 3
leverage 4 leverage 5

12 Deriving Household Indebtedness Indicators by Linking Micro and Macro Balance Sheet Data
income households in Cyprus and Greece, as well as for the bottom income quintile in Greece. The debt-to-income ratio grew relatively fast also in the Netherlands, and this growth was spread pretty evenly across various income quintiles. Probably the most interesting figures are observed for Spain, where on one hand, the debt-to-income ratio grew significantly only in the top income quintile. On the other hand, households in the two bottom quintiles seemed to be less indebted in 2011 than at the start of the crisis. In general, there is a slight positive relationship between the growth of the debt-to-income ratio and income, particularly in Austria, France, Slovenia and Finland. Figure 3.3: Changes in different debt ratios by country and income quintile 2008-2010 Debt to income ratios Financial leverage ratios
Leverage ratios
There are significant cross-country differences in the development of the financial leverage ratio: This ratio has decreased for all income quintiles in Austria, Germany, the Netherlands and Spain. The effect was most significant for middle income households in Spain. The ratio grew very quickly in Cyprus and Greece and most severely for middle income households in Greece. There is no clear pattern between the development of the financial leverage ratio and income. The time series for the leverage ratio was not possible to estimate for all the countries as the lack of data availability for non-financial assets limits this analysis. The countries for which this cannot be estimated are included in Figure 3.3 but no data are shown. The leverage ratio decreased in Austria and Germany. There are two factors which might underlie this development. The first factor is whether the households have increased their debt. As mentioned earlier, in relation to income,
-10.0
0.0
10.0
20.0
30.0
AT BE DE FR IT CY SI SK GR NL FI ES
debt to income 1 debt to income 2debt to income 3 debt to income 4
-20.0
-10.0
0.0
10.0
20.0
30.0
AT BE DE FR IT CY SI SK GR NL FI ES
financial leverage 1 financial leverage 2financial leverage 3 financial leverage 4financial leverage 5
-2.0
-1.0
0.0
1.0
2.0
3.0
AT BE DE FR IT CY SI SK GR NL FI ES
leverage 1 leverage 2 leverage 3leverage 4 leverage 5
Deriving Household Indebtedness Indicators by Linking Micro and Macro Balance Sheet Data 13
household debt has decreased in Germany and increased only slightly in Austria. The second factor is real wealth, particularly the amount and the value of properties. In Germany reported property values have increased exceptionally quickly during this period. This is due to extremely sluggish development in the previous years. During recent years the German property prices have caught up the rest of Europe. A similar price development in Austria is apparent. This has led to the decrease of leverage ratio. At the same time in France, Italy, Slovakia and particularly in Finland, households have increased their debt and this is not supported by a strong development of property prices. Correspondingly, this has led to the increase of leverage ratio.
4 Plausibility of results
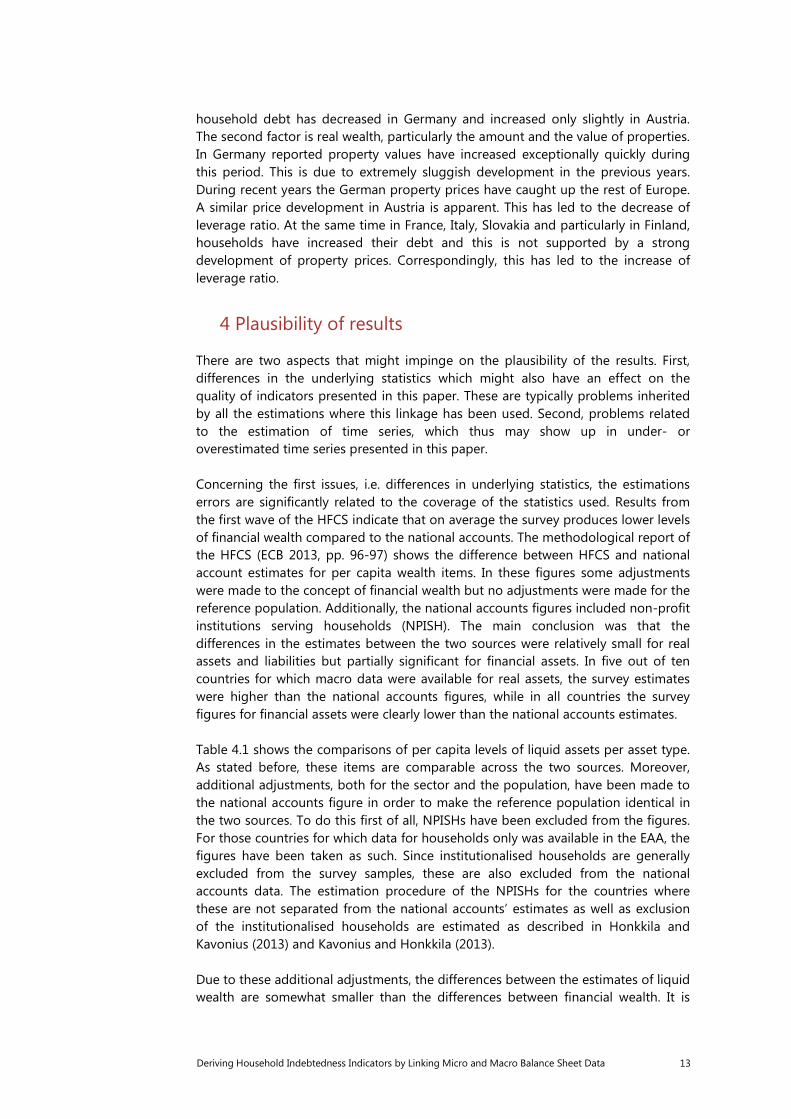
There are two aspects that might impinge on the plausibility of the results. First, differences in the underlying statistics which might also have an effect on the quality of indicators presented in this paper. These are typically problems inherited by all the estimations where this linkage has been used. Second, problems related to the estimation of time series, which thus may show up in under- or overestimated time series presented in this paper. Concerning the first issues, i.e. differences in underlying statistics, the estimations errors are significantly related to the coverage of the statistics used. Results from the first wave of the HFCS indicate that on average the survey produces lower levels of financial wealth compared to the national accounts. The methodological report of the HFCS (ECB 2013, pp. 96-97) shows the difference between HFCS and national account estimates for per capita wealth items. In these figures some adjustments were made to the concept of financial wealth but no adjustments were made for the reference population. Additionally, the national accounts figures included non-profit institutions serving households (NPISH). The main conclusion was that the differences in the estimates between the two sources were relatively small for real assets and liabilities but partially significant for financial assets. In five out of ten countries for which macro data were available for real assets, the survey estimates were higher than the national accounts figures, while in all countries the survey figures for financial assets were clearly lower than the national accounts estimates. Table 4.1 shows the comparisons of per capita levels of liquid assets per asset type. As stated before, these items are comparable across the two sources. Moreover, additional adjustments, both for the sector and the population, have been made to the national accounts figure in order to make the reference population identical in the two sources. To do this first of all, NPISHs have been excluded from the figures. For those countries for which data for households only was available in the EAA, the figures have been taken as such. Since institutionalised households are generally excluded from the survey samples, these are also excluded from the national accounts data. The estimation procedure of the NPISHs for the countries where these are not separated from the national accounts’ estimates as well as exclusion of the institutionalised households are estimated as described in Honkkila and Kavonius (2013) and Kavonius and Honkkila (2013). Due to these additional adjustments, the differences between the estimates of liquid wealth are somewhat smaller than the differences between financial wealth. It is
14 Deriving Household Indebtedness Indicators by Linking Micro and Macro Balance Sheet Data
worth mentioning that in spite of the remaining differences the country rankings of liquid wealth levels are practically identical in both sources. Table 4.1: Comparison of liquid wealth levels, HFCS / NA % Country Deposits Bonds Quoted
shares Mutual funds
Private pensions
TOTAL
Belgium 76% 90% 144% 71% 39% 69% Germany 52% 47% 78% 53% 33% 45% Greece 19% 7% 9% 23% 43% 19% Spain 43% 32% 76% 34% 39% 43% France 45% 35% 124% 33% 39% 45% Italy 33% 23% 45% 28% 9% 25% Cyprus 27% 64% 71% n.a. 131% 44% Luxembourg 52% 56% 62% 33% 102% 57% Malta 48% 54% 26% 77% 26% 34% Netherlands 55% 33% 30% 51% 19% 43% Austria 43% 8% 91% 25% 12% 31% Portugal 27% 7% 12% 22% 31% 26% Slovenia 44% 4% 682% 12% 18% 34% Slovakia 55% 15% 86% 68% 20% 51% Finland 76% 90% 144% 71% 39% 69% The differences in the financial assets are still large and vary from country to country. This result is not surprising and in line with the conclusions from previous studies (Johansson and Klevmarken 2007, D’Alessio and Ilardi 2012).18 On the one hand, the reasons for this discrepancy are that household survey data has to deal with sampling errors and reporting bias, and both sources of bias usually tend to produce lower rather than higher figures. On the other hand, national accounts data may need to allow some bias in the household sector to satisfy the balancing constraints. In addition, other types of measurement errors in the national accounts data are possible, especially in cases where several wealth items for the household sector are produced as residuals. For the type of indicator estimation methods presented in this paper, the large differences between the wealth levels are not problematic as long as such difference do not have any impact on the distribution. One of the main methodological challenges is to quantify the reasons of these differences and to analyse what kind of distributional impact these might have. In the case of the errors in national accounts, it is practically impossible to say whether these are equally distributed. The survey related problems might be a bit easier to analyse. Particularly problems related to sampling errors might have a considerable effect on the distribution as well.
18 The differences between macro statistics and surveys are normal. For instance Cynamon and Fazzari
(2014) document the large gap and mismatch between micro and macro estimates of household income and consumption in the United States. The gap is roughly 50 per cent. However, it should be borne in mind that the wealth surveys typically have even larger gap compared to consumption and income surveys. This is typically related to the fact that wealth is considerably more unequally distributed than income. The surveys have typically problems in covering the very richest households. This has typically a large negative impact on the coverage.
Deriving Household Indebtedness Indicators by Linking Micro and Macro Balance Sheet Data 15
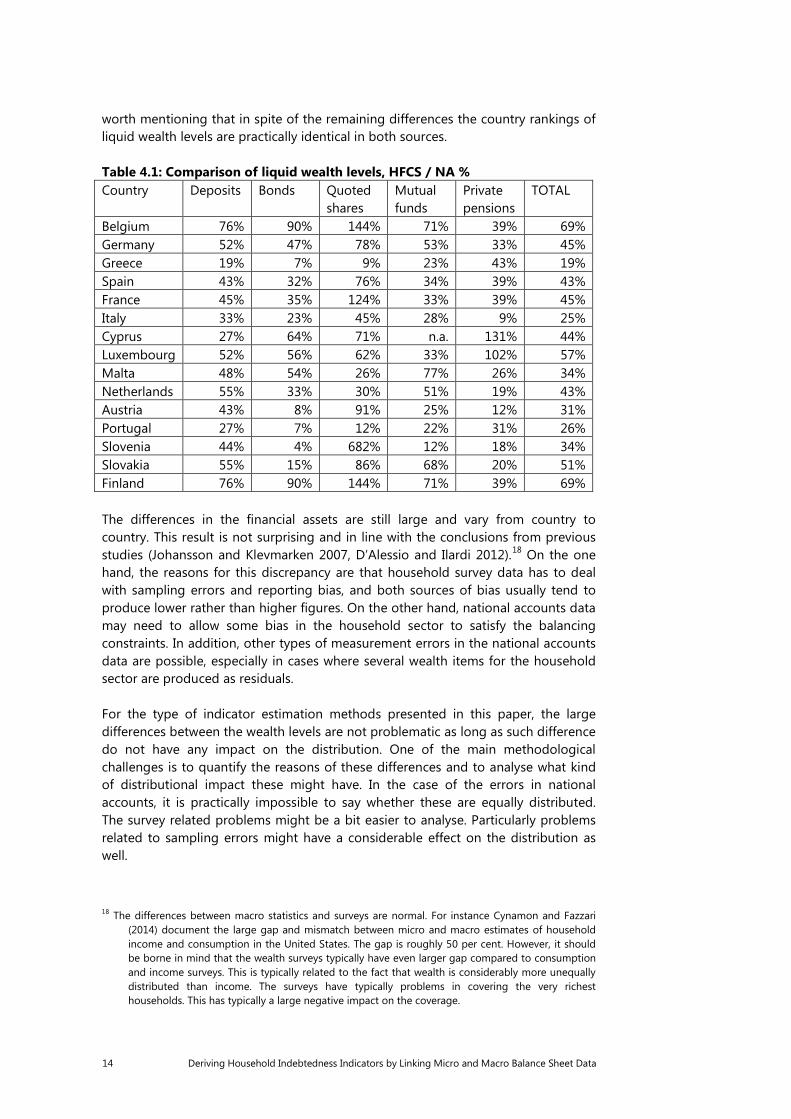
In the wealth statistics considerable part of differences is claimed to be caused by the non-observation bias or measurement error of underrepresenting the wealthiest households in the sample. Several papers for instance Bach et al. (2015) and Vermeulen (2014) indicate the difference would mainly be caused by the fact that the richest tail is missing in these estimations, i.e. the richest households are under-represented in these samples. On the one hand this would have considerable distributional effects. The largest differences would most likely occur in financial instruments. As the financial accounts estimates are larger than survey estimates that would lead to the overestimation of assets of the households in the survey sample. On the other hand, it should also kept in mind that this limitation is already in the survey results and for the financial accounts this is somewhat inherited from the survey results. Another aspect to this issue is that as the ultimate aim is to derive indicators. Consequently, if the differences are systematic and equally distributed then these do not cause any error to the estimates. Figure 4.2: Comparison of financial wealth structures, HFCS / NA
However, the way of correcting these errors should be investigated and there could be two ways of correcting this type of error. First, either to adjust national accounts totals and to take the view that it is not necessary to cover these asset richest households. Then the idea would be only to focus in these indicators on the critical mass of the households and follow an approach that the richest tail does not matter from the policy point of view. The second option is to estimate this missing households and their distribution by using additional data sources. The latter is probably more advisable but in any case the key for the future work is to understand where these differences come from and how these are distributed.

16 Deriving Household Indebtedness Indicators by Linking Micro and Macro Balance Sheet Data
Concerning the practical differences as was also shown in Andreasch et al. (2013), the structure of liquid wealth is very similar in the micro and macro data. Figure 4.2 shows the structure of liquid wealth by asset type with the population adjusted data. The results are very similar to the ones by Andreasch et al. In the HFCS data, financial assets account for 17% of households’ gross wealth in the EA15. The share of financial assets is less than 10% in Greece, Cyprus, Slovenia and Slovakia, but more than ¼ in Belgium and the Netherlands. The corresponding shares in macro statistics are significantly higher in countries for which macro data on real assets are available. This result is not unexpected for (at least) two reasons: all assets related to self-employment businesses are classified as real assets in the HFCS, while macro statistics include all unquoted shares as financial assets. Furthermore, the distribution of financial wealth is much more skewed than the distribution of real wealth, which may lead to more pronounced sampling bias in the micro data. If this skewedness is analysed against the method presented in this paper, assuming that the distribution between different instrument types in national accounts is correct, the estimated indicators portfolio breakdown is actually correct. The reason is that this breakdown is derived from the national accounts. However, if the skewedness effects the distribution among households then the estimated indicators are also wrong. As mentioned earlier in the paper, the time series have been estimated by deriving the distribution of each individual instrument by household type from the HFCS data and time series developments from the financial accounts’ instruments. This basically assumes constant household distribution per financial instrument. This also means that if we assume that the distribution of these instruments in the financial accounts stays equal then the ownership share of each household type stay equal as well. The growth rate of individual stocks of instruments is running the development and shares of individual household groups. Mathematically this can described as follows:
𝐼𝐼𝑞𝑞 = 𝛼𝛼𝑞𝑞 ∗ 𝐼𝐼 where I is denoted for an instrument (total) and is financial accounts’ data and 𝐼𝐼𝑞𝑞 is each quintiles’ share of the instrument. 𝛼𝛼𝑞𝑞 is each quintile share of the instrument in percentage and thus, q can have a value from 1 to 5. Then, equally:
𝛼𝛼1 + 𝛼𝛼2 + 𝛼𝛼3 + 𝛼𝛼4 + 𝛼𝛼5 = 1 And 𝛼𝛼𝑞𝑞 is estimated from the HFCS data:
𝛼𝛼𝑞𝑞 = 𝑉𝑉𝑞𝑞/�𝑉𝑉𝑞𝑞
where 𝑉𝑉𝑞𝑞 is an absolute value for some instrument for quintile q. The reason for the assumption for constant household distribution at instrument level is that the HFCS data are currently available only for one year. Only Italy transmits the data for all quarters and thus, Italian data can be used for a sensitivity analysis of this assumption. As these weights presented above are normally applied to the whole time series, the weights for Italy are calculated separately for 2008 and
Deriving Household Indebtedness Indicators by Linking Micro and Macro Balance Sheet Data 17
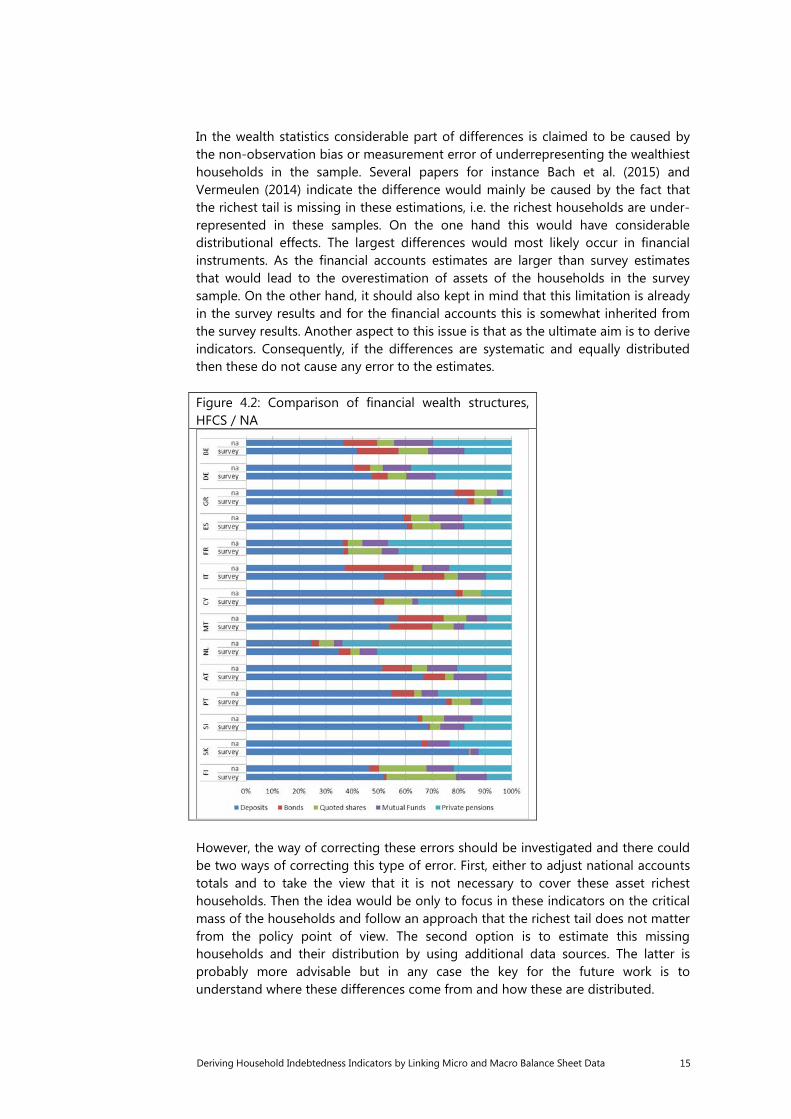
2010. The missing observation has been estimated by assuming linear development for the missing year. The results of the sensitivity analysis are summarised in the figures 4.3 which show Italian debt to financial wealth as well as debt to wealth and debt to income by using the method proposed in this paper, i.e. the method which uses only one survey to estimate the time series, and the benchmark method where the survey results for 2008 and 2010 are used. When the benchmark year is missing, the basic assumption is practically that the instrument portfolio stays constant and only the relative prices of the portfolio are varying. The other increase (investment) or decrease (amortisation) of the assets is assumed the follow average decrease of the assets. During the financial crisis, this assumption seemed to be wrong. Two observations concerning these results can be made: (1.) The lower the income quintile, the bigger the estimation error. (2.) In the case of liquid assets and income the different is considerably larger than in the fixed assets. Especially, the lower income quintiles seem to have considerably higher debt ratio than the estimation method used in paper would indicate. Most likely this is partly caused by the faster speed amortising debt but the small amount of financial wealth seems to develop considerably slower than average. This can be caused the fact that low income households are investing less in financial wealth and might even sell that in a crisis situation. In the higher income quintiles the difference is considerably smaller as these households did not have such economic pressure to react to the crisis. The OECD Expert Group, which is estimating time series on income and consumption, has dedicated much time to the estimations. They have experienced similar kinds of problems as in this exercise, i.e. that typically the lowest income quintiles are considerably over-estimated. In the other income quintiles the estimation errors are typically quite small. This is a logical error as the applied methodology estimates the total development correctly. Therefore, even a small error in the lowest income quintile is relatively large – as the cumulated wealth is relatively small overall. A converse small error appears in the highest income quintiles but this appears again relatively small as these households have cumulated wealth. The fundamental question is what to do with this type of problem. In the case of consumption and income measures, the data availability is better than in wealth and therefore, the estimation can be fed by alternative data sources. The OECD Expert Group raised the idea of deriving the estimations for instance by tax data. The data availability and time lag of data differ from country to country. Therefore, it is easiest to do this type of linkage at country level. Concerning the balance sheet data the situation is more complicated. The problem is that there are limited amount of data sources related to wealth. In some countries in which there are data on wealth available for instance from taxation, the use of that type of data could be investigated. However, a structural solution which could be applied for several countries is unlikely to be possible. From this point view, an establishment of a short term survey which provides a smaller set of the data more frequently than the HFCS would be a solution. The extreme approach would be the one which have been under investigation in the Federal Reserve of Cleveland where

18 Deriving Household Indebtedness Indicators by Linking Micro and Macro Balance Sheet Data
a short-term survey with a relative small sample is conducted quarterly. This would not be an indicator based approach and it would have a far richer data set. Establishing a separate survey would be expensive compared to this type of derived indicators. Additionally, as even a relatively light full survey – with a small sample – is typically also quite time consuming to compile, this type of indicator would have the benefit of being relatively light to be compiled. One solution could be for instance an annual light survey with a limited number of households which then could be used to correct the weight of the annual indicators. Figure 4.3: Sensitivity analyses with the Italian data by using one reference year and calculated by using two reference years (benchmark) Debt to financial wealth Debt to wealth
Debt to income
An alternative or even supplementary method could be to consider whether some income items based on income surveys could be used to improve these estimates. This would practically only apply to interest carrying instruments, i.e. debt securities and loans. Thus, for the other instruments some other methods should be investigated. The only conclusion which can be drawn from these results is that the lack of the reference (HFCS) data is causing large problem to the actual estimations. However, it should be noted that this exercise was done for Italy in the middle of the deepest years of financial crisis. As at the time the Italian economy was under stress, the estimation error was also likely to be most extreme. In less turbulent years this estimation method causes more plausible results. Additionally, it is important to notice that the largest estimation error can be observed in the debt to financial wealth ratio. This is in the line with the assumption that household in the financial stress try first to finance their debt from income and financial wealth. The last resource of financing is real wealth.

Deriving Household Indebtedness Indicators by Linking Micro and Macro Balance Sheet Data 19
It can be concluded that the Italian data in this particularly turbulent period provided an excellent stress test for these estimations. It can be assumed that in the case of another country and at a less turbulent point of time the estimation method could have produced better results. However, this also shows that the stability of results need to be further investigated and it is also the second essential aspect in the future work.
5 Conclusions
The discussion on the micro-macro linkage is mature and so far, the discussion has mostly focused on the theoretical micro-macro linkage rather than on practical applications. In this paper, we have made an attempt to create a practical application of a micro-macro linkage and estimated debt-to income, financial leverage and leverage ratios by income quintiles. From the financial stability point of view, these are important indicators and would be useful in short-term policy analysis of indebtedness. It is important to develop a timelier framework – optimally a quarterly one – which would provide timely distributional analysis. This attempt shows that this framework can potentially provide interesting results. However, the performed sensitivity analysis showed that more data and additional analysis of this framework is needed. There are two different errors which need further analysis. First, there are problems which are related to the different coverages of two sets of statistics used. This requires the adjustment of the population of both statistics and making them as comparable as possible. The remaining differences, which cannot be adjusted, then need to be understood and quantified. It is essential to be able to recognise the nature of the differences and what the distributional impact of these differences are in order to properly break down the balance sheet by household types. Second, for the time series estimation it is essential to investigate how to capture the relative movements of the different balance sheet items between the different groups of households, such as income quintiles. The fundamental challenge of this framework is the assumption that at the instrument level the wealth portfolios of different income quintiles follow the average investment and price development. The sensitivity analysis showed that especially during the crisis in a country which has significant financial problems this assumption is not always correct. In reality, the bottom income quintile households were either amortising debt quicker than expected or their financial assets stock was rather stable comparing to the other quintiles. Currently, the analysis is restricted by the availability of the data. When additional survey results become available, it will also be important to see whether the balance sheet movements between quintiles are large in less turbulent periods. As also mentioned in the paper, this problem is well recognised and, for instance, the OECD group which focuses on income and consumption is struggling with similar issues. The solution for this could be to investigate alternative supplementary sources for these calculations. One possibility is to explore whether some income items could be used to estimate the development of stocks or alternatively, to investigate
20 Deriving Household Indebtedness Indicators by Linking Micro and Macro Balance Sheet Data
whether some “lighter” short-term wealth survey could support the data needs of these calculations. The latter option is clearly limited by financial constraints. This paper also shows relevant information for cross-cutting years when the financial accounts and survey data are available. When both data sets are available the estimates are also quite accurate. The only estimation issues are related to the coverage of the data sets and the distributional impacts of the coverage issues. This is a clearly an issue which should be investigated further – especially the impact of underrepresentation of wealthy households in the survey. Otherwise the framework can already be applied to the historical data and when more survey data become available, it will also ease the time series estimation process. A timely quarterly or even annual framework remains still as a challenge. The analysis of this paper shows that debt to income ratio of the household sector is particularly high in Cyprus, the Netherlands, Portugal and Spain. The bottom income quintile is particularly indebted in Cyprus, Greece and Portugal. When the indebtedness is analysed vis-à-vis to financial wealth the same countries seemed to be indebted. Only households in the Netherlands seem to be less indebted in relation to financial wealth as the Dutch mortgages are usually counterpartyed with financial assets. Additionally, in relation to their financial assets, the Finnish households seem to be quite indebted. This is partly due to the fact the pension saving is to a large extent taken care by the public sector in Finland. Also in relation to total wealth these countries are relatively indebted. Similarly, the speed of getting indebted in years 2008-2011 was the most rapid in these countries. Overall, it also can be concluded that the highest income quintiles were relatively less indebted and typically, the middle income quintiles were most indebted.

Deriving Household Indebtedness Indicators by Linking Micro and Macro Balance Sheet Data 21
References
Ampudia, M., A. Pavlivkova, J. Slacelek and E.Vogel (2014): “Household Heterogenity in the Euro Area since the Onset of the Great Recession”, Working Papers 1705, European Central Bank, Frankfurt am Main 2014. Andreasch, M., P. Fessler and P. Lindner (2013): “Linking Microdata and Macrodata on Austrian Household Financial Wealth Using HFCS and Financial Accounts Data”. Statistiken, Special Issue, pp. 14-23, Oesterreichische Nationalbank. Antoniewicz, R. (2000):” A Comparison of the Household Sector from the Flow of Funds Accounts and the Survey of Consumer Finances”, Federal Reserve Board of Governors Survey of Consumer Finances Working Paper. Antoniewicz, R., R. Bonci, A. Generale, G. Marchese, A. Neri, K. Maser and P. O’Hagan (2005): “Household Wealth: Comparing Micro and Macro Data in Cyprus, Canada, Italy and United States”, in the LWS Workshop: “Construction and Usage of Comparable Microdata on Wealth: the LWS”, Banca d’Italia, Perugia, Italy, 27-29 January 2005. Avery, R. B., G. E. Elliehausen, and A. B. Kennickell (1988): “Measuring Wealth with the Survey Data: AN Evaluation of the 1983 Survey of Consumer Finances”, Review of Income and Wealth 37(4): 409-432. Azpitarte, F. (2012): “Measuring Poverty using both Income and Wealth: A Cross-country Comparison between the U.S. and Spain”, Review of Income and Wealth 58(1): 24-50. Bach, S., A. Thiemann and A. Zucco (2015): “The Top Tail of the Wealth Distribution in Germany, Spain and Greece, Deutsches Institut für Wirtschaftsforsschung 1502. Barceló, C. and E. Villanueva (2010): “The Response of Household Wealth to the Risk of Losing the Job: Evidence from Differences in Firing Costs”, Bank of Spain Working Paper No. 1002. Brandolini, A., M. Silvia and T. M. Smeeding (2010): “Asset-based Measurement of Poverty”, Bank of Italy Working Paper No. 755. Castrén, O. and I. K. Kavonius (2013): “Sector-Level Financial Networks and Macroprudential Risk Analysis in the Euro Area” in Handbook of Systematic Risk edited by Jena-Pierre Fouque and Joseph Langsam,, Cambridge University Press, Cambridge, pp. 775–790. Cynamon, B. Z. and S. M. Fazzari (2014): “Household Income, Demand and Saving: Deriving Macro Data with Micro concepts, Institute for New Economic Thinking, Working Group on the Political Economy of Distribution, Working Paper 5, http://cms.ineteconomics.org/uploads/papers/Cyn-Fazz_HH_Demand_Working_Paper_5.pdf D’Alessio, G.and G. Ilardi (2012): Non-sampling Errors in Household Surveys: The Bank of Italy’s Experience. In Davino, Cristina and Luigi Fabbris (ed.): Survey Data

22 Deriving Household Indebtedness Indicators by Linking Micro and Macro Balance Sheet Data
Collection and Integration. Springer Berlin, pp. 103-120.Draghi, M. (2015): The ECB’s recent monetary policy measures: Effectiveness and challenges, Camdessus lecture by Mario Draghi, President of the ECB, IMF, Washington, DC, 14 May 2015, https://www.ecb.europa.eu/press/key/date/2015/html/sp150514.en.html Durier, S. and R-M Lucile (2012): Distributional Information on Income and Wealth Using French Households Micro Data and National Accounts. Paper Prepared for the 32nd General Conference of The International Association for Research in Income and Wealth, Boston, August 5 – 12. 2012. ECB (2013). The Eurosystem Household Finance and Consumption Survey: Methodological Report for the First Wave. European Central Bank Statistics Paper Series, No. 1. ECB (2015). Financial Stability Review, May 2015, European Central Bank, https://www.ecb.europa.eu/pub/pdf/other/financialstabilityreview201505.en.pdf?3cd887eb74f562fc8db70554df5b01ca European System of Accounts 1995 (ESA95), Council (EC) Regulation No 2223/96 of 25 June 1996 on the European system of national and regional accounts in the Community, Official Journal of the European Union L 310/1-469. Fleurbaey, M. (2009): “Beyond GDP: The Quest for a Measure of Social Welfare”, Journal of Economic Literature 47: 1029–1975. Henriques, A. M., J. W. Hsu (2012): “Analysis of Wealth Using Micro and Macro Data: A Comparison of the Survey of Consumer Finances and Flows of Funds Accounts”, Federal Reserve Board of Governors Survey of Consumer Finances Working Paper. Honkkila, J. and I. K. Kavonius (2013): “Micro and Macro Analysis on Household Income, Wealth and Saving in the Euro Area”, Working Papers 1619, European Central Bank, Frankfurt am Main 2013. IMF/FSB report to the G-20 Finance Ministers and Central Bank Governors, http://www.financialstabilityboard.org/publications/r_091107e.pdf (referred on the 15. July 2013) Johansson, F. and A. Klevmarken (2007): “Comparing Register and Survey Wealth Data”. In: “Essays on Measurement Error and Nonresponse”. Uppsala University Economic Studies 103, pp. 47 – 76. Kavonius, I. K. and J. Honkkila (2013): “Reconciling Micro and Macro Data on Household Wealth: A Test Based on Three Euro Area Countries”, Journal of Economic and Social Policy: Vol. 15: Iss. 2, Article 3. Love, D. A., P. A. Smith and L. C. McNair (2008): A New Look at the Wealth Adequacy of Older U.S. Households. Review of Income and Wealth, December 2008, 54 (4), pp. 616-42. Piketty, T. (2014): “Capital in the Twenty-First Century”, The Belknap Press of Harward University Press, Cambridge and London 2014.
Deriving Household Indebtedness Indicators by Linking Micro and Macro Balance Sheet Data 23
System of National Accounts 1993 (SNA93), Commission of the European Communities, International Monetary Fund, United Nations, World Bank, Brussels/Luxembourg, New York, Paris, Washington D.C.. Stiglitz, J.E & A. Sen & J-P Fitoussi (2009). Report by the Commission on the Measurement of EconomicPerformance and Social Progress, www.stiglitz-sen-fitoussi.fr. Törmälehto, V-M., O. Kannas and M. Säylä (2012): ”Integrated Measurement of Household-Level Income, Wealth and Non-Monetary Well-Being in Finland”, Paper prepared for the 32nd general conference of the International Association for Research in Income and Wealth. Vermeulen, Philip (2014): “How Fat is the Top Tail of the Wealth Distribution? Working Papers 1692, European Central Bank, Frankfurt am Main 2013. Zuckman, G. (2013): “The Missing Wealth of Nations: Are Europe and the U.S. Net Debtors or Net Creditors?”, The Quarterly Journal of Economics 128 (3): 1321-1364.

IFC workshop on “Combining micro and macro statistical data for financial stability analysis. Experiences, opportunities and challenges”
Warsaw, Poland, 14-15 December 2015
Deriving household indebtedness indicators by linking micro and macro balance sheet data1
Ilja Kristian Kavonius, European Central Bank
1 This presentation was prepared for the meeting. The views expressed are those of the authors and do not necessarily reflect the views of the BIS or the central banks and other institutions represented at the meeting.

Deriving Household Indebtedness Indicators by Linking Micro and Macro Balance Sheet Data
Irving Fisher Committee Workshop Warsaw; 14-15 December 2015
Ilja Kristian Kavonius Macroeconomic Statistics European Central Bank
ECB-UNRESTRICTED
FINAL

Rubric
www.ecb.europa.eu © Deriving Household Indebtedness Indicators by Linking Micro and Macro Balance Sheet Data
2
Overview
1
2
3
Applied methodology
The results of the estimation
Introduction
4 Plausibility of results
Conclusions 5

Rubric
www.ecb.europa.eu ©
• The current continuing crisis has trigged additional data needs • The needs coming from two direction:
– Social aspect, i.e. GDP and beyond: “Stiglitz report”, Piketty… – Central banking and need to quantify risk and balance sheet exposures:
• IMF/FSB data gab initiative • The need for looking monetary policy impacts (Draghi 14 May 2015) • Financial stability needs to look at risky households and “counterpart balance sheets”
• Several initiatives: OECD Expert Group on Disparities in National Accounts, several individual countries inside and outside EU
• The purpose of this: – The validating different data sources – reliability of the data – The timeliness of national accounts and having some breakdowns of the
survey
3
Introduction
Deriving Household Indebtedness Indicators by Linking Micro and Macro Balance Sheet Data

Rubric
www.ecb.europa.eu ©
• All EA –countries except EE, IE, LU, LT, LV and MT • Focus on the Debt to income, financial leverage ratio and leverage
ratio • “A hybrid concepts”, i.e. do not follow ESA/SNA and population
adjusted • Following principles are followed:
– The levels of income, financial assets and liabilities are taken from the macro data
– Real assets are taken from the micro data and extrapolated with existing data – The distribution of different asset types taken from the HFCS – The time series profile follow financial accounts at the instrument level
4
Applied methodology
Deriving Household Indebtedness Indicators by Linking Micro and Macro Balance Sheet Data

Rubric
www.ecb.europa.eu © 5
The results of the estimation
Deriving Household Indebtedness Indicators by Linking Micro and Macro Balance Sheet Data
Figure 3.2: Different debt ratios by country and income quintile Debt to income ratios Financial leverage ratios
Leverage ratios
587
0
100
200
300
AT BE DE FR IT CY PT SI SK GR FI ES NLdebt to income 1 debt to income 2debt to income 3 debt to income 4debt to income 5
0
50
100
150
AT BE DE FR IT CY PT SI SK GR FI ES NLfinancial leverage 1 financial leverage 2financial leverage 3 financial leverage 4financial leverage 5
0
10
20
30
AT BE DE FR IT CY PT SI SK GR FI ES NL
leverage 1 leverage 2 leverage 3
leverage 4 leverage 5

Rubric
www.ecb.europa.eu © 6
The results of the estimation
Deriving Household Indebtedness Indicators by Linking Micro and Macro Balance Sheet Data
Figure 3.3: Changes in different debt ratios by country and income quintile 2008-2010 Debt to income ratios Financial leverage ratios
Leverage ratios
-10.0
0.0
10.0
20.0
30.0
AT BE DE FR IT CY SI SK GR NL FI ES
debt to income 1 debt to income 2debt to income 3 debt to income 4
-15.0-10.0
-5.00.05.0
10.015.020.025.0
AT BE DE FR IT CY SI SK GR NL FI ES
financial leverage 1 financial leverage 2financial leverage 3 financial leverage 4financial leverage 5
-2.0
-1.0
0.0
1.0
2.0
3.0
AT BE DE FR IT CY SI SK GR NL FI ES
leverage 1 leverage 2 leverage 3leverage 4 leverage 5

Rubric
www.ecb.europa.eu ©
• The large differences between the wealth levels are not problematic as long as such difference do not have any impact on the distribution
• One of the main methodological challenges is to quantify the reasons of these differences and to analyse what kind of distributional impact these might have
Plausibility of results - differences of underlying statistics
Deriving Household Indebtedness Indicators by Linking Micro and Macro Balance Sheet Data
Country Deposits Bonds Quoted
shares Mutual funds
Private pensions
TOTAL
Belgium 76% 90% 144% 71% 39% 69% Germany 52% 47% 78% 53% 33% 45% Greece 19% 7% 9% 23% 43% 19% Spain 43% 32% 76% 34% 39% 43% France 45% 35% 124% 33% 39% 45% Italy 33% 23% 45% 28% 9% 25% Cyprus 27% 64% 71% n.a. 131% 44% Luxembourg 52% 56% 62% 33% 102% 57% Malta 48% 54% 26% 77% 26% 34% Netherlands 55% 33% 30% 51% 19% 43% Austria 43% 8% 91% 25% 12% 31% Portugal 27% 7% 12% 22% 31% 26% Slovenia 44% 4% 682% 12% 18% 34% Slovakia 55% 15% 86% 68% 20% 51% Finland 76% 90% 144% 71% 39% 69%

Rubric
www.ecb.europa.eu ©
Plausibility of results - differences of underlying statistics
Deriving Household Indebtedness Indicators by Linking Micro and Macro Balance Sheet Data
8
Figure 4.2: Comparison of financial wealth structures, HFCS / NA

Rubric
www.ecb.europa.eu ©
• Increase (investment) or decrease (amortization) of the assets is assumed the follow average decrease of the assets
• Does not work: interpolation works but there are problems in the extrapolation
Plausibility of results - problems related to the estimating time series
Deriving Household Indebtedness Indicators by Linking Micro and Macro Balance Sheet Data
9
Figure 4.3: Sensitivity analyses with the Italian data by using one reference year and calculated by using two reference years (benchmark) Debt to financial wealth Debt to wealth
Debt to income

Rubric
www.ecb.europa.eu ©
• The framework as such important: currently for individual point of
time these are plausible as well as interpolation could work • However, lot of work is needed:
– Problems in coverage: understanding of those essential as well as quantifying to an extent possible
– Problems in time series estimation: the relative movements between different quintiles
• Currently the analysis is limited by the availability of the data – New survey results are needed – Possibly other sources and indirect methods
10
Conclusions
Deriving Household Indebtedness Indicators by Linking Micro and Macro Balance Sheet Data


