Deployment Guide Series: ITCAM for Response Time V6 · Deployment Guide Series: ITCAM for Response...
206
ibm.com/redbooks Deployment Guide Series: ITCAM for Response Time V6.2 Budi Darmawan Aleem Subhedar David Rintoul Ronaldo Pires Response time management for end-user dashboard Extensive deployment and usage examples Solution guide and references
Transcript of Deployment Guide Series: ITCAM for Response Time V6 · Deployment Guide Series: ITCAM for Response...

ibm.com/redbooks
Deployment Guide Series: ITCAM for Response Time V6.2
Budi DarmawanAleem Subhedar
David RintoulRonaldo Pires
Response time management for end-user dashboard
Extensive deployment and usage examples
Solution guide and references
Front cover


Deployment Guide Series: ITCAM for Response Time V6.2
January 2008
International Technical Support Organization
SG24-7484-00
© Copyright International Business Machines Corporation 2008. All rights reserved.Note to U.S. Government Users Restricted Rights -- Use, duplication or disclosure restricted by GSA ADPSchedule Contract with IBM Corp.
First Edition (January 2008)
This edition applies to Version 6, Release 2 of ITCAM for Response Time (product number 5724-C04).
Note: Before using this information and the product it supports, read the information in “Notices” on page vii.
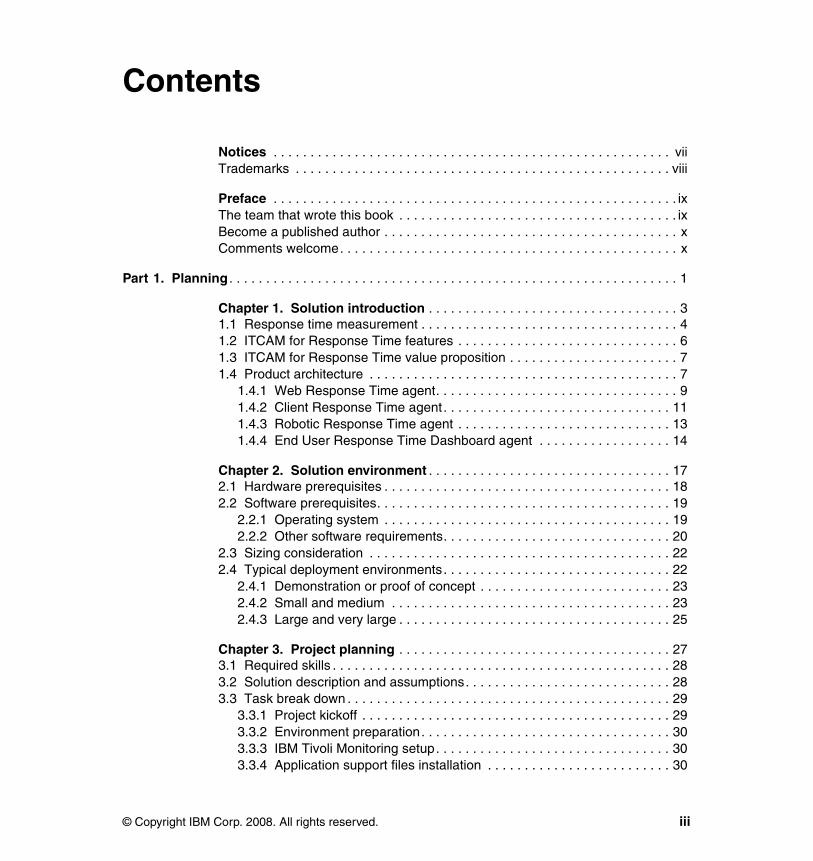
Contents
Notices . . . . . . . . . . . . . . . . . . . . . . . . . . . . . . . . . . . . . . . . . . . . . . . . . . . . . . viiTrademarks . . . . . . . . . . . . . . . . . . . . . . . . . . . . . . . . . . . . . . . . . . . . . . . . . . . viii
Preface . . . . . . . . . . . . . . . . . . . . . . . . . . . . . . . . . . . . . . . . . . . . . . . . . . . . . . . ixThe team that wrote this book . . . . . . . . . . . . . . . . . . . . . . . . . . . . . . . . . . . . . . ixBecome a published author . . . . . . . . . . . . . . . . . . . . . . . . . . . . . . . . . . . . . . . . xComments welcome. . . . . . . . . . . . . . . . . . . . . . . . . . . . . . . . . . . . . . . . . . . . . . x
Part 1. Planning . . . . . . . . . . . . . . . . . . . . . . . . . . . . . . . . . . . . . . . . . . . . . . . . . . . . . . . . . . . . . 1
Chapter 1. Solution introduction . . . . . . . . . . . . . . . . . . . . . . . . . . . . . . . . . . 31.1 Response time measurement . . . . . . . . . . . . . . . . . . . . . . . . . . . . . . . . . . . 41.2 ITCAM for Response Time features . . . . . . . . . . . . . . . . . . . . . . . . . . . . . . 61.3 ITCAM for Response Time value proposition . . . . . . . . . . . . . . . . . . . . . . . 71.4 Product architecture . . . . . . . . . . . . . . . . . . . . . . . . . . . . . . . . . . . . . . . . . . 7
1.4.1 Web Response Time agent. . . . . . . . . . . . . . . . . . . . . . . . . . . . . . . . . 91.4.2 Client Response Time agent. . . . . . . . . . . . . . . . . . . . . . . . . . . . . . . 111.4.3 Robotic Response Time agent . . . . . . . . . . . . . . . . . . . . . . . . . . . . . 131.4.4 End User Response Time Dashboard agent . . . . . . . . . . . . . . . . . . 14
Chapter 2. Solution environment . . . . . . . . . . . . . . . . . . . . . . . . . . . . . . . . . 172.1 Hardware prerequisites . . . . . . . . . . . . . . . . . . . . . . . . . . . . . . . . . . . . . . . 182.2 Software prerequisites. . . . . . . . . . . . . . . . . . . . . . . . . . . . . . . . . . . . . . . . 19
2.2.1 Operating system . . . . . . . . . . . . . . . . . . . . . . . . . . . . . . . . . . . . . . . 192.2.2 Other software requirements. . . . . . . . . . . . . . . . . . . . . . . . . . . . . . . 20
2.3 Sizing consideration . . . . . . . . . . . . . . . . . . . . . . . . . . . . . . . . . . . . . . . . . 222.4 Typical deployment environments. . . . . . . . . . . . . . . . . . . . . . . . . . . . . . . 22
2.4.1 Demonstration or proof of concept . . . . . . . . . . . . . . . . . . . . . . . . . . 232.4.2 Small and medium . . . . . . . . . . . . . . . . . . . . . . . . . . . . . . . . . . . . . . 232.4.3 Large and very large . . . . . . . . . . . . . . . . . . . . . . . . . . . . . . . . . . . . . 25
Chapter 3. Project planning . . . . . . . . . . . . . . . . . . . . . . . . . . . . . . . . . . . . . 273.1 Required skills . . . . . . . . . . . . . . . . . . . . . . . . . . . . . . . . . . . . . . . . . . . . . . 283.2 Solution description and assumptions. . . . . . . . . . . . . . . . . . . . . . . . . . . . 283.3 Task break down . . . . . . . . . . . . . . . . . . . . . . . . . . . . . . . . . . . . . . . . . . . . 29
3.3.1 Project kickoff . . . . . . . . . . . . . . . . . . . . . . . . . . . . . . . . . . . . . . . . . . 293.3.2 Environment preparation. . . . . . . . . . . . . . . . . . . . . . . . . . . . . . . . . . 303.3.3 IBM Tivoli Monitoring setup. . . . . . . . . . . . . . . . . . . . . . . . . . . . . . . . 303.3.4 Application support files installation . . . . . . . . . . . . . . . . . . . . . . . . . 30
© Copyright IBM Corp. 2008. All rights reserved. iii

3.3.5 ITCAM for Response Time agents setup . . . . . . . . . . . . . . . . . . . . . 313.3.6 Customizing the product . . . . . . . . . . . . . . . . . . . . . . . . . . . . . . . . . . 313.3.7 Demonstrating the solution and skill transfer . . . . . . . . . . . . . . . . . . 32
Part 2. Deployment . . . . . . . . . . . . . . . . . . . . . . . . . . . . . . . . . . . . . . . . . . . . . . . . . . . . . . . . . 33
Chapter 4. Installation and configuration . . . . . . . . . . . . . . . . . . . . . . . . . . 354.1 Installation overview . . . . . . . . . . . . . . . . . . . . . . . . . . . . . . . . . . . . . . . . . 364.2 Installing application support files for Windows. . . . . . . . . . . . . . . . . . . . . 384.3 Installing End User Response Time Dashboard . . . . . . . . . . . . . . . . . . . . 514.4 Installing ITCAM for Robotic Response Time . . . . . . . . . . . . . . . . . . . . . . 614.5 Installing ITCAM for Web Response Time . . . . . . . . . . . . . . . . . . . . . . . . 71
4.5.1 Installing Windows Network Monitor . . . . . . . . . . . . . . . . . . . . . . . . . 714.5.2 Installing Web Response Time agent . . . . . . . . . . . . . . . . . . . . . . . . 75
4.6 Installing ITCAM for Client Response Time . . . . . . . . . . . . . . . . . . . . . . . 874.7 Installing Rational Performance Tester Workbench . . . . . . . . . . . . . . . . . 93
Chapter 5. Usage demonstration . . . . . . . . . . . . . . . . . . . . . . . . . . . . . . . . 1035.1 Usage scenarios . . . . . . . . . . . . . . . . . . . . . . . . . . . . . . . . . . . . . . . . . . . 1045.2 Workspaces and interfaces . . . . . . . . . . . . . . . . . . . . . . . . . . . . . . . . . . . 1045.3 Using Rational Performance Tester . . . . . . . . . . . . . . . . . . . . . . . . . . . . 1065.4 Using Robotic Response Time agent . . . . . . . . . . . . . . . . . . . . . . . . . . . 122
5.4.1 Selective execution of robotic script . . . . . . . . . . . . . . . . . . . . . . . . 1225.4.2 Verifying whether the playback is working . . . . . . . . . . . . . . . . . . . 1235.4.3 Working with robotic situation event . . . . . . . . . . . . . . . . . . . . . . . . 1275.4.4 Customizing playback schedule . . . . . . . . . . . . . . . . . . . . . . . . . . . 132
5.5 Using Web Response Time agent. . . . . . . . . . . . . . . . . . . . . . . . . . . . . . 1405.6 Using Client Response Time Agent . . . . . . . . . . . . . . . . . . . . . . . . . . . . 146
Chapter 6. Troubleshooting hints and tips . . . . . . . . . . . . . . . . . . . . . . . . 1516.1 Troubleshooting tips and techniques. . . . . . . . . . . . . . . . . . . . . . . . . . . . 1526.2 Troubleshooting End User Response Time Agent . . . . . . . . . . . . . . . . . 1526.3 Troubleshooting Robotic Response Time Agent. . . . . . . . . . . . . . . . . . . 1546.4 Troubleshooting Web Response Time Agent . . . . . . . . . . . . . . . . . . . . . 1556.5 Troubleshooting Client Response Time Agent . . . . . . . . . . . . . . . . . . . . 156
Part 3. Appendixes . . . . . . . . . . . . . . . . . . . . . . . . . . . . . . . . . . . . . . . . . . . . . . . . . . . . . . . . 159
Appendix A. The Trader application . . . . . . . . . . . . . . . . . . . . . . . . . . . . . 161Application components . . . . . . . . . . . . . . . . . . . . . . . . . . . . . . . . . . . . . . . . . 162
Front-end J2EE Web application . . . . . . . . . . . . . . . . . . . . . . . . . . . . . . . 163Back-end implementation . . . . . . . . . . . . . . . . . . . . . . . . . . . . . . . . . . . . . 166Back-end J2EE server . . . . . . . . . . . . . . . . . . . . . . . . . . . . . . . . . . . . . . . 166
iv Deployment Guide Series: ITCAM for Response Time V6.2

Software requirements . . . . . . . . . . . . . . . . . . . . . . . . . . . . . . . . . . . . . . . . . . 167Installation procedure . . . . . . . . . . . . . . . . . . . . . . . . . . . . . . . . . . . . . . . . . . . 167
Initial setup for the demonstration server . . . . . . . . . . . . . . . . . . . . . . . . . 168DB2 database creation . . . . . . . . . . . . . . . . . . . . . . . . . . . . . . . . . . . . . . . 168WebSphere server installation . . . . . . . . . . . . . . . . . . . . . . . . . . . . . . . . . 168WebSphere client installation . . . . . . . . . . . . . . . . . . . . . . . . . . . . . . . . . . 169
Appendix B. Sample statement of work . . . . . . . . . . . . . . . . . . . . . . . . . . 171ITCAM for Response Time implementation service . . . . . . . . . . . . . . . . . . . . 172
Executive summary. . . . . . . . . . . . . . . . . . . . . . . . . . . . . . . . . . . . . . . . . . 172Solution description. . . . . . . . . . . . . . . . . . . . . . . . . . . . . . . . . . . . . . . . . . 172Assumptions . . . . . . . . . . . . . . . . . . . . . . . . . . . . . . . . . . . . . . . . . . . . . . . 173Business partner responsibilities. . . . . . . . . . . . . . . . . . . . . . . . . . . . . . . . 173Customer responsibilities . . . . . . . . . . . . . . . . . . . . . . . . . . . . . . . . . . . . . 173Staffing estimates . . . . . . . . . . . . . . . . . . . . . . . . . . . . . . . . . . . . . . . . . . . 174Project schedule and milestones . . . . . . . . . . . . . . . . . . . . . . . . . . . . . . . 174Testing methodology. . . . . . . . . . . . . . . . . . . . . . . . . . . . . . . . . . . . . . . . . 174Deliverables . . . . . . . . . . . . . . . . . . . . . . . . . . . . . . . . . . . . . . . . . . . . . . . 174Completion criteria . . . . . . . . . . . . . . . . . . . . . . . . . . . . . . . . . . . . . . . . . . 175
Appendix C. Additional material . . . . . . . . . . . . . . . . . . . . . . . . . . . . . . . . 177Locating the Web material . . . . . . . . . . . . . . . . . . . . . . . . . . . . . . . . . . . . . . . 177Using the Web material . . . . . . . . . . . . . . . . . . . . . . . . . . . . . . . . . . . . . . . . . 178
System requirements for downloading the Web material . . . . . . . . . . . . . 178How to use the Web material . . . . . . . . . . . . . . . . . . . . . . . . . . . . . . . . . . 178
Abbreviations and acronyms . . . . . . . . . . . . . . . . . . . . . . . . . . . . . . . . . . . 179
Related publications . . . . . . . . . . . . . . . . . . . . . . . . . . . . . . . . . . . . . . . . . . 181IBM Redbooks . . . . . . . . . . . . . . . . . . . . . . . . . . . . . . . . . . . . . . . . . . . . . . . . 181Other publications . . . . . . . . . . . . . . . . . . . . . . . . . . . . . . . . . . . . . . . . . . . . . 181Online resources . . . . . . . . . . . . . . . . . . . . . . . . . . . . . . . . . . . . . . . . . . . . . . 182How to get Redbooks . . . . . . . . . . . . . . . . . . . . . . . . . . . . . . . . . . . . . . . . . . . 182Help from IBM . . . . . . . . . . . . . . . . . . . . . . . . . . . . . . . . . . . . . . . . . . . . . . . . 183
Index . . . . . . . . . . . . . . . . . . . . . . . . . . . . . . . . . . . . . . . . . . . . . . . . . . . . . . . 185
Contents v

vi Deployment Guide Series: ITCAM for Response Time V6.2

Notices
This information was developed for products and services offered in the U.S.A.
IBM may not offer the products, services, or features discussed in this document in other countries. Consult your local IBM representative for information on the products and services currently available in your area. Any reference to an IBM product, program, or service is not intended to state or imply that only that IBM product, program, or service may be used. Any functionally equivalent product, program, or service that does not infringe any IBM intellectual property right may be used instead. However, it is the user's responsibility to evaluate and verify the operation of any non-IBM product, program, or service.
IBM may have patents or pending patent applications covering subject matter described in this document. The furnishing of this document does not give you any license to these patents. You can send license inquiries, in writing, to: IBM Director of Licensing, IBM Corporation, North Castle Drive, Armonk, NY 10504-1785 U.S.A.
The following paragraph does not apply to the United Kingdom or any other country where such provisions are inconsistent with local law: INTERNATIONAL BUSINESS MACHINES CORPORATION PROVIDES THIS PUBLICATION "AS IS" WITHOUT WARRANTY OF ANY KIND, EITHER EXPRESS OR IMPLIED, INCLUDING, BUT NOT LIMITED TO, THE IMPLIED WARRANTIES OF NON-INFRINGEMENT, MERCHANTABILITY OR FITNESS FOR A PARTICULAR PURPOSE. Some states do not allow disclaimer of express or implied warranties in certain transactions, therefore, this statement may not apply to you.
This information could include technical inaccuracies or typographical errors. Changes are periodically made to the information herein; these changes will be incorporated in new editions of the publication. IBM may make improvements and/or changes in the product(s) and/or the program(s) described in this publication at any time without notice.
Any references in this information to non-IBM Web sites are provided for convenience only and do not in any manner serve as an endorsement of those Web sites. The materials at those Web sites are not part of the materials for this IBM product and use of those Web sites is at your own risk.
IBM may use or distribute any of the information you supply in any way it believes appropriate without incurring any obligation to you.
Information concerning non-IBM products was obtained from the suppliers of those products, their published announcements or other publicly available sources. IBM has not tested those products and cannot confirm the accuracy of performance, compatibility or any other claims related to non-IBM products. Questions on the capabilities of non-IBM products should be addressed to the suppliers of those products.
This information contains examples of data and reports used in daily business operations. To illustrate them as completely as possible, the examples include the names of individuals, companies, brands, and products. All of these names are fictitious and any similarity to the names and addresses used by an actual business enterprise is entirely coincidental.
COPYRIGHT LICENSE:
This information contains sample application programs in source language, which illustrate programming techniques on various operating platforms. You may copy, modify, and distribute these sample programs in any form without payment to IBM, for the purposes of developing, using, marketing or distributing application programs conforming to the application programming interface for the operating platform for which the sample programs are written. These examples have not been thoroughly tested under all conditions. IBM, therefore, cannot guarantee or imply reliability, serviceability, or function of these programs.
© Copyright IBM Corp. 2008. All rights reserved. vii

Trademarks
The following terms are trademarks of the International Business Machines Corporation in the United States, other countries, or both:
Redbooks (logo) ®pSeries®z/OS®zSeries®AIX 5L™AIX®Candle®CICS®
DB2 Universal Database™DB2®ETEWatch®IBM®IMS™Lotus Notes®Lotus®Notes®
OMEGAMON®Rational®Redbooks®Tivoli Enterprise Console®Tivoli®WebSphere®
The following terms are trademarks of other companies:
SAP, and SAP logos are trademarks or registered trademarks of SAP AG in Germany and in several other countries.
Oracle, JD Edwards, PeopleSoft, Siebel, and TopLink are registered trademarks of Oracle Corporation and/or its affiliates.
IT Infrastructure Library, IT Infrastructure Library is a registered trademark of the Central Computer and Telecommunications Agency which is now part of the Office of Government Commerce.
ITIL is a registered trademark, and a registered community trademark of the Office of Government Commerce, and is registered in the U.S. Patent and Trademark Office.
Java, Java Naming and Directory Interface, JDBC, JMX, JVM, J2EE, Solaris, Sun, Sun Java, and all Java-based trademarks are trademarks of Sun Microsystems, Inc. in the United States, other countries, or both.
Microsoft, Outlook, Windows, and the Windows logo are trademarks of Microsoft Corporation in the United States, other countries, or both.
Intel, Intel logo, Intel Inside logo, and Intel Centrino logo are trademarks or registered trademarks of Intel Corporation or its subsidiaries in the United States, other countries, or both.
UNIX is a registered trademark of The Open Group in the United States and other countries.
Linux is a trademark of Linus Torvalds in the United States, other countries, or both.
Other company, product, or service names may be trademarks or service marks of others.
viii Deployment Guide Series: ITCAM for Response Time V6.2

Preface
This IBM® Redbooks® publication is written as part of the deployment guide series. This book provides a step-by-step guide for deploying ITCAM for Response Time V6.2. This deployment guide can help an IBM or business partner service person plan and perform the deployment of the product.
The discussion of ITCAM for Response Time includes the explanation of product architecture and its components. We discuss planning and sizing considerations before you implement the product and some guidelines on setting up service engagement for the product.
The deployment explained in the book would fit for a demonstration or a small deployment system, although the information is highly relevant for larger deployment engagements. This book also explains some usage scenario that can be performed for demonstrating the product.
The team that wrote this book
This book was produced by a team of specialists from around the world working at the International Technical Support Organization, Austin Center.
Budi Darmawan is a Project Leader at the International Technical Support Organization, Austin Center. He writes extensively and teaches IBM classes worldwide on all areas of systems management, primarily application management, business service management, and workload scheduling. Before joining the ITSO in 1999, Budi worked in IBM Indonesia as Lead Implementor and Solution Architect. His current interests are J2EE™ and SOA application management, z/OS® integration, and business service management.
Aleem Subhedar is a staff Software Engineer with India Software Labs in Pune, India. He has seven years of experience in AIX® and Middleware System Administration. He holds a degree in Chemistry from Pune University. His areas of expertise include AIX, pSeries®, and related system technologies. He is an IBM Certified System Expert, and his areas of interest include pSeries virtualization and high availability.
David Rintoul is a Senior IT Specialist who works as part of the TechWorks group in AP SWG. He has over 20 years of experience in the IT field. He holds a degree in Mathematics from Newcastle University. His areas of expertise include
© Copyright IBM Corp. 2008. All rights reserved. ix

the IBM Service Management products, the ITCAM family of products, and the Tivoli® zSeries® products.
Ronaldo Pires is an IBM IT Specialist. He joined IBM in 2004 and has been working on Global Technology Services Delivery in São Paulo, Brazil, supporting the systems management infrastructure for IBM outsourcing customers. His skills include IBM Tivoli Framework, IBM Tivoli Monitoring, IBM Tivoli Storage Manager, IBM Tivoli Identity Manager, Altiris Client Management Suite, BMC Control-M for z/OS, and BMC Control-D for z/OS. He holds a Bachelor of Mathematics from Faculdade de Filosofia Ciências e Letras de Santo André. He is a Tivoli Certified Consultant for Tivoli Storage Manager and IBM Certified Deployment Professional for Tivoli Monitoring V5.1.2.
Thanks to the following people for their contributions to this project:
Terry CopelandIBM Software Group
Become a published author
Join us for a two- to six-week residency program! Help write a book dealing with specific products or solutions, while getting hands-on experience with leading-edge technologies. You will have the opportunity to team with IBM technical professionals, Business Partners, and Clients.
Your efforts will help increase product acceptance and customer satisfaction. As a bonus, you will develop a network of contacts in IBM development labs, and increase your productivity and marketability.
Find out more about the residency program, browse the residency index, and apply online at:
ibm.com/redbooks/residencies.html
Comments welcome
Your comments are important to us!
We want our books to be as helpful as possible. Send us your comments about this book or other IBM Redbooks in one of the following ways:
� Use the online Contact us review Redbooks form found at:
ibm.com/redbooks
x Deployment Guide Series: ITCAM for Response Time V6.2

� Send your comments in an e-mail to:
� Mail your comments to:
IBM Corporation, International Technical Support OrganizationDept. HYTD Mail Station P0992455 South RoadPoughkeepsie, NY 12601-5400
Preface xi

xii Deployment Guide Series: ITCAM for Response Time V6.2

Part 1 Planning
In this part, we discuss planning information related to IBM Tivoli Composite Application Manager for Response Time V6.2 deployment.
Part 1
© Copyright IBM Corp. 2008. All rights reserved. 1

2 Deployment Guide Series: ITCAM for Response Time V6.2
Chapter 1. Solution introduction
ITCAM for Response Time V6.2 provides the ultimate measurement of response time for several different user environments. It assists monitoring and measurement of transaction response time to collect information about IT system capacity. This chapter is divided into:
� 1.1, “Response time measurement” on page 4� 1.2, “ITCAM for Response Time features” on page 6� 1.3, “ITCAM for Response Time value proposition” on page 7� 1.4, “Product architecture” on page 7
1
© Copyright IBM Corp. 2008. All rights reserved. 3

1.1 Response time measurement
Information technology (IT) provides services for its user in the form of facilities and applications for users to perform their day-to-day functions. These facilities and applications are in the form of IT services. They run transactions, perform workflows, and execute processes.
With the emerging initiative for IT to perform as a business-oriented entity, such as the implementation of IT infrastructure library (ITIL®) initiatives, the needs of having a formally defined Service Level Agreement (SLA) with user groups are developed. The SLA contains the service specifications that are provided by IT for the users.
The main service-level requirements from users are usually to have a defined availability and performance of the services they wanted to use. Availability assumes that the user can access the services that perform a function correctly, while performance indicates that the service returns the desired result within an acceptable amount of time.
Over the years, there have been some changes in how availability and performance information is measured. In a mainframe-based environment, the availability and performance of network and transaction manager can easily be measured from a central location, which is the mainframe itself. The introduction of multi-tiered programming and the thin client presentation layer has shifted these premises to need a more user-related approach. Performance must be measured from the end-user perspective. These user-based measurements are generally harder to collect, as they need a distributed collector and some or all users connected to the application.
4 Deployment Guide Series: ITCAM for Response Time V6.2

Figure 1-1 shows a typical multi-tiered application. It indicates that there are several points at which you can collect response time and availability information.
Figure 1-1 Multi-tiered application environment
Typical IT measurement would be using the time T2, the response time on which the transaction already entered into a machine that IT controls. The measurement can take several different methods. It may also simulate the network time by getting a feedback mechanism from the end-user machine. However, the best representation of the end-user experience is the collection of the time T1. It is what the end-user experiences.
IBM has participated in response time measurement. One of the notable standards for response time measurement is the Application Response Measurement (ARM) standard that now belongs to the Open Group:
http://www.opengroup.org/arm
This approach allows API calls to be inserted into application programs to call ARM, which indicates starts and stops of transactions. These would be tedious changes to incorporate into existing applications. The general approach is the insertion of the call on instrumenting the application. Instrumentation means that the external mechanism is employed to provide a hook on the application that measures response time, such as the time from when the Graphical Interface button is clicked until the screen changes.
Another important challenge of the end-user response time measurement is the scope of the monitoring or measurement. In a typical environment, the number of
Network
T1 T2 T3 T4
Chapter 1. Solution introduction 5

end-user machines greatly outnumbers the servers. For a single server, there may be hundreds or thousands of users. Should all of these users be included in the measurement? Should a limited number of samples be included? Or should there be a robotic representation of the user being defined?
1.2 ITCAM for Response Time features
ITCAM for Response Time provides the ability to collect response time and availability information by including the hook in the user application or performing an automated transaction to sample the user experience.
ITCAM for Response Time collects the response time information from end-user application instrumentation, such as Web traffic, 3270 interface, Lotus® Notes®, Microsoft® Outlook®, and other graphical applications. It also provides robotic simulations to check availability and response time of a scripted transaction. The transaction can be a Windows®-based, Web-based, Citrix, SAP®, or based on Mercury LoadRunner.
ITCAM for Response Time collects this response time information about the scope of an IBM Tivoli Monitoring environment. Data is collected in a common monitoring platform. This allows monitoring to be performed together with the resource monitoring, and allows cross reference and correlation of events.
The major features of ITCAM for Response Time are:
� Helps monitor real user response time. It can identify sporadic problems that would otherwise get lost in the averages and show what users are experiencing.
� Records and plays back synthetic transactions. This provides both availability and response time monitoring, which can be useful for testing different locations and service providers and helps proactively find problems.
� Helps automate business practices. It creates comprehensive automated policies and situations to proactively help manage the user experience, and provides expert advice to help understand how to best resolve specific response time issues.
� Delivers end-to-end integration using a common user interface. The integration of data and events with other IBM Tivoli Monitoring based solutions from IBM Tivoli Composite Application Manager, IBM Tivoli Monitoring, and IBM Tivoli OMEGAMON® to help provide comprehensive management of business applications. It thus allows management of the entire enterprise with a single user interface, therefore eliminating the need to learn multiple tools with different user interfaces and resulting in faster return on investment.
6 Deployment Guide Series: ITCAM for Response Time V6.2

See the following URL for more information:
http://www-306.ibm.com/software/tivoli/products/composite-application-mgr-response-time/
1.3 ITCAM for Response Time value proposition
ITCAM for Response Time provides the following benefits:
� Shorter problem identification to resolution times.
� Reduced support cost in determining the cause of downtime/slow down.
� Increased revenue and customer satisfaction by maintaining SLAs.
� Reduced need for costly and hard-to-find subject matter experts to solve problems.
� Role-based user interface to provide the correct level of information to the correct user for quick problem identification, seamless hand-off, and problem resolution.
� Tivoli Enterprise Portal integration provides the ability to manage your entire enterprise with a single user interface, eliminating the need to learn multiple tools with different user interfaces, resulting in faster return on investment.
1.4 Product architecture
ITCAM for Response Time Version 6.2 is an evolution from IBM Tivoli Composite Application Manager for Response Time Tracking Version 6.1. It inherits some of the major components and functions of that product.
Chapter 1. Solution introduction 7

Figure 1-2 shows the ITCAM for Response Time V6.2 component relationships and logical architecture.
Figure 1-2 ITCAM for Response Time architecture
ITCAM for Response Time is an IBM Tivoli Monitoring 6.1 application. The IBM Tivoli Monitoring base architecture is explained in Deployment Guide Series: IBM Tivoli Monitoring 6.1, SG24-7188. An operator accesses ITCAM for Response Time using Tivoli Enterprise Portal, either the browser or the desktop version.
In Figure 1-2, the bolded boxes represent the ITCAM for Response Time agents. The Robotic, Client, and Web Response Time agents connect to the application and retrieve response time information. Response time data is then stored in the Tivoli Data Warehouse. The End-user Dashboard component provides a comprehensive response time interface for all applications and agents on a specified IBM Tivoli Monitoring instance.
The End-user Dashboard also acts as robotic file depot. It stores the robotic scripts from either the Rational® Robot or the Rational Performance Tester. These scripts are loaded by the Robotic Response Time agent for execution.
End User Dashboard
Robotic Response Time Agent
Client Response Time Agent
Web Response Time Agent
App
licat
ion
Tivoli Enterprise Monitoring Server
Warehouse proxy
Tivoli Enterprise Portal Server
ProbeMetric
Response timeData
Tivoli Data Warehouse
Rational Performance
TesterRational Robot
Script depot
Multi FileUploader
Uploadplugin
8 Deployment Guide Series: ITCAM for Response Time V6.2

Response time information from the Tivoli Enterprise Monitoring Agent is collected whenever one of the following happens:
� An online request is issued by Tivoli Enterprise Portal (manual refresh or autoupdate interval expires).
� A situation interval expires and the situation requests the data.
� The historical collection interval expires and the current data is written out to the historical file.
We discuss the four components of ITCAM for Response Time in the following sections:
� 1.4.1, “Web Response Time agent” on page 9� 1.4.2, “Client Response Time agent” on page 11� 1.4.3, “Robotic Response Time agent” on page 13� 1.4.4, “End User Response Time Dashboard agent” on page 14
1.4.1 Web Response Time agent
The Web Response Time agent collects user response time for HTTP and HTTPS Web transactions.
� For HTTP traffic, the agent can listen to the local TCP/IP stack and measure the response time of the transaction.
� For HTTPS traffic, as the product needs to access an unencrypted HTTP data stream, the agent runs on the Web server machine and makes use of the Web server exits to get access to the data stream.
� Appliance mode allows the agent to collect HTTP traffic from other machines in the same network segment by enabling collection of network packets in promiscuous mode.
Chapter 1. Solution introduction 9

The agent is made up of three components, as displayed in Figure 1-3.
Figure 1-3 Web Response Time Agent structure
The components are:
� Analyzer component
The Analyzer component operates as a TCP/IP network component logically at the NIC card physical layer. This component observes the network packets and applies a patented response time technique to collect the end-to-end response time of outgoing and incoming sockets. This collects response time all the way down to the requesting source without requiring a software agent at the source.
In a Windows platform, the analyzer runs as a service called Candle® Media Analyzer. In UNIX® or Linux®, it runs a separate process.
� Web Response Monitor component
The Web Response Monitor component collects the socket information from the Analyzer component and correlates all the subcomponents of the Web transaction. When the complete transaction information has been collected, the record is written out to a file (YYYYMMDD.sm3, where YYYY is the year, MM is the month, and DD is the day). The YYYMMDD.sm3 file can be found under the IBM Tivoli Monitoring directory. In Windows it is under the TMAITM6\wrm\log directory.
The analyzer communicates to the Web Response Monitor using port 12121 and 1431, typically.
The Web Response Monitor runs as a service under Windows known as Candle Web Response Monitor - Collection.
Tivoli Enterprise Monitoring Agent
Network Interface
Card
Web Server exit
Tivoli Enterprise Monitoring Server
yyyymmdd.SM3
Web Response Monitor
1431
1Analyzer component
12121
10 Deployment Guide Series: ITCAM for Response Time V6.2

� Tivoli Enterprise Monitoring Agent
The Tivoli Enterprise Monitoring Agent reads the SM3 file and aggregates the data over a user-defined interval (5 minutes by default). It then calculates the information for displays on the workspaces.
The Tivoli Enterprise Monitoring Agent also starts and stops the Analyzer and Web Response Monitor components, so that they are started when the Tivoli Enterprise Monitoring Agent is started and the Tivoli Enterprise Monitoring Agent stops them when the it is stopped.
The Tivoli Enterprise Monitoring Agent performs all the usual IBM Tivoli Monitoring 6.1 agent activities:
– Responds to requests for data
– Logs data to binary history files if historical recording is turned on
– Runs situations when their intervals expire
– Heartbeats the Tivoli Enterprise Monitoring Server to make sure that it is still available
– Responds to Tivoli Enterprise Monitoring Server heartbeats
The Tivoli Enterprise Monitoring Agent runs as a service under Windows called ITCAM for Web Response Time agent and as kt5agent process in UNIX and Linux.
1.4.2 Client Response Time agent
The Client Response Time agent is installed on a Windows desktop to monitor desktop applications that run on that machine. This machine is typically a user machine on which someone is working with the monitored application. It analyzes a combination of Windows messages and TCP/IP network traffic to compute the user response time for transactions created by monitored GUI applications.
Note: When the duration between a stop request and start request is too close (such as using the restart process), the analyzer or Web Response Monitor processes may not be stopped properly.
Chapter 1. Solution introduction 11

The logical architecture of the Client Response Time agent is shown in Figure 1-4.
Figure 1-4 Client Response Time agent
The Client Response Time agent consists of:
� Client Application Tracker
The Client Application Tracker monitors the application as defined by behavior modules. The behavior modules come as part of the product, or they can be developed by a user using the ETEWatch® Customizer component that is available on the IBM Tivoli Open Process Automation Library at “http://catalog.lotus.com/wps/portal/topal. The product comes with support for:
– Lotus Notes Versions 6 and 7 – Microsoft Outlook 2000 and 2003 – SAP GUI 6.x – IBM PCOMM 5.X (TN3270 protocol only) – Hummingbird (TN3270 protocol only)– Exceed 11 (TN3270 protocol only)– Attachmate Extra 8 TN3270 emulators
Behavior modules reside in the <itm>\TMAITM6\cat\Mgmt\Collector\TC directory on Windows and have a .dat file suffix.
The Client Application Tracker component reads the behavior files at startup and monitors the applications defined in those behavior files. It makes use of windows messages and TCP/IP data stream to decipher the start and stop times of transactions caused by the users interacting with the monitored applications. When a transaction record is completed it is written out to a daily
Tivoli Enterprise Monitoring Agent
yyyymmdd.logClient Application
Tracker
Client application Behavior module
ARM application
ARM_mmm_nnnnnnnnnnn.dat
Tivoli Enterprise Monitoring Server
12 Deployment Guide Series: ITCAM for Response Time V6.2

log file called YYYYMMDD.log (where YYYY is the year, MM the month, and DD the day), which is aggregated in a similar way to how the Web Response time agent aggregates its sm3 file. This file resides in <itm>\TMAITM6\cat\Mgmt\Log. In Windows, the Client Application Tracker runs as a service called IBM Client Application Tracker.
� The Tivoli Enterprise Monitoring Agent
The Tivoli Enterprise Monitoring Agent aggregates the data over a user-defined interval (5 minutes by default) and calculates the information necessary to populate the IBM Tivoli Monitoring tables that are reported in Tivoli Enterprise Portal workspaces.
The Tivoli Enterprise Monitoring Agent performs all the usual IBM Tivoli Monitoring 6.1 agent activities:
– Responds to requests for data– Logs data to binary history files if historical recording is turned on– Runs situations when their interval expires – Sends heartbeats to indicate its availability– Responds to Tivoli Enterprise Monitoring Server heartbeats
In Windows, the Tivoli Enterprise Monitoring Agent runs as a ITCAM for Client Response Time agent service and as the process kt4agent under Linux and UNIX.
The Tivoli Enterprise Monitoring Agent can also collect Application Response Measurement (ARM) Version 2 and ARM Version 4 records that are produced by any ARM instrumented application. The ARM_mmmm_nnnnnnnnnn.dat file (where mmmm is the pid of the program creating the ARM records and nnnnnnnnnn is the timestamp) is created in the <itm>\TMATITM6\cat\Mgmt\Collector\TC directory on Windows.
1.4.3 Robotic Response Time agent
The Robotic Response Time agent is installed on Windows, Linux, or UNIX to accept response and availability information from the supported robotic runtime environment. The robotic runtime environments currently supported are:
� Rational Performance Tester� Rational Robot � Command Line Interface (CLI)� Mercury LoadRunner
Chapter 1. Solution introduction 13

The logical architecture of the agent is displayed in Figure 1-5.
Figure 1-5 Robotic Response Time agent
The agent collects response and availability information in the form of ARM V2 and ARM V4 records and logs these to the file. The full name of the file is ARM_nnnn_mmmmm.dat, where mmmm is the pid of the program creating the ARM records and nnnnnnnnnn is the timestamp. The robots execute at the interval defined at install time (the default is every 15 minutes). This can be changed subsequently.
The agent runs as the service ITCAM for Robot Response Time under Windows and as the process kt6agent under UNIX and Linux.
1.4.4 End User Response Time Dashboard agent
The End User Response Time Dashboard (End-user Dashboard) agent consolidates the historical data from all other ITCAM for Response Time agents:
� Client Response Time � Robotic Response Time� Web Response Time
As a consolidator, there is only one End User Response Time Dashboard agent in each IBM Tivoli Monitoring environment. The End User Response Time Dashboard agent also acts as the file depot for the robotic scripts.
The ITCAM for End User Response Time Dashboard agent integrates up to eight hours of historical data from the Tivoli Data Warehouse (TDW). In Windows, the agent runs as a service called ITCAM for End User Response time and as a process in Linux and UNIX called kt3agent.
Tivoli Enterprise Monitoring Agent
Tivoli Enterprise Monitoring Server
Rational Robot
Rational Performance Tester
Mercury LoadRunner
CLI execution
ARM_mmm_nnnnnnnnnnn.dat
14 Deployment Guide Series: ITCAM for Response Time V6.2

The product provides automated ways of distributing scripts to the agents. Manual methods are also documented. There are two deployments required:
� “Deploying the script to the repository” on page 15 � “Deploying the script from the repository to the agent” on page 16
Figure 1-6 shows the high-level view of the architecture.
Figure 1-6 Script deployment
Deploying the script to the repositoryDeploying the script to the repository can be achieved in two ways:
� Automated deployment to the repository
The repository is a directory that is part of the ITCAM for Response Time dashboard agent. It is typically found at <itm>/kt1depot/T3/<type>, where <itm> is the location of the IBM Tivoli Monitoring install directory and <type> is dependent on the type of script such as RPT, CLI, ROBOT_GUI, or ROBOT_VU.
Rational Performance Tester has the ability to send packaged scripts directly to the dashboard agent. The Rational Performance Tester workbench contains an export destination for ITCAM for Response Time. This uses a SOAP mechanism to send the scripts to the repository. It uses port 1976 by default.
Automated sending of CLI, Load Runner, or Rational Robot scripts to the repository uses the Multiple File Uploader (MFU) facility. It can be accessed from the Tivoli Enterprise Portal navigator or using a remote Java™ WebStart facility The MFU also uses SOAP calls from port 1976 by default.
For Rational Robot, the Multi File Uploader discovers scripts stored under <itm>\tmaitm6\app\genwin\project\<projectname>\TestData\TestDataStore\DefaultTestScriptDatastore\TMS_Scripts.
End user Dashboard Agent(T3)
Test scriptsTest scriptsTest scriptsTest scripts
Robotic Response Time Agent (T6)
Rational Performance
Tester
Multi File Uploader
RP
C
Chapter 1. Solution introduction 15

� Manual deployment to the repository
The scripts (as zip files) can be manually placed directly in the repository directory <itm>/kt1depot/T3/type, where <itm> is the location of the IBM Tivoli Monitoring install directory and type is dependent on the type of script, such as ROBOT_GUI, ROBOT_VU, RPT, or CLI.
Deploying the script from the repository to the agentThe scripts can be deployed in two ways between the respository and the agent:
� Automatically deploying the script
At user-defined intervals (15 minutes by default), the End User Response Time Dashboard agent pulls the new scripts from the repository to the executing agent. They are copied to a directory called <itm>/kt1depot/t6/<type>, where type is the type of script, such as CLI, RPT, Robot_GUI, or Robot_VU.
� Manual deploying from the repository to the agent
Scripts can be manually distributed by copying the scripts from the repository at <itm>/kt1depot/T3/<type> to the machine running the robotic agent under <itm>/kt1depot/t6/<type>.
Both the manual and the automated deployment to the agent make use of an RPC capability between the repository and the ITCAM for Robotic Response Time Agent. This capability exists in the Tivoli Enterprise Monitoring Server, and it is installed automatically on Windows and needs to be manually installed on other platforms.
16 Deployment Guide Series: ITCAM for Response Time V6.2

Chapter 2. Solution environment
This chapter discusses the environment that is needed for deploying ITCAM for Response Time V6.2. This includes prerequisites and planning information. The discussion consists of:
� 2.1, “Hardware prerequisites” on page 18� 2.2, “Software prerequisites” on page 19� 2.3, “Sizing consideration” on page 22� 2.4, “Typical deployment environments” on page 22
2
© Copyright IBM Corp. 2008. All rights reserved. 17

2.1 Hardware prerequisites
The hardware requirements for ITCAM for Response Time relate to the requirements of IBM Tivoli Monitoring V6.1. For the IBM Tivoli Monitoring servers, such as Tivoli Enterprise Monitoring Server or Tivoli Enterprise Portal Server, we recommend that processor speeds be at least 1 GHz for RISC architectures and 2 GHz for Intel® architectures. A single processor is suitable when the components are installed on separate computers.
Table 2-1 lists the memory and disk requirements for IBM Tivoli Monitoring servers.
Table 2-1 IBM Tivoli Monitoring memory and disk requirement
The hardware requirement for IBM Tivoli Monitoring servers is discussed in detail in:
http://publib.boulder.ibm.com/infocenter/tivihelp/v15r1/topic/com.ibm.itm.doc/itm_install61.htm#hardware
See also Deployment Guide Series: IBM Tivoli Monitoring 6.1, SG24-7188, for more information about the configuration of the IBM Tivoli Monitoring servers.
Component Memory requirementa
a. The memory requirement range is based on the processing needs. The low end is for around 100–200 monitoring agents, while the high end is for around 500–1000 monitoring agents.
Disk space requirement
Hub monitoring server 70 MB–100 MB 650 MB
Remote monitoring server 100 MB–300 MB 250 MB
Portal server 100 MB–300 MB 800 MB
Portal client 150 MB–300 MB 150 MB
Tivoli data warehouse 2 GB–8 GB Must be calculatedb
b. The amount of data of the Tivoli Data Warehouse depends on the size of data for each attribute groups. For each attribute group, you need the number of detailed records per day, the data size per record, and the aggregation policy. See http://publib.boulder.ibm.com/infocenter/tivihelp/v15r1/topic/com.ibm.itm.doc/itm_install65.htm#estimate.
Warehouse proxy agent 50 MB–100 MB 150 MB
Summarization and pruning agent
150 MB–300 MB 150 MB
18 Deployment Guide Series: ITCAM for Response Time V6.2

Specifically for ITCAM for Response Time, the agents have additional requirements for memory and disk space. These additional requirements are on top of any existing capacity needs. Table 2-2 lists the minimum and recommended memory and disk requirements.
Table 2-2 Requirement
The disk space requirement in Table 2-2 for the Robotic, Client, and Web response time agents varies widely depending on the transaction load, monitoring level, and tracing level of the agent.
For the most up-to-date prerequisites, refer to:
http://publib.boulder.ibm.com/tividd/td/ITCAMRT/prereq62/en_US/HTML/memory.html
2.2 Software prerequisites
The software requirements for ITCAM for Response Time V6.2 are discussed in:
� 2.2.1, “Operating system” on page 19� 2.2.2, “Other software requirements” on page 20
2.2.1 Operating system
The supported operating system matrix is provided in:
http://publib.boulder.ibm.com/tividd/td/ITCAMRT/prereq62/en_US/HTML/operatingsysystem.html
Resource Minimum machine memory
Recommended machine memory
Minimum additional disk space
Recommended additional disk space
End user response time dashboard
512 MB 1 GB 512 MB 512 MB
Robotic response time 512 MB 1 GB 512 MB 1 GB
Client response time 100 MB 256 MB 256 MB 512 MB
Web response time 512 MB 1 GB 512 MB 2 GB
Chapter 2. Solution environment 19

Table 2-3 lists the supported operating system level at the time that we this deployment guide was written.
Table 2-3 Supported operating systems
2.2.2 Other software requirements
The software requirements depending on the agent type are needed to perform the functions of ITCAM for Response Time V6.2.
Operating system
Clien
t A
pp
lication
Tracker
Gen
ericA
RM
CL
I p
layback
Ratio
nal
Perfo
rman
ceTester
Ratio
nal
Ro
bo
t
Mercu
ryL
oad
Ru
nn
er
Web
Resp
on
se T
ime A
gen
t
En
d-u
serD
ashb
oard
Ag
ent
AIX 5L™ V5.3 - Yes Yes - - - Yes Yes
Solaris™ 9 with patch 111711-16
- Yes Yes - - - Yes Yes
Solaris 10 - Yes Yes - - - Yes Yes
HPUX 11i V2 (PA-RISC)
- Yes Yes - - - Yes Yes
Windows XP Pro SP2 Yes Yes Yes Yes Yes Yes Yes Yes
Windows 2000 Pro Yes Yes Yes Yes Yes Yes Yes Yes
Windows 2000 Server Yes Yes Yes Yes Yes Yes Yes Yes
Windows 2003 Server Yes Yes Yes Yes Yes Yes Yes Yes
Windows 2003 Server 64-bit
Yes Yes Yes Yes Yes Yes - Yes
RHEL 4.0 - Yes Yes Yes - - Yes Yes
RHEL 4.0 64-bit - Yes - - - - Yes Yes
RFAS 4.1 - Yes Yes - - - Yes -
RFAS 5.1 - Yes Yes - - - Yes -
SLES 9.x - Yes Yes Yes - - Yes Yes
SLES 10.x - Yes Yes Yes - - Yes Yes
SLES 9.x 64-bit - Yes - - - - Yes Yes
SLES 10.x 64-bit - Yes - - - - Yes Yes
20 Deployment Guide Series: ITCAM for Response Time V6.2

Generic software requirementsThese software levels are needed for all agents:
� IBM Tivoli Monitoring V6.1 with fix pack 5
� Tivoli Enterprise Console® V3.7.1, V3.8, and V3.9
� Tivoli Data Warehouse V2.1
� Tivoli Configuration Manager Version 41142 or later for installing agents using SPD files
Client Response Time agent software requirementsThese software levels are needed for the Client Response Time agent:
� Application Response Measurement V2.0 or V4.0� Lotus Notes V6.x or V7.x� Microsoft Outlook 2000 and 2003� SAP Graphical User Interface 6.x� TN3270 software:
– IBM Personal Communication 5.x – Hummingbird Exceed 11– Attachmate Extra 8
Robotic Response Time agent software requirementsThese software levels are needed for the Robotic Response Time agent:
� Rational Performance Tester V7� Rational Robot SR6 2003.06.15.xxx� Mercury LoadRunner V8.0 and V8.1� Citrix hosted applications � SAP � Siebel® V7.7 and V7.8
Web Response Time agent software requirementsThese software levels are needed for the Web Response Time agent:
� IBM HTTP Server 6.0.x, 2.0.47+, 1.3*
– For both HTTP and HTTPS protocols– Running on AIX, Solaris, HPUX, Windows, Linux on Intel servers
� Microsoft Internet Information Server 6.0
– For both HTTP and HTTPS protocols– Running on Windows servers
Chapter 2. Solution environment 21

� iPlanet Web Server 6.0, Sun™ Java™ System Web Server 6.1
– For HTTP protocol running on AIX, Solaris, HPUX, Windows, Linux on Intel servers
– For HTTPS protocol running on Solaris
� Other Web Servers, including Apache 2.0.47+ and 2.2.0
– For HTTP protocol only– Running on AIX, Solaris, HPUX, Windows, Linux on Intel servers
2.3 Sizing consideration
The maximum scalability considerations for ITCAM for Response Time V6.2 are:
� Client Response Time supports up to 5,000 agents for a single Tivoli Enterprise Monitoring Server hub
� Robotic Response Time capacity for scripts running every five minutes is:
– Rational Robot GUI: 10 scripts – Command Line playback: 25 scripts – Mercury Load Runner: 25 scripts – Rational Robot VU: 25 scripts – Rational Performance Tester: 25 scripts
� Web Response Time sizing for capturing traffic:
– HTTP supports 1.8 million requests per hour– HTTPS supports 400,000 requests per hour
2.4 Typical deployment environments
In this section we discuss some considerations for deployment of ITCAM for Response Time V6.2. The considerations are typically related to the structure of IBM Tivoli Monitoring servers and the connection for ITCAM for Response Time agents to connect to the Tivoli Enterprise Monitoring Server. See also Deployment Guide Series: IBM Tivoli Monitoring 6.1, SG24-7188.
We discuss different scenarios in the following sections:
� 2.4.1, “Demonstration or proof of concept” on page 23� 2.4.2, “Small and medium” on page 23� 2.4.3, “Large and very large” on page 25
22 Deployment Guide Series: ITCAM for Response Time V6.2

2.4.1 Demonstration or proof of concept
The demonstration or proof-of-concept deployment focuses on speed for bringing the system up and showing the functions. It does not consider performance and load of the servers or the system reliability. A typical configuration is shown in Figure 2-1.
Figure 2-1 Demonstration or proof of concept
The configuration shown in Figure 2-1 consists of:
� A single server running DB2® Universal Database™ for Tivoli Data Warehouse and Tivoli Enterprise Portal Server database, End User Response Time Dashboard agent, Tivoli Enterprise Monitoring Server, Tivoli Enterprise Portal Server, and Warehouse Proxy. The Summarization and Pruning agent is not configured, as the system would not be around for a long period of time.
� Various agents running on client machines to monitor response time using the Client Response Time agent, Robotic Response Time agent, and Web Response Time agent. Depending on the available systems, you can put these agents on the same or different machines. Having the agents on different machines allows an easier understanding of the scenarios.
2.4.2 Small and medium
A small or medium scale environment would accommodate a larger number of agents with consideration for performance of the system. This environment has
TEMA TEMATEMATEMA
DB2 Data WarehouseMonitoring Server
Portal ServerWarehouse Proxy
Sumarization and Pruning
Chapter 2. Solution environment 23

more specialization for the servers and allows some load to be balanced to a remote Tivoli Enterprise Monitoring Server. This environment may be applicable for 1–5 sites with less than 1,000 monitored clients. Each remote Tivoli Enterprise Monitoring Server is capable of handling up to 1,000 agents. A typical configuration is shown in Figure 2-2.
Figure 2-2 Small and medium environment
The small and medium environment shown in Figure 2-2 includes:
� A specialized hub for Tivoli Enterprise Monitoring Server and Tivoli Enterprise Portal Server
� A separate machine for handling Tivoli Data Warehouse with Warehouse Proxy, Summarization and Pruning Agent, and End User Response Time Dashboard agent
� Remote Tivoli Enterprise Monitoring Server handling agent communication from different sites, instead of directly from the hub Tivoli Enterprise Monitoring Server
TEMATEMA
TEMA
TEMATEMA
TEMA
TEMATEMA
TEMA
Remote TEMS
Remote TEMS
Remote TEMS
DB2 (for Portal Server)Hub Monitoring Server
Portal Server
DB2 Data WarehouseWarehouse Proxy
Sumarization and Pruning
24 Deployment Guide Series: ITCAM for Response Time V6.2

2.4.3 Large and very large
For a larger environment, redundancy and performance are becoming very critical. This design includes multiple levels of a Tivoli Enterprise Monitoring Server structure with the failover capability. All major central functions are running on separate servers with their required redundancy. Figure 2-3 shows an example of a large system deployment.
Figure 2-3 Large system deployment
TEMATEMA
TEMA
TEMATEMA
TEMA
TEMATEMA
TEMA
Remote TEMS
Remote TEMS
Remote TEMS
Warehouse ProxySumarization and Pruning
FailoverHub Monitoring Servers
Portal Server
DB2 database
Chapter 2. Solution environment 25

In Figure 2-3 on page 25, the configuration includes:
� Separate servers for:
– Tivoli Data Warehouse database– Hub Tivoli Enterprise Monitoring Server (two servers)– Tivoli Enterprise Portal Server– Warehouse proxy and Summarization and Pruning agent– End User Response Time Dashboard agent
� Separate remote Tivoli Enterprise Monitoring Server for each site
26 Deployment Guide Series: ITCAM for Response Time V6.2

Chapter 3. Project planning
This chapter discusses project planning information that is relevant to the deployment of ITCAM for Response Time V6.2. The discussion consists of:
� 3.1, “Required skills” on page 28� 3.2, “Solution description and assumptions” on page 28� 3.3, “Task break down” on page 29
3
© Copyright IBM Corp. 2008. All rights reserved. 27

3.1 Required skills
For the implementation of ITCAM for Response Time V6.2, you should understand the following prerequisite skills:
� IBM Tivoli Monitoring architecture
� Response time monitoring tools and techniques
� Application environments
� Database skill
� Networking and Web transaction knowledge
� Robotic scripting environment, such as defining Rational Performance Tester script or Rational Robot script
� ETEWatch customizer (optional), only needed if you want to create instrumentation for an unsupported application with a Client Response Time agent
� Working with Tivoli Enterprise Portal
Apart from the above requirements, you would have to know the ITCAM for Response Time V6.2 itself. This includes:
� Using the workspaces� Running multi-file uploader� Upload Rational Performance Tester script� Navigating ITCAM for Response Time workspaces
There is a certification for ITCAM for Response Time deployment professionals. The certification test number is 910. For detailed requirements for this certification see:
http://www-03.ibm.com/certify/certs/24010802.shtml
3.2 Solution description and assumptions
The ITCAM for Response Time solution would monitor response time for an application. The monitoring methodology must be established using a series of planning sessions with the customer. In the planning sessions, the following items should be addressed:
� The applications or IT services that would be included in the implementation, what server hosts those applications, where are these servers, what connectivity option exists.
28 Deployment Guide Series: ITCAM for Response Time V6.2

� The users or clients that use the applications, how many of them, where are they located, whether all would be monitored or just a sample of them.
� The access method to the application, such as Web-based, Citrix, Lotus Notes, or custom GUI interface.
� Identify critical transactions and measurement points. Which transactions can represent availability? Is there a specific transaction that can be simulated using a robotic transaction tool?
Based on the above requirement from the customer, you can start developing the solution configuration and implementation methods. The configuration involves defining where to put critical components, such as Tivoli Enterprise Monitoring Server and the End User Response Time Dashboard agent, and the implementation method, including deployment of the agents, remote deployment, the software distribution option, or silent installation.
Sometimes you can perform only a sub-set of the identified final configuration. The complete configuration would be up to the customer to implement. You must pre-determine the initial sub-set to implement that is representative of the final configuration.
3.3 Task break down
The detailed tasks for ITCAM for Response Time implementation are divided into:
� 3.3.1, “Project kickoff” on page 29� 3.3.2, “Environment preparation” on page 30� 3.3.3, “IBM Tivoli Monitoring setup” on page 30� 3.3.4, “Application support files installation” on page 30� 3.3.5, “ITCAM for Response Time agents setup” on page 31� 3.3.6, “Customizing the product” on page 31� 3.3.7, “Demonstrating the solution and skill transfer” on page 32
3.3.1 Project kickoff
The initiation of the project is a critical task that allows all participants to be identified. This initiation allows roles and responsibilities to be presented and a generic project plan to be laid out.
The kickoff is also an important milestone to promote the project to the customer’s user base and generate interest for the project.
Chapter 3. Project planning 29

3.3.2 Environment preparation
The initial environment preparation has these objectives:
� Install and prepare the new server machines with the appropriate operating system and network connectivity. This applies to the machines that would run Tivoli Enterprise Monitoring Server, Tivoli Data Warehouse, and other servers.
� Identify client or agent machines on which the Tivoli Enterprise Monitoring Agent would be installed. This includes tabulating their IP addresses, host name, owner, access to the machine, and other relevant information.
� Collect installation media and required software for the installation.
Depending on the size of the implementation and the readiness of the environment, this can be performed for several hours or several days.
3.3.3 IBM Tivoli Monitoring setup
Once the environment preparation is done, IBM Tivoli Monitoring V6.1 can be installed. This includes installing DB2 Universal Database V8.1 for Tivoli Enterprise Portal Server and maybe the Tivoli Data Warehouse.
For IBM Tivoli Monitoring, you must install the following components:
� Tivoli Enterprise Monitoring Server
� Tivoli Enterprise Portal Server
� Warehouse Proxy
� Summarization and Pruning agent (not needed for demonstration or proof of concept installation)
For more information about the detailed tasks, see Deployment Guide Series: IBM Tivoli Monitoring 6.1, SG24-7188.
3.3.4 Application support files installation
Before ITCAM for Response Time components are installed, you must install the application support files. The application support files must be installed on Tivoli Enterprise Monitoring Server, Tivoli Enterprise Portal desktop client, and Tivoli Enterprise Portal Server machines.
Depending on the configuration of the IBM Tivoli Monitoring environment, you may need to install this application support files to one or more machines. During this installation, the Tivoli Enterprise Monitoring Server and Tivoli Enterprise
30 Deployment Guide Series: ITCAM for Response Time V6.2

Portal Server must be restarted. This must be scheduled for minimal interruption for the operation.
The detailed procedure of this installation is provided in 4.2, “Installing application support files for Windows” on page 38.
3.3.5 ITCAM for Response Time agents setup
The agents for ITCAM for Response Time must then be installed on the appropriate machines. Some of these agents must be installed on the users’ machines. This deployment must be done with the least interruption to their work possible. Depending on the environment, the following are ideas about performing the installation:
� Installation with an existing software distribution mechanism such as IBM Tivoli Configuration Manager.
� Remote deployment of agent using the operating system agent that is already installed.
� Silent installation using a login script for Windows machines.
� Or if there is no other option, you can also run the GUI installation wizard on the user machine.
Detailed steps of these installations are provided in the following sections:
� 4.3, “Installing End User Response Time Dashboard” on page 51� 4.4, “Installing ITCAM for Robotic Response Time” on page 61� 4.5, “Installing ITCAM for Web Response Time” on page 71� 4.6, “Installing ITCAM for Client Response Time” on page 87
3.3.6 Customizing the product
This task is the most time-consuming and critical task. This is where the design of the solution would be implemented. The identified requirement from 3.2, “Solution description and assumptions” on page 28, should be realized in this task. This task includes:
� “Developing monitoring script” on page 31� “Loading behavior modules” on page 32� “Instrumenting Web servers” on page 32� “Defining situations” on page 32
Developing monitoring scriptRobotic monitoring scripts must be built using the appropriate tools, such as Rational Robot or Rational Performance Tester. The robotic script must be
Chapter 3. Project planning 31

designed such a way that it represents a valid representative user interaction to the application and also must not be disruptive to the application itself if it is run over and over again. Specific details for the Rational Performance Tester installation are provided in 4.7, “Installing Rational Performance Tester Workbench” on page 93.
Loading behavior modulesIf the monitored user application is not using a standard out-of-the box interface for the Client Response Time agent, you may build the behavior module using the ETEWatch customizer from IBM Open Process Automation Library at:
http://catalog.lotus.com/topal?NavCode=1TW10CP0E
This allows you to be able to define any graphical application as a managed application using the Client Response Time agent.
Instrumenting Web serversWhen you want to monitor HTTPS traffic, a Web server exit on the supported Web servers must be installed. This requires some additional customization to be performed, depending on the Web server platform.
Defining situationsWhen the entire interface is in place and data are collected, you define situations. Situations allow you to monitor a large number of systems without requiring you to navigate Tivoli Enterprise Portal workspaces. Situations generate alerts or events to notify you when something goes wrong. There are some predefined situations from ITCAM for Response Time that you may want to customize to set a threshold and name for your environment.
3.3.7 Demonstrating the solution and skill transfer
After the customization has been completed, the solutions are in place, and you can demonstrate the result to the customer. This demonstration can signify your completion milestone. You must also perform skill transfer, so the customer’s personnel would then be able to operate and maintain the solution on a day-to-day basis. This is an important task that ensures smooth hand over of the overall project.
The demonstration tasks are provided in Chapter 5, “Usage demonstration” on page 103.
32 Deployment Guide Series: ITCAM for Response Time V6.2

Part 2 Deployment
In this part, we describe scenarios related to the actual deployment and usage of ITCAM for Response Time V6.2.
Part 2
© Copyright IBM Corp. 2008. All rights reserved. 33

34 Deployment Guide Series: ITCAM for Response Time V6.2

Chapter 4. Installation and configuration
In this chapter we provide step-by-step instructions for installing ITCAM for Response Time 6.2. This chapter consists of the following sections:
� 4.1, “Installation overview” on page 36� 4.2, “Installing application support files for Windows” on page 38� 4.3, “Installing End User Response Time Dashboard” on page 51� 4.4, “Installing ITCAM for Robotic Response Time” on page 61� 4.5, “Installing ITCAM for Web Response Time” on page 71� 4.6, “Installing ITCAM for Client Response Time” on page 87� 4.7, “Installing Rational Performance Tester Workbench” on page 93
4
© Copyright IBM Corp. 2008. All rights reserved. 35

4.1 Installation overview
In our environment, we installed all four agents provided with the ITCAM for Response Time 6.2. You do not need to install all of the agents provided. You should install the agent that best fits your needs, as described in Table 4-1.
Table 4-1 Choosing which monitoring agent to use
Once you have decided what you want to monitor and which agents to install, verify the prerequisites at:
http://publib.boulder.ibm.com/tividd/td/ITCAMRT/prereq62/en_US/HTML/Version62.html
For this deployment guide, we installed the Tivoli Enterprise Monitoring Server, Tivoli Enterprise Portal Server, Tivoli Enterprise Portal Desktop Client, Warehouse Proxy, Warehouse Summarization and Pruning agent, and the Warehouse Database on the same server. This type of installation is recommended only for proof of concepts or small-size environments. For more information about IBM Tivoli Monitoring design considerations see IBM Tivoli Monitoring Installation and Setup Guide, GC32-9407. You should consult also
If you want to Use this agent
Monitor real user response times for Lotus Notes, Microsoft Outlook, or applications running in a Citrix or Terminal Services environment.Understand real user client experience.Monitor custom Windows applications.Monitor real user 3270 transactions.
ITCAM for Client Response Time
Upload and store the robotic scripts that you use with ITCAM for Robotic Response Time. This agent is required in order to upload the IBM Rational Performance Tester scripts that you recorded.Have a consolidated enterprise view of all application performance and availability.Create custom roles to limit access to application data.
ITCAM for End User Response Time Dashboard
Run an existing Mercury Load Runner script and monitor the results with this product.Run robotic monitoring for Web applications, Siebel, SAP, and Citrix.Run a custom application, script, or command and see results.
ITCAM for Robotic Response Time
Monitor real user transactions on an HTTP server. Discover new URLs.
ITCAM for Web Response Time
36 Deployment Guide Series: ITCAM for Response Time V6.2

the Deployment Guide Series: IBM Deployment Guide Series: IBM Tivoli Monitoring 6.1, SG24-7188. That is a step-by-step deployment guide for IBM Tivoli Monitoring 6.1 that covers small to large environments and discusses best practices for a deployment plan.
For each ITCAM for Response Time agent you are going to install you must first install application support files on the Tivoli Enterprise Monitoring Server, Tivoli Enterprise Portal Server, and Tivoli Enterprise Portal Desktop Client.
You just need to install the application support files once for each ITCAM for Response Time Agent you are going to install. For example, if you plan to install four ITCAM for Robotic Response Time Agents in your environment to play back Rational Performance Tester scripts from different locations, you just need to install ITCAM for Robotic Response Time application support files once.
We discuss application support file installation in 4.2, “Installing application support files for Windows” on page 38. The process is the same for all four agents for ITCAM for Response Time (End User Dashboard, Client, Web, and Robotic), so we it demonstrate only once.
You can install an agent using different methods. In this book, we cover the following methods:
� Locally on the same server on which we are running the Tivoli Enterprise Portal Server, Tivoli Enterprise Monitoring Server, Tivoli Enterprise Portal Desktop Client, Warehouse Proxy, Warehouse Summarization and Pruning agent, and the Warehouse Database, as described in 4.3, “Installing End User Response Time Dashboard” on page 51.
� Locally when there is an IBM Tivoli Monitoring OS agent installed, as described in 4.4, “Installing ITCAM for Robotic Response Time” on page 61.
� Locally when there is no IBM Tivoli Monitoring OS agent installed, as described in 4.5, “Installing ITCAM for Web Response Time” on page 71.
� Installing through the Tivoli Enterprise Portal Server when there is an IBM Tivoli Monitoring OS agent up and running, as described in 4.6, “Installing ITCAM for Client Response Time” on page 87.
Chapter 4. Installation and configuration 37

The installation environment that we use is shown in Figure 4-1.
Figure 4-1 Sample environment
4.2 Installing application support files for Windows
Before you can view data collected by monitoring agents, you must install and enable application support for the agents. Application support files provide agent-specific information for workspaces, helps, situations, templates, and other data. This section describes how to install application support files for Windows.
Note: If you have previously installed ITCAM for Response Time Tracking, Version 6.1, you must uninstall it from your environment and verify that the following DLLs are deleted before installing ITCAM for Robotic Response Time or ITCAM for Client Response Time:
� c:\windows\system32\libarm4.dll� c:\windows\system32\libarm32.dll� c:\windows\system32\armjni4.dll� c:\windows\system32\armjni.dll� c:\windows\system32\armcli.dll� c:\windows\system32\libarm4net.dll
srv178Tivoli Enterprise Monitoring Server
Tivoli Enterprise Portal ServerTivoli Enterprise Portal
Warehouse ProxyEndUser Dashboard Agent
srv177WebSphere Application Server ND
Web Response Time Agent
saopauloRobotic Response Time Agent
lagosClient Response Time Agent
grueneRational Performance Tester
workbench
38 Deployment Guide Series: ITCAM for Response Time V6.2

All monitoring agents require that application support be configured on all instances of the following infrastructure components:
� Tivoli Enterprise Monitoring Server (both hub and remote monitoring serves)� Tivoli Enterprise Portal Server� Tivoli Enterprise Portal Desktop Client
See your IBM Tivoli Monitoring administrator and collect the Tivoli Enterprise Portal Server host name, Tivoli Enterprise Monitoring Server name, Tivoli Enterprise Monitoring Server host name, and the protocol settings for the Tivoli Enterprise Monitoring Server that you are going to connect with.
1. Stop the Tivoli Enterprise Monitoring Server, or the installation wizard will automatically stop the Tivoli Enterprise Monitoring Server.
2. Run setup from the WINDOWS subdirectory on the agent installation media.
3. Click Next on the Welcome window.
4. Verify that the required versions of IBM GSKit and IBM Java Runtime Environment are installed and click Next, as shown in Figure 4-2.
Figure 4-2 Install prerequisites
Note: The monitoring server is stopped during this process.
Chapter 4. Installation and configuration 39

5. Click Accept on the software license agreement.
6. In the Select Features window (Figure 4-3), uncheck Tivoli Enterprise Monitoring Agents, as we are not installing the agent, just the application support files. Click Next.
Figure 4-3 Select features
40 Deployment Guide Series: ITCAM for Response Time V6.2

7. The Agent Deployment window opens, as shown in Figure 4-4. IBM Tivoli Monitoring provides the ability to deploy resource monitoring across your environment from a central location, the monitoring server. You can use the remote deployment feature to deploy and configure monitoring agents. To add the agent to the deployment depot, select the agent and click Next.
Figure 4-4 Agent deployment
Note: You do not need to enable remote deployment for the End user Dashboard agent, as it is the only one to be installed in the IBM Tivoli Monitoring environment.
Chapter 4. Installation and configuration 41

8. Review the installation summary details. Click Next to start the installation, as shown in Figure 4-5.
Figure 4-5 Installation summary
42 Deployment Guide Series: ITCAM for Response Time V6.2

9. After the application support package installation is complete, a configuration window is displayed with all the components that you just installed selected for configuration. Click Next, as shown in Figure 4-6.
Figure 4-6 Configuration choices
Chapter 4. Installation and configuration 43

10.The Tivoli Enterprise Portal and Tivoli Enterprise Portal Server configuration starts.
a. Select the host name of the machine on which Tivoli Enterprise Portal Server resides. Click Next, as shown in Figure 4-7.
Figure 4-7 Tivoli Enterprise Portal Server host name
44 Deployment Guide Series: ITCAM for Response Time V6.2

b. The installation starts building Tivoli Enterprise Portal Server presentation files, as shown in Figure 4-8.
Figure 4-8 Setup building workspaces and presentation files
Chapter 4. Installation and configuration 45

11.The next steps install application support for the Tivoli Enterprise Monitoring Server.
a. Check that the communication protocol to the Tivoli Enterprise Monitoring Server is correct and click OK, as shown in Figure 4-9.
Figure 4-9 Tivoli Enterprise Monitoring Server communication protocols
b. Make sure that the communications parameter for the selected protocols (in our case IP.PIPE) for the agents to connect to the monitoring server is correct and click OK, as shown in Figure 4-10.
Figure 4-10 Tivoli Enterprise Monitoring Server IP.PIPE configuration
46 Deployment Guide Series: ITCAM for Response Time V6.2

c. Specify the location of the monitoring server, as shown in Figure 4-11. Click OK.
Figure 4-11 Selecting Tivoli Enterprise Monitoring Server location
d. Select the application support to add to the Tivoli Enterprise Monitoring Server windows. This window lists the application support packages that you selected in the window shown in Figure 4-3 on page 40. Click OK to begin seeding the monitoring server (using SQL files listed in this window, as shown in Figure 4-12). This process can take up to 20 minutes.
Figure 4-12 Selecting the application support
Chapter 4. Installation and configuration 47

e. Figure 4-13 shows that the application support addition has been completed with rc=0. Click Next.
Figure 4-13 Application support addition complete
Note: If the Application Support Addition Complete window is not displayed after 20 minutes, look in the IBM\ITM\CNPS\Logs\seedkpp.log files (where pp is the two-character code for each monitoring agent) for diagnostic messages that help you determine the cause of the problem.
48 Deployment Guide Series: ITCAM for Response Time V6.2

12.The next figures shows the configuration of agent defaults connection to the Tivoli Enterprise Monitoring Server.
a. Specify the communication protocol default for the agent to use when it communicates with the Tivoli Enterprise Monitoring Server and click OK, as shown in Figure 4-14.
Figure 4-14 Communication protocol defaults
b. Define the communications parameter defaults between agents and the monitoring server and click OK, as shown in Figure 4-15.
Figure 4-15 Communication parameters for IP.PIPE
Chapter 4. Installation and configuration 49

13.Figure 4-16 shows that the installation is complete. Click Finish.
Figure 4-16 Installation finished
50 Deployment Guide Series: ITCAM for Response Time V6.2

14.The Manage Tivoli Enterprise Monitoring Server opens (as we select it in the window shown in Figure 4-6 on page 43). Recycle the Tivoli Enterprise Portal Server, as shown in Figure 4-17.
Figure 4-17 Recycle Tivoli Enterprise Portal Server
You have finished the installation of the application support files.
4.3 Installing End User Response Time Dashboard
This chapter describes how to install the End User Response Time Dashboard on Windows.
The End User Response Time Dashboard works with data from the Tivoli Data Warehouse. Therefore, we recommend that it be installed close to the Tivoli Data
Note: Repeat these steps for all types of agent that you are going to install in your environment. In the deployment environment we repeated them to install application support files for the Robotic, Web, and Client Response Time Agents.
Chapter 4. Installation and configuration 51

Warehouse, but on a separate system, in the same subnet. It could be on the same machine as the Warehouse Proxy or Summarization and Pruning agents, as they all access the warehouse.
For demonstration purposes we install the Tivoli Enterprise Monitoring Server, Tivoli Enterprise Portal Server, Tivoli Data Warehouse, Warehouse Proxy Agent, and Summarization and Pruning Agent all in one server.
Before you install:
1. Install the agent as administrator.
2. Install only one ITCAM for End User Response Time Dashboard Tivoli Enterprise Monitoring Agent in the monitoring environment. The ITCAM for End User Response Time Dashboard is also the robotic script file depot. There should be only one file depot per IBM Tivoli Monitoring environment.
3. See your IBM Tivoli Monitoring administrator and collect the Tivoli Enterprise Portal Server host name, Tivoli Enterprise Monitoring Server name, Tivoli Enterprise Monitoring Server host name, and the protocol settings for the Tivoli Enterprise Monitoring Server that you are going to connect with. Also get the Tivoli Data Warehouse configurations.
4. Install the application support files as described in 4.2, “Installing application support files for Windows” on page 38.
52 Deployment Guide Series: ITCAM for Response Time V6.2
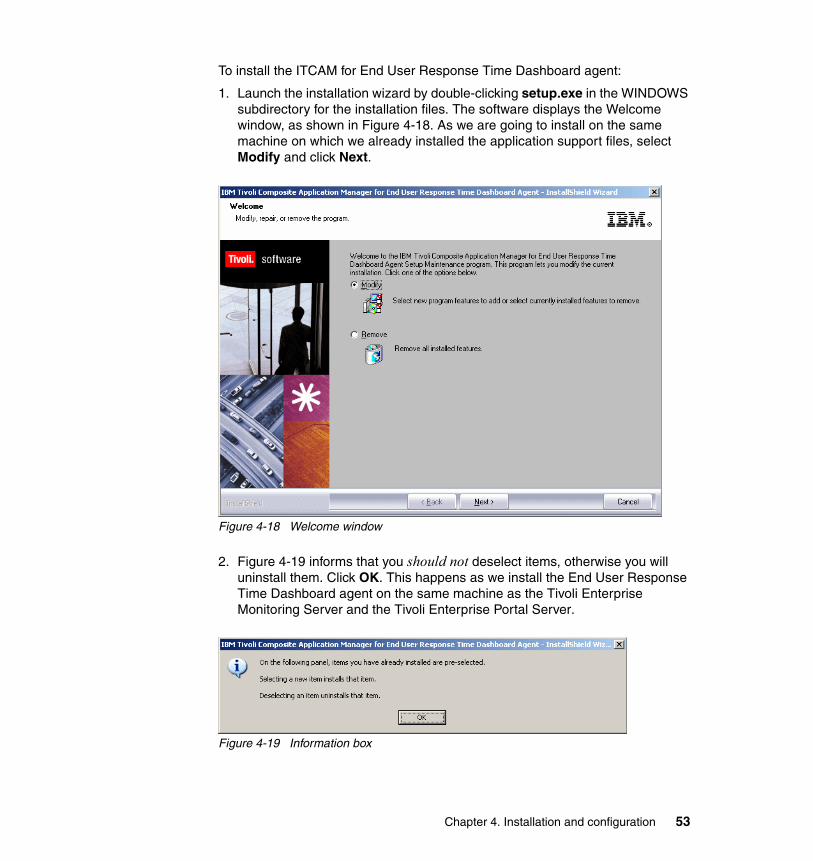
To install the ITCAM for End User Response Time Dashboard agent:
1. Launch the installation wizard by double-clicking setup.exe in the WINDOWS subdirectory for the installation files. The software displays the Welcome window, as shown in Figure 4-18. As we are going to install on the same machine on which we already installed the application support files, select Modify and click Next.
Figure 4-18 Welcome window
2. Figure 4-19 informs that you should not deselect items, otherwise you will uninstall them. Click OK. This happens as we install the End User Response Time Dashboard agent on the same machine as the Tivoli Enterprise Monitoring Server and the Tivoli Enterprise Portal Server.
Figure 4-19 Information box
Chapter 4. Installation and configuration 53

3. Figure 4-20 is shown. Expand Tivoli Enterprise Monitoring Agents and select Composite Application Manager for End User Response Time Dashboard agent. Click Next.
Figure 4-20 Add or remove features
54 Deployment Guide Series: ITCAM for Response Time V6.2

4. You can select the agent for remote deployment. This is not really necessary, as you would only need one End User Response Time Dashboard agent in your environment. See Figure 4-21. Click Next.
Figure 4-21 Agent deployment
Note: If you do not have the Tivoli Enterprise Monitoring Server on this server, this step is skipped.
Chapter 4. Installation and configuration 55

5. Review the installation settings and click Next, as shown in Figure 4-22. This stops the Tivoli Enterprise Monitoring Server, if it is not already stopped.
Figure 4-22 Installation summary
56 Deployment Guide Series: ITCAM for Response Time V6.2

6. Figure 4-23 shows what items you might configure. By default they all come selected. As we already configured the application support files, we do not need to select all options. We only need to run the Manage Tivoli Monitoring Services application. Click Next.
Figure 4-23 Configuration options
Chapter 4. Installation and configuration 57

7. The agent configuration dialog appears, as shown in Figure 4-24.
a. On the Tivoli Datawarehouse Database Configuration Options tab, specify the Tivoli Data Warehouse database configuration options.
Figure 4-24 Warehouse database configuration
58 Deployment Guide Series: ITCAM for Response Time V6.2
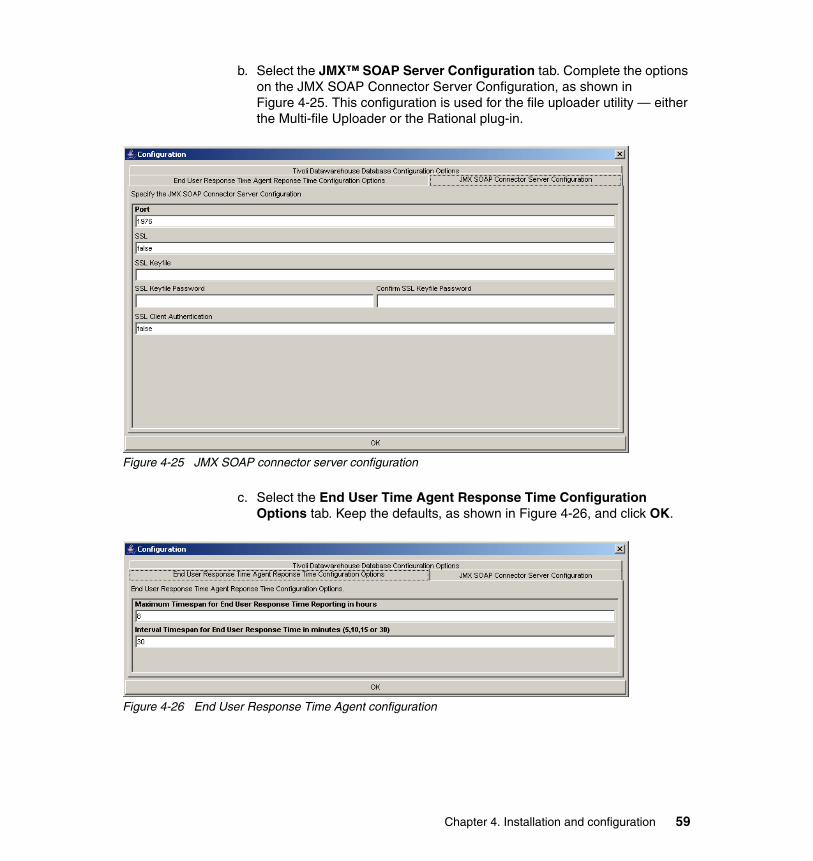
b. Select the JMX™ SOAP Server Configuration tab. Complete the options on the JMX SOAP Connector Server Configuration, as shown in Figure 4-25. This configuration is used for the file uploader utility — either the Multi-file Uploader or the Rational plug-in.
Figure 4-25 JMX SOAP connector server configuration
c. Select the End User Time Agent Response Time Configuration Options tab. Keep the defaults, as shown in Figure 4-26, and click OK.
Figure 4-26 End User Response Time Agent configuration
Chapter 4. Installation and configuration 59

8. Deselect the display for the readme file and click Finish, as shown in Figure 4-27.
Figure 4-27 Installation complete
60 Deployment Guide Series: ITCAM for Response Time V6.2

9. Click Finish on the Maintenance Complete screen, as shown in Figure 4-28.
Figure 4-28 Maintenance complete
4.4 Installing ITCAM for Robotic Response Time
In this section we demonstrate how to install the ITCAM for Robotic Response Time Agent locally on a Windows system. From this system we play back Rational Performance Tester scripts.
If the ITCAM for Robotic Response Time agent is in the IBM Tivoli Monitoring remote deployment depot, and you have an operating system monitoring agent running on the server on which you plan to install it, you may install through the Tivoli Enterprise Portal. This saves time because you do not need to configure the Tivoli Enterprise Monitoring Server and the Tivoli Enterprise Portal Server. In 4.6, “Installing ITCAM for Client Response Time” on page 87, we describe an installation using the Tivoli Enterprise Portal.
Note: If you plan to play back scripts recorded with Rational Robot, you need to install Rational Robot before you install the ITCAM for Robotic Response Time Agent.
Chapter 4. Installation and configuration 61

Before you install:
1. Install the agent as administrator.
2. See your IBM Tivoli Monitoring administrator and collect the Tivoli Enterprise Portal Server host name, Tivoli Enterprise Monitoring Server name, Tivoli Enterprise Monitoring Server host name, and the protocol settings for the Tivoli Enterprise Monitoring Server that you are going to connect with.
3. Install application support files, as described in 4.2, “Installing application support files for Windows” on page 38.
We perform a local installation on the SAOPAULO server:
1. Launch the installation wizard by double-clicking setup.exe in the WINDOWS subdirectory for the installation files. The software displays the Welcome window, as shown in Figure 4-29. Click Next.
Figure 4-29 Welcome
62 Deployment Guide Series: ITCAM for Response Time V6.2

2. Review the prerequisites and click Next, as shown in Figure 4-30.
Figure 4-30 ITCAM for Robotic Response Time prerequisites
Chapter 4. Installation and configuration 63

3. Verify that the required versions of IBM GSKit and IBM JAVA are installed and click Next, as shown in Figure 4-31.
Figure 4-31 Install prerequisites
64 Deployment Guide Series: ITCAM for Response Time V6.2
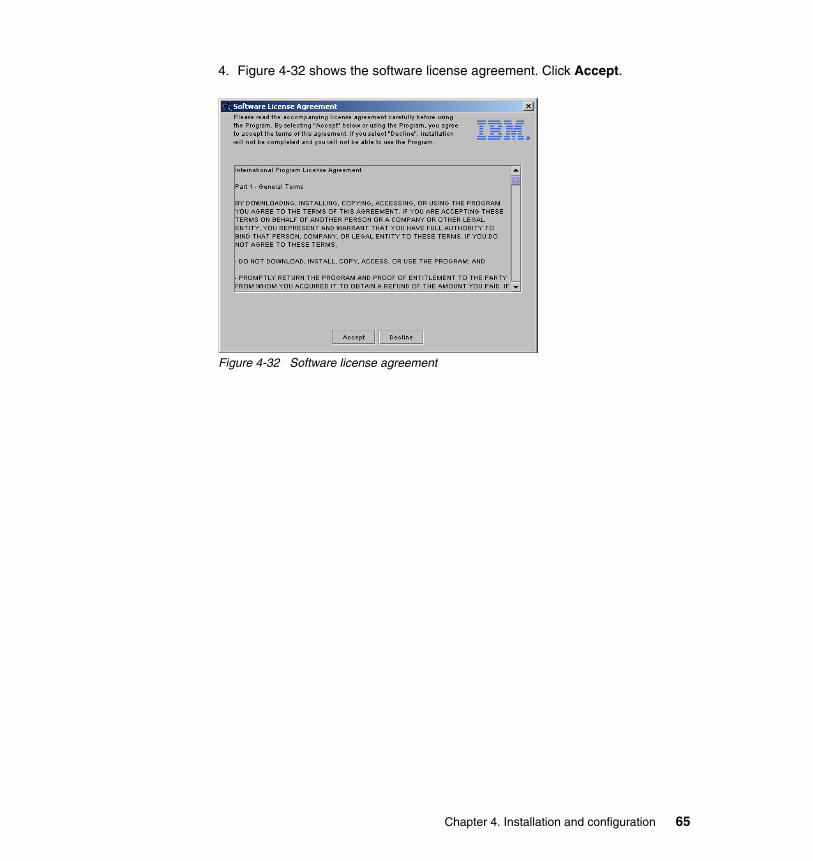
4. Figure 4-32 shows the software license agreement. Click Accept.
Figure 4-32 Software license agreement
Chapter 4. Installation and configuration 65

5. Expand Tivoli Enterprise Monitoring Agents, select Composite Application Manager for Robotic Response Time Monitoring Agent, and click Next, as shown in Figure 4-33.
Figure 4-33 Select features
66 Deployment Guide Series: ITCAM for Response Time V6.2

6. Review the settings and click Next, as shown in Figure 4-34.
Figure 4-34 Installation summary dialog
Chapter 4. Installation and configuration 67

7. Click Next to configure both items, as shown in Figure 4-35.
Figure 4-35 Configuration options
8. Select the protocols to communicate with the Tivoli Enterprise Monitoring Server and click OK, as shown in Figure 4-36.
Figure 4-36 Communication protocol defaults
68 Deployment Guide Series: ITCAM for Response Time V6.2

9. Based on the protocols that you have selected before, configure the information needed and click OK, as shown in Figure 4-37.
Figure 4-37 Communication parameters for IP.PIPE
10.Accept the defaults for all tabs and click OK.
Chapter 4. Installation and configuration 69

11.Deselect the readme file and click Finish, as shown in Figure 4-38.
Figure 4-38 Installation complete
12.Open the Manage Tivoli Enterprise Monitoring Services utility (if it does not open automatically) to see whether the monitoring agent has been configured and started. The Configured column should show Yes, as shown in Figure 4-39.
Figure 4-39 Manage Tivoli Enterprise Monitoring Services
13.Reboot your environment manually, as the ITCAM for Robotic Response Time requires a reboot after the installation is complete.
70 Deployment Guide Series: ITCAM for Response Time V6.2

4.5 Installing ITCAM for Web Response Time
This section demonstrates how to install the Web Response Time Agent locally on a Windows system that has no OS Agent installed.
You should install a Web Response Time Agent on each Web server or install in appliance mode using promiscuous mode to monitor the entire network traffic.
If you have an OS Agent installed and you have the ITCAM for Web Response Time Agent loaded into IBM Tivoli Monitoring depot, you may install through the Tivoli Enterprise Portal Server, which does not ask you about Tivoli Enterprise Monitoring configuration.
Before you install:
1. Install the agent as administrator.
2. See your IBM Tivoli Monitoring administrator and collect the Tivoli Enterprise Portal Server host name, Tivoli Enterprise Monitoring Server name, Tivoli Enterprise Monitoring Server host name, and the protocol settings for the Tivoli Enterprise Monitoring Server that you are going to connect with.
3. Install the application support files, as described in 4.2, “Installing application support files for Windows” on page 38.
4. Install the Windows Network Monitor, as described 4.5.1, “Installing Windows Network Monitor” on page 71.
4.5.1 Installing Windows Network Monitor
Before installing the ITCAM for Web Response Time agent on your Windows platform, you must install the Windows Network Monitor.
1. Do one of the following:
– For Windows 2000: Click Control Panel → Network and Dial-up Connections → Local Area Connection.
– For Windows 2003 and Windows XP: Click Control Panel → Network Connections → Local area Connection.
2. Right-click Local Area Connection.
Chapter 4. Installation and configuration 71

3. In the pop-up menu, click Properties, as shown in Figure 4-40.
Figure 4-40 Network Connections properties
4. In the Local Area Connection Properties window, click Install if there is no Network Monitor Driver available, as shown in Figure 4-41.
Figure 4-41 Network drivers
72 Deployment Guide Series: ITCAM for Response Time V6.2
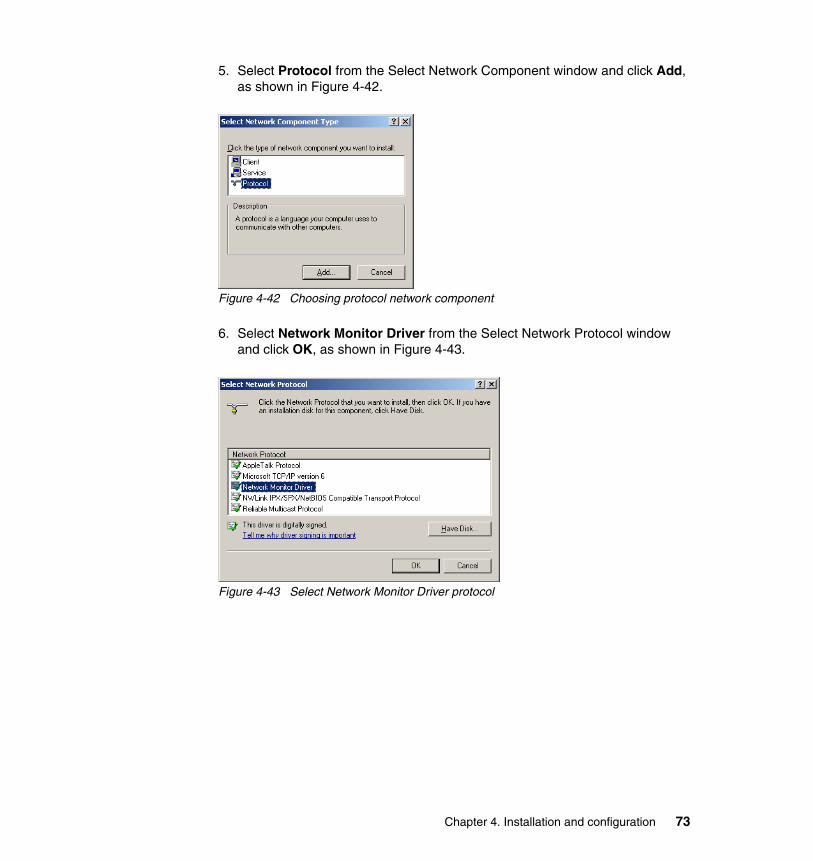
5. Select Protocol from the Select Network Component window and click Add, as shown in Figure 4-42.
Figure 4-42 Choosing protocol network component
6. Select Network Monitor Driver from the Select Network Protocol window and click OK, as shown in Figure 4-43.
Figure 4-43 Select Network Monitor Driver protocol
Chapter 4. Installation and configuration 73

7. After the Network Monitor Driver is displayed on the Local Area Connections Properties window, click Close, as shown in Figure 4-44.
Figure 4-44 Network Monitor driver installed
74 Deployment Guide Series: ITCAM for Response Time V6.2

4.5.2 Installing Web Response Time agent
To install the Web Response Time agent:
1. Launch the installation wizard by double-clicking setup.exe in the Windows subdirectory for the installation files. The software displays the Welcome window, as shown in Figure 4-45.
Figure 4-45 Welcome
Chapter 4. Installation and configuration 75

2. Review the prerequisites and click Next, as shown in Figure 4-46.
Figure 4-46 Web response time prerequisites
76 Deployment Guide Series: ITCAM for Response Time V6.2

3. In the window shown in Figure 4-47, accept the prerequisites needed and click Next.
Figure 4-47 Install prerequisites
Chapter 4. Installation and configuration 77

4. Figure 4-48 shows the software license agreement. Click Accept.
Figure 4-48 Software License Agreement
78 Deployment Guide Series: ITCAM for Response Time V6.2
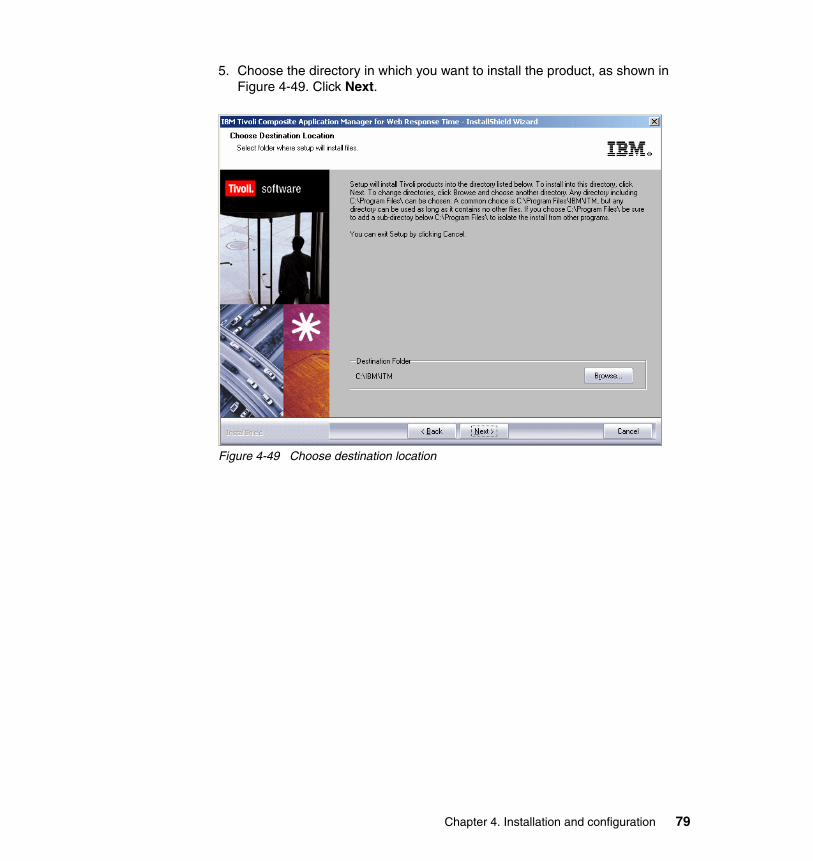
5. Choose the directory in which you want to install the product, as shown in Figure 4-49. Click Next.
Figure 4-49 Choose destination location
Chapter 4. Installation and configuration 79

6. Type a 32-character encryption key and click Next. We use the default, as shown in Figure 4-50.
Figure 4-50 User data encryption key
7. Click OK to confirm the encryption key, as shown in Figure 4-51.
Figure 4-51 Encryption key information box
80 Deployment Guide Series: ITCAM for Response Time V6.2
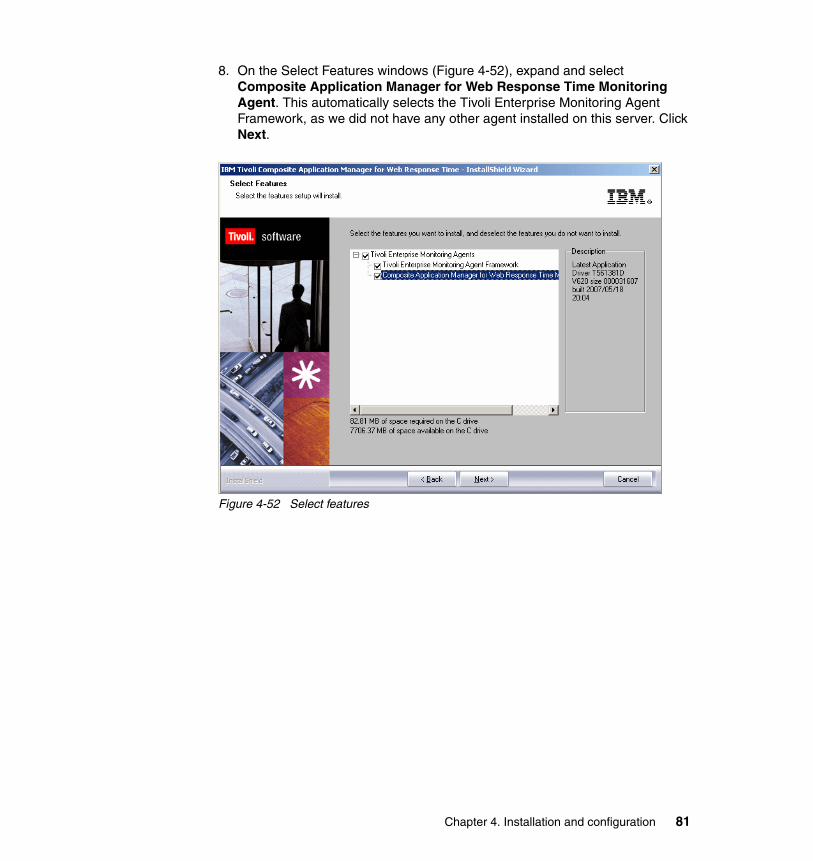
8. On the Select Features windows (Figure 4-52), expand and select Composite Application Manager for Web Response Time Monitoring Agent. This automatically selects the Tivoli Enterprise Monitoring Agent Framework, as we did not have any other agent installed on this server. Click Next.
Figure 4-52 Select features
Chapter 4. Installation and configuration 81

9. The software displays the Select Program Folder window. Select a program folder and click Next, as shown in Figure 4-53.
Figure 4-53 Select program folder
82 Deployment Guide Series: ITCAM for Response Time V6.2

10.The software displays the installation summary details (Figure 4-54). Review them and click Next to start the installation.
Figure 4-54 Installation summary
Chapter 4. Installation and configuration 83

11.After the components are installed and the configuration environment is initialized, the software displays the Setup Type window, as shown in Figure 4-55. Leave both options checked and click Next.
Figure 4-55 Configuration choices
12.On the Tivoli Enterprise Monitoring Server connection window (Figure 4-56), specify the default values for any IBM Tivoli Monitoring agent to use when it communicates with the monitoring server, and click OK.
Figure 4-56 Communication protocol defaults
84 Deployment Guide Series: ITCAM for Response Time V6.2

13.Specify the information that you collected with your IBM Tivoli Monitoring administrator regarding the monitoring server and click OK, as shown in Figure 4-57.
Figure 4-57 Communication parameters for IP.PIPE
14.On the agent configuration (Figure 4-58), leave the defaults. The configuration can be changed later to suit your monitoring needs. Click OK.
Figure 4-58 Web Response Time Agent configuration
Chapter 4. Installation and configuration 85

15.The software displays the Install Shield Wizard Complete window. Deselect the Display the README File check box. Click Finish, as shown in Figure 4-59.
Figure 4-59 Installation complete
16.Open the Manage Tivoli Enterprise Monitoring Services utility (if it does not open automatically) to see whether the monitoring agent has been configured and started. The Configured column should show Yes, as shown in Figure 4-60.
Figure 4-60 Manage Monitoring services
You have finished the installation of the ITCAM for Web Response Time Agent.
86 Deployment Guide Series: ITCAM for Response Time V6.2

4.6 Installing ITCAM for Client Response Time
In this section we demonstrate how to install ITCAM for Client Response Time through the Tivoli Enterprise Portal.
Before you install ITCAM for Client Response Time, install application support files, as described in 4.2, “Installing application support files for Windows” on page 38.
We install the ITCAM for Client Response Time Agent at LAGOS, which already has an IBM Tivoli Monitoring Windows OS agent running. We also already loaded the IBM Tivoli Monitoring repository when we installed the application support files, as described in 4.2, “Installing application support files for Windows” on page 38.
1. Log on to the Tivoli Enterprise Portal and find the server on which you want to deploy ITCAM for Client Response Time. In this demonstration, we want to deploy it at LAGOS, which is accessible from Tivoli Enterprise Portal.
Chapter 4. Installation and configuration 87

2. Right-click LAGOS, then click Add Managed System, as shown in Figure 4-61.
Figure 4-61 Add Managed System
88 Deployment Guide Series: ITCAM for Response Time V6.2

3. Select Composite Application Manager for Client Response Time Monitoring Agent and click OK, as shown in Figure 4-62.
Figure 4-62 Select a Monitoring Agent
4. Leave the defaults for Data Analysis Configuration, as shown in Figure 4-63, and click Next.
Figure 4-63 Data Analysis Configuration
Chapter 4. Installation and configuration 89

5. Leave the defaults on the Agent Configuration tab, as shown in Figure 4-64. Click Finish.
Figure 4-64 Agent configuration
90 Deployment Guide Series: ITCAM for Response Time V6.2

6. Wait until the configuration finishes, as shown in Figure 4-65.
Figure 4-65 Agent being configured
Chapter 4. Installation and configuration 91

7. Update the navigator by clicking the arrow that you see inside a green balloon underneath the physical view, as shown in Figure 4-66.
Figure 4-66 Navigator update pending
92 Deployment Guide Series: ITCAM for Response Time V6.2

The installation has finished and the Client Response Time Workspace can be accessed by the portal, as shown in Figure 4-67.
Figure 4-67 Client Response Time workspace
4.7 Installing Rational Performance Tester Workbench
This section describes how to install the Rational Performance Tester Workbench on a workstation. The Rational Performance Tester Workbench is needed to record and upload Rational Performance Tester tests. You should install the Rational Performance Tester Workbench if you want to monitor Web applications, SAP, Siebel, or Citrix applications.
You can install the Rational Performance Tester Workbench on any system from which you want to record the tests. You do not need to install it on the same system as the ITCAM for Robotic Response Time Agent. The Rational Performance Tester Workbench needs a connection to the End User Response Time Dashboard agent. Make sure that there are no firewalls between them.
For the installation we used the following media:
� IBM Tivoli Composite Application Manager for Response Time V6.2: Rational Performance Test V7.0 Integration Support Windows, English. This contains the setup_RPT.exe that calls the Rational Performance Installation Media
Chapter 4. Installation and configuration 93

(Parts 1, 2, and 3) and performs the installation, including IBM Installation Manager 1.0, IBM Rational Performance Tester 7.0, IBM Rational Performance Tester 7.0 license key, and IBM Tivoli Composite Application Manager for Response Time 6.2 Integration plug-in.
� IBM Rational Performance Tester V7.0 Multiplatform Multilingual Part 1.
� IBM Rational Performance Tester V7.0 Multiplatform Multilingual Part 2.
� IBM Rational Performance Tester V7.0 Multiplatform Multilingual Part 3.
If you are downloading the software to a disk, we recommend that you uncompress all four installation images on the same directory, for example, C:\ITCAMRational, so that it will not ask you for the Rational media. For this demonstration we created one directory for IBM Tivoli Composite Application Manager for Response Time V6.2: Rational Performance Test V7.0 Integration Support Windows, English media and another for IBM Rational Performance Tester V7.0 Multiplatform Multilingual Part 1, 2, and 3 in order to show you how to proceed if they are on separate directories.
1. Verify the supported platforms for Rational Performance Tester at:
http://www-306.ibm.com/software/awdtools/tester/performance/sysreq/index.html
2. Go to the RPT\w32-ix86\disk1 directory of the downloaded installation images. This is where you uncompressed IBM Tivoli Composite Application Manager for Response Time V6.2: Rational Performance Test V7.0 Integration Support Windows, English.
94 Deployment Guide Series: ITCAM for Response Time V6.2

3. Run setup_RPT.exe to display the Welcome window, as shown in Figure 4-68. Click Next.
Figure 4-68 Welcome dialog
Chapter 4. Installation and configuration 95

4. We do not install from a CD-ROM. Select No and click Next, as shown in Figure 4-69.
Figure 4-69 Installation source
96 Deployment Guide Series: ITCAM for Response Time V6.2

5. The Software License Agreement opens (Figure 4-70). Accept the terms of the license agreement and click Next.
Figure 4-70 Software license agreement
Chapter 4. Installation and configuration 97

6. As the RPT images are in other directory, the software asks you for the image location, as shown in Figure 4-71. Note that if they were in the same directory, the installed would not ask for it. Enter the correct location and click Next.
Figure 4-71 Rational Performance Tester 7.0 image location
98 Deployment Guide Series: ITCAM for Response Time V6.2

7. The software calculates and displays the required disk space needed for the installation and shows the default directories used for installation, as shown in Figure 4-72. Verify that there is sufficient disk space, and choose the directories to install or accept the defaults, and click Next.
Figure 4-72 Select installation path
Chapter 4. Installation and configuration 99

8. The software shows what is going to be installed (Figure 4-73). Click Next to begin the installation. It may take several minutes to complete.
Figure 4-73 Installation summary
100 Deployment Guide Series: ITCAM for Response Time V6.2

9. The installation finishes and shows the status (Figure 4-74). Click Finish.
Figure 4-74 Installation complete
Chapter 4. Installation and configuration 101

102 Deployment Guide Series: ITCAM for Response Time V6.2

Chapter 5. Usage demonstration
This chapter demonstrates usage scenarios for ITCAM for Response Time V6.2. The discussion consists of:
� 5.1, “Usage scenarios” on page 104� 5.2, “Workspaces and interfaces” on page 104� 5.3, “Using Rational Performance Tester” on page 106� 5.4, “Using Robotic Response Time agent” on page 122� 5.5, “Using Web Response Time agent” on page 140� 5.6, “Using Client Response Time Agent” on page 146
5
© Copyright IBM Corp. 2008. All rights reserved. 103

5.1 Usage scenarios
This chapter demonstrates the features of ITCAM for Response Time. The demonstration uses the Trader application. A description of the Trader application is provided in Appendix A, “The Trader application” on page 161.
The Trader application is a Web-based J2EE application that has back-end processing in CICS® and DB2. The application can be accessed from the Web browser or 3270 interface. Based on this structure, we decided to collect Trader application response time using the following methods:
� Using Rational Performance Tester to run a transaction simulation to the Web interface
� Using the Web Response Monitor to collect HTTP traffic performance on the Web application server
� Using the Client Application Tracker to collect CICS’s 3270 interface response time
Interaction with ITCAM for Response Time is mainly performed through the workspaces of Tivoli Enterprise Portal. Except for the recording portion of Rational Performance Tester, using the Rational Performance Tester Workbench, all activities are performed using Tivoli Enterprise Portal.
In 5.2, “Workspaces and interfaces” on page 104, we describe the Tivoli Enterprise Portal interface. Further along, we start to build the environment using:
� The Recording Rational Performance Tester script in 5.3, “Using Rational Performance Tester” on page 106
� Running and monitoring the Rational Performance Tester script in 5.4, “Using Robotic Response Time agent” on page 122
� Working with Web response time in 5.5, “Using Web Response Time agent” on page 140
� Collecting 3270 transaction performance in 5.6, “Using Client Response Time Agent” on page 146
5.2 Workspaces and interfaces
The workspaces for ITCAM for Response Time in the physical tree are organized based on agent. Each agent type provides a different set of workspaces that are collected under it. The End user Dashboard agent is a unique agent in that it only
104 Deployment Guide Series: ITCAM for Response Time V6.2

collects data from the historical data warehouse, instead of the live system. The dashboard provides an overview of the cross-enterprise response time.
The hierarchy tree of the workspace for ITCAM for Response Time agents is shown in Figure 5-1.
Figure 5-1 Workspace structure
As shown in Figure 5-1, the workspace for ITCAM for Response Time is divided into:
� By application: An application is defined as a larger entity that encompasses multiple transactions.
� By transaction: individual element of an application.
� By client: the end-user machine or IP addresses that accesses the application.
� By server: the request processing server, such as 3270 host, application server machine, and so on. The robotic response time does not have a server aggregation, as the transaction can be directed to any server within the robotic script.
Chapter 5. Usage demonstration 105

Furthermore, the End user dashboard workspace aggregates information from all other ITCAM for Response Time agents. The End user dashboard workspace is shown in Figure 5-2.
Figure 5-2 Workspace structure
The dashboard contains the overall summary or aggregate of all ITCAM for Response Time agents status. The playback status and robotic scripts workspaces are related to the robotic script depot. The application, client, and server workspaces show the historical status of the available response time measurement broken down by application, client, or server.
5.3 Using Rational Performance Tester
Before you start you must install the Rational Performance Tester Workbench on a workstation, as described in 4.7, “Installing Rational Performance Tester Workbench” on page 93.
Rational Performance Tester monitors Web applications, SAP, Citrix, and Siebel using protocol-based record and playback. Rational Performance Tester features include:
� Immediate productivity by hiding all complexity. No coding required.
� An integrated solution that is built on Rational Application Developer.
� Advanced data access and manipulation.
� Automatic data correlation and synchronization of input parameters.
106 Deployment Guide Series: ITCAM for Response Time V6.2

� Verification points for content matching and response code checking.
� Automatic ARM instrumentation for HTTP transactions to correlate with downstream applications and resources for problem isolation.
� Improved scalability allows for higher playback rates and more concurrent playbacks on a single system, which limits costs of licenses and maintenance.
� Network-level statistics for DNS, SSL Connect time, Server Response Time, and Delivery.
� Rational Robot VU functionality, including a scalable and concurrent playback solution of HTTP transactions and a generic framework that allows you to add new protocols.
In this section, we create an HTTP script to access our Trader application. We record a script called RPT_TraderWeb. This name is important, as it characterized to the target system, not the agent host name on which the script would run. The process is:
1. Open the Rational Performance Tester:
a. Click All Programs → RPT → IBM Rational Performance Tester → IBM Rational Performance Tester.
b. If this is the first time you open Rational Performance Tester, select a workspace in which to store your projects, as shown in Figure 5-3. Click OK.
Figure 5-3 Workspace launcher
Note: You cannot migrate a previously recorded Rational Robot VU script to RPT scripts. You must record new scripts with the Rational Performance Tester.
Chapter 5. Usage demonstration 107

2. Create a new transaction recording:
a. Select File → New → Test From Recording, as shown in Figure 5-4.
Figure 5-4 Recording a new transaction
108 Deployment Guide Series: ITCAM for Response Time V6.2

b. From the Create New Test from Recording window, select Create Test From New Recording, then choose HTTP Recording, as shown in Figure 5-5. Click Next.
Figure 5-5 Create New Test From Recording
Chapter 5. Usage demonstration 109
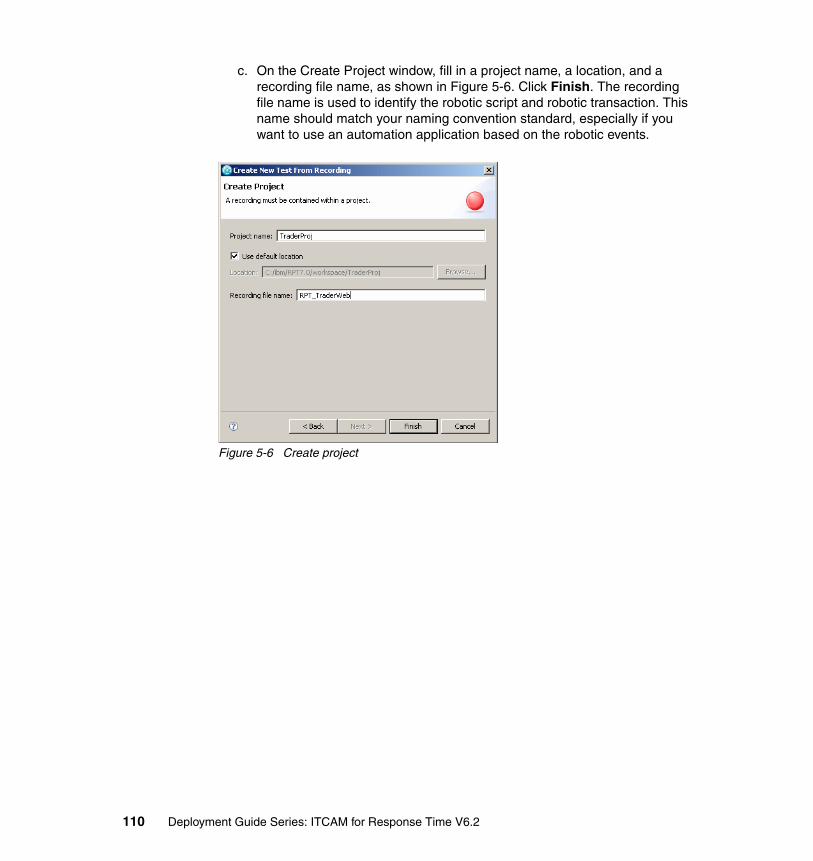
c. On the Create Project window, fill in a project name, a location, and a recording file name, as shown in Figure 5-6. Click Finish. The recording file name is used to identify the robotic script and robotic transaction. This name should match your naming convention standard, especially if you want to use an automation application based on the robotic events.
Figure 5-6 Create project
110 Deployment Guide Series: ITCAM for Response Time V6.2

d. The browser opens the readme.html file, as shown in Figure 5-7. Read it and take the actions described under BEFORE YOU BEGIN. Also read the privacy warning.
Figure 5-7 Recording welcome page
Chapter 5. Usage demonstration 111

3. Start recording the transaction that you want to monitor. Figure 5-8 shows some of the steps we took for recording the RPT_TraderWeb transaction. When you finish your transaction recording, close the browser.
Figure 5-8 Recording a transaction
112 Deployment Guide Series: ITCAM for Response Time V6.2

4. Once the Web browser window is closed, the test generation is complete. We close the Welcome tab to give more room to view the recorded test. We also selected the Browser tab in the protocol data, so we can see the Web page being tested. See the test result in Figure 5-9.
Figure 5-9 RPT Workbench - test showing the Web page
Chapter 5. Usage demonstration 113

5. The test result shown in Figure 5-9 on page 113 shows generic page titles, such as company selection, buy, and quotes. These page titles becomes sub transactions in the robotic monitor execution. We recommend changing the page titles to allow ease of identification for sub transactions. We customized the page titles, as shown in Figure 5-10.
Figure 5-10 Customized page title in workbench
114 Deployment Guide Series: ITCAM for Response Time V6.2

6. Optionally, we also added response code verification points, as shown in Figure 5-11.
Figure 5-11 RPT Workbench - enabling response code verification points
Note: Verification points are ways to detect problems in an application. Web verification points you can use are:
� Content, which searches for a specific string on a page
� Page title, which compares the page title against the recorded title
� Response code, which compares the HTTP code returned against the recorded code
� Response size, which compares the page size returned against the recorded size
� Custom, which is a Java API that is available only when custom code is added to a test
For more information, access the help provided in the Rational Performance Tester Workbench.
Chapter 5. Usage demonstration 115
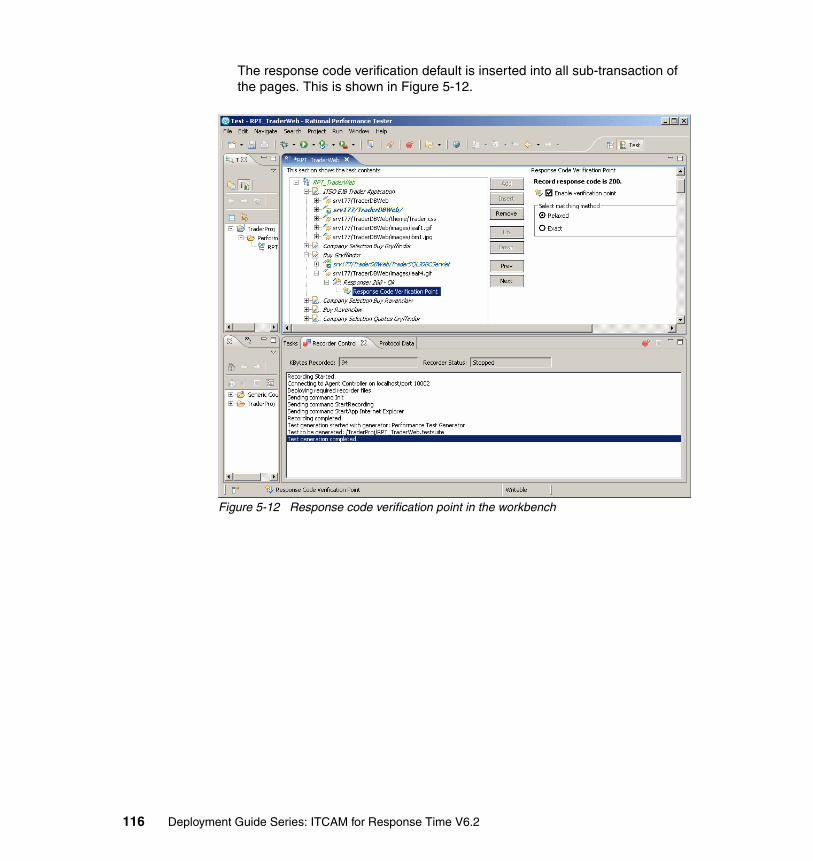
The response code verification default is inserted into all sub-transaction of the pages. This is shown in Figure 5-12.
Figure 5-12 Response code verification point in the workbench
116 Deployment Guide Series: ITCAM for Response Time V6.2

7. Save the updates by selecting File → Save. Make sure that you test that your script is working properly before uploading it to ITCAM for Response Time. You can test your script using the context menu. Select Run As → 2 Performance Test, as shown in Figure 5-13.
Figure 5-13 RPT Workbench - running a test before uploading
Chapter 5. Usage demonstration 117

8. If all tests are successful, you are ready to upload the script to the End user Dashboard Agent. The ITCAM for Response Time uploader is a plug-in in the Eclipse workbench that runs Rational Performance Tester Workbench.
a. Before you upload the script, we recommend that you stop the ITCAM for Robotic Response Time, as shown in Figure 5-14. You can also use the ./itmcmd agent stop t6 command or the Manage Tivoli Enterprise Monitoring Services.
Figure 5-14 Stopping Robotic Response Time Agent
118 Deployment Guide Series: ITCAM for Response Time V6.2

b. On the Rational Performance Tester Workbench select File → Export. Use Other → ITCAM for Response Time and click Next, as shown in Figure 5-15.
Figure 5-15 RPT Workbench - export to ITCAM for Response Time
Chapter 5. Usage demonstration 119

c. Figure 5-16 shows the Connect to ITCAM for RT End User Response Time Agent window. Fill in the host name and port for the End User Response Time Dashboard agent. Click Next.
Figure 5-16 Connecting to End User Response Time Agent
d. Figure 5-17 shows the Select Projects window. Select the project that you want to export and click Next.
Figure 5-17 Select project to export
120 Deployment Guide Series: ITCAM for Response Time V6.2
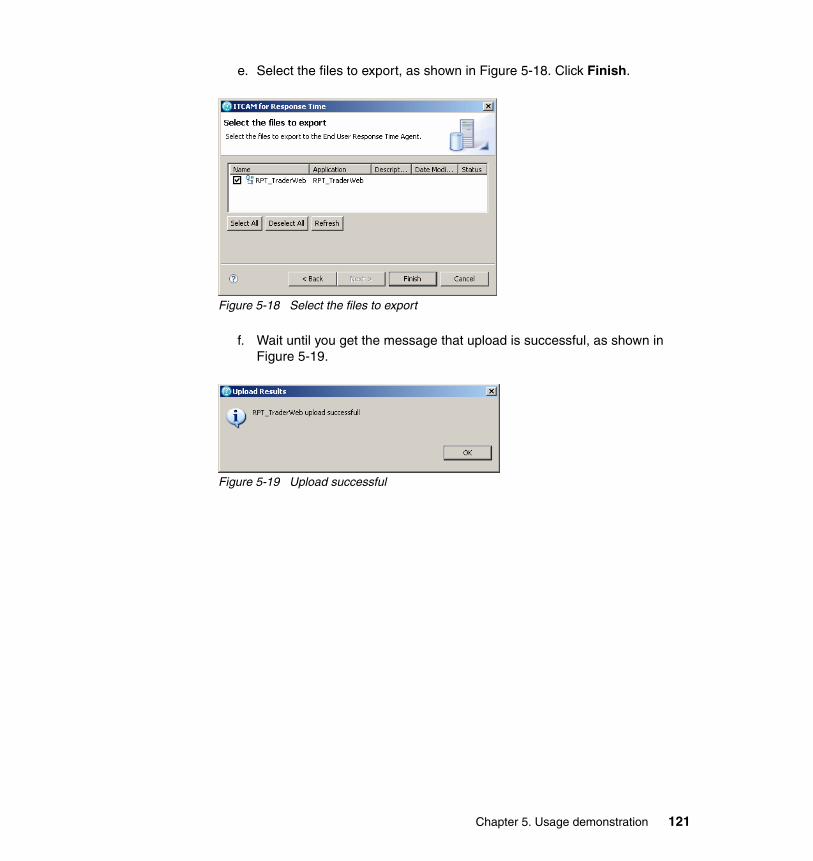
e. Select the files to export, as shown in Figure 5-18. Click Finish.
Figure 5-18 Select the files to export
f. Wait until you get the message that upload is successful, as shown in Figure 5-19.
Figure 5-19 Upload successful
Chapter 5. Usage demonstration 121
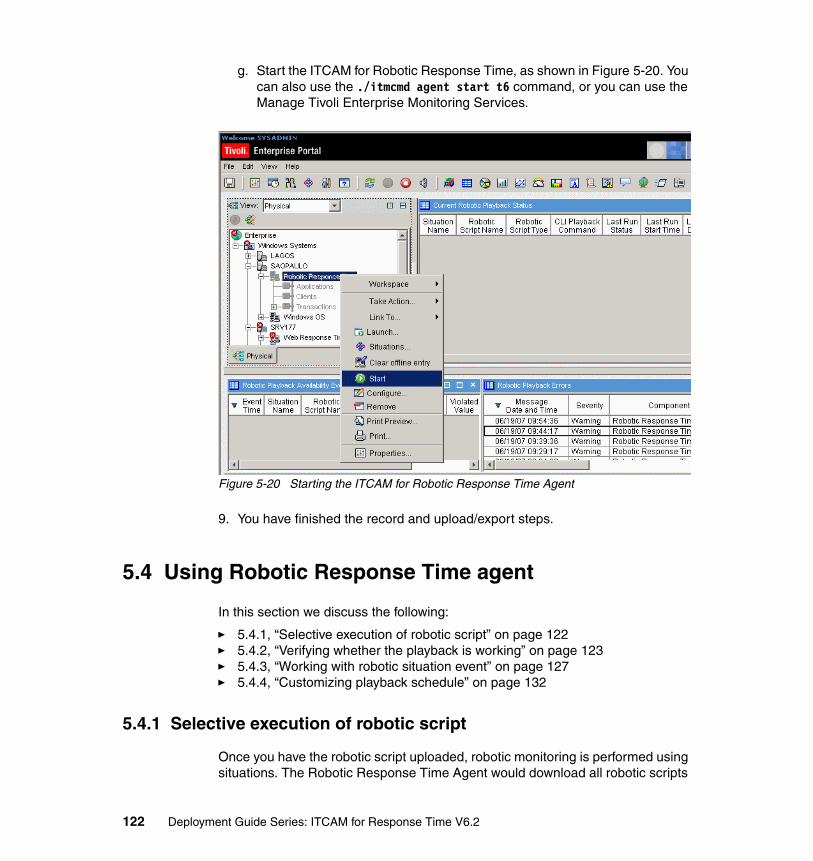
g. Start the ITCAM for Robotic Response Time, as shown in Figure 5-20. You can also use the ./itmcmd agent start t6 command, or you can use the Manage Tivoli Enterprise Monitoring Services.
Figure 5-20 Starting the ITCAM for Robotic Response Time Agent
9. You have finished the record and upload/export steps.
5.4 Using Robotic Response Time agent
In this section we discuss the following:
� 5.4.1, “Selective execution of robotic script” on page 122� 5.4.2, “Verifying whether the playback is working” on page 123� 5.4.3, “Working with robotic situation event” on page 127� 5.4.4, “Customizing playback schedule” on page 132
5.4.1 Selective execution of robotic script
Once you have the robotic script uploaded, robotic monitoring is performed using situations. The Robotic Response Time Agent would download all robotic scripts
122 Deployment Guide Series: ITCAM for Response Time V6.2

regularly (by default every 15 minutes) from the depot. It would execute any script whose name matches a Robotic Agent situation. Figure 5-21 shows the default Robotic Response Time Playback situation that matches all scripts. This situation executes all stored robotic scripts based on the sampling interval defined.
Figure 5-21 RRT_Robotic_Playback situation
You can change this behavior by modifying the condition of an existing situation and changing the distribution scope of the situation.
5.4.2 Verifying whether the playback is working
Now that we already uploaded the script to the ITCAM for End User Response Time Dashboard, we check whether it is being played back.
Chapter 5. Usage demonstration 123

Next screens will show you how to verify it by navigating some of the workspaces.
� To identify what scripts are stored on the End User Response Time Dashboard, you can access the Robotic Scripts workspace, as shown in Figure 5-22.
Figure 5-22 End User Response Time - Robotic Scripts workspace
Note: For a detailed description of the workspaces, situations, and attributes, read the ITCAM for Robotic Response Time and ITCAM End User Response Time Dashboard Users’ Guide, SC23-6333.
124 Deployment Guide Series: ITCAM for Response Time V6.2

� From the End User Response Time workspace (Figure 5-23), you see the status of all the ITCAM for Response Time agents, and from that workspace you can link to the agent-specific workspaces.
Figure 5-23 End User Response Time workspace
Chapter 5. Usage demonstration 125

� The Current Robotic Playback Status view (Figure 5-24) provided in the Robotic Response Time Playback Status workspace, provides information about each script running on the agent. From here you can monitor the current status of any robotic scripts running on the server.
Figure 5-24 Current Robotic Playback Status view
126 Deployment Guide Series: ITCAM for Response Time V6.2

5.4.3 Working with robotic situation event
In our environment there are various monitoring agents generating situation events. We can demonstrate on working with situations using the following flow:
1. To have a better view of what we want to demonstrate, we filter the situation event console events. Figure 5-25 shows the Situation Event Console, provided in the Enterprise Status workspace.
Figure 5-25 Situation event console
Chapter 5. Usage demonstration 127

2. To filter the situation event console so it only shows Robotic Response Time agents events, you can drag the Robotic Response Time agent into the situation console, as shown in Figure 5-26.
Figure 5-26 Drag Robotic Response Time and drop into situation event console
3. The filter would then be active, as shown in Figure 5-27.
Figure 5-27 Situation event console filter active
128 Deployment Guide Series: ITCAM for Response Time V6.2

4. We can then analyze an event by right-clicking it and selecting Situation Event Results, as shown in Figure 5-28.
Figure 5-28 Selecting situation event results
5. As we modified the workspace by adding a filter, the Tivoli Enterprise Portal confirms (see Figure 5-29) whether we want to save the workspace. Click No to keep the existing filter.
Figure 5-29 Do not save the workspace
Chapter 5. Usage demonstration 129

6. Figure 5-30 shows details of the critical alert raised by the RRT_Availability_Threshold. This means that the RPT_TraderWeb script did not complete successfully.
Figure 5-30 RRT_Availability_Threshold event
130 Deployment Guide Series: ITCAM for Response Time V6.2

7. Using the Top 5 Worst Applications Current Status workspace (Figure 5-31), we know that the problem is no longer occurring.
Figure 5-31 Top 5 Most Unavailable Applications - current status
Chapter 5. Usage demonstration 131

8. You can manually close the event, as shown Figure 5-32.
Figure 5-32 Closing the event
5.4.4 Customizing playback schedule
In this section, we explain how to customize a playback schedule for a robotic script called RPT_Get_Quotes.zip. We want to run the script only on workdays Monday to Friday within the prime shift from 8 a.m. to 5 p.m. The script runs every 10 minutes with the possibilities of three retries. Each retry has a 10-second lag time. The script times out if there is no response within 30 seconds.
Note: For more information about Situations and workflows, refer to the IBM Tivoli Monitoring User’s Guide, SC32-9409.
132 Deployment Guide Series: ITCAM for Response Time V6.2

To accomplish this scenario:
1. Create a robotic playback configuration situation and do not select Run At startup. The situation is controlled by the IBM Tivoli Monitoring workflow.
a. Open the situation editor from Edit → Situation Editor, as shown in Figure 5-33.
Figure 5-33 Situation Editor
Chapter 5. Usage demonstration 133

b. Right-click RRT_Robotic_Playback_Advanced and select Create another, as shown in Figure 5-34.
Figure 5-34 Cloning situation RRT_Robotic_Playback_Advanced
c. Fill in a name and description (Figure 5-35) and click OK.
Figure 5-35 Create new situation
134 Deployment Guide Series: ITCAM for Response Time V6.2

d. Customize the robotic script name, robotic script type, time out period, retry lag time, number retries, and sampling interval, as shown in Figure 5-36. Do not select Run at startup.
Figure 5-36 Customizing Robotic Agent situation
Chapter 5. Usage demonstration 135

e. Figure 5-37 shows the Distribution tab. Choose the agents where you want the script being played back and click OK.
Figure 5-37 Defining situation distribution
136 Deployment Guide Series: ITCAM for Response Time V6.2

2. Create a scheduling situation for starting the robotic monitor.
a. We use the PrimeShift situation provided by IBM Tivoli Monitoring. For other schedule requirements, you can also clone the PrimeShift situation and define your own scheduling rule. See Figure 5-38.
Figure 5-38 PrimeShift situation
Chapter 5. Usage demonstration 137

b. Make sure to distribute the scheduling situation to the same robotic agents as the robotic configuration situation created on step 1, as shown in Figure 5-39.
Figure 5-39 PrimeShift situation - Distribution tab
138 Deployment Guide Series: ITCAM for Response Time V6.2

3. Create a scheduling situation to stop the robotic playback.
a. We use the NonPrimeShift situation provided by IBM Tivoli Monitoring. Do not use Run at startup. Figure 5-40 shows the NonPrimeShift situation.
Figure 5-40 NonPrimeShift situation
b. Make sure to distribute the scheduling situation to the same robotic agents as the robotic configuration situation created on step 1, as shown in Figure 5-41.
Figure 5-41 NonPrimeShift situation - Distribution tab
Chapter 5. Usage demonstration 139

4. Create a workflow to start and stop the robotic playback situation. Distribute the workflow to the same robotic agents to which you distributed in the previous steps. Figure 5-42 shows the workflow.
Figure 5-42 Workflow for start and stop the customized schedule
5.5 Using Web Response Time agent
The Web Response Time agent is used to collect HTTP response time for the Trader application running on srv177. WebSphere® provides HTTP access at ports 9081 and 9082. By default, Web Response Monitor collects all HTTP traffic and measures its response time. We define situations to indicate the data to be collected by the Tivoli Enterprise Monitoring Server.
140 Deployment Guide Series: ITCAM for Response Time V6.2

First let us evaluate the workspaces of the Web Response Time agent. Figure 5-43 shows the agent summary workspace that lists important information about the agent.
Figure 5-43 Agent summary workspace
Chapter 5. Usage demonstration 141

The workspaces show application response time breakdown that is collected from this agent by application, transaction, client, and server.
� The application workspace differentiates response time by the URL path. Figure 5-44 shows the application grouping.
Figure 5-44 Application workspace
142 Deployment Guide Series: ITCAM for Response Time V6.2

� The server workspace shows the target server of the HTTP transactions. Figure 5-45 shows the sample HTTP transactions.
Figure 5-45 Server workspace
Chapter 5. Usage demonstration 143

� The transaction workspace gets you into the individual observed transactions. Figure 5-46 shows the sample workspace.
Figure 5-46 Transaction workspace
144 Deployment Guide Series: ITCAM for Response Time V6.2

The rule to determine transaction and client grouping is defined as situations. The list of active situations for the Web Response Time agent can be retrieved by right-clicking Web Response Time agent in the navigation tree and selecting Manage Situations. The situation list is shown in Figure 5-47.
Figure 5-47 Situation list
Chapter 5. Usage demonstration 145
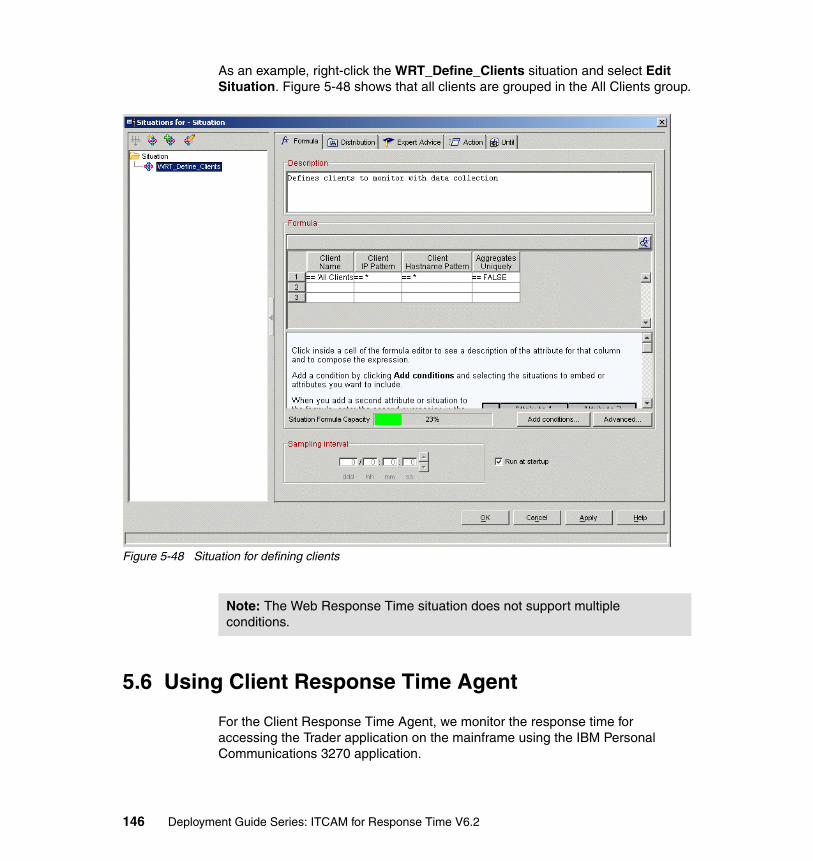
As an example, right-click the WRT_Define_Clients situation and select Edit Situation. Figure 5-48 shows that all clients are grouped in the All Clients group.
Figure 5-48 Situation for defining clients
5.6 Using Client Response Time Agent
For the Client Response Time Agent, we monitor the response time for accessing the Trader application on the mainframe using the IBM Personal Communications 3270 application.
Note: The Web Response Time situation does not support multiple conditions.
146 Deployment Guide Series: ITCAM for Response Time V6.2

To monitor the Client Response Time we need to create a situation from Tivoli Enterprise Portal. The response time would be monitored according to the situation and the filter rule set up in the situation. Creating a situation for Client Response Time is the same as creating a situation for Web Response Time.
Once the situation is created and started, the Client Response Time agent on lagos starts monitoring the application and filter events based on the rule defined in the situation and starts sending data to the Tivoli Enterprise Portal. The Trader CICS 3270 application screens are shown in Figure 5-49.
Figure 5-49 Accessing Trader using IBM Personal Communications
Chapter 5. Usage demonstration 147

Client Response Time data can now be seen on the Tivoli Enterprise Portal under Transactions for Client Response Time, as shown in Figure 5-50.
Figure 5-50 Transaction Data for Client Response Time
148 Deployment Guide Series: ITCAM for Response Time V6.2

Clicking the chain icon takes you to the transaction detail shown in Figure 5-51.
Figure 5-51 Client Response Time
Chapter 5. Usage demonstration 149

150 Deployment Guide Series: ITCAM for Response Time V6.2

Chapter 6. Troubleshooting hints and tips
This chapter contains a collection of troubleshooting hints and tips. The topics covered are:
� 6.1, “Troubleshooting tips and techniques” on page 152� 6.2, “Troubleshooting End User Response Time Agent” on page 152� 6.3, “Troubleshooting Robotic Response Time Agent” on page 154� 6.4, “Troubleshooting Web Response Time Agent” on page 155� 6.5, “Troubleshooting Client Response Time Agent” on page 156
6
© Copyright IBM Corp. 2008. All rights reserved. 151

6.1 Troubleshooting tips and techniques
ITCAM for Response Time V6.2 is based on the IBM Tivoli Monitoring V6.1 architecture. As such, the troubleshooting process is in the framework of IBM Tivoli Monitoring.
A problem on the client side would involve the Tivoli Enterprise Portal desktop client or the Tivoli Enterprise Portal Web client. The desktop client logs are:
� <ITM_home>\CNP\logs\kcjras1.log� <ITM_home>\CNP\logs\kcj.log
Tivoli Enterprise Portal Web client stores information in plugin131_0x.trace, which is stored in the user home directory. This is typically under C:\Document and Settings\<username>.
The Tivoli Enterprise Portal Server consists of two processes. Each of these generate different log files. The files are:
� <ITM_home>\CNP\logs\kfwras1.log� <ITM_home>\CNP\logs\cmwras1.log
If you have a problem with installation, look into the following log files:
� Common installation logs:
<ITM_home>/InstallITM/plugin/executionEvents/logs/YYYYMMDD-HHMMSS/trace_install_plugin.trc
� Platform-specific trace information:
<ITM_home>/logs/install_plugin_trace.log
� Other agent logs:
<ITM_home>/tmaitm6/logs/*.log
6.2 Troubleshooting End User Response Time Agent
Specific for End User Response Time agent, this section describes the relevant files and tracing activation procedures.
152 Deployment Guide Series: ITCAM for Response Time V6.2

Table 6-1 lists important files under the IBM Tivoli Monitoring installation path (C:\IBM\ITM or /opt/IBM/ITM) related to the End User Response Time Agent. Note that some log files reside in the Tivoli common directory (C:\Program Files\ibm\tivoli\common or /var/ibm/tivoli/common).
Table 6-1 File locations
For other problems you may need to activate tracing. The following procedure explains the tracing process.
1. Set the RAS1 tracing option for the agent into:
ERROR (UNIT:kt1 ALL) (UNIT:kt2 ALL) (UNIT:kt3 ALL) (UNIT:kra ALL)
a. This can be performed from Manage Tivoli Enterprise Monitoring Services. Right-click the selected agent, select Advanced → Edit Trace Parms, and change the RAS1 filter.
b. Edit the /opt/IBM/ITM/config/t3.ini file and set the option in KBB_RAS1.
2. Change all trace levels in t3-logging.properties to DEBUG_MAX using a text editor.
3. Restart the agent.
Windows file name UNIX file name Description
Configuration files
tmaitm6\kt3env config/kt3.ini T3 agent environment configuration file
tmaitm6\$(HOSTNAME)_t3.cfg $hostname_t3.cfg T3 agent configuration setting file - not to be edited manually
tmaitm6\t3-logging.properties config/t3-logging.properties T3 agent log level configuration
Log files
tmaitm6\logs\$hostname$_t3_*.log
$(HOSTNAME)_t3_*.log T3 agent native diagnostic logs
tmaitm6\logs\Primary_$(HOSTNAME)_t3.LG*
logs\Primary_$(HOSTNAME)_t3.LG*
T3 agent native diagnostic log
<common-dir>\BWM\logs\trace-dashboard.log
<common-dir>/BMW/logs/trace-dashboard.log
T3 agent Java diagnostic log (in Tivoli common directory)
Note: After gathering the logs, turn off the tracing. Having tracing turned on causes a significant performance hit.
Chapter 6. Troubleshooting hints and tips 153

6.3 Troubleshooting Robotic Response Time Agent
Specific for Robotic Response Time agent, this section describes the relevant files and tracing activation procedures.
Table 6-2 lists important files under the IBM Tivoli Monitoring installation path (C:\IBM\ITM or /opt/IBM/ITM) related to the Robotic Response Time Agent. Note that some log files reside in the Tivoli common directory (C:\Program Files\ibm\tivoli\common or /var/ibm/tivoli/common).
Table 6-2 File locations
Windows file name UNIX file name Description
Configuration files
\tmaitm6\kt6env /config/t6.ini Robotic agent environment configuration
\tmaitm6\${HOSTNAME}_t6.cfg /config/${HOSTNAME}_t6.cfg Robotic agent configuration setting file - not to be edited manually
\tmaitm6\t6-logging.properties /config/t6-logging.properties Robotic agent log level configuration
\tmaitm6\app\RPT\config\itcamrt-logging.properties
/tmaitm6/app/RPT/config\itcamrt-logging.properties
RPT log level configuration
\tmaitm6\app\RPT\config\managed_jvm.xml
/tmaitm6/app/RPT/config/managed_jvm.xml
RPT managed JVM™ Java configuration
Log files
\tmaitm6\logs\${HOSTNAME}_t6_*.log
/logs/${HOSTNAME}_t6_*.log Robotic agent native diagnostic logs
<common_dir>\BWM\logs\trace-robotic.log
<common_dir>/BWM/logs/trace-robotic.log
Robotic agent Java diagnostic logs
<common_dir>\BWM\logs\msg-robotic.log
Robotic agent message logs
<common_dir>\BWM\logs\RPT\ {runtime version}\trace-rpt.log
<common_dir>/BWM/logs/RPT/ {runtime version}/trace-rpt.log
RPT diagnostic logs
<common_dir>\BWM\logs\{applicationname}\{scriptname}\msg-rptHistory.log
<common_dir>/BWM/logs/{applicationname}/{scriptname}/msg-rptHistory.log
RPT execution history
154 Deployment Guide Series: ITCAM for Response Time V6.2

For other problems you may need to activate tracing. The following procedure explains the tracing process.
1. Set the RAS1 tracing option for the agent into:
ERROR (UNIT:kt2 ALL) (UNIT:kt6 ALL) (UNIT:kra ALL)
a. This can be performed from Manage Tivoli Enterprise Monitoring Services. Right-click the selected agent, select Advanced → Edit Trace Parms, and change the RAS1 filter.
b. Edit the /opt/IBM/ITM/config/t6.ini file and set the option in KBB_RAS1.
2. Change all trace levels in t6-logging.properties to DEBUG_MAX using a text editor, specifically for BWM.trc.playback.common.level.
For Rational Performance Tester, tracing is controlled from the itcamrt-logging.properties file.
3. Restart the agent.
6.4 Troubleshooting Web Response Time Agent
Specific for Web Response Time agent, this section describes the relevant files and tracing activation procedures.
Table 6-2 on page 154 lists important files under the IBM Tivoli Monitoring installation path (C:\IBM\ITM or /opt/IBM/ITM) related to Web Response Time Agent.
Table 6-3 File locations
Note: After gathering the logs, turn off the tracing. Having tracing turned on causes a significant performance hit.
Windows file name UNIX file name Description
Configuration files
\tmaitm6\kt5env /config/t5.ini Web Response Time Agent configuration file
\tmaitm6\${HOSTNAME}_t5.cfg /config/${HOSTNAME}_t5.cfg Agent configuration setting file - not to be edited manually
\tmaitm6\wrm\analyzer\kfcmenv /tmaitm6/wrm/kfcmenv Web Response Time Agent Analyzer configuration file
Chapter 6. Troubleshooting hints and tips 155

For other problems you may need to activate tracing. The following procedure explains the tracing process.
1. Set the RAS1 tracing option for the agent into:
ERROR (UNIT:kt2 ALL) (UNIT:kt5 ALL) (UNIT:kra ALL)
a. This can be performed from Manage Tivoli Enterprise Monitoring Services. Right-click the selected agent, select Advanced → Edit Trace Parms, and change the RAS1 filter.
b. Edit the /opt/IBM/ITM/config/t5.ini file and set the option in KBB_RAS1.
2. Restart the agent.
6.5 Troubleshooting Client Response Time Agent
Specific for Client Response Time agent, this section describes the relevant files and tracing activation procedures.
\tmaitm6\wrm\wrm\collector\kflmenv
\tmaitm6\wrm\wrm\collector\kflmenv
Web Response Time Agent Collector configuration file
Log files
\logs\${HOSTNAME}_t5_*.log /logs/${HOSTNAME}_t5_*.log Web Response Time Agent diagnostic logs
\tmaitm6\wrm\analyzer\${HOSTNAME}_kfmserver_*.log
/tmaitm6/wrm/platform/${HOSTNAME}_kfcm120_numberSequence.log
Web Response Time Agent Analyzer logs
\tmaitm6\wrm\wrm\collector\${HOSTNAME}_kflm_*.log
/tmaitm6/wrm/platform/${HOSTNAME}_kflm_numberSequence.log
Web Response Time Agent Collector diagnostic logs
\tmaitm6\wrm\log\*.sm3 /tmaitm6/wrm/log/*.sm3 Web Response Time Agent data files
Windows file name UNIX file name Description
Note: After gathering the logs, turn off tracing. Having tracing turned on causes a significant performance hit.
156 Deployment Guide Series: ITCAM for Response Time V6.2

Table 6-2 on page 154 lists important files under the IBM Tivoli Monitoring installation path (C:\IBM\ITM or /opt/IBM/ITM) related to Client Response Time Agent.
Table 6-4 File locations
For other problems you may need to activate tracing. The following procedure explains the tracing process.
1. Set the RAS1 tracing option for the agent into:
ERROR (UNIT:kt2 ALL) (UNIT:kt4 ALL) (UNIT:kra ALL)
a. This can be performed from Manage Tivoli Enterprise Monitoring Services. Right-click the selected agent, select Advanced → Edit Trace Parms, and change the RAS1 filter.
b. Edit the /opt/IBM/ITM/config/t4.ini file and set the option in KBB_RAS1.
2. Restart the agent.
Windows file name UNIX file name Description
Configuration files
\tmaitm6\kt4env /config/t4.ini Client Response Time Agent configuration file
\tmaitm6\${HOSTNAME}_t4.cfg /config/${HOSTNAME}_t4.cfg Agent configuration setting file - not to be edited manually
Log files
\cat\mgmt\log\keeagent.log Application log file for keeagent
\cat\mgmt\log\keehook.log Traces transaction information from monitored application from keehook process
\cat\mgmt\log\${DATE}.log Client Application Tracker data files
Note: After gathering the logs, turn off tracing. Having tracing turned on causes a significant performance hit.
Chapter 6. Troubleshooting hints and tips 157

158 Deployment Guide Series: ITCAM for Response Time V6.2

Part 3 Appendixes
Part 3
© Copyright IBM Corp. 2008. All rights reserved. 159

160 Deployment Guide Series: ITCAM for Response Time V6.2

Appendix A. The Trader application
This appendix explains the Trader application. The discussion is divided into:
� “Application components” on page 162� “Software requirements” on page 167� “Installation procedure” on page 167
A
© Copyright IBM Corp. 2008. All rights reserved. 161

Application components
The Trader application is a multi-component composite application that runs on heterogeneous platforms and execution environments. It is a simple stock trading application that allows the user to list companies, get quotes, and trade stocks of the listed companies. Figure A-1 shows the Trader application conceptual interfaces.
Figure A-1 The Trader application
The Trader application can be viewed as having a three-layer (three-tier) structure:
� The Trader application for this deployment guide has a Web interface. It has the ability to connect to the server application that provides the business logic. The connection to the server applications is based on Web services calls.
� The server applications are differentiated based on their different access methods to the underlying data, or the platform it resides on. These are J2EE-based applications that serve as Web services providers.
Trader Server applications
Trader DB2
DB2
Trader Web Client
162 Deployment Guide Series: ITCAM for Response Time V6.2

� The back-end data storage for the deployment guide version is a DB2 database. The DB2 database can reside on the same or different server.
We discuss the components in the following sections:
� “Front-end J2EE Web application” on page 163� “Back-end implementation” on page 166� “Back-end J2EE server” on page 166
Front-end J2EE Web application
The front-end Web application is developed using the Web services client wizard, the Trader*Services projects. The application consists of:
� Initial login page in login.html (Figure A-2)
Figure A-2 Login page
Note: The DB2, IMS™, and CICS radio check boxes shown in Figure A-2 are not normally available to an end user. They are included on our sample application purely to highlight the possible back-end system. Similarly, a typical application would not select a target host, but this is shown here as part of our lab environment.
Appendix A. The Trader application 163

� ListCompanyServlet (Figure A-3): invokes the back-end ListCompany Web services
Figure A-3 List Company page
164 Deployment Guide Series: ITCAM for Response Time V6.2

� GetQuotesServlet (Figure A-4): invokes the back-end GetQuote Web services
Figure A-4 Quotes window
� BuySellServlet: invokes either the buy or sell Web services
� LogoutServlet: clears up the session bean
We provide three types of enterprise application archive (ear) file for the client interface:
� TraderClientEAR: This ear file runs the TraderClientWeb application that provides the basic Trader application functionality.
� TraderClientMemEAR: This ear file runs the TraderClientMem application that has a memory leak in the logic for testing a memory leak situation.
� TraderClientLckEAR: This ear file runs the TraderClientLck application that has a lock problem injected for testing dead lock situation.
Appendix A. The Trader application 165

Back-end implementation
The back-end systems consist of two entities: the company and the customer. The company has the quote definitions, and the customer database has the customer’s name and stock ownership. Figure A-5 shows the conceptual data structure.
Figure A-5 Entity diagram
The back-end system is implemented in DB2. The DB2 implementation is represented in two tables, the CUSTOMER table and the COMPANY table.
Back-end J2EE server
The back-end J2EE server runs on a WebSphere server for DB2 access. The WebSphere-based Web services server has the TraderDBServices.ear modules deployed into it. This program accesses DB2 data. It consists of the following modules:
� TraderDBWeb: direct front end for the Trader DB. This is useful for validating that the Trader DB application is running.
� TraderDBServices: Web module that provides Web Services provider implementation.
� Trader_DB: contains the database access module.
List company GetQuote Buy/Sell Stock
COMPANYCompany Name
Stock pricePrice history 7 days
Commission
CUSTOMERCustomer NameCompany name
Stock owned
166 Deployment Guide Series: ITCAM for Response Time V6.2

Software requirements
The software required for running the Trader application is discussed here. Figure A-6 shows the detailed configuration of our Trader application.
Figure A-6 Trader application detail
The application components are:
� TraderClient.ear, TraderClientMem.ear, TraderClientLck.ear� TraderDBSvc.ear� DB2 databases
Installation procedure
This section discusses the detailed installation guideline for installing the Trader application in our environment. The installation should be performed based on the additional material for this deployment guide. See Appendix C, “Additional material” on page 177, for how to get access to the additional material. The installation is discussed in the following sections:
� “DB2 database creation” on page 168� “WebSphere server installation” on page 168� “WebSphere client installation” on page 169
WebSphere Application Server ND V6.1
TraderClient.earTraderClientMem.earTraderClientLck.ear
WebSphere Application Server ND V6.1
TraderDBSvc.ear
DB2 UDB V8.2 FP15
TRADER
Appendix A. The Trader application 167

Initial setup for the demonstration server
The additional material is supplied as a SG247484.zip file. Extract this file to a temporary directory. In this guide, we assume that the file is extracted to the C:\Temp directory.
You must install the DB2 Universal Database and the WebSphere Application Server. We do not discuss the installation of DB2 and WebSphere in this guide. WebSphere should be set up with two application servers. We assume that you are building a network deployment environment and create two application servers called ClientSvc and ServerSvc.
DB2 database creation
The DB2 databases are created from the C:\Temp\trader.zip file. Perform the following steps:
1. On the machine on which the DB2 Universal Database has been installed, extract this file to C:\Temp\Trader.
2. Open a DB2 command window by executing the command db2cmd.
3. Navigate to C:\Temp\Trader.
4. Create the TRADER database using the command:
db2 create database TRADER
5. Populate the trader database using the command:
db2move TRADER import
6. Verify that you can connect to the database using the command:
db2 connect to TRADER
7. Run SQL command:
db2 select * from TRADER.COMPANY
You should get four rows of data.
WebSphere server installation
The server part is installed on the ServerSvc application server. The installation is performed using the WebSphere administration console.
1. Extract the ear files from the C:\Temp\WASear.zip file into the C:\Temp\applear directory.
168 Deployment Guide Series: ITCAM for Response Time V6.2
2. Modify WebSphere variables for DB2_UNIVERSAL_JDBC_NATIVEPATH and DB2_UNIVERSAL_JDBC_DRIVERPATH to point to the DB2 installation directories.
3. Create the JDBC™ datasource for the Trader database. The JNDI name should be jdbc/Trader.
4. Create a JAAS authentication user to access the database. Make sure that you map the JDBC data source to use the authentication method.
5. Create a virtual host that matches the default port for the ServerSvc application server.
6. Install the C:\Temp\applear\TraderDBSvc.ear to the ServerSvc. Make sure that you map the Web module to the appropriate virtual host that you define.
7. Save the configuration and restart the application server.
WebSphere client installation
The server part is installed on the ClientSvc application server. The installation is performed using the WebSphere administration console.
1. Extract the ear files from the C:\Temp\WASear.zip file into the C:\Temp\applear directory.
2. Create a virtual host that matches the default port for the ClientSvc application server.
3. Install the C:\Temp\applear\TraderClient.ear to the ClientSvc. Make sure that you map the Web module to the appropriate virtual host that you define.
4. Install the C:\Temp\applear\TraderClientMem.ear to the ClientSvc. Make sure that you map the Web module to the appropriate virtual host that you define.
5. Install the C:\Temp\applear\TraderClientLck.ear to the ClientSvc. Make sure that you map the Web module to the appropriate virtual host that you define.
6. Save the configuration and restart the application server.
Appendix A. The Trader application 169

170 Deployment Guide Series: ITCAM for Response Time V6.2

Appendix B. Sample statement of work
In this appendix, we provide a skeleton statement of work that you can use for developing your statement of work. The content of the statement of work would be for “ITCAM for Response Time implementation service” on page 172.
B
© Copyright IBM Corp. 2008. All rights reserved. 171

ITCAM for Response Time implementation service
The ITCAM for Response Time implementation service statement of work can consist of the sections listed here.
Executive summary
The ITCAM for Response Time implementation service provides a response time management for your enterprise. It shows the overall performance of your IT applications. It highlights response time problems, whether by application or by clients. The initial implementation would cover a collection of response times for the following application <list>.
The implementation of response time monitoring will be conducted starting on <date> for three weeks. At the end of the initial implementation period, <you> will present the implementation report, including:
� Demonstration of the solution monitoring� Highlighting of current response time health of <customer>� Recommendations for future enhancement of monitoring
Solution description
In the ITCAM for Response Time implementation service, <you> will implement a response time management system based on IBM Tivoli Monitoring solution. This solution includes implementation of IBM Tivoli Monitoring servers, as discussed in the solution configuration. The service also includes the installation and configuration of the response time monitoring agents from ITCAM for Response Time V6.2.
The solution assumes that the server’s connection to the monitoring agents would not go through a firewall.
During the implementation, we perform customization of the solution to demonstrate response time collection for <list> applications. Some development to capture these actual response time may be needed.
<You> will analyze the collected performance information and possibly perform monitoring with additional detail, as needed. The analysis is performed with the data collected in Tivoli Data Warehouse.
At the end of the implementation, <you> present the performance finding.
172 Deployment Guide Series: ITCAM for Response Time V6.2

Assumptions
The assumptions that are used in this statement of work are:
� The applications that will be monitored are <list>� Application <name> is monitored using <Robot / Web / Client agent>� Application <name> is monitored using <Robot / Web / Client agent>� Application <name> is monitored using <Robot / Web / Client agent>� Application <name> is monitored using <Robot / Web / Client agent>� Monitoring is performed from the following client workstations: <list>
Business partner responsibilities
<You> have the following responsibilities:
� Install and configure IBM Tivoli Monitoring V6.1 servers.
� Install and configure ITCAM for Response Time V6.2 agents on the appropriate machines, as indicated in the solution configuration.
� Develop and customize the monitoring environment for robotic, Web, and client response time collection.
� Provide an operation document to use and maintain the ITCAM for Response Time solution.
� Present the solution implementation result at the end of the implementation.
Customer responsibilities
This section describes the responsibilities that the customer has to the business partner. They are:
� Designate a representative who to be the focal point for all communication with the business partner relative to this project and who has the authority to act on the customer’s behalf in matters regarding this project.
� Designate operations personnel to work with the business partner as appropriate.
� Provide all required Web site content in digital form, as specified by the business partner.
� Provide all product data in a format as requested.
� Provide all data and information required for implementation
Note: Insert any additional assumptions about specific performance or transaction problem that the customer has.
Appendix B. Sample statement of work 173
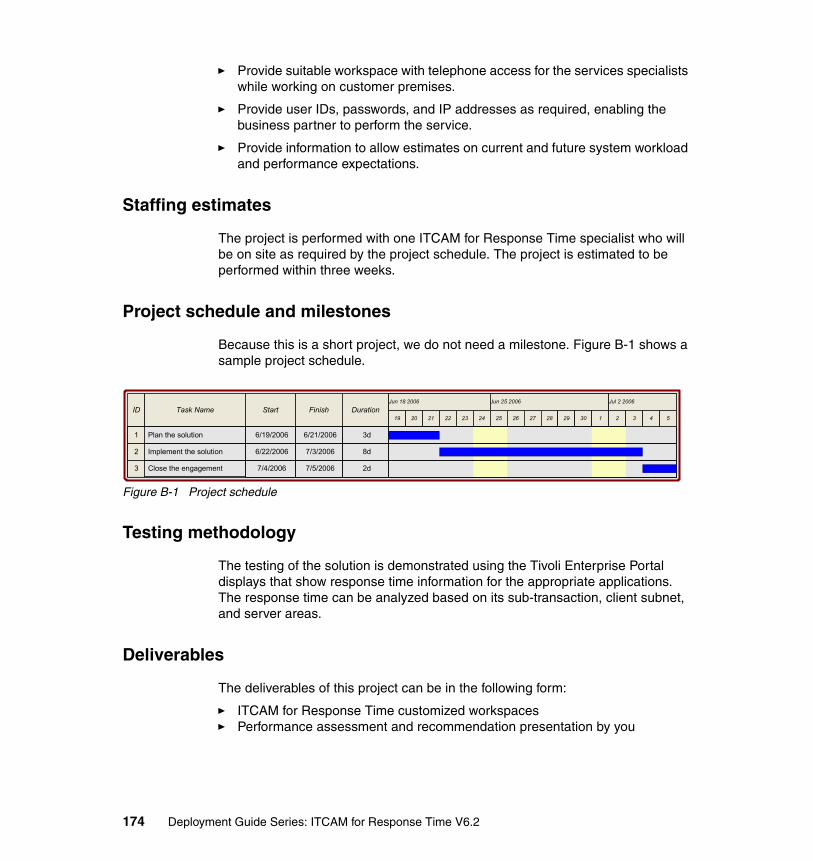
� Provide suitable workspace with telephone access for the services specialists while working on customer premises.
� Provide user IDs, passwords, and IP addresses as required, enabling the business partner to perform the service.
� Provide information to allow estimates on current and future system workload and performance expectations.
Staffing estimates
The project is performed with one ITCAM for Response Time specialist who will be on site as required by the project schedule. The project is estimated to be performed within three weeks.
Project schedule and milestones
Because this is a short project, we do not need a milestone. Figure B-1 shows a sample project schedule.
Figure B-1 Project schedule
Testing methodology
The testing of the solution is demonstrated using the Tivoli Enterprise Portal displays that show response time information for the appropriate applications. The response time can be analyzed based on its sub-transaction, client subnet, and server areas.
Deliverables
The deliverables of this project can be in the following form:
� ITCAM for Response Time customized workspaces� Performance assessment and recommendation presentation by you
ID Task Name Start Finish DurationJun 18 2006 Jun 25 2006 Jul 2 2006
19 20 21 22 23 24 25 26 27 28 29 30 1 2
1 3d6/21/20066/19/2006Plan the solution
2 8d7/3/20066/22/2006Implement the solution
3 2d7/5/20067/4/2006Close the engagement
3 4 5
174 Deployment Guide Series: ITCAM for Response Time V6.2
Completion criteria
Completion criteria for this project are:
� The performance finding and recommendations are accepted.� All deliverables have been received by <customer>.� All testing was performed successfully.
Appendix B. Sample statement of work 175

176 Deployment Guide Series: ITCAM for Response Time V6.2
Appendix C. Additional material
This book refers to additional material that can be downloaded from the Internet, as described below.
Locating the Web material
The Web material associated with this book is available in softcopy on the Internet from the IBM Redbooks Web server. Point your Web browser at:
ftp://www.redbooks.ibm.com/redbooks/SG247484
Alternatively, you can go to the IBM Redbooks Web site at:
ibm.com/redbooks
Select the Additional materials and open the directory that corresponds with the IBM Redbooks form number, SG247484.
C
© Copyright IBM Corp. 2008. All rights reserved. 177

Using the Web material
The additional Web material that accompanies this book includes the following files:
File name DescriptionSG247484.zip Zipped code samples
This file contains the following files:
File name DescriptionTrader.zip Zipped database source WASear.zip WebSphere ear files
System requirements for downloading the Web material
The Web material is to be run in an Intel server, capable of running WebSphere Application Server and DB2 Universal Database. The configuration requires the following system requirements:
Hard disk space 8GBMemory 1.5 GB
How to use the Web material
Create a subdirectory (folder) on your workstation, and unzip the contents of the Web material zip file into this folder. See also Appendix A, “The Trader application” on page 161, for more installation instruction.
178 Deployment Guide Series: ITCAM for Response Time V6.2

acronyms
AIX Advanced Interactive eXecutive
API Application Programming Interface
ARM Application Response Measurement
CD-ROM Compact Disc Read Only Memory
CICS Customer Information Control Systems
CLI Command Line Interface
CPU Central Processing Unit
DNS Domain Name Service
GB Giga Byte
GUI Graphical User Interface
HTTP Hyper Text Transfer Protocol
HTTPS HTTP Secure
IBM International Business Machines Corporation
IIS Internet Information Server
IP Internet Protocol
IT Information Technology
ITCAM IBM Tivoli Composite Application Manager
ITIL IT Infrastructure Library®
ITSO International Technical Support Organization
JAAS Java Authentication and Authorization Service
JDBC Java Database Connectivity
JMX Java Management eXtension
JNDI Java Naming and Directory Interface™
MFU Multi File Uploader
Abbreviations and
© Copyright IBM Corp. 2008. All rights reserved.
NIC Network Interface Card
OS Operating Systems
PDF Portable Document Format
RISC Reduced Instruction Set Computer
RPC Remote Procedure Call
RPT Rational Performance Tester
SLA Service Level Agreement
SOA Service Oriented Architecture
SOAP Simple Object Access Protocol
SQL Structured Query Language
SSL Secure Socket Layer
TCP/IP Transmission Control Protocol Internet Protocol
TDW Tivoli Data Warehouse
TEMA Tivoli Enterprise Monitoring Agent
TEMS Tivoli Enterprise Monitoring Server
TEP Tivoli Enterprise Portal
URL Universal Resource Locator
WRM Web Response Monitor
179

180 Deployment Guide Series: ITCAM for Response Time V6.2

Related publications
The publications listed in this section are considered particularly suitable for a more detailed discussion of the topics covered in this book.
IBM Redbooks
For information about ordering these publications, see “How to get Redbooks” on page 182. Note that some of the documents referenced here may be available in softcopy only.
� IBM Tivoli Composite Application Manager V6.1 Family Installation, Configuration, and Basic Usage, SG24-7151
� Deployment Guide Series: IBM Tivoli Monitoring 6.1, SG24-7188
Other publications
These publications are also relevant as further information sources:
� IBM Tivoli Composite Application Manager for Response Time publications:
– IBM Tivoli Composite Application Manager for Client Response Time User's Guide Version 6.2, SC23-6332
– IBM Tivoli Composite Application Manager for Web Response Time User's Guide Version 6.2, SC23-6333
– IBM Tivoli Composite Application Manager for Robotic Response Time User's Guide Version 6.2, SC23-6334
– IBM Tivoli Composite Application Manager for End User Response Time Dashboard User's Guide Version 6.2, SC23-6335
– IBM Tivoli Composite Application Manager for Response Time Problem Determination Guide Version 6.2, GI11-8061
� IBM Tivoli Monitoring publications:
– Exploring IBM Tivoli Monitoring, SC32-1803
– IBM Tivoli Monitoring Administrator's Guide, SC32-9408
– IBM Tivoli Monitoring: Configuring IBM Tivoli Enterprise Monitoring Server on z/OS, SC32-9463
© Copyright IBM Corp. 2008. All rights reserved. 181

– IBM Tivoli Monitoring Installation and Setup Guide, GC32-9407
– IBM Tivoli Monitoring Problem Determination Guide, GC32-9458
– IBM Tivoli Monitoring User's Guide, SC32-9409
– IBM Tivoli Monitoring: Upgrading from Tivoli Distributed Monitoring, GC32-9462
– IBM Tivoli Universal Agent API and Command Programming Reference Guide, SC32-9461
– IBM Tivoli Monitoring Universal Agent User's Guide, SC32-9459
– Introducing IBM Tivoli Monitoring, GI11-4071
� CandleNet ETEWatch User's Guide, GC32-9178
Online resources
These Web sites are also relevant as further information sources:
� ITCAM for Response Time online documentation
http://publib.boulder.ibm.com/infocenter/tivihelp/v3r1/index.jsp?topic=/com.ibm.itcamwas_rt.doc_6.6/welcome.htm
� ITCAM for Response Time Web site
http://www-306.ibm.com/software/tivoli/products/composite-application-mgr-response-time/
How to get Redbooks
You can search for, view, or download Redbooks, Redpapers, Technotes, draft publications and Additional materials, as well as order hardcopy Redbooks, at this Web site:
ibm.com/redbooks
182 Deployment Guide Series: ITCAM for Response Time V6.2

Help from IBM
IBM Support and downloads
ibm.com/support
IBM Global Services
ibm.com/services
Related publications 183

184 Deployment Guide Series: ITCAM for Response Time V6.2

Index
Numerics3270 6
Aagent configuration 44agent configuration dialog 58agent setup 31Application Response Measurement, see ARMapplication support files 30
installation 30installation steps 38
ARM 5, 13records 14
ARM compatibility 38armcli 38armjni 38armjni4 38Attachmate Extra 21automatic deployment 15availability 4
Bback-end system 166behavior module
load 32behaviour module 12
Ccatalog.lotus.com 12Citrix 6CLI 13Client Application Tracker 12Client Response Time agent 8, 11
architecture 12Client Application Tracker 12installation 87
Command Line Interface, see CLIcommands
db2 168db2cmd 168db2move 168itmcmd 118
© Copyright IBM Corp. 2008. All rights reserved.
setup 39setup_RPT 95
compatibility 38Composite Application Manager 6configuration 44connectivity option 28critical transactions 29
Ddat file 12db2 command 168db2cmd command 168db2move command 168demonstration 32deployment 22
automatic 15large environment 25manual 16medium scale 23proof of concept 23
disk space requirement 19
EEnd User Response Time Dashboard agent
End-user Dashboard agent 14end-user 4End-user Dashboard 8environment preparation 30ETEWatch 12ETEWatch Customizer 12ETEWatch customizer 28
Ffeatures 6file depot 8files
t3.ini 153t4.ini 157t6.ini 155trace_install_plugin.trc 152
185

Hhardware requirement 18
disk space 19memory 19
HTTP traffic 9HTTPS traffic 9Hummingbird Exceed 21
IIBM GSKit 39IBM HTTP Server 21IBM Java Runtime Environment 39IBM Personal Communication 21IBM Tivoli Composite Application Manager 6IBM Tivoli Monitoring 6implementation skills 28implementation tasks 29information technology, see ITinstallation overview 36installation wizard 31, 39, 62Internet Information Server 21iPlanet Web Server 22IT 4IT infrastructure library, see ITILITCAM for Response Time
architecture 8Client Response Time agent 8, 11component 8deployment 22End-user Dashboard 8, 14features 6hardware requirement 18implementation tasks 29installation overview 36Robotic Response Time agent 8, 13scalability 22skills 28software requirement 19Web Response Time agent 8
ITCAM for Response Time Tracking 38ITIL 4itmcmd command 118
Kkick off 29kt1depot 16kt3agent 14kt4agent 13
kt5agent 11kt6agent 14
Llarge environment 25libarm32 38libarm4 38Lotus Notes 21Lotus® Notes® 6
Mmanual deployment 16measurement point 29medium scale 23memory requirement 19Mercury LoadRunner 6, 13MFU 15Microsoft Internet Information Server 21Microsoft Outlook 21Multiple File Uploader, see MFUmuti tiered application 5
Nnetwork connectivity 30Network Monitor Driver 73
OOMEGAMON 6Open Group 5Open Process Automation Library 12operating system 20, 30operating system matrix 19
Pperformance 4project initiation 29proof of concept deployment 23
RRational Performance Tester 13
script 31Rational Performance Tester Workbench
installation 93Rational Robot 13
script 31Redbooks Web site 182
186 Deployment Guide Series: ITCAM for Response Time V6.2

Contact us xremote deployment 31, 55Remote Procedure Call, see RPCresponse time
collection 6robotic file depot 8Robotic Response Time agent 8, 13robotic runtime 13robotic script
automated deployment 15distribution 15manual deployment 16
robotic scripts 8RPC 16
Ssample environment 38SAP® 6scalability 22Service Level Agreement, see SLAsetup command 39setup_RPT 95situation definition 32skill transfer 32skills 28SLA 4sm3 file 10SOAP Server Configuration 59software distribution mechanism 31software levels 21software requirement 19
operating system 20software levels 21
solution demonstration 32Summarization and Pruning agent 26Sun Java System Web Server 22supported operating system 19
Tt3.ini 153t4.ini 157t6.ini 155TDW 14Tivoli Composite Application Manager 6Tivoli Configuration Manager 21Tivoli Data Warehouse 21, 26Tivoli Data Warehouse, see TDWTivoli Enterprise Console 21
Tivoli Enterprise Monitoring Server 26hardware requirement 18
Tivoli Enterprise Portal 8Tivoli Enterprise Portal Server 26Tivoli Open Process Automation Library 12TN3270 21trace_install_plugin.trc 152Trader
BuySellServlet 165company database 166customer database 166GetQuotesServlet 165ListCompanyServlet 164login.html 163LogoutServlet 165
WWarehouse proxy 26Web Respoinse Time agent
Analyzer 10Web Response Monitor 10Web Response Time agent 8–9
installation 75Web Response Monitor 10
Web server exit 32Web traffic 6Windows Network Monitor 71
Index 187

188 Deployment Guide Series: ITCAM for Response Time V6.2

Deployment Guide Series: ITCAM
for Response Time V6.2
Deployment Guide Series:
ITCAM for Response Tim
e V6.2
Deployment Guide Series:
ITCAM for Response Tim
e V6.2
Deployment Guide Series: ITCAM
for Response Time V6.2

Deployment Guide
Series: ITCAM for
Response Time V6.2
Deployment Guide
Series: ITCAM for
Response Time V6.2


®
SG24-7484-00 ISBN 0738486639
INTERNATIONAL TECHNICALSUPPORTORGANIZATION
BUILDING TECHNICALINFORMATION BASED ONPRACTICAL EXPERIENCE
IBM Redbooks are developed by the IBM International Technical Support Organization. Experts from IBM, Customers and Partners from around the world create timely technical information based on realistic scenarios. Specific recommendations are provided to help you implement IT solutions more effectively in your environment.
For more information:ibm.com/redbooks
®
Deployment Guide Series: ITCAM for Response Time V6.2
Response time management for end-user dashboard
Extensive deployment and usage examples
Solution guide and references
This IBM® Redbooks® publication is written as part of the deployment guide series. This book provides a step-by-step guide for deploying ITCAM for Response Time V6.2. This deployment guide can help an IBM or business partner service person plan and perform the deployment of the product.
The discussion of ITCAM for Response Time includes the explanation of product architecture and its components. We discuss planning and sizing considerations before you implement the product and some guidelines on setting up service engagement for the product.
The deployment explained in the book would fit for a demonstration or a small deployment system, although the information is highly relevant for larger deployment engagements. This book also explains some usage scenario that can be performed for demonstrating the product.
Back cover