
Automated Demand Response Strategies and Commissioning Commercial Building Controls
Upload
phungthienCategory
view
215download
1
Automated Demand Response Using OpenADR Application Guide 125-010 Rev. 3, July, 2011
Rev. 3, July, 2011
NOTICE
Document information is subject to change without notice and should not be construed as a commitment by Siemens Industry, Inc. Companies, names, and various data used in examples are fictitious unless otherwise noted. No part of this document may be reproduced or transmitted in any form or by any means, electronic or mechanical, for any purpose, without the express written permission of Siemens Industry, Inc.
All software described in this document is furnished under a license and may be used or copied only in accordance with the terms of such license.
For further information, contact your nearest Siemens Industry, Inc. representative.
Copyright 2011 by Siemens Industry, Inc.
Patent Pending
CREDITS
Product or company names mentioned herein may be the trademarks of their respective owners.
TO THE READER
Your feedback is important to us. If you have comments about this document, please send them to [email protected]
Printed in the U.S.A.
Siemens Industry, Inc. 1
Table of Contents About this Application Guide ................................................................................................... 5
Application Guide Organization ............................................................................................................. 5 Suggested Reference Materials and Web Sites ...................................................................................... 5 Getting Help ........................................................................................................................................... 6 Where to Send Comments ...................................................................................................................... 6
Chapter 1 – Introduction ........................................................................................................... 7 What is Demand Response? ................................................................................................................... 7
Active Markets ................................................................................................................................. 7 Anticipated Market Growth ............................................................................................................. 8
What is OpenADR? ................................................................................................................................ 8
Chapter 2 – Working with the ADR Client Application ......................................................... 10 What is the ADR Client Application? .................................................................................................. 10 Guidelines for Setting up DRAS Communication Parameters ............................................................. 11
Information Needed ....................................................................................................................... 11 Proxy Server Examples .................................................................................................................. 12 DRAS Server Examples ................................................................................................................. 13
Chapter 3 – Demand Response Strategies ........................................................................... 14 How to Design DR Control Strategies ................................................................................................. 14
Requirements ................................................................................................................................. 14 Important Considerations ............................................................................................................... 14 Key Terms and Concepts ............................................................................................................... 15 Factors Affecting DR Potential ...................................................................................................... 16 Methods of Executing DR Control Strategies................................................................................ 19 Return to Normal Strategies ........................................................................................................... 19
Common DR Control Strategies ........................................................................................................... 19 Strategy 1: Adjusting the Zone Temperature ................................................................................. 20 Strategy 2: Decreasing the Duct Static Pressure Setpoint .............................................................. 22 Strategy 3: Increasing the Supply Air Temperature ....................................................................... 24 Strategy 4: Limiting the Fan VFD ................................................................................................. 25 Strategy 5: Increasing the Chilled Water Supply Temperature Setpoint ....................................... 27 Strategy 6: Limiting the Chilled Water Cooling Valve Position ................................................... 28 Strategy 7: Restricting Chiller Operation....................................................................................... 29 Strategy 8: Dimming the Lighting Level ....................................................................................... 30 Strategy 9: Turning Off Lights ...................................................................................................... 31 Strategy 10: Pre-Cooling Buildings ............................................................................................... 32
Chapter 4 – Typical Workflow for Implementing Demand Response Strategies ................ 34 Steps for Implementing Strategies........................................................................................................ 34
Step 1: Assess utility/ISO DR programs and incentives ................................................................ 34
Automated Demand Response Using OpenADR Application Guide
2 Siemens Industry, Inc.
Step 2: Conduct DR-ready audits .................................................................................................. 36 Step 3: Select DR programs in which to participate ...................................................................... 37 Step 4: Identify DR control strategies and sequences of operation ............................................... 37 Step 5: Test and deploy selected DR control strategies ................................................................. 45 Step 6: Develop performance measurement and verification reports (Optional) ........................... 45 Step 7: Develop standard operating procedures for DR participation ........................................... 48
Chapter 5 – Deploying Demand Response Strategies with the ADR Client Application .... 49 Installing the ADR Client Application on Different System Architectures ......................................... 49
SOAP Server and APOGEE System .............................................................................................. 49 BACnet IP to BACnet Field Panels ............................................................................................... 50 BACnet IP to Insight BACnet Server ............................................................................................ 51
Calculating Baseline and Actual Demand Reduction ........................................................................... 52 Important Considerations ............................................................................................................... 52 Calculation Methods ...................................................................................................................... 53
Achieving Desired DR Levels and Automatic DR ............................................................................... 57 Approaches for Achieving DR Levels ........................................................................................... 57 Approaches for Achieving Automatic DR ..................................................................................... 60
Understanding Differences in Commanding Control Points ................................................................ 61 Command Priority Properties ........................................................................................................ 61
Selecting Command Priorities .............................................................................................................. 63 APOGEE Points ............................................................................................................................. 63 BACnet Points ............................................................................................................................... 64
Setting up the ADR Client Application on an APOGEE System ......................................................... 64 Step 1: Identify control points for executing DR control strategies ............................................... 65 Step 2: Create control points for DR event information ................................................................ 66 Step 3: Create additional control points for DR control actions .................................................... 67 Step 4: Create additional control points to allow exclusions from DR events ............................... 68 Step 5: Decide how to implement DR control actions ................................................................... 69 Step 6: Determine offset times for DR control actions .................................................................. 70 Step 7: Configure notification points ............................................................................................. 72 Step 8: Configure response points ................................................................................................. 75 Step 9: Configure control points for DR control actions ............................................................... 76 Step 10: Write PPCL for DR control actions ................................................................................. 80 Step 11: Test DR strategies and publish DR test reports ............................................................... 81 Step 12: Create graphic screens for real-time monitoring (Optional) ............................................ 82
Appendix A – Sample Building Data for Deploying Demand Response Strategies ........... 83 Building Data ....................................................................................................................................... 83 HVAC System Data ............................................................................................................................. 84
Primary Cooling ............................................................................................................................. 84 Primary Heating ............................................................................................................................. 84 AHU/Terminal Systems ................................................................................................................. 84 Pumps and Cooling Tower Fans .................................................................................................... 85

Table of Contents
Siemens Industry, Inc. 3
Lighting System Data ........................................................................................................................... 85 Area Lighting ................................................................................................................................. 85
Plugged and Other Electrical Loads ..................................................................................................... 86 Utility/ISO Data ................................................................................................................................... 86
Maximum Demand ........................................................................................................................ 86 Minimum Demand ......................................................................................................................... 86 Months ........................................................................................................................................... 86
Control System Architecture ................................................................................................................ 87 Recommended DR Control Strategies .................................................................................................. 88
Selected DR Strategies ................................................................................................................... 88 DR Strategies Mapped to DR Mode Levels ................................................................................... 88
Deploying DR Control Strategies with the ADR Client Application ................................................... 89 Required Software Modules .......................................................................................................... 89
Appendix B – Sample Templates for Demand Response Audits ......................................... 90 Building Data ....................................................................................................................................... 90 HVAC System Data ............................................................................................................................. 91
Primary Cooling ............................................................................................................................. 91 Primary Heating ............................................................................................................................. 91 AHU/Terminal Systems ................................................................................................................. 92 Exhaust Systems ............................................................................................................................ 92 Pumps............................................................................................................................................. 93 Cooling Tower Fans ....................................................................................................................... 93
Lighting System Data ........................................................................................................................... 93 Area Lighting ................................................................................................................................. 93
Plugged and Other Electrical Loads ..................................................................................................... 94 Utility/ISO Data ................................................................................................................................... 94
Energy Types ................................................................................................................................. 95 Indices ............................................................................................................................................ 95 Maximum Demand ........................................................................................................................ 95 Minimum Demand ......................................................................................................................... 96 Months ........................................................................................................................................... 96
Sub-Metering ........................................................................................................................................ 97
Glossary .................................................................................................................................. 98

About this Application Guide
Siemens Industry, Inc. 5
About this Application Guide This guide is designed to help identify how you can plan and develop demand response (DR) strategies for an APOGEE® Building Automation System (BAS), and describes DR deployment methods using the Automated Demand Response (ADR) Client application.
Due to the lack of standardization in DR programs throughout the country, this guide does not provide information on all possible DR programs in the U.S. The majority of the information in this guide is based on programs in the state of California, and is the only market where the OpenADR standard protocol is supported at the time of this document’s creation.
This guide assumes that you understand the concepts of building automation and database management. It also assumes that you are familiar with APOGEE system concepts and understand its basic operations. However, most of the information and strategies presented in this guide also apply to non-APOGEE systems.
Application Guide Organization This guide contains the following chapters:
• Chapter 1 – Introduction describes DR and explains how OpenADR works.
• Chapter 2 – Working with the ADR Client Application provides guidelines for setting up the ADR Client application to communicate with utilities and a sample configuration.
• Chapter 3 – Demand Response Strategies provides an overview of how to determine DR control strategies, and describes common strategies.
• Chapter 4 – Typical Workflow for Implementing Demand Response Strategies discusses the steps involved in planning, developing, and deploying DR control strategies.
• Chapter 5 – Deploying Demand Response Strategies with the ADR Client Application describes DR deployment methods using the ADR Client application.
• Appendix A – Sample Building Data for Deploying Demand Response Strategies describes a sample building and its data, operating schedules, HVAC and BAS systems, and DR strategies.
• Appendix B – Sample Templates for Demand Response Audits includes sample templates that you can use to collect DR audit data.
• The Glossary describes terms and acronyms used in this guide.
Suggested Reference Materials and Web Sites In addition to this guide, you may also want to become familiar with the following reference materials:
• APOGEE SOAP Server User Guide. Contains detailed information on the installation, configuration, and use of the APOGEE SOAP Server. To obtain a copy, contact the Custom Solutions department in Buffalo Grove.
• Automated Demand Response (ADR) Client User Guide (541-009). Contains detailed information on the installation, configuration, and use of the ADR Client application. The guide is included with the ADR Client application.

Automated Demand Response Using OpenADR Application Guide
6 Siemens Industry, Inc.
• ASHRAE Standard BACnet: A Data Communication Protocol for Building Automation and Control Networks (Standard 135-1995). Describes the BACnet communication services and protocols for computer equipment used for monitoring and controlling heating, ventilation, and air conditioning (HVAC) and other building systems. For more information, see: http://www.ashrae.org
• Green Building Solutions Application Guide (125-5061). This application guide describes how you can use existing technology to achieve or enhance green building design, construction, operation, and maintenance; how Siemens Industry, Inc. products and solutions can assist you in obtaining LEED® credits for LEED® certification of new and existing buildings; and how to execute green building projects.
• Leveraging APOGEE: A Tiered Approach to Submetering in Your Facility (125-3203). This application guide provides you a greater understanding of how your facility uses energy and how your building automation system can be leveraged to optimize energy consumption and save money.
• NIST Framework and Roadmap for Smart Grid Interoperability Standards, Release 1.0. Provides a high-level conceptual reference model for the Smart Grid, identifies existing standards, documents action plans, and describes the strategy to establish requirements and standards to help ensure Smart Grid cyber security. For more information, see http://www.nist.gov/public_affairs/releases/upload/smartgrid_interoperability_final.pdf
• Open Automated Demand Response Communications Specification (Version 1.0). California Energy Commission, PIER Program. CEC‐500‐2009‐063. Describes an open standards‐based communications data model designed to promote common information exchange between the utility or independent system operator and electric customers using demand response price and reliability signals. For more information, see http://openadr.lbl.gov/pdf/cec-500-2009-063.pdf
• PIER Demand Response Research Center Web site. Contains information on DR research in California, along with several DR publications from the Lawrence Berkeley National Laboratory (LBNL). http://drrc.lbl.gov/
• Technical Glossary of Building Controls Terminology and Acronyms (125-2185). This glossary defines hundreds of words, terms, and acronyms that you will encounter when using Siemens Industry, Inc. documentation.
External documents are available from their respective organizations. Information about other Siemens Industry, Inc. products, services, and technical training classes can be obtained from your local Siemens Industry, Inc. representative.
Getting Help For more information about automated DR using the ADR Client application, contact Systems Applications in Buffalo Grove.
Where to Send Comments Your feedback is important to us. If you have comments about this guide, please submit them to: [email protected].
Chapter 1 – Introduction
Siemens Industry, Inc. 7
Chapter 1 – Introduction This chapter describes DR and explains how OpenADR works.
What is Demand Response? As defined by the U.S. Federal Energy Regulatory Commission, DR is an “…action taken to reduce electricity demand in response to price, monetary incentives, or utility directives so as to maintain reliable electric service or avoid high electricity prices”1
Utilities have established DR programs to:
. Participants of DR events agree under contracts with utilities to carry out various demand response control strategies to curb their electrical demand (kW) in order to gain financial benefits, which typically are received through incentives and reduction in electrical costs.
• motivate changes in electric consumption by customers in response to changes in the price of electricity over time.
• motivate lower electricity use at times of high market prices or when grid reliability is jeopardized by providing incentive payments.
For more information on DR programs, see Step 1: Assess utility/ISO DR programs and incentives in Chapter 4.
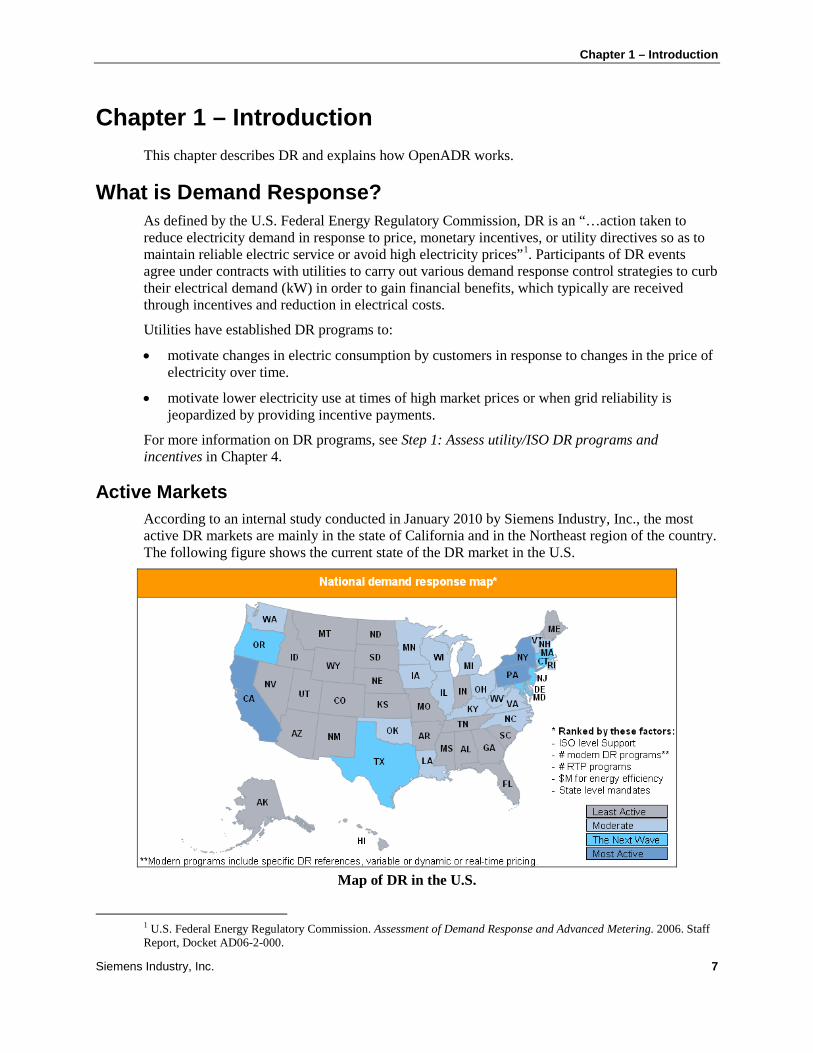
Active Markets According to an internal study conducted in January 2010 by Siemens Industry, Inc., the most active DR markets are mainly in the state of California and in the Northeast region of the country. The following figure shows the current state of the DR market in the U.S.
Map of DR in the U.S.
1 U.S. Federal Energy Regulatory Commission. Assessment of Demand Response and Advanced Metering. 2006. Staff Report, Docket AD06-2-000.
Automated Demand Response Using OpenADR Application Guide
8 Siemens Industry, Inc.
Anticipated Market Growth It is anticipated that the DR market will grow to include different parts of the country and mature over the years. For more information on DR market potential, see Assessment of Demand Response & Advanced Metering.2
The growing interest in DR is also evident in environmental protection efforts. The U.S. Green Building Council, which developed the LEED Green Building Rating Systems™, created a pilot LEED credit for DR
3
To further support the growing market for DR in California, the California Energy Commission (CEC) funded the development of Open Automated Demand Response, also known as OpenADR.
. As part of this pilot, a DR credit has been proposed in addition to the LEED’s energy efficiency requirements to emphasize the value of peak load reduction. By incorporating DR strategies in the design and operation of building systems, a project could gain additional LEED points and realize benefits from the reduction in carbon emissions.
What is OpenADR? Developed by the Demand Response Research Center (DRRC), OpenADR is a communications data model designed to facilitate sending and receiving DR signals between a utility or independent system operator (ISO) and electric customers. The data model interacts with building control systems that are preprogrammed to take action based on a DR signal, enabling a DR event to be fully automated, with no manual intervention.4
In September 2009, the Open Automated Demand Response Communications Specification (Version 1.0) gained national recognition when the National Institute of Standard Technology selected it as one of the recommended standards and specifications for achieving smart grid interoperability.
5
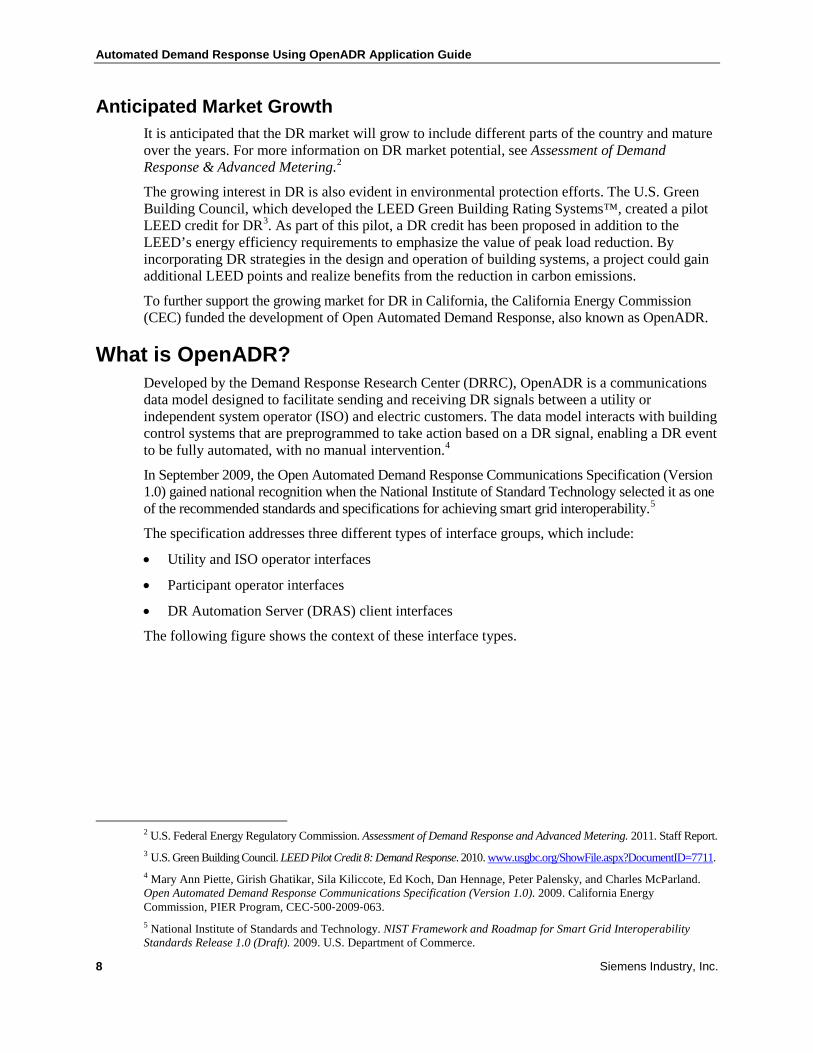
The specification addresses three different types of interface groups, which include:
• Utility and ISO operator interfaces
• Participant operator interfaces
• DR Automation Server (DRAS) client interfaces
The following figure shows the context of these interface types.
2 U.S. Federal Energy Regulatory Commission. Assessment of Demand Response and Advanced Metering. 2011. Staff Report. 3 U.S. Green Building Council. LEED Pilot Credit 8: Demand Response. 2010. www.usgbc.org/ShowFile.aspx?DocumentID=7711. 4 Mary Ann Piette, Girish Ghatikar, Sila Kiliccote, Ed Koch, Dan Hennage, Peter Palensky, and Charles McParland. Open Automated Demand Response Communications Specification (Version 1.0). 2009. California Energy Commission, PIER Program, CEC‐500‐2009‐063. 5 National Institute of Standards and Technology. NIST Framework and Roadmap for Smart Grid Interoperability Standards Release 1.0 (Draft). 2009. U.S. Department of Commerce.

Chapter 1 – Introduction
Siemens Industry, Inc. 9
DRAS Client Interface Types.6
The ADR Client application described in this guide incorporates a DRAS client as defined in the Open Automated Demand Response Communications Specification (Version 1.0) and also enables you to configure and automatically execute DR control actions. See
Chapter 2 – Working with the ADR Client Application for an overview of the ADR Client application.
For detailed information on OpenADR, it is strongly recommended that you become familiar with the CEC’s Open Automated Demand Response Communications Specification (Version 1.0), available at http://drrc.lbl.gov/sites/drrc.lbl.gov/files/cec-500-2009-063.pdf. The following sections are particularly helpful:
• Executive Summary • Section 1.0: Introduction • Section 4.0: Use of This Specification • Section 6.1: Automated Demand Response Architecture • Section 6.5.3: Demand Response Automation Server Client View of Demand Response Events • Section D.2.1: Critical Peak Pricing (CPP) Use Cases • Section D.2.7: Generic Real-Time Pricing Based Programs (RTP) Use Cases
6 See note 4.

Automated Demand Response Using OpenADR Application Guide
10 Siemens Industry, Inc.
Chapter 2 – Working with the ADR Client Application This chapter provides guidelines for setting up the ADR Client application to communicate with utilities and a sample configuration.
NOTE: For detailed information on using the ADR Client application, see the Automated Demand Response (ADR) Client User Guide (541-009) that is provided with the application.
What is the ADR Client Application? The ADR Client application is a DR application developed by Siemens Industry, Inc. that works with an OpenADR DRAS and APOGEE BAS. It receives DR events from an OpenADR DRAS, processes DR event information with pre-defined DR control actions, and commands DR control points to execute control actions such as turning off lights, raising thermostat settings, limiting fan speed, locking out chillers, etc.
High-level Architecture of the ADR Client Application.
The ADR Client application consists of the following components:
• Windows Service. The Siemens DR Client service runs in the background and continuously processes DR event information from a utility DRAS server. By default, the polling frequency is 1 minute, which you can change through the user interface. The Windows service supports the following: − BACnet Adapter. Communicates with BACnet field panel controllers (APOGEE
or third-party) and commands BACnet objects. It also communicates with the Insight BACnet Server and commands APOGEE control points that are exported as BACnet objects.
Chapter 2 – Working with the ADR Client Application
Siemens Industry, Inc. 11
− SOAP Adapter. Communicates with the APOGEE SOAP Server and commands APOGEE control points using the APOGEE SOAP interface.
• User Interface. From the user interface, you can configure the DRAS server communication parameters, control points, and pre-defined DR control actions.
Guidelines for Setting up DRAS Communication Parameters You must configure the communication parameters so that the DRAS client component can communicate with a utility DRAS server. Because communication is handled over the Internet, you will most likely need to use a proxy server for security purposes. A proxy server will be included in the examples throughout this section.
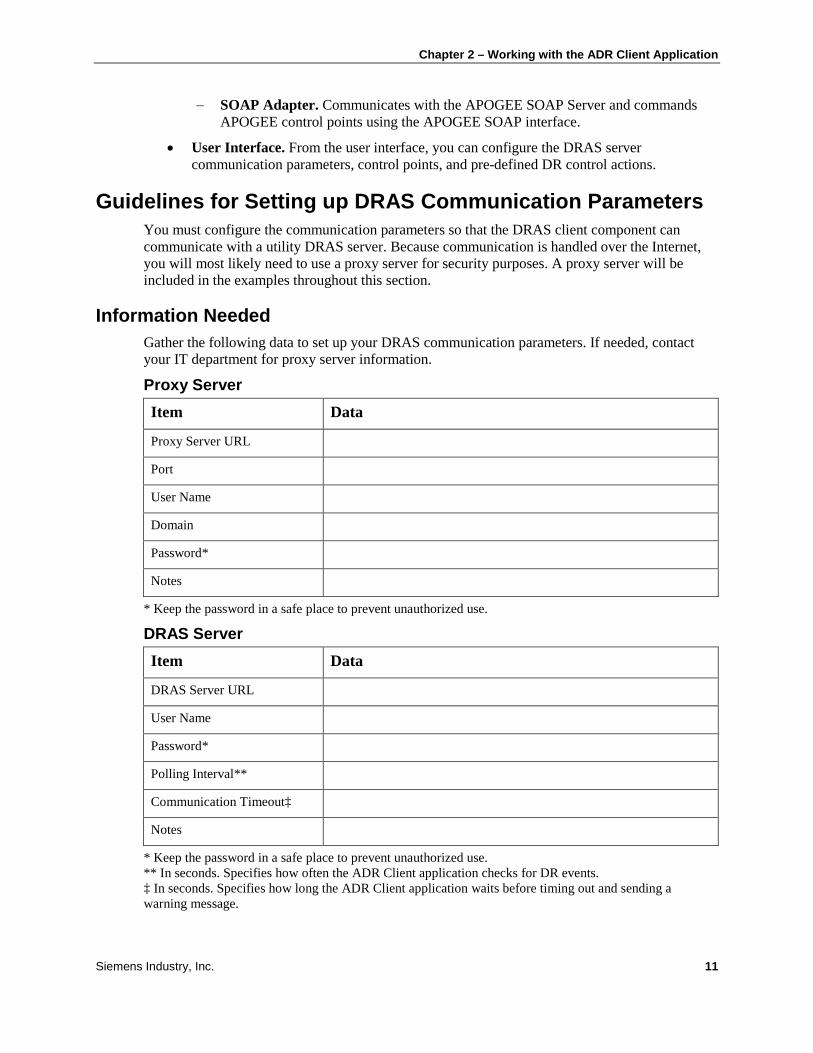
Information Needed Gather the following data to set up your DRAS communication parameters. If needed, contact your IT department for proxy server information.
Proxy Server Item Data
Proxy Server URL
Port
User Name
Domain
Password*
Notes
* Keep the password in a safe place to prevent unauthorized use.
DRAS Server Item Data
DRAS Server URL
User Name
Password*
Polling Interval**
Communication Timeout‡
Notes
* Keep the password in a safe place to prevent unauthorized use. ** In seconds. Specifies how often the ADR Client application checks for DR events. ‡ In seconds. Specifies how long the ADR Client application waits before timing out and sending a warning message.

Automated Demand Response Using OpenADR Application Guide
12 Siemens Industry, Inc.
Proxy Server Examples As described by Wikipedia7
If the filter validates the request, the proxy server provides the resource by connecting to the relevant server and requesting the service on behalf of the client. A proxy server may optionally alter the client’s request or the server’s response, and sometimes it may serve the request without contact the specified server. In this case, it caches responses from the remote server, and returns subsequent requests for the same content directly.
, a proxy server is a server (a computer system or an application) that acts as an intermediary for requests from clients seeking resources from other servers. Clients connect to the proxy server and request a service, such as a file, connection, Web page, or other resource. The proxy server evaluates the request according to its filtering rules. For example, it may filter traffic by IP address or protocol.
Proxy servers are used for:
• protecting the anonymity of computers behind it for security. • speeding up access to resources through caching. • applying access policies to network services or content (for example, blocking sites). • logging/auditing usage. • bypassing security controls. • scanning transmitted content for malware before delivery. • scanning outbound content to protect against data leaks. • circumventing regional restrictions.
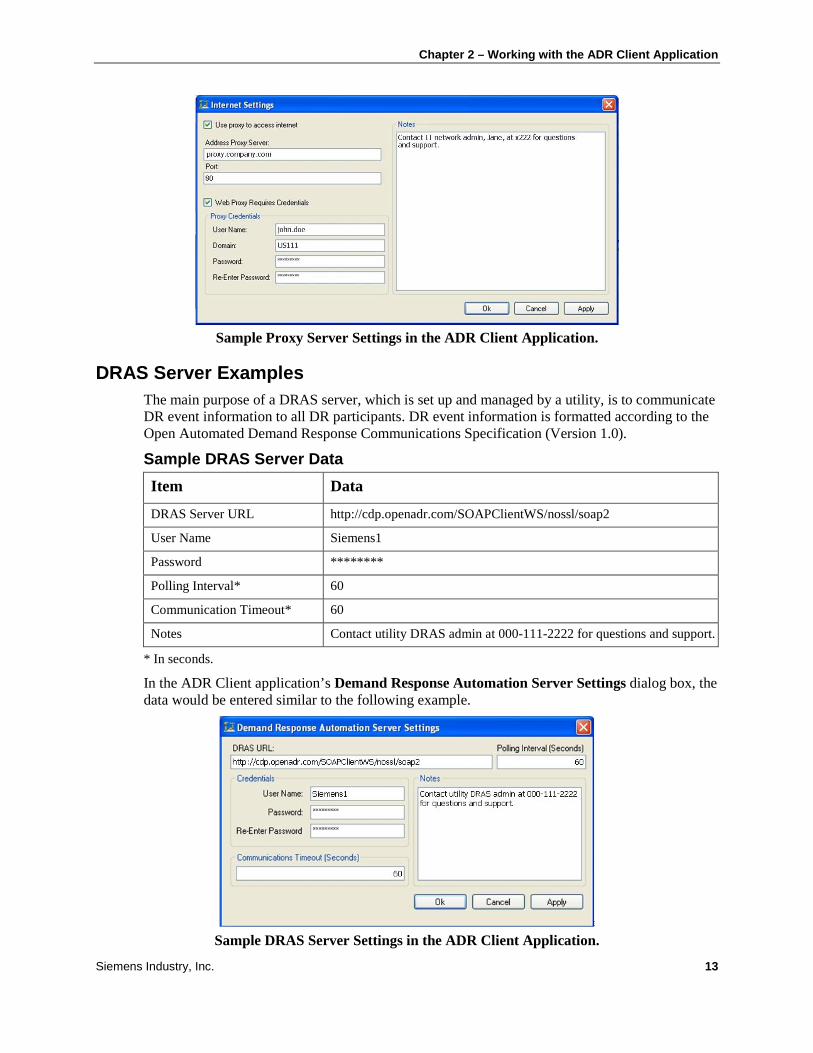
Sample Proxy Server Data Item Data
Proxy Server URL http://www.proxy.company.com
Port 80
User Name john.doe
Domain US111
Password *******
Notes Contact IT network admin, Jane, at x222 for questions and support.
In the ADR Client application’s Internet Settings dialog box, the data would be entered similar to the following example.
7 Wikipedia. Proxy Server. http://en.wikipedia.org/wiki/Proxy_server.
Chapter 2 – Working with the ADR Client Application
Siemens Industry, Inc. 13
Sample Proxy Server Settings in the ADR Client Application.
DRAS Server Examples The main purpose of a DRAS server, which is set up and managed by a utility, is to communicate DR event information to all DR participants. DR event information is formatted according to the Open Automated Demand Response Communications Specification (Version 1.0).
Sample DRAS Server Data Item Data
DRAS Server URL http://cdp.openadr.com/SOAPClientWS/nossl/soap2
User Name Siemens1
Password ********
Polling Interval* 60
Communication Timeout* 60
Notes Contact utility DRAS admin at 000-111-2222 for questions and support.
* In seconds.
In the ADR Client application’s Demand Response Automation Server Settings dialog box, the data would be entered similar to the following example.
Sample DRAS Server Settings in the ADR Client Application.

Automated Demand Response Using OpenADR Application Guide
14 Siemens Industry, Inc.
Chapter 3 – Demand Response Strategies This chapter provides an overview of how to determine DR control strategies, and describes common DR strategies for a typical commercial office building.
How to Design DR Control Strategies
Requirements You must design DR control strategies that:
• achieve and maintain the desired DR level; otherwise, there will be no benefits from participating.
• are based on good engineering design and operational practices.
• maintain occupant productivity and minimize discomfort, inconvenience, and loss of revenue of the participating facilities.
• have transitions that are fast enough to achieve the level of demand reduction before or at the start of the DR event, but slow enough to prevent the building occupants from noticing sudden changes.
In addition, it is highly recommended that you send mass notifications to building occupants about the extent and effect of DR control actions, and the benefits that the company will gain by participating in the DR event. When fully informed, building occupants will more likely tolerate any resulting short-term discomfort and inconvenience.
Important Considerations • Ask the Following Questions.
− How do DR control strategies work? Are the strategies suitable for Day-Ahead or Day-Of DR event timing notification?
− How much electrical demand reduction can be achieved by executing a DR control strategy?
− How far in advance of the DR event start time must the DR control action be executed so that the reduction is realized (with high certainty) at the start time of the DR event?
− What will be the required sequence of operation to properly execute the DR control actions? Will the sequence require some types of interlocking and/or time delay to ensure the reliability of operation and to prevent physical damages to the mechanical devices?
− What will be the impact to the indoor environmental quality of the occupied space?
− What will be the impact to overall HVAC mechanical devices and systems operation?
− How will the reduction in electrical demand be measured and verified?
− What will be the sequence of operation to gracefully exit (return to normal) the DR control action?
• Test Your Strategies. Because DR control strategies vary, it’s important to select ones that will fit with the overall building sequences of operation and HVAC systems. This can be difficult, since electrical loads are dynamic and sensitive to weather conditions, occupancy, and other factors. You should conduct field experiments to test various strategies to best

Chapter 3 – Demand Response Strategies
Siemens Industry, Inc. 15
determine the necessary control strategies and the level of achievable demand reduction. This is especially important for strategies such as raising zone temperature setpoints.
• Avoid Incurring Penalties. DR events with mandatory participation usually carry stiff penalties for non-compliance. Typically, participation in a capacity market option is mandatory as the load commitment from participants represent a firm resource level for the utility. DR events with voluntary options provide participants an incentive to reduce demand, but do not penalize for non-compliance. Participation in critical peak pricing programs and/or dynamic pricing programs is usually voluntary.
• Include the Ability to Opt-out/Override. When carrying out semi-automatic or automatic DR control actions, building operators must be able to opt-out or override DR control actions during the DR events if they deem that such control actions are undesirable, unacceptable, or can impact the safety of building occupants.
• Minimize the “Rebound” Effect. The “rebound” effect is the extra energy used to return building systems to normal operating conditions, or the degree of disruption to a graceful return to proper building environmental control, after a DR event. If possible, minimize the rebound effect by extending the DR period until the building is unoccupied. Otherwise, gradually return to normal building control strategies.
Key Terms and Concepts DR Operation Mode Values Target electrical demand reduction is determined by the following DR operation mode values:
• NORMAL. Normal operation.
• MODERATE. Moderate level of demand reduction.
• HIGH. High level of demand reduction.
• SPECIAL. Specific levels of demand reduction as determined on a case-by-case basis between DR participants and utilities (typically at a level higher than HIGH).
NOTE: Specific electrical demand (kW number) targets for different DR operation modes will vary among DR participants and will depend on facility, HVAC, and lighting types; the availability of distributed generation capacity; and the level of system control. See Factors Affecting DR Potential for more information.
Day-Ahead and Day-Of: Timing of DR Event Notification Notification of DR events to participants can come a day before (Day-Ahead) and/or on the day of (Day-Of) the DR event.
• Day-Ahead. Customers are notified one day (24 hours) in advance of a DR event. This notification type allows participants to deploy load-shifting and load-shaping strategies to achieve the demand reduction.
• Day-Of. Customers are notified on the day of the DR event. The notification can arrive instantaneously of the event, 5 minutes, 15 minutes, 30 minutes, 1 hour, or 6 hours, in advance of the DR event start time. End-users who are equipped with enabling technologies that allow automatic DR actions will be able to effectively handle the Day-Of notification. Also, as notification time decreases, incentives increase.
Absolute and Relative Setpoint Adjustments There are two common ways to adjust setpoints identified by DR control strategies: absolute and relative.

Automated Demand Response Using OpenADR Application Guide
16 Siemens Industry, Inc.
• Absolute. Assigns a specific value (within acceptable high and low limit values) to the new setpoint. The advantage is that there is no need to check whether the new setpoint value will fall outside the acceptable range. The drawback occurs when the actual sensed value is already at or over the new setpoint—the HVAC system can do nothing to adjust its operation, resulting in no further demand reduction.
For example, a zone temperature setpoint is set to an absolute value of 75°F during the DR event. However, if the actual zone temperature is already at 75°F or above, there will be no further demand reduction.
• Relative. Relative setpoint adjustment increases or decreases the setpoint relative to the last sensed value before the start of the DR event. This guarantees that HVAC systems can adjust their operation to achieve the new setpoint. The drawback is that you must check the high and low limit values against the new setpoint to ensure that the new setpoint is within an acceptable range.
For example, a relative setpoint adjustment action calls for increasing the zone temperature setpoint 3°F above the current actual zone temperature during the DR event. Further demand reduction will occur, since the system will not have to work as hard during the DR event to maintain the new setpoint.
NOTE: The ADR Client application can only command control points with absolute values. If you want to perform relative adjustment to setpoints, calculation of the new control setpoint and execution of the control strategies must be programmed and executed at the field panel level controller.
Factors Affecting DR Potential The following factors, with examples, affect the effectiveness of DR control strategies and should be considered when selecting and executing DR control strategies.
Outside Weather Extreme outside weather conditions can directly impact the effectiveness of DR control strategies, especially when the strategies are related to changing zone temperature setpoints. For example, at midday during peak summer months—when the outside temperature is high—an HVAC system might have already been operating at full capacity and may be unable to maintain the proper cooling setpoint temperature.
In addition, the zone’s actual temperature could already be at or above the zone setpoint temperature determined by the DR control strategy. In such a scenario, the DR control strategy of raising the zone setpoint temperature will be ineffective, resulting in zero additional kW reduction.
Chapter 3 – Demand Response Strategies
Siemens Industry, Inc. 17
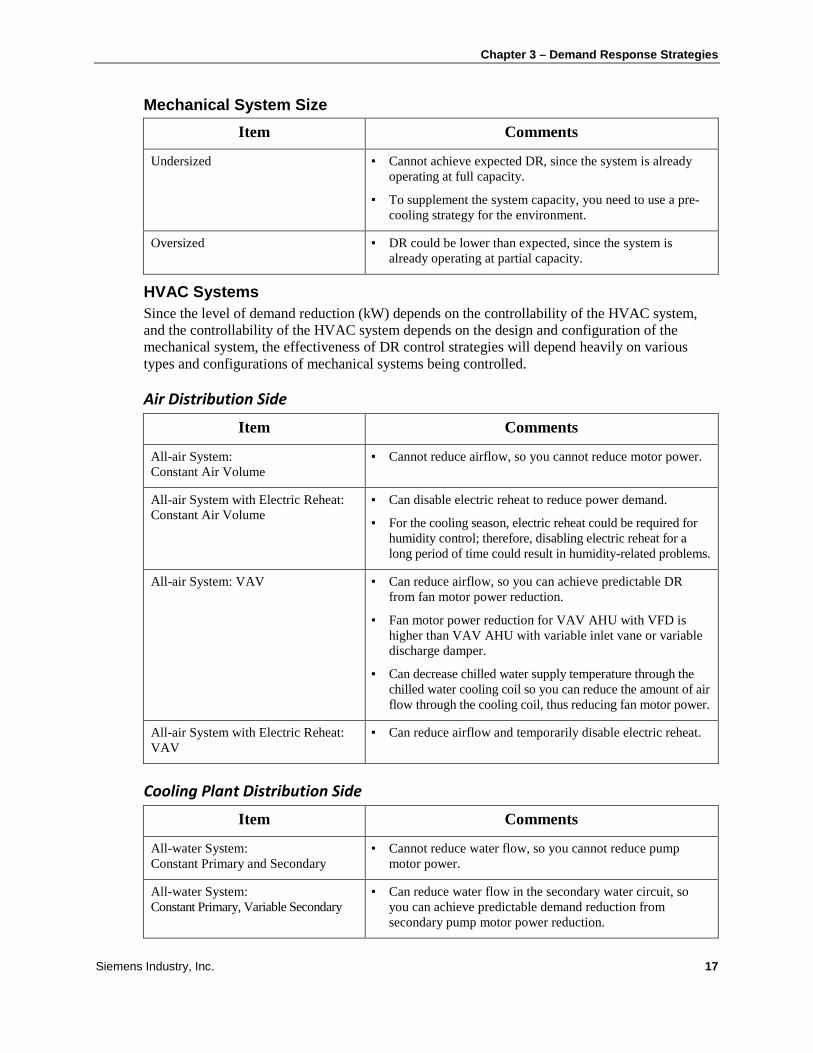
Mechanical System Size Item Comments
Undersized ▪ Cannot achieve expected DR, since the system is already operating at full capacity.
▪ To supplement the system capacity, you need to use a pre-cooling strategy for the environment.
Oversized ▪ DR could be lower than expected, since the system is already operating at partial capacity.
HVAC Systems Since the level of demand reduction (kW) depends on the controllability of the HVAC system, and the controllability of the HVAC system depends on the design and configuration of the mechanical system, the effectiveness of DR control strategies will depend heavily on various types and configurations of mechanical systems being controlled.
Air Distribution Side
Item Comments
All-air System: Constant Air Volume
▪ Cannot reduce airflow, so you cannot reduce motor power.
All-air System with Electric Reheat: Constant Air Volume
▪ Can disable electric reheat to reduce power demand.
▪ For the cooling season, electric reheat could be required for humidity control; therefore, disabling electric reheat for a long period of time could result in humidity-related problems.
All-air System: VAV ▪ Can reduce airflow, so you can achieve predictable DR from fan motor power reduction.
▪ Fan motor power reduction for VAV AHU with VFD is higher than VAV AHU with variable inlet vane or variable discharge damper.
▪ Can decrease chilled water supply temperature through the chilled water cooling coil so you can reduce the amount of air flow through the cooling coil, thus reducing fan motor power.
All-air System with Electric Reheat: VAV
▪ Can reduce airflow and temporarily disable electric reheat.
Cooling Plant Distribution Side
Item Comments
All-water System: Constant Primary and Secondary
▪ Cannot reduce water flow, so you cannot reduce pump motor power.
All-water System: Constant Primary, Variable Secondary
▪ Can reduce water flow in the secondary water circuit, so you can achieve predictable demand reduction from secondary pump motor power reduction.

Automated Demand Response Using OpenADR Application Guide
18 Siemens Industry, Inc.
Item Comments
All-water System: Variable Primary and Secondary
▪ Can reduce water flow in primary and secondary water circuits, so you can achieve predictable demand reduction from primary and secondary pump motor power reduction.
All-refrigerant System: Variable Refrigerant
▪ Can reduce refrigerant flow, so you can achieve predictable demand reduction from compressor motor power reduction.
Plant Equipment
Item Comments
Multi-stage Reciprocating Chiller ▪ Can reduce compressor stage, so you can achieve predictable demand reduction from compressor motor power reduction.
Electric Centrifugal Chiller with Variable Speed Drive
▪ Can reduce compressor speed, so you can achieve predictable demand reduction from compressor motor power reduction.
▪ Compressor motor power reduction of centrifugal chiller with VFD is higher than that of chiller with compressor inlet vane control.
Multiple Chillers ▪ Can turn off one of multiple online chillers.
▪ Implement cooling plant optimization programs, such as CPOP.
Absorption Chiller ▪ The absorption chiller is driven by a source of energy besides electricity, so turning on an absorption chiller can help reduce compressor power demand of the electrical centrifugal chiller while maintaining continuous plant cooling capacity.
Cooling Plant Heat Rejection Side
Item Comments
Air-cooled: Multi-stage and Variable Speed Fans
▪ The fan motor power reduction of an air-cooled condensing unit with a variable speed fan is higher than that of one with a single- or multi-stage fan.
Water-cooled: Multi-stage and Variable Speed Fans
▪ The fan motor power reduction of a water-cooled cooling tower with a variable speed fan is higher than that of one with a single- or multi-stage fan.
Thermal and Electrical Storage Systems You can use chilled water or ice thermal storage systems to provide cooling during DR events. During the night when electricity is cheaper, you can produce chilled water and ice; then, on the day of the DR event, you can lock out the electrical chillers and discharge the storage system to provide the needed cooling capacity.
Lighting Systems Lighting systems with dimming control are highly effective for DR purposes. Dimming the lighting level can result in an instantaneous power demand reduction while still maintaining the lighting level required for performing tasks and maintaining the safety and security of building occupants.

Chapter 3 – Demand Response Strategies
Siemens Industry, Inc. 19
Methods of Executing DR Control Strategies You can execute DR control strategies manually, semi-automatically, or automatically.
• Manual. Actions involve labor-intensive approaches to manually turning equipment off and on, and changing setpoints of control parameters.
• Semi-automatic. Actions involve preprogrammed control strategies that are carried out by building operators, typically through centralized building automation and control systems.
• Automatic. Actions do not need human intervention but are executed automatically by building automation and control systems upon receipt of DR event signals. When used with the ADR Client application, an APOGEE building automation and control system can automatically execute DR control strategies.
Return to Normal Strategies At the end of a DR event, the systems under DR control strategies must be returned to their normal conditions, which should be clearly defined and accepted by the building operators. For example, if a DR strategy is zone temperature adjustment, at the end of the DR event, the zone temperature should be returned to the last zone setpoint value before the DR event started, not the default value.
For an HVAC system, returning the building to normal operation could suddenly increase the cooling requirement, which would cause a sudden spike in electrical demand. To minimize this “rebound” effect, you should have strategies to gradually return the system to normal operation. This could be done by gradually and systematically returning different parts of buildings and systems to normal operation with some time delay in between. Rebounding control strategies can also incorporate a ramp-up period to gradually ramp-up the fan, pump, and compressor motors.
If DR strategies involve shutting down major HVAC equipment, such as a chiller or a boiler, you must carry out proper start-up sequences to ensure that equipment is starting up in the right order with the appropriate time delay, and thoroughly check all safety parameters before starting up such major equipment.
Sample Return to Normal Strategies • Slow Recovery. This slowly recovers the target parameters that were controlled during the
DR event. To bring setpoints back to normal operation, change the setpoints gradually over time or in small, step-by-step increments over a long time period.
• Sequential Equipment Recovery. If many pieces of equipment are controlled by DR strategies, you should restore the original control setpoints for each piece of equipment one-by-one at specified time intervals.
• Extended DR Control Period. To avoid a rebound peak, extend the DR control beyond the DR event end time, or until the end of building’s occupancy schedule.
Common DR Control Strategies The DR control strategies described here represent commonly-used DR control actions in typical commercial office buildings and are compiled from various research reports; in particular, those produced by the DDRC at LBNL.
NOTE: This is not an exhaustive list of strategies. If needed, you should determine other DR strategies that could better suit your needs, the buildings, and the HVAC systems that you want to control.
Automated Demand Response Using OpenADR Application Guide
20 Siemens Industry, Inc.
NOTE: The order of the strategies listed here does not indicate any preference.
Strategy 1: Adjusting the Zone Temperature This DR strategy is one of the best for gradually entering and exiting from DR events, as it ensures that HVAC and plant equipment will unload and reload in a smooth, continuous, and automatic fashion. For example, if zone cooling setpoint temperatures are increased globally throughout a facility when a DR event occurs, power demand will instantly be reduced because the zone’s cooling requirement will instantly be reduced.
This instant reduction in the source cooling load will immediately cause a reduction in the air handler fan, reducing the fan power demand, which in turn reduces the thermal load on the cooling coils, which then reduces the loading on the chiller(s), distribution chilled water pumps, and cooling tower pumps and fans. The result of these activities lets you automatically reduce the power demand for chilled water pumps, chiller compressors, and cooling tower fans in a smooth, continuous way.
While this DR strategy is relatively easy to implement, it doesn’t provide a high level of certainty in predicting the level of actual power demand (kW) reduction because the temperature used as the basis for estimating the reduction during a previous field test of the strategy could be different than the current actual temperature.
For example, if the normal zone temperature setpoint is 72°F and a DR event occurs in the middle of the summer in hot outside air conditions, and the DR control strategy calls for an increase of 3°F during the DR event, increasing the zone temperature setpoint from 72°F to 75°F would result in a power demand (kW) reduction of fan motors, pump motors, chiller compressors, and cooling tower fan motors. However, the potential reduction would only be effective if the actual temperature in the zone before the adjustment is 72°F or lower. If the actual temperature is already at 75°F, then increasing the setpoint to 75°F will result in no additional power demand reduction. In this example, it would be better to use outside air temperature as a basis for estimating the electric demand reduction from adjusting space temperature setpoints, and to perform multiple field tests to measure the demand reduction at various outside air temperatures.
Applying this control strategy to an undersized HVAC system also involves uncertainty because the system may already be running at full capacity and unable to maintain the designated setpoint, or the actual zone temperature may already be at the level determined by this strategy, which would result in no demand reduction.
A similar but opposite logic applies to zones in an electric heating mode application. That is, a suitable DR strategy for reducing electrical demand when zones are in a heating mode would be to lower space temperature setpoints.
Prerequisite The control system is capable of commanding global or individual zone temperature setpoints.
DR Event Notification Timing Day-Of
Estimation of Demand (kW) Reduction It may be difficult to calculate expected power demand reduction from this DR strategy without actual field experiments, or using building and energy simulation models to estimate the power demand reduction.
To identify potential demand reduction, it may be helpful to refer to International Performance Measurement & Verification Protocol: Concepts and Options for Determining Energy and Water

Chapter 3 – Demand Response Strategies
Siemens Industry, Inc. 21
Savings Volume I, “Option A: Retrofit Isolation with Key Parameter Measurement”8
For example, take a spot measurement of power (kW) on a hot summer day when the majority of room temperature setpoints are at the same level, and the majority of actual room temperatures are at or close to the setpoint. Then, raise the room temperature setpoint by 3°F. Once the setpoint is reached, take another spot measurement. For the cooling season, you can use the reduction of power from setpoint changes for future DR estimation, which can be expressed as kW reduction per degree of increasing setpoint per square foot of occupied space (kW/F/sq.ft).
. This option is based on a combination of measured and estimated factors. Measurements are spot or short-term and are taken at the whole building level.
Offset Time For a large HVAC system, it could take 15 to 30 minutes to achieve the expected power demand reduction from fan motors, pump motors, chiller compressors, and cooling tower fans due to the thermal “flywheel effect”. So, execute this strategy 15 to 30 minutes before the DR event start time. This will be referred to as “offset time” throughout this guide.
Sequence of Operation Acceptable range for the zone temperature setpoint:
• Cooling season: 72 to 78°F • Heating season: 62 to 72°F
Absolute setpoint adjustment:
• Moderate DR operation mode (offset time: 15 minutes): − Cooling season: Set the zone temperature setpoint to 75°F
− Heating season: Set the zone temperature setpoint to 69°F
• High DR operation mode: (offset time: 15 minutes) − Cooling season: Set the zone temperature setpoint to 78°F
− Heating season: Set the zone temperature setpoint to 66°F
Relative setpoint adjustment:
• Moderate DR operation mode (offset time: 15 minutes): − Cooling season: Increase the zone temperature setpoint by 3°F
− Heating season: Decrease the zone temperature setpoint by 3°F
• High DR operation mode (offset time: 15 minutes): − Cooling season: Increase the zone temperature setpoint by 6°F
− Heating season: Decrease the zone temperature setpoint by 6°F
Indoor Environmental Quality Impact In a cooling mode application when this DR strategy is executed, occupants could feel some discomfort due to the rise in zone temperature; therefore, they must be notified about the cause and underlying reasons. If the zone temperature reaches an intolerable level, you may have to cancel the DR control actions and forfeit the financial benefit of opting-in to the DR event. You
8 International Performance Measurement & Verification Protocol Committee. International Performance Measurement & Verification Protocol: Concepts and Options for Determining Energy and Water Savings Volume I. 2002. Efficiency Valuation Organization, DOE/GO-102002-1554.
Automated Demand Response Using OpenADR Application Guide
22 Siemens Industry, Inc.
should establish and strictly follow standard operating procedures for canceling DR control actions after the event has already been opted-in.
During the DR event, it’s also possible that the building may be unable to comply with ASHRAE Standard 55 Paragraph 5.2.5.29
Measurement and Verification
, because the temperature drift rate would be shorter than what is required.
Measure the demand (kW) at the building level to verify the demand reduction. Calculate the reduction based on the actual measurement and the baseline number, as defined in the DR contract.
Return to Normal Strategy To prevent a sudden surge in cooling demand at the end of the DR event, if you can’t postpone normal operation until the end of the occupied period, you should incrementally decrease the cooling temperature setpoint over time (for example, 30 minutes) to allow the HVAC system to properly ramp up.
Strategy 2: Decreasing the Duct Static Pressure Setpoint
CAUTION: Do not use this strategy if the air distribution system is improperly balanced.
NOTE: This strategy can be accomplished simply by increasing (for zones in cooling mode) or lowering (for zones in heating mode) the space temperature setpoints.
In a VAV air distribution system, a VAV AHU responds to changes in heating and cooling loads by reducing the amount of conditioned air flowing to the space. You can manipulate the amount of air by controlling the duct static pressure, which reduces the air volume, which in turn reduces the fan motor power. The amount of fan motor power demand reduction will be greater if the fan motor is equipped with a VFD controller.
It is necessary to verify that all VAV boxes are functioning properly at the current static pressure setpoint. If the current static pressure setpoint is already at a higher level than necessary, decreasing the static pressure setpoint will reduce fan power demand without causing discomfort for occupants. If the current static pressure setpoint is already at the proper level, decreasing it will cause some zones to starve for airflow because the reduction will not be shared evenly between all VAV terminal boxes. The zones that require most amount of air will be the ones whose airflow will immediately decrease, creating hot spots that might be intolerable to building occupants.
Prerequisites • VAV air distribution system
• VAV AHU (most effective if equipped with a VFD controller)
• Duct static pressure sensor
• All VAV boxes are operating properly at the current static pressure setpoint under normal conditions.
• The control system is capable of commanding a static pressure setpoint.
9 American Society of Heating, Refrigerating and Air-Conditioning Engineers, Inc. ASHRAE Standard 55-2004: Thermal Environmental Conditions for Human Occupancy. 2004. ISBN 1041-2336.

Chapter 3 – Demand Response Strategies
Siemens Industry, Inc. 23
DR Event Notification Timing Day-Of
Estimation of Demand (kW) Reduction Use fan laws to estimate (approximate) the demand reduction. To approximate the percentage of kW reduction, use the following equation.
NOTE: This equation is only an approximation, since the static pressures referred to in the calculation technically should be taken across the fan (fan discharge minus fan suction static pressure), and not 2/3 of the way down the duct, as is typically located for fan static pressure control.
1001%2/3
1
2 ×
−=
SPSPeductionRkW
where:
• SP2: New static pressure setpoint • SP1: Current static pressure setpoint
Then, calculate the demand (kW) reduction by multiplying the fan motor power rating (full load kW/BHP) by the results of the above equation.
Offset Time A reduction in the duct static pressure setpoint for a VAV fan should show an almost immediate effect on the reduction of fan power, since there is very little thermal capacitance in a fan static pressure control loop. A VAV fan static pressure loop is a fast-acting loop.
Sequence of Operation For each air-duct system, check the as-built drawings and sequence operations for the acceptable duct static pressure setpoint.
Absolute setpoint adjustment:
• Moderate DR operation mode (offset time: 0 minute): Set the new static pressure setpoint 10% lower than the operating static pressure setpoint.
• High DR operation mode: (offset time: 0 minute): Set the new static pressure setpoint 20% lower than the operating static pressure setpoint.
Relative setpoint adjustment:
• Moderate DR operation mode (offset time: 0 minute): Decrease the static pressure setpoint by 10% from the current static pressure setpoint.
• High DR operation mode: (offset time: 0 minute): Decrease the static pressure setpoint by 20% from the current static pressure setpoint.
Indoor Environmental Quality Impact When you reduce the amount of cool air supplied to each zone, some zones may experience decreased air flow, which might be intolerable to building occupants. Ventilation rates in certain zones could drop below the required level.
Automated Demand Response Using OpenADR Application Guide
24 Siemens Industry, Inc.
Measurement and Verification Measure the demand (kW) at the fan motor to verify the demand reduction.
Return to Normal Strategy To prevent a sudden surge in fan power at the end of the DR event, set back the duct static pressure setpoint one fan at a time, with a few minutes’ time delay between each.
Strategy 3: Increasing the Supply Air Temperature NOTE: This strategy can be accomplished simply by increasing (for zones in cooling mode) or
lowering (for zones in heating mode) the space temperature setpoints.
Increasing the cooling supply air temperature setpoint will reduce the chilled water flow requirement through the cooling coil, resulting in a reduced electrical demand for secondary chilled water pumps and compressor motors. This strategy works best when combined with Strategy 1: Adjusting the Zone Temperature.
CAUTION: In variable-speed CHW plants, it’s best to lower the supply air temperature setpoint due to the interaction (coupling) of the power performance chiller with the CHW distribution pumps and air handler fans.
If the zone temperature is not adjusted to a higher setpoint value, or if the fan speed is not locked in position before executing this strategy, this strategy may cause an increase in AHU fan motor power. This is caused by VAV boxes calling for increased air to maintain the current zone temperature setpoint in order to compensate for the higher temperature of supply air, and the VAV AHU will increase the fan motor speed to provide more air, resulting in an increase in fan motor power.
For an air distribution system with electric reheat, increasing the zone supply air temperature will also reduce electrical demand of electric reheat coils.
Prerequisite The control system is capable of commanding a global supply air temperature setpoint or individual supply air temperature setpoint.
DR Event Notification Timing Day-Of
Estimation of Demand (kW) Reduction Similar to Strategy 1: Adjusting the Zone Temperature, it could be difficult to calculate the expected power demand reduction from this DR strategy. You may need to experiment with different levels of supply air temperature increase to determine a proper level of increase and expected power demand reduction.
Offset Time For large HVAC systems, it could take 15 to 30 minutes to achieve the expected power demand reduction from pump motors, chiller compressors, and cooling tower fans. So, execute this strategy 15 to 30 minutes before the DR event start time.
Sequence of Operation Acceptable supply air temperature setpoint range:
• Cooling season: 45 to 60°F (55°F is a typical setpoint) • Heating season: 100 to 125°F

Chapter 3 – Demand Response Strategies
Siemens Industry, Inc. 25
Absolute setpoint adjustment:
• Moderate DR operation mode (offset time: 15 minutes): − Cooling season: Set the supply air temperature setpoint to 57°F
− Heating season: Set the supply air temperature setpoint 120°F
• High DR operation mode (offset time: 15 minutes): − Cooling season: Set the supply air temperature setpoint to 58.5°F
− Heating season: Set the supply air temperature setpoint to 100°F
Relative setpoint adjustment:
• Moderate DR operation mode (offset time: 15 minutes): − Cooling season: Increase the supply air temperature setpoint by 2°F
− Heating season: Decrease the supply air temperature setpoint by 5°F
• High DR operation mode (offset time: 15 minutes): − Cooling season: Increase the supply air temperature setpoint by 3.5°F
− Heating season: Decrease the supply air temperature setpoint by 10°F
Indoor Environmental Quality Impact Since the burden of this DR strategy will not be shared equally among all zones, zones at the end of the duct run will most likely lack cool air, and the zone temperature could rise above the setpoint, causing discomfort to building occupants.
Measurement and Verification Measure the demand (kW) at the building level to verify the demand reduction. Calculate the reduction based on the actual measurement and the baseline number, as defined in the DR contract.
Return to Normal Strategy To prevent a sudden surge in cooling demand at the end of DR event, decrease (for cooling mode applications) or increase (for heating mode applications) the supply air temperature setpoint—in incremental steps over time (for example, 30 minutes)—to the level before the DR event to allow the HVAC system to properly ramp up.
Strategy 4: Limiting the Fan VFD NOTE: This strategy can be accomplished simply by increasing (for zones in cooling mode) or
lowering (for zones in heating mode) the space temperature setpoints.
This strategy limits the speed of the VAV AHU fan to a certain level during the DR event, restricting the air volume, which in turn restricts the fan power demand to a limited level. It will only work if the current fan speed limit is already higher than the restricted speed limit. For example, if the fan is already operating at 100%, restricting the fan speed to 75% will result in demand reduction. However, if the fan is only operating at 60%, restricting the fan speed to 75% will result in no further electrical demand reduction.
When the fan volume is restricted and the zone temperature setpoint is not adjusted higher, or allowed to float to a higher zone temperature level, the air distribution system will try to compensate by requesting more chilled water to the coil. For a chilled water distribution system with a variable secondary chilled water distribution system, you should also restrict the secondary

Automated Demand Response Using OpenADR Application Guide
26 Siemens Industry, Inc.
chilled water system flow to the level before the DR event—this prevents an increase in secondary chilled water pump power, which could eliminate the decrease in fan motor power demand.
Prerequisites • VAV air distribution system with a VAV AHU equipped with a VFD controller.
• The controller can restrict the maximum speed of the fan through the VFD controller.
DR Event Notification Timing Day-Of
Estimation of Demand (kW) Reduction Use fan laws to estimate (approximate) the demand reduction. To approximate the percentage of kW reduction, use the following equation.
1001%3
1
2 ×
−=
RPMRPMeductionRkW
where:
• RPM2: New speed • RPM1: Current speed
Then, calculate the demand (kW) reduction by multiplying the fan motor power rating (full load kW/BHP) by the result of the above equation.
Offset Time For a VAV distribution system, reduction in fan speed will result in instantaneous fan power reduction. However, it could take 10 to 30 minutes to achieve additional power demand reduction from the central cooling plant equipment.
Sequence of Operation Absolute adjustment:
• Moderate DR operation mode (offset time: 10 minutes): Restrict the fan speed to 80%.
• High DR operation mode (offset time: 10 minutes): Restrict the fan speed to 70%.
Relative adjustment:
• Moderate DR operation mode (offset time: 15 minutes): Reduce the fan speed 20% from the fan speed before the DR event starts.
• High DR operation mode (offset time: 15 minutes): Reduce the fan speed 30% from the fan speed before the DR event starts.
Indoor Environmental Quality Impact Since air reduction will not be shared equally among all zones, some zones will have low air supply and may drop below an acceptable level.
Measurement and Verification Measure the demand (kW) at the fan motor to verify the demand reduction.

Chapter 3 – Demand Response Strategies
Siemens Industry, Inc. 27
Return to Normal Strategy To prevent a sudden surge in fan power at the end of the DR event, set the maximum fan speed back to the normal level one fan at a time, with a few minutes’ time delay between each fan.
Strategy 5: Increasing the Chilled Water Supply Temperature Setpoint Increasing the chilled water discharge temperature increases the chiller’s operating efficiency, which reduces the chiller compressor power.
For HVAC systems with VAV air distribution and variable secondary chilled water distribution systems, when the chilled water supply temperature increases, the supply air temperature could increase. The VAV boxes will request increased air to meet the cooling load requirement of the zones, thus causing an increase in fan speed. The chilled water coil at the AHU will request increased chilled water flow to the cooling coil to meet the load, thus causing an increase in secondary pump speed.
If you do not restrict fan and pump motor speeds, the reduction in chiller compressor power demand may be outweighed by electrical power demand increase from the fan and pump motors.
Prerequisite The controller must be capable of controlling the supply chilled water temperature setpoint.
DR Event Notification Timing Day-Of
Estimation of Demand (kW) Reduction It could be difficult to calculate the expected power demand reduction from this strategy. Consult the chiller manufacturer’s performance curve to estimate the efficiency improvement. You may also need to experiment with different levels of chilled water discharge temperature to determine a proper level of increase and expected power demand reduction.
Offset Time For a constant primary with variable secondary chilled water and VAV distribution systems, it may take 15 to 30 minutes to achieve the expected chiller compressor motor power demand reduction. So, execute this strategy at least 30 minutes before the DR event start time.
Sequence of Operation Acceptable chilled water discharge temperature setpoint: 45 to 50°F
Absolute adjustment:
• Moderate DR operation mode (offset time: 15 minutes): Set the chilled water discharge temperature to 47°F.
• High DR operation mode (offset time: 15 minutes): Set the chilled water discharge temperature setpoint to 48.5°F.
Relative adjustment:
• Moderate DR operation mode (offset time: 15 minutes): Increase chilled water temperature discharge temperature by 2°F.
• High DR operation mode (offset time: 15 minutes): Increase chilled water temperature discharge temperature by 3.5°F.
Automated Demand Response Using OpenADR Application Guide
28 Siemens Industry, Inc.
Indoor Environmental Quality Impact Zone temperatures may rise above acceptable levels if AHUs are unable to handle the zone cooling load with a higher supply chilled water temperature. This could be intolerable to building occupants.
Measurement and Verification Measure the demand (kW) at the building level to verify the demand reduction. Calculate the reduction based on the actual measurement and the baseline number, as defined in the DR contract.
Return to Normal Strategy To prevent a sudden surge in chiller compressor motor power at the end of the DR event, slowly decrease the chilled water discharge temperature to the normal operating level.
Strategy 6: Limiting the Chilled Water Cooling Valve Position Restricting the opening of a chilled water cooling valve will reduce the chilled water flow through the cooling coil at the AHU, which reduces the electrical power demand of secondary chilled water pumps and chiller compressor motor power. When this happens, the supply air temperature rises above typical operating levels. For VAV air distribution systems, VAV boxes compensate by requesting increased airflow to maintain the zone temperature setpoint, causing increased fan motor speed and electrical power demand. If you do not also restrict the fan motor speed, the reduction in chiller compressor motor power demand may be outweighed by the increase in the fan motor electrical power demand.
Prerequisites • Air-handling unit with chilled water cooling coil
• Variable secondary chilled water distribution system
• The controller can limit the chilled water valve opening.
DR Event Notification Timing Day-Of
Estimation of Demand (kW) Reduction It may be difficult to calculate the expected power demand reduction from this strategy. Experiment with different levels of chilled water valve openings in combination with limiting the fan motor speed to determine a proper level of valve opening restriction and expected power demand reduction.
Offset Time It may take 15 to 30 minutes to achieve the expected chiller compressor motor power demand reduction. So, execute this strategy at least 15 minutes before the DR event start time.
Sequence of Operation Absolute adjustment:
• Moderate DR operation mode (offset time: 15 minutes): Limit the cooling valve position to 80% open.
• High DR operation mode (offset time: 15 minutes): Limit the cooling valve position to 70% open.
Relative adjustment:
• Moderate DR operation mode (offset time: 15 minutes):

Chapter 3 – Demand Response Strategies
Siemens Industry, Inc. 29
Limit the cooling valve position to 20% lower than the valve position at the start of the DR strategy execution.
• High DR operation mode (offset time: 15 minutes): Limit the cooling valve position to 30% lower than the valve position at the start of the DR strategy execution.
Indoor Environmental Quality Impact Zone temperatures can rise above acceptable levels if AHUs are unable to handle the zone cooling load, which might be intolerable to building occupants.
Measurement and Verification Measure the demand (kW) at the building level to verify the demand reduction. Calculate the reduction based on the actual measurement and the baseline number, as defined in the DR contract.
Return to Normal Strategy To prevent a sudden surge in pump and chiller compressor power at the end of DR event, lift the restrictions of chilled water valves one at a time.
Strategy 7: Restricting Chiller Operation For a cooling plant with multiple chillers, it’s more energy efficient to operate only a few chillers at a high part load ratio than operating all chillers at a low part load ratio. At design time, safety factors are typically added to the cooling load requirement to meet the cooling plant capacity requirement. In addition, selected chillers are typically sized larger than the design cooling load, as chillers are only available in a limited number of sizes. So, the cooling plant capacity can be 10 to 30 percent larger than the actual cooling requirement.
For example, a 1,500-ton cooling with three 500-ton centrifugal chillers can handle a maximum design cooling load of 1,200 tons. If the cooling load during the DR event day is expected to reach 900 tons, running two chillers at 450 tons each (90% part load) will consume less energy and electrical power demand than running three chillers at 300 tons (60% part load). In this example, restricting the least efficient chiller from being turned on during the DR event could reduce electrical demand.
By restricting some chillers from being turned on, the central cooling plant may be unable to maintain the chilled water supply temperature setpoint. For HVAC systems with constant primary and variable secondary chilled water distribution systems, it may be necessary to also restrict the pump speed of the secondary chilled water pumps. Otherwise, the increase in secondary chilled water pump electrical power demand may outweigh the decrease in chiller compressor motor power.
Prerequisites • A central cooling plant composed of two or more chillers
• The control system is capable of restricting chillers from being turned on (enable/disable chiller start-up).
DR Event Notification Timing Day-Of, Day-Ahead
Estimation of Demand (kW) Reduction To understand the chiller power demand profile under different part load ratios, sub-meter each chiller. Use sub-meter data for estimating power demand reduction from the actual plant load during the DR event.

Automated Demand Response Using OpenADR Application Guide
30 Siemens Industry, Inc.
Offset Time Execute this strategy at least 30 minutes before the DR event start time.
Sequence of Operation Absolute adjustment:
• Moderate and High DR operation modes (offset time: 30 minutes): − If all chillers are equal size:
1. Determine the least efficient chiller.
2. Restrict the chiller from being turned on.
3. Restrict the speed of the secondary chilled water pump to the level before the DR event.
− If chillers are different sizes:
1. Determine the largest size chiller that will not be needed during the DR event.
2. Restrict that particular chiller from being turned on.
3. Restrict the speed of the secondary chilled water pump to the level before the DR event.
Indoor Environmental Quality Impact Zone temperatures can rise above acceptable levels if AHUs are unable to maintain the supply air temperature because the cooling plant capacity is restricted, which might be intolerable to building occupants.
Measurement and Verification Measure the demand (kW) at the chiller and at the cooling plant level to verify the demand reduction. Calculate the reduction based on the actual measurement and the baseline number, as defined in the DR contract.
Return to Normal Strategy To prevent sudden surge in secondary chilled water pump and chiller compressor motor power at the end of DR event, wait until after the end of the DR event to turn on the restricted chiller.
Strategy 8: Dimming the Lighting Level Dimming the lighting level is an effective DR strategy for reducing electrical power demand, especially when used in combination with a light level sensor, since the light can be dimmed to the lowest level possible without impacting the visual comfort, safety, and security of the occupants in the zone.
You can dim lighting levels using dimmable ballasts. There are two methods available in typical commercial office buildings: stepped-dimming and continuous dimming.
• Stepped-dimming. Accomplished by switching on or off one of two (bi-level), or one or more of three (tri-level), lamps.
• Continuous Dimming. Accomplished by gradually reduced the lighting level without attracting the notice of building occupants.
When the lighting level is already controlled by the lighting level sensor and dimmable ballast control, an absolute lighting level adjustment may result in a higher in electrical demand if the

Chapter 3 – Demand Response Strategies
Siemens Industry, Inc. 31
adjusted lighting level is already below the current lighting level. Adjusting the relative lighting level before the DR event start time will ensure the desired level of demand reduction during the DR event.
Prerequisites • Lighting circuits and/or lighting fixtures are equipped with dimming capability, such as a
dimmable ballast control.
• The control system is integrated with the lighting controller.
• (Optional) Lighting level sensors (photo sensors)
DR Event Notification Timing Day-Of
Estimation of Demand (kW) Reduction Calculate the reduction in electricity demand from the percentage of lighting level reduction.
Offset Time Even though you can set the dimming level for an immediate demand reduction effect, you should gradually dim the light to avoid startling the building occupants. Gradually reduce the lighting level 5 to 15 minutes before the DR event start time.
Sequence of Operation Absolute adjustment:
• Moderate DR operation mode (offset time: 5 minutes): Dim the light to 75% of the normal lighting level.
• High DR operation mode (offset time: 5 minutes): Dim the light to 60% of the normal lighting level.
Relative adjustment:
• Moderate DR operation mode (offset time: 5 minutes): Dim the light 25% from the level before the DR event started.
• High DR operation mode (offset time: 5 minutes): Dim the light 40% from the level before the DR event started.
Indoor Environmental Quality Impact Do not reduce the lighting level to a level that will impact the visual, safety, and security of building occupants. If possible, gradually dim the light.
Measurement and Verification Measure the demand (kW) at the lighting circuit level to verify the demand reduction. Calculate the reduction based on the actual measurement and the baseline number, as defined in the DR contract.
Return to Normal Strategy Gradually increase the lighting level to avoid startling building occupants.
Strategy 9: Turning Off Lights Turning off lights is an effective strategy to achieve instantaneous and predictable demand reduction. During a typical peak summer day when daylight is in abundance, turning off lights in

Automated Demand Response Using OpenADR Application Guide
32 Siemens Industry, Inc.
selected areas will instantly reduce demand without impacting the indoor environmental quality. Because lighting generates heat, cooling requirements are also reduced. However, during the heating season, this will increase the heating requirements.
Implementing this strategy is limited by the physical configuration of the lighting circuits and control capabilities. Following are some sample strategies:
• Zone Switching. Turns off lights by zone. This strategy is suitable for common spaces, such as lobbies, corridors, and cafeterias, but not as suitable for open office spaces, as it may cause disruption without enough daylight.
• Lamp Switching. Turns off each fixture individually. This strategy is dependent on switch and wiring configurations of lamp/ballast combinations.
Prerequisites • The control system is integrated with the lighting controller.
• Lighting circuits are configured in groups or individuals that can be turned on/off individually.
DR Event Notification Timing Day-Of
Estimation of Demand (kW) Reduction Calculate the reduction in demand by multiplying the number of lamps that can be turned off by their watt rating.
Offset Time While you can execute this strategy at the start of the DR event, it is recommended that you turn off lights 5 minutes before the DR event start time.
Sequence of Operation Absolute adjustment:
• Moderate and High DR operation mode (offset time: 5 minutes): − Use zone switching to turn off lights by zone.
− Use lamp switching to turn off each fixture individually.
Indoor Environmental Quality Impact When selecting which lights to turn off, consider occupant safety, how the spaces are used, and the possible effects on the occupants. Turning off lights is a visible strategy and should be done selectively and with care.
Measurement and Verification Measure the demand (kW) at the lighting circuit level to verify the demand reduction. Calculate the reduction based on the actual measurement and the baseline number, as defined in the DR contract.
Return to Normal Strategy Gradually turn on the light to avoid a demand spike.
Strategy 10: Pre-Cooling Buildings Use pre-cooling to cool building mass and use its thermal capacity to prolong the desired temperature setpoint, and to reduce occupants’ discomfort when you need to raise the temperature setpoint during the DR event. The pre-cooling period length depends on the building type and construction material.

Chapter 3 – Demand Response Strategies
Siemens Industry, Inc. 33
Use this strategy when the utility cost is low during off-peak periods (at night, for example), and there is no demand charge penalty to run the HVAC system to pre-cool the building.
NOTE: Some utilities might treat pre-cooling as a load shifting energy efficiency strategy instead of a demand reduction strategy, and therefore will not pay financial incentives for demand reduction resulting from pre-cooling.
DR Event Notification Timing Day-Ahead
Estimation of Demand (kW) Reduction See the estimation for Strategy 1: Adjusting the Zone Temperature.
Offset Time Execute this strategy well before the start of the DR event, and when the electricity cost is low.
Sequence of Operation Absolute adjustment:
• Moderate and High DR operation mode (offset time: 5 to 10 hours): − Set the zone temperature setpoint to 60°F during the unoccupied period and let the
cooling system operate for at least 5 to 10 hours, depending on the building construction type.
− When occupancy begins, gradually raise the zone temperature setpoints from 60°F to the high comfort limit by the end of occupancy.
Indoor Environmental Quality Impact The strategy may cause occupant discomfort in the morning, when elements in the buildings are cool to the touch.
Measurement and Verification N/A
Return to Normal Strategy N/A
Automated Demand Response Using OpenADR Application Guide
34 Siemens Industry, Inc.
Chapter 4 – Typical Workflow for Implementing Demand Response Strategies
This chapter discusses the steps involved in planning, developing, and deploying DR control strategies.
NOTE: It’s assumed that you have already secured contracts to deploy DR control strategies. Therefore, steps related to the sales process are not covered here.
Steps for Implementing Strategies • Step 1: Assess utility/ISO DR programs and incentives
• Step 2: Conduct DR-ready audits
• Step 3: Select DR programs in which to participate
• Step 4: Identify DR control strategies and sequences of operation
• Step 5: Test and deploy selected DR control strategies
• Step 6: Develop performance measurement and verification reports
• Step 7: Develop standard operating procedures for DR participation
Step 1: Assess utility/ISO DR programs and incentives Key components in the adoption of DR programs are incentives offered by utilities to encourage participation in DR programs. As classified by the U.S. Department of Energy (DOE)10
• Price-based. Programs such as real-time pricing (RTP), critical-peak pricing (CPP), and time-of use (TOU) tariffs provide time-varying rates that reflect the value and cost of electricity in different time periods.
, there are two types of DR programs:
• Incentive-based. Programs are triggered by grid reliability problems or high electricity prices.
10 U.S. Department of Energy. Benefits of Demand Response in Electricity Markets and Recommendations for Achieving Them: A Report to the United States Congress Pursuant to Section 1252 of the Energy Policy Act of 2005. 2006.

Chapter 4 – Typical Workflow for Implementing Demand Response Strategies
Siemens Industry, Inc. 35
Incentives for Residential, Commercial, and Industrial Sectors.11
Commercial Sector Incentives
• Time-of-Use (TOU). Represents different pricing levels related to production costs and usually varies on an hourly basis. This method sets electricity prices for specific times in advance, allowing you to determine how to manage energy consumption around the set pricing periods.
• Critical-Peak-Pricing (CPP). Price responsive program that also falls under the TOU category. The CPP period typically occurs during a certain time on a peak day, usually in the middle of the day when the temperature is high. Electricity prices are dramatically higher at these times, and customers participating in DR programs are encouraged to shed or shift loads.
For example, Pacific Gas and Electric (PG&E) and Southern California Edison (SCE) offer Automated Critical Peak Pricing (Auto-CPP) programs, which are a form of price-responsive DR that automated DR for critical days as part of critical peak pricing tariffs12
NOTE: Currently, the ADR Client application only supports CPP.
. San Diego Gas & Electric (SDG&E) is considering offering a voluntary Automated Capacity Bidding Program, which is a form of reliability DR based on certain guaranteed monthly payments on an agreed level of bid load reduction at fixed price when requested.
Considerations When assessing various utility DR programs, consider the following:
• Minimum DR level required to participate in the program
• DR reduction level to guarantee monthly incentives when called upon (the higher the level of commitment, the higher the incentive)
11 Jevan Fox and Clint Wheelock. Demand Response Commercial, Industrial, and Residential Applications for Peak Demand Load Management. 2010. Pike Research Report. 12 Pacific Gas and Electric Company. Critical Peak Pricing Program Document. 2005. www.pge.com/tariffs/doc/E-CPP.doc.
Automated Demand Response Using OpenADR Application Guide
36 Siemens Industry, Inc.
• Qualified DR level during the DR event that will yield additional incentives
• Method used for determining the baseline for DR calculation
• Timing of DR event notification: Day-Ahead or Day-Of (hour-ahead)
• DR event length
• Likelihood and frequency of DR events; for example, summer heat waves, winter cold spells, unexpected large unit outages, difficulty managing systems, reliability of renewable generation capacity, etc.
• Penalties incurred if you:
− cannot meet the agreed-upon DR threshold levels
− decide to opt-out of the program when called upon
− decide to cancel DR operation in the middle of DR events, even after you’ve opted-in
• Mandatory or voluntary program participation
• Any other program qualifications or requirements, such as continuous Internet or email access
Step 2: Conduct DR-ready audits Conducting DR audits can involve collecting data from as-built drawings, design specifications, actual sequences of operation, and facility walk-throughs. Your audit team should visit the site to identify potential DR opportunities. During audits, inspect major HVAC system equipment to determine candidates for demand reduction. If possible, interview the facilities staff.
Pertinent information such as utility data, equipment schedules, actual system configurations, site limitations, and existing BAS system information should be collected first. Additional data you may want to collect includes nameplate information, start/stop schedules, configuration information, limitations, sequences of operation, equipment conditions, and other system operational characteristics. Appendix A – Sample Building Data for Deploying Demand Response Strategies provides sample building and system data that you should collect during audits. Appendix B – Sample Templates for Demand Response Audits includes sample templates that you can use to collect DR audit data.
At the end of DR audits, you should have enough building, systems, utility billing, energy usage, and demand data to identify demand reduction strategies. You should gauge the effort spent on DR audits against the potential size of demand reduction.
Technical Assistance Sponsorships In California, you may be able to take advantage of the technical assistance sponsorships offered by various utilities. For example, SDG&E has the Technical Assistance with Technology Incentives (TA-TI) program13
The TA portion of the TA-TI program provides SDG&E customers on-site facility evaluations ranging from simple site assessments to comprehensive engineering studies. The TI portion helps
—SDG&E may provide cash incentive payments for the installation of equipment or control software supporting DR. Through TA-TI, you can sign up for their Auto-DR program, which allows SDG&E to send you DR signals and implement load reductions automatically through your facility’s control system.
13 San Diego Gas & Electric. Technical Assistance and Technology Incentives Program Fact Sheet. 2011. http://sdge.com/documents/business/savings/tati/TATIFactSheet.pdf

Chapter 4 – Typical Workflow for Implementing Demand Response Strategies
Siemens Industry, Inc. 37
offset the installation and equipment cost of DR measures; technology incentives follow the completion of approved TA assessments and the identification of verifiable load reduction. The cost of installing, upgrading, or programming a BAS system so it automatically carries out DR control actions could potentially be paid partially or wholly by TI.
If you want to receive incentives, you can partner with or employ the Building Technologies Division of Siemens Industry, Inc. to assist in the demonstration and deployment of demand reduction capability and enroll in the SDG&E DR program.
Sub-Metering For sites with substantial amount of demand reduction potential, you may want to consider installing sub-metering devices on major systems including chillers, pumps, fans, and cooling towers, and trending electrical demand and energy usage. Sub-metering enables you to accurately estimate, verify, and validate actual demand reduction. For already-installed meters, collect information about brands, model numbers, meter types, accuracy, and communication protocol.
Step 3: Select DR programs in which to participate Availability of DR programs will vary among utilities. You should consider DR programs that offer fixed payments (when signing up for programs) and variable payments (resulting from achieving targeted DR). DR levels committed to as part of the DR programs must then be set to match actual system capabilities.
In California, all major utilities, including PG&E, SCE, and SDG&E, offer a variety of DR programs. Because DR programs may change, you must check with the utility companies for their current offerings.
Step 4: Identify DR control strategies and sequences of operation See Chapter 3 for commonly-used DR control strategies for HVAC and lighting systems.
Benchmarking, Simulation Models, and Field Tests At a high level, you can use benchmarking to determine potential DR levels. Electrical consumption data collected to date can be normalized and compared with benchmark data from respectable sources; for example, LBNL, DOE, etc.
For example, the following table shows normalized electrical demand data for buildings less than 200 kW peak load. If the normalized electrical demand of the building under audit is higher than the average benchmark data, potential to reduce electrical demand would be higher than when the normalized electrical demand is lower.

Automated Demand Response Using OpenADR Application Guide
38 Siemens Industry, Inc.
Market Segmentation for Buildings Less Than
200 kW Peak Load.14
For a more sophisticated approach, you can set up building models to simulate various DR control strategies. For example, see EnergyPlus Run Time Analysis
15
However, for practical purposes, a faster and cheaper method to assess potential DR control strategies is to conduct field tests under simulated DR events.
, which discusses using EnergyPlus for runtime analysis. You can use the same EnergyPlus simulation approach to evaluate and assess DR capability.
Sample DR Control Strategies The following tables show various sample DR control strategies for the cooling season, organized by DR event length and the DR event notification timing. As mentioned in Chapter 3, the strategies shown here are not exhaustive lists.
DR Event Length: Less than 1 to 4 hours
DR Event Notification Timing
Less than 1 to 4 Hours
Greater than 4 but Less than 24 Hours
Greater than or Equal to 24 Hours
▪ Dim the lighting level. ▪ Turn off lights. ▪ Adjust the zone temperature. ▪ Decrease the duct static pressure setpoint. ▪ Limit the fan VFD.
▪ Pre-cool buildings. ▪ Dim the lighting level. ▪ Turn off lights. ▪ Adjust the zone temperature. ▪ Decrease the duct static pressure setpoint. ▪ Limit the fan VFD.
▪ Pre-cool buildings. ▪ Dim the lighting level. ▪ Turn off lights. ▪ Adjust the zone temperature. ▪ Decrease the duct static pressure setpoint. ▪ Limit the fan VFD. ▪ Charge and discharge the chilled water
storage system.
14 S. Kiliccote, M.A. Piette, J.H. Dudley, E. Koch, and D. Hennage. Open Automated Demand Response for Small Commercial Buildings. 2009. Lawrence Berkeley National Laboratory, Report #2195E. 15 Tianzhen Hong, Frederick Buhl, and Phil Haves. EnergyPlus Run Time Analysis. 2008. California Energy Commission, PIER Program, CEC-500-2008-094.

Chapter 4 – Typical Workflow for Implementing Demand Response Strategies
Siemens Industry, Inc. 39
DR Event Length: 1 to 2 hours
DR Event Notification Timing
Less than 1 to 4 Hours
Greater than 4 but Less than 24 Hours
Greater than or Equal to 24 Hours
▪ Previous section’s strategies, plus: ▪ Increase the supply air temperature. ▪ Restrict chiller operation. ▪ Increase the chilled water supply
temperature setpoint. ▪ Limit the chilled water cooling valve
position.
▪ Previous section’s strategies, plus: ▪ Increase the supply air temperature. ▪ Restrict chiller operation. ▪ Increase the chilled water supply
temperature setpoint. ▪ Limit the chilled water cooling valve
position.
▪ Previous section’s strategies, plus: ▪ Increase the supply air temperature. ▪ Restrict chiller operation. ▪ Increase the chilled water supply
temperature setpoint. ▪ Limit the chilled water cooling valve
position. ▪ Charge and discharge the ice storage
system.
DR Event Length: 2 to 3 hours
DR Event Notification Timing
Less than 1 to 4 Hours
Greater than 4 but Less than 24 Hours
Greater than or Equal to 24 Hours
▪ Previous section’s strategies, plus: ▪ Turn on backup generators.
▪ Previous section’s strategies, plus: ▪ Turn on backup generators.
▪ Same as previous section.
DR Event Length: 3 to 4 hours
DR Event Notification Timing
Less than 1 to 4 Hours
Greater than 4 but Less than 24 Hours
Greater than or Equal to 24 Hours
▪ Same as previous section.
Sample DR Strategy Selection Flowcharts Various research organizations and national laboratories have developed approaches to help with selecting DR strategies; following are two examples from the DRRC at the LBNL.

Automated Demand Response Using OpenADR Application Guide
40 Siemens Industry, Inc.
Example: Fully Automated DR Tests in Large Facilities.16
16 Mary Ann Piette, David S. Watson, Naoya Motegi, and Norman Bourassa. Findings from the 2004 Fully Automated Demand Response Tests in Large Facilities. 2005. Lawrence Berkeley National Laboratory, Report #58178.

Chapter 4 – Typical Workflow for Implementing Demand Response Strategies
Siemens Industry, Inc. 41
Example: Determining DR Lighting Control Strategies.17
Steps for Selecting DR Control Strategies
1. Develop an understanding of the DR program:
• DR event notification timing: Day-Ahead, Day-Of (hour ahead), Day-Of (minute ahead) • DR event length • DR level • Whether or not you can automate DR strategies in response to DR events • Season of occurrence and the frequency with which events are likely to occur
2. Identify equipment and devices that can and can’t be curtailed. For example, while you can curtail an AHU that supplies cold air to office areas, you can’t curtail cold air to labs and critical environmental areas.
3. To simplify DR estimating and verification, group equipment that can’t operate independently into equipment clusters. For example, you could group chillers, chilled water pumps, condenser water pumps, and cooling tower fans in a chilled water system equipment cluster.
4. Identify end-use loads that are discretionary services. These are the types of load that facilities can do without for a short period of time. For example, pool heating.
17 Naoya Motegi, Mary Ann Piette, David Watson, Sila Kiliccote, and Peng Xu. Introduction to Commercial Building Control Strategies and Techniques for Demand Response. 2007. Lawrence Berkeley National Laboratory, Report #59975.

Automated Demand Response Using OpenADR Application Guide
42 Siemens Industry, Inc.
5. Identify end-use loads that are flexible services. These are routine facility operations or services that can be shifted to another time period. For example, recharging batteries, charging electrical vehicles, etc.
6. Identify storage devices that can be used to supplement operations during the DR event. For example, charging chilled water storage tank or ice storage system at night and discharging them during the DR event.
7. To reduce electricity usage from the grid, identify on-site generation capability.
8. Identify all loads that can be reduced with target DR, and the devices and equipment needed to accomplish the DR. For each load, identify potential DR control strategies.
9. Select DR control strategies for each DR program in which you’ve elected to participate. For each selected DR strategy, you must develop the scope of work.
10. Identify which DR control strategies can’t be deployed alone and must always be accompanied by other DR control strategies. For example, increasing cooling supply air temperature should always be in combination with increasing zone temperature setpoints so that DR from secondary chilled water pump and chiller compressor motor power won’t be offset by an increase in demand by AHU supply fan motors.
11. Estimate targeted demand reduction which could result from deploying the selected DR control strategies. As discussed in Chapter 3, this can be straightforward or complex, depending on the strategy. You must assess potential demand reduction that can be achieved for each proposed DR control strategy.
12. If necessary, conduct field experiments to determine the effectiveness of selected DR strategies and to estimate the level of demand reduction. You must coordinate field experimentation with building operators and facility staff.
13. Identify control points in the building automation system that will be needed to carry out the selected DR control strategies.
14. Identify any additional sensors and actuators that will be needed to carry out the selected DR control strategies.
15. When dealing with a DR program that has penalty clauses for non- or partial performance, thoroughly test the DR strategies to ensure that targeted demand reduction can be achieved.
16. Document the selected DR strategies and conditions that must be met before deploying the DR strategies. See the following section, Sample DR Documents, for examples.
Sample DR Documents Using sample data from Appendix A, the following tables summarize potential DR control strategies for moderate and high DR events for the sample building.
NOTE: While the task of creating tables, as shown here, can be daunting and cumbersome, doing so will tremendously simplify field deployment and minimize programming mistakes.

Chapter 4 – Typical Workflow for Implementing Demand Response Strategies
Siemens Industry, Inc. 43
Moderate DR Event
Load to Reduce
DR Control Strategy Estimated DR, kW*
Relative Deployment
Cost
BAS Points to Execute Control Strategies
(samples)
VAV-AHU-1 Increase global zone temperature setpoint from 72 to 75°F.
Low Global.zone.temp.stpt
Increase individual zone temperature setpoint from 72 to 75°F.
Low Zone1.temp.setpt; Zone2.temp.setpt; Zone3.temp.setpt
Reduce duct static pressure setpoint.
Low Vav.ahu1.sp.setpt
Limit fan speed with VFD to 80%.
Low Vav.ahu1.vfd.maxlimit
Increase supply air temperature setpoint from 55 to 58°F.
Low Vav.ahu1.satemp.setpt
Turn off electric reheat at all VAV boxes.
Low Vav.ahu.box.reheat.enable
LAB-VAV-AHU-3
Cannot be reduced. – – –
Chiller-1 Lock out chiller. High Chiller1.enable
Increase chilled water supply temperature from 45 to 47°F.
Low Chiller1.chw.leaving.temp.setpt
Limit chiller part load ratio operation to 0.8.
High Chiller1.plr.maxlimit
Chiller-2 Lock out chiller. High Chiller2.enable
Increase chilled water supply temperature from 45 to 47°F.
Low Chiller1.chw.leaving.temp.setpt
Limit chiller part load ratio operation to 0.8.
High Chiller1.plr.maxlimit
Hallway lighting: 1st Floor
Turn off lights. Low Bldg1.flr1.light.hallway.status
Dim lights to 80%. Low Bldg1.flr1.light.hallway.level
Office Lighting: 1st Floor
Dim lights to 80%. Low Bldg1.flr1.light.office.level
Lab Lighting Cannot be reduced. – – –
* Enter the estimated kW reduction.

Automated Demand Response Using OpenADR Application Guide
44 Siemens Industry, Inc.
High DR Event
Loads to Reduce
DR Control Strategies Estimated DR, kW*
Relative Deployment
Cost
BAS Points to Execute Control Strategies
(samples)
VAV-AHU-1 Increase global zone temperature setpoint from 72 to 78°F.
Low Global.zone. temp.setpt
Increase individual zone temperature setpoint from 72 to 78°F.
Low Zone1.temp.setpt; Zone2.temp.setpt; Zone3.temp.setpt
Reduce duct static pressure setpoint to the new setpoint.
Low Vav.ahu1.sp.setpt
Limit fan speed with VFD to 60%.
Low Vav.ahu1.vfd.maxlimit
Increase supply air temperature setpoint from 55 to 60°F.
Low Vav.ahu1.satemp.setpt
Turn off electric reheat at all VAV boxes.
Low Vav.ahu.box.reheat.enable
LAB-VAV-AHU-3
Cannot be reduced. – – –
Chiller-1 Lock out chiller. High Chiller1.enable
Increase chilled water supply temperature from 45 to 49°F.
Low Chiller1.chw.leaving.temp.setpt
Limit chiller part load ratio operation to 0.6.
High Chiller1.plr.maxlimit
Chiller-2 Lock out chiller. High Chiller2.enable
Increase chilled water supply temperature from 45 to 49°F.
Low Chiller1.chw.leaving.temp.setpt
Limit chiller part load ratio operation to 0.6.
High Chiller1.plr.maxlimit
Hallway Lighting: 1st Floor
Turn off lights. Low Bldg1.flr1.light.hallway.status
Dim lights to 60%. Low Bldg1.flr1.light.hallway.level
Office Lighting: 1st Floor
Dim lights to 60%. Low Bldg1.flr1.light.office.level
Lab Lighting Cannot be reduced. – – –
* Enter the estimated kW reduction.

Chapter 4 – Typical Workflow for Implementing Demand Response Strategies
Siemens Industry, Inc. 45
Step 5: Test and deploy selected DR control strategies NOTE: Completing these steps may take weeks or even months and will require coordination
among building operators, facility managers, controls contractors, and upper management decision-makers.
For each DR control strategy, do the following:
1. Develop proper sequences of operation.
2. Add points and programming needed for executing DR control strategies.
3. Add points, graphics, and reports to monitor and convey the performance of DR strategies.
4. Depending on the notification type, do one of the following:
• If the DR notification is manual: Set up the system so that DR control strategies can be easily implemented by the building operator upon notification.
• If the DR notification is automatic but does not follow the OpenADR communication protocol: You must develop a custom program for converting the DR event information into a format acceptable for input into the APOGEE system.
• If the DR notification is automatic and follows the OpenADR communication protocol: Install and configure the ADR Client application to handle DR notification. See Chapter 5 – Deploying Demand Response Strategies with the ADR Client Application for deployment methods.
5. Test and verify DR strategy operation. If needed, you can use simulated DR events for testing. After testing, check the BAS data to ensure that the sequences of operation were properly completed.
Step 6: Develop performance measurement and verification reports (Optional)
At a minimum, you should provide building operators with the ability to monitor the amount of demand reduction in real time. You can base the demand reduction calculation during a DR event on the actual electrical and baseline demand, as defined in the DR contract.
Trend and make available the following demand data to building operators:
• Major HAVC equipment
• Lighting
• Miscellaneous electrical usages
• On-site generation and storage
NOTE: It is important to understand how actual demand reduction will be calculated so that you can develop performance measurement and verification programs accordingly. For more information, see Chapter 5 – Deploying Demand Response Strategies with the ADR Client Application.
Presenting Data Using the Enhanced Graphics Option (Optional) An effective way to present information to building operators is to use the Insight software’s Enhanced Graphics Option to create performance-monitoring dashboards. The following sample dashboard shows the electrical demand of major building systems; you can use the same dashboard to show on-site generation capacity.

Automated Demand Response Using OpenADR Application Guide
46 Siemens Industry, Inc.
Sample Dashboard of Major Systems and On-site Generation.
For a DR performance dashboard, you must add points to the APOGEE system in order to enter the baseline numbers, after which you can program the agreed-upon DR calculation and view the results in the dashboard.
Sample DR Performance Dashboard.
If utilities want you to report the amount of DR at the end of DR events, the Open Automated Demand Response Communications Specification (Version 1.0) also includes specifications on how the ADR Client application can report such information back to the utility.

Chapter 4 – Typical Workflow for Implementing Demand Response Strategies
Siemens Industry, Inc. 47
Developing DR performance dashboards requires engineering and programming effort. A proposal to develop DR performance dashboards should be submitted, agreed upon, and paid by your customers.
Other Operational Performance-Related Data (Optional) Your measurement and verification plans may also include HVAC operational data in order for you to evaluate the impact of DR control strategies on system operation and indoor environmental quality.
Sample operational data for the cooling equipment that may be useful to trend include:
Air Distribution
• Duct static pressure • Fan air flow • Fan power • Fan status • Fan VFD percent • Outside air damper position • Outside air temperature • Return air temperature • Supply air temperature
Central Plant
• Chilled water flow in the secondary water distribution system • Chilled water flow through each chiller • Chilled water return temperature • Chilled water supply temperature • Chiller power • Condenser water entering temperature • Condenser water leaving temperature • Cooling tower fan power • Outside air humidity • Outside air temperature • Primary pump power • Secondary pump power
Weather
• Outside air humidity • Outside air temperature • Solar radiation • Wind direction • Wind speed
Zone Control
• Lighting level • Lighting power

Automated Demand Response Using OpenADR Application Guide
48 Siemens Industry, Inc.
• Reheat valve position • VAV airflow • VAV damper position • Zone setpoint temperature • Zone temperature
It’s also useful to create monthly or quarterly reports that show the number of DR events called, load reduction control actions executed, DR results, and financial consequences resulting from not taking DR actions. Such information helps support the justification of the customer’s DR investment.
Step 7: Develop standard operating procedures for DR participation The standard operating procedure (SOP) for DR participation should cover methods and procedures for building operators to follow, and must include the following procedures:
• Opting-in to the DR program
• Opting-out of the DR program
• Aborting after opting-in the DR program
• Handling service calls that are caused by DR control actions
• Announcing upcoming DR events to building occupants
• Handling occupants’ comfort issues during the DR event
• Handling catastrophic failure that could be caused by DR control actions
In addition, you must outline the chain of approval that must take place for major DR-related decisions. For DR programs with penalty clauses, the SOP must also include procedures to log DR events resulting in penalty clauses, the investigation undertaken to resolve the issues, and DR performance data from such events.
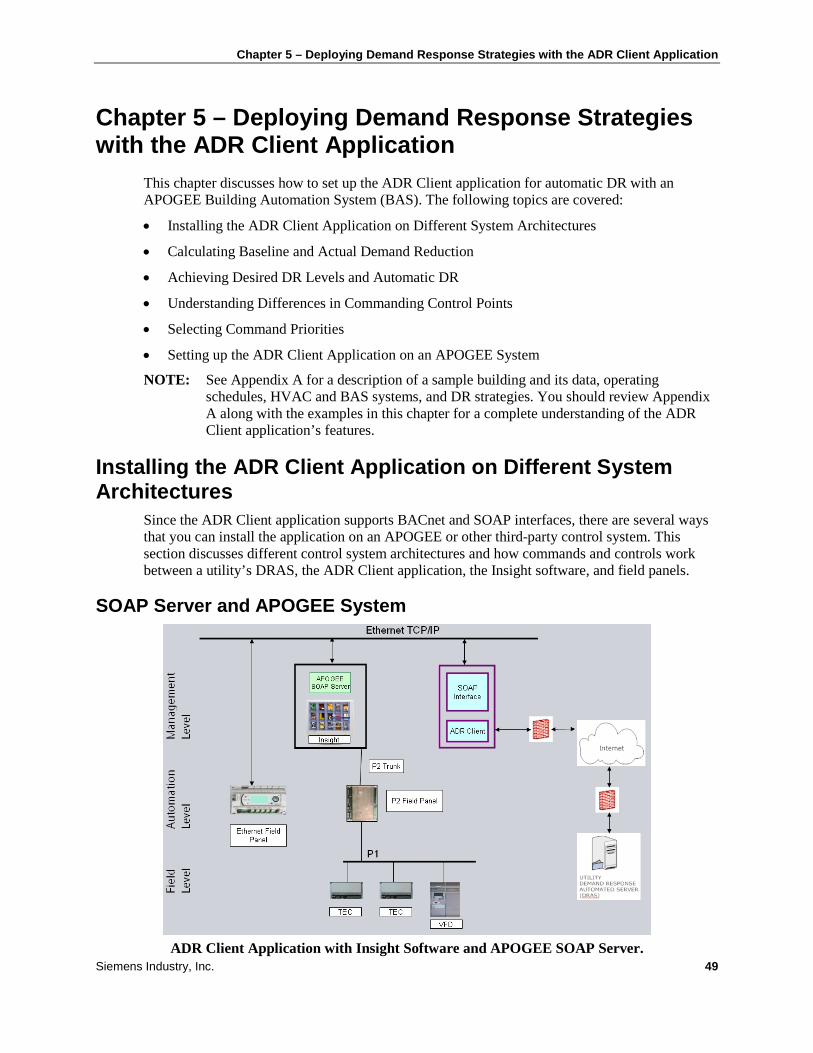
Chapter 5 – Deploying Demand Response Strategies with the ADR Client Application
Siemens Industry, Inc. 49
Chapter 5 – Deploying Demand Response Strategies with the ADR Client Application
This chapter discusses how to set up the ADR Client application for automatic DR with an APOGEE Building Automation System (BAS). The following topics are covered:
• Installing the ADR Client Application on Different System Architectures
• Calculating Baseline and Actual Demand Reduction
• Achieving Desired DR Levels and Automatic DR
• Understanding Differences in Commanding Control Points
• Selecting Command Priorities
• Setting up the ADR Client Application on an APOGEE System
NOTE: See Appendix A for a description of a sample building and its data, operating schedules, HVAC and BAS systems, and DR strategies. You should review Appendix A along with the examples in this chapter for a complete understanding of the ADR Client application’s features.
Installing the ADR Client Application on Different System Architectures
Since the ADR Client application supports BACnet and SOAP interfaces, there are several ways that you can install the application on an APOGEE or other third-party control system. This section discusses different control system architectures and how commands and controls work between a utility’s DRAS, the ADR Client application, the Insight software, and field panels.
SOAP Server and APOGEE System
ADR Client Application with Insight Software and APOGEE SOAP Server.

Automated Demand Response Using OpenADR Application Guide
50 Siemens Industry, Inc.
Following are the requirements for installing an ADR Client application on an APOGEE system using a SOAP interface to command points through an APOGEE SOAP Server.
Hardware Software ▪ Workstation running the Insight software and
APOGEE SOAP Server ▪ Workstation running the ADR Client application* ▪ P2 field panels ▪ Ethernet field panels ▪ P1 devices such as TECs or VFDs
▪ ADR Client application ▪ Insight software ▪ Insight DBCSServer ▪ APOGEE SOAP Server for Internet
Information Server (IIS) ▪ IIS version 6.0 for Windows 2003 Server, or
IIS 7.0 for Windows 2008 Server
* You can install the ADR Client application on the Insight workstation in either one of the following conditions: ▪ The workstation is running Insight Revision 3.11 or later, OR ▪ If the workstation is running Insight Revision 3.10 or earlier and the BACstac protocol is not
already installed on the workstation.
Sequence of Operation 1. The ADR Client application receives a DR signal from a utility’s DRAS.
2. The ADR Client application processes the pre-defined DR event information and DR control strategies, and creates schedules to properly command points required for executing DR strategies.
3. At the scheduled times calculated in Step 2, the ADR Client application commands points to execute DR control strategies through the APOGEE SOAP Server.
NOTE: In order for the APOGEE SOAP Server to command TEC points, you must first unbundle them.
NOTE: Point names included in every SOAP request from the ADR Client application must exactly match a point name defined in the Insight database.
BACnet IP to BACnet Field Panels
BACnet IP to BACnet Field Panels on an APOGEE System.

Chapter 5 – Deploying Demand Response Strategies with the ADR Client Application
Siemens Industry, Inc. 51
Following are the requirements for installing an ADR Client application on an APOGEE system using a BACnet IP interface to command points at APOGEE BACnet field panel or third-party BACnet field panel.
Hardware Software
▪ Workstation running the ADR Client application
▪ BACnet field panels (APOGEE and third-party)
▪ ADR Client application
Sequence of Operation 1. The ADR Client application receives a DR signal from a utility’s DRAS.
2. The ADR Client application processes the pre-defined DR event information and DR control strategies, and creates schedules to properly command points required for executing DR strategies.
3. At the scheduled times calculated in Step 2, the ADR Client application commands BACnet points in the APOGEE and third-party BACnet field panels to execute DR control strategies through BACnet IP.
The ADR Client application can command the following BACnet point types: Analog Output, Analog Value, Binary Output, Binary Value, Multi-State Output, and Multi-State Value.
BACnet IP to Insight BACnet Server
BACnet IP to Insight BACnet Server on an APOGEE System.
Following are the requirements for installing an ADR Client application on an APOGEE system using a BACnet interface to command BACnet objects at APOGEE BACnet field panels, and APOGEE points that are exported as BACnet objects through the Insight BACnet Server.
Hardware Software
▪ Workstation running the Insight software and Insight BACnet Server
▪ ADR Client application
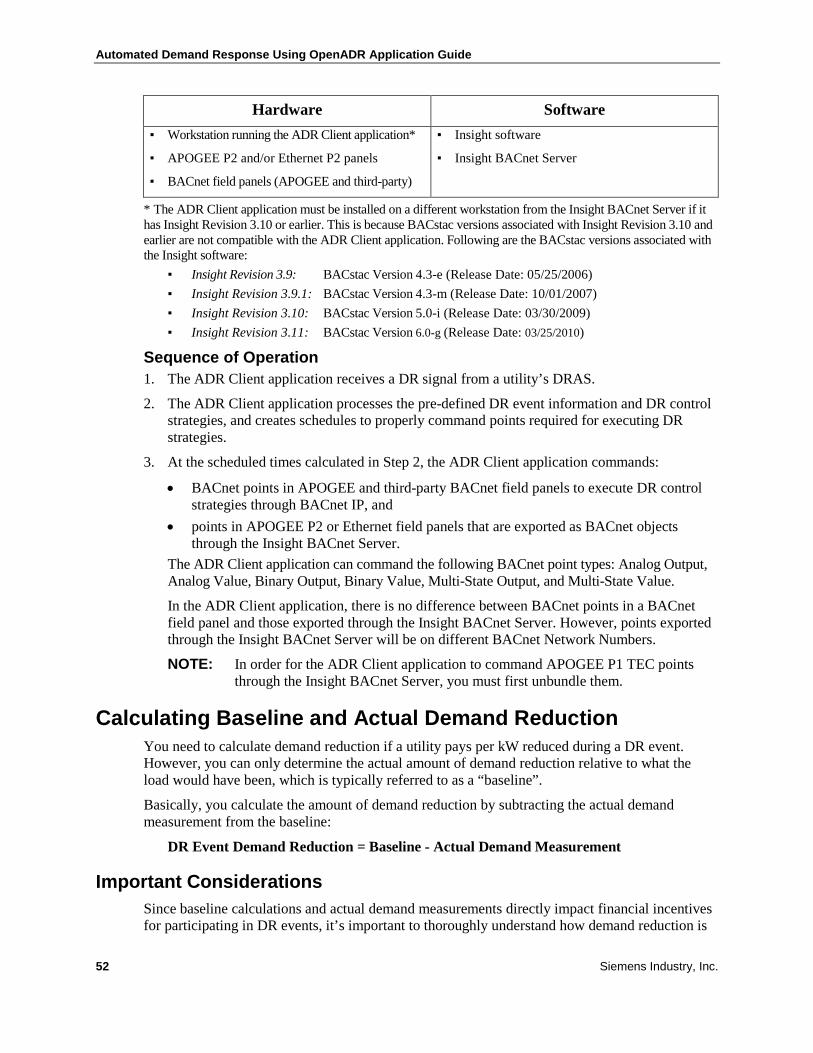
Automated Demand Response Using OpenADR Application Guide
52 Siemens Industry, Inc.
Hardware Software ▪ Workstation running the ADR Client application*
▪ APOGEE P2 and/or Ethernet P2 panels
▪ BACnet field panels (APOGEE and third-party)
▪ Insight software
▪ Insight BACnet Server
* The ADR Client application must be installed on a different workstation from the Insight BACnet Server if it has Insight Revision 3.10 or earlier. This is because BACstac versions associated with Insight Revision 3.10 and earlier are not compatible with the ADR Client application. Following are the BACstac versions associated with the Insight software:
▪ Insight Revision 3.9: BACstac Version 4.3-e (Release Date: 05/25/2006) ▪ Insight Revision 3.9.1: BACstac Version 4.3-m (Release Date: 10/01/2007) ▪ Insight Revision 3.10: BACstac Version 5.0-i (Release Date: 03/30/2009) ▪ Insight Revision 3.11: BACstac Version 6.0-g (Release Date: 03/25/2010)
Sequence of Operation 1. The ADR Client application receives a DR signal from a utility’s DRAS.
2. The ADR Client application processes the pre-defined DR event information and DR control strategies, and creates schedules to properly command points required for executing DR strategies.
3. At the scheduled times calculated in Step 2, the ADR Client application commands:
• BACnet points in APOGEE and third-party BACnet field panels to execute DR control strategies through BACnet IP, and
• points in APOGEE P2 or Ethernet field panels that are exported as BACnet objects through the Insight BACnet Server.
The ADR Client application can command the following BACnet point types: Analog Output, Analog Value, Binary Output, Binary Value, Multi-State Output, and Multi-State Value.
In the ADR Client application, there is no difference between BACnet points in a BACnet field panel and those exported through the Insight BACnet Server. However, points exported through the Insight BACnet Server will be on different BACnet Network Numbers.
NOTE: In order for the ADR Client application to command APOGEE P1 TEC points through the Insight BACnet Server, you must first unbundle them.
Calculating Baseline and Actual Demand Reduction You need to calculate demand reduction if a utility pays per kW reduced during a DR event. However, you can only determine the actual amount of demand reduction relative to what the load would have been, which is typically referred to as a “baseline”.
Basically, you calculate the amount of demand reduction by subtracting the actual demand measurement from the baseline:
DR Event Demand Reduction = Baseline - Actual Demand Measurement
Important Considerations Since baseline calculations and actual demand measurements directly impact financial incentives for participating in DR events, it’s important to thoroughly understand how demand reduction is

Chapter 5 – Deploying Demand Response Strategies with the ADR Client Application
Siemens Industry, Inc. 53
calculated as stated in the DR contract so that you can properly set up the system. In particular, determine the following:
• Data Selection for Calculation. Which days (admissible days) can be used for the calculation?
• Calculation Methods. What methods must be used for the calculation of baseline, adjustment factor, and actual measurement (that is, averages, regression models, and others)?
• Adjustment Factor Calculation Methods. What methods must be used for calculating the adjusting factor?
• Actual Demand Measurement Methods. What methods must be used to determine actual demand measurement during the DR events?
Calculation Methods Each utility has its own methods for baseline calculations, as well as methods for calculating Day-of-Event adjusting factors to account for load variances from changes in business operation and weather conditions.
One utility might calculate the baseline by averaging the hourly energy usage recorded during the past 10 working days, while another calculates the baseline by averaging the hourly energy usages from the past 48 hours of operation.
NOTE: The average hourly peak demand (kW) is equivalent to the energy usage (kWh) over a period of 1 hour.
Each utility also has its own methods of defining “working days”. The term, admissible day, is frequently used by different utilities to refer to the days for which data can be used (admitted) for baseline calculations. For example, an admissible day must be a normal, full workday; it cannot be a half-day, weekend day, holiday, DR event day, low-usage day (of which the usage is less than 25% of a typical workday), etc.
In addition, each utility has its own methods to adjust the hourly baseline demand value to reflect the actual building operating and local weather conditions on the day of the DR event. Some may calculate the adjustment factor based on the 10-day baseline of the average energy usage during the 3 to 4 hours prior to the event start time (average demand baseline) and the actual hourly energy usage during the first 3 to 4 hours prior to the DR event (average Day-of-Event demand). The adjustment factor is calculated from the average demand baseline and average Day-of-Event demand.
Some utilities may base their adjustment factor calculations on outside weather conditions. In these cases, they divide the calculated demand reduction into two parts: weather-dependent demand reduction and weather-independent demand reduction. The adjustment factor is applied only to the weather-dependent portion of the demand reduction:
DR Event Demand Reduction = Adjusted Baseline - Actual Demand Measurement
or
DR Event Demand Reduction = (Baseline - Actual Demand Measurement) × Day-of-Event Adjustment Factor
In general, if the DR event occurs on a hot day, calculations based on average energy usage from prior days without adjustment to the current day tend to understate the baseline and amount of demand reduction. Also, if you take pre-cooling or advanced actions prior to the start of the DR event, in most cases calculating and applying the same-day adjusting factor to the baseline lowers the baseline and does not reflect what the load would have been.
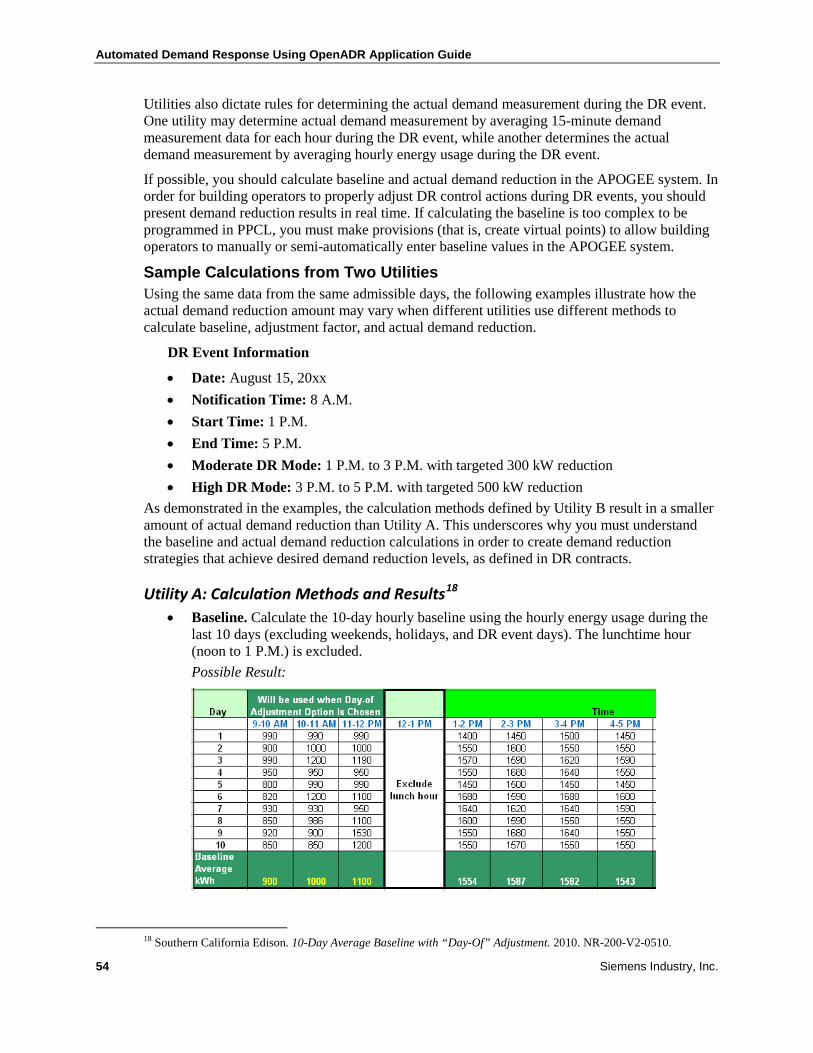
Automated Demand Response Using OpenADR Application Guide
54 Siemens Industry, Inc.
Utilities also dictate rules for determining the actual demand measurement during the DR event. One utility may determine actual demand measurement by averaging 15-minute demand measurement data for each hour during the DR event, while another determines the actual demand measurement by averaging hourly energy usage during the DR event.
If possible, you should calculate baseline and actual demand reduction in the APOGEE system. In order for building operators to properly adjust DR control actions during DR events, you should present demand reduction results in real time. If calculating the baseline is too complex to be programmed in PPCL, you must make provisions (that is, create virtual points) to allow building operators to manually or semi-automatically enter baseline values in the APOGEE system.
Sample Calculations from Two Utilities Using the same data from the same admissible days, the following examples illustrate how the actual demand reduction amount may vary when different utilities use different methods to calculate baseline, adjustment factor, and actual demand reduction.
DR Event Information
• Date: August 15, 20xx • Notification Time: 8 A.M. • Start Time: 1 P.M. • End Time: 5 P.M. • Moderate DR Mode: 1 P.M. to 3 P.M. with targeted 300 kW reduction • High DR Mode: 3 P.M. to 5 P.M. with targeted 500 kW reduction
As demonstrated in the examples, the calculation methods defined by Utility B result in a smaller amount of actual demand reduction than Utility A. This underscores why you must understand the baseline and actual demand reduction calculations in order to create demand reduction strategies that achieve desired demand reduction levels, as defined in DR contracts.
Utility A: Calculation Methods and Results18
• Baseline. Calculate the 10-day hourly baseline using the hourly energy usage during the last 10 days (excluding weekends, holidays, and DR event days). The lunchtime hour (noon to 1 P.M.) is excluded.
Possible Result:
18 Southern California Edison. 10-Day Average Baseline with “Day-Of” Adjustment. 2010. NR-200-V2-0510.
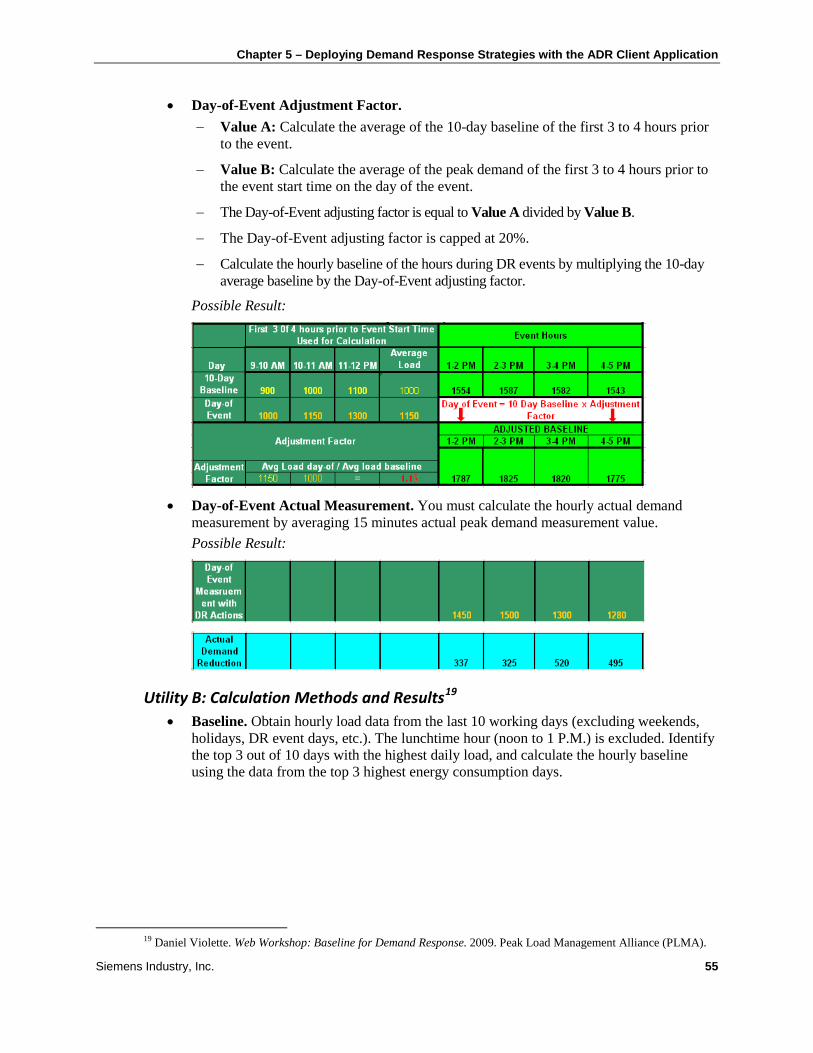
Chapter 5 – Deploying Demand Response Strategies with the ADR Client Application
Siemens Industry, Inc. 55
• Day-of-Event Adjustment Factor. − Value A: Calculate the average of the 10-day baseline of the first 3 to 4 hours prior
to the event.
− Value B: Calculate the average of the peak demand of the first 3 to 4 hours prior to the event start time on the day of the event.
− The Day-of-Event adjusting factor is equal to Value A divided by Value B.
− The Day-of-Event adjusting factor is capped at 20%.
− Calculate the hourly baseline of the hours during DR events by multiplying the 10-day average baseline by the Day-of-Event adjusting factor.
Possible Result:
• Day-of-Event Actual Measurement. You must calculate the hourly actual demand
measurement by averaging 15 minutes actual peak demand measurement value. Possible Result:
Utility B: Calculation Methods and Results19
• Baseline. Obtain hourly load data from the last 10 working days (excluding weekends, holidays, DR event days, etc.). The lunchtime hour (noon to 1 P.M.) is excluded. Identify the top 3 out of 10 days with the highest daily load, and calculate the hourly baseline using the data from the top 3 highest energy consumption days.
19 Daniel Violette. Web Workshop: Baseline for Demand Response. 2009. Peak Load Management Alliance (PLMA).

Automated Demand Response Using OpenADR Application Guide
56 Siemens Industry, Inc.
Possible Result:
• Day-of-Event Adjustment Factor.
− Value A: Calculate the average load over the highest 3 out of 10 days of the first 3 to 4 hours prior to the event start time.
− Value B: Calculate the average load of the first 3 to 4 hours prior to the event start time on the day of the DR event.
− The Day-of-Event adjusting factor is equal to Value A divided by Value B.
− The Day-of-Event adjusting factor is capped at 20%.
− Calculate the hourly baseline of the hours during DR events by multiplying the average hourly baseline of the 3 out of 10 highest load days by the Day-of-Event adjusting factor.
Possible Result:
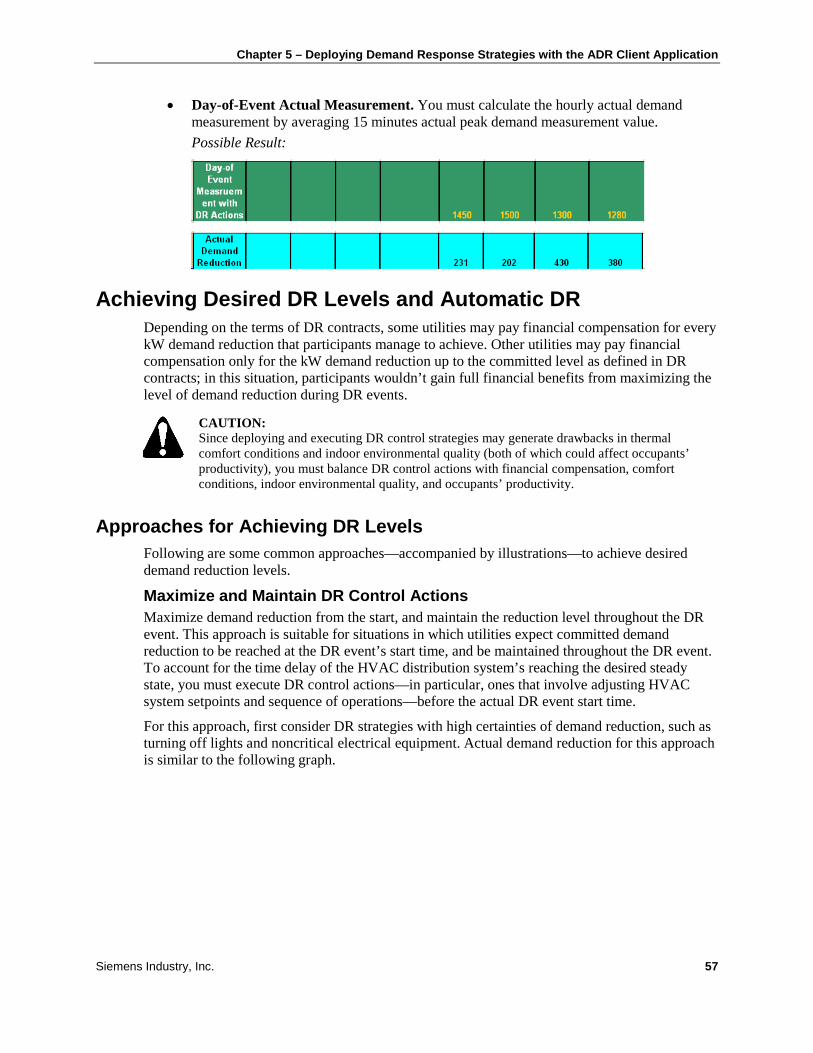
Chapter 5 – Deploying Demand Response Strategies with the ADR Client Application
Siemens Industry, Inc. 57
• Day-of-Event Actual Measurement. You must calculate the hourly actual demand measurement by averaging 15 minutes actual peak demand measurement value. Possible Result:
Achieving Desired DR Levels and Automatic DR Depending on the terms of DR contracts, some utilities may pay financial compensation for every kW demand reduction that participants manage to achieve. Other utilities may pay financial compensation only for the kW demand reduction up to the committed level as defined in DR contracts; in this situation, participants wouldn’t gain full financial benefits from maximizing the level of demand reduction during DR events.
CAUTION: Since deploying and executing DR control strategies may generate drawbacks in thermal comfort conditions and indoor environmental quality (both of which could affect occupants’ productivity), you must balance DR control actions with financial compensation, comfort conditions, indoor environmental quality, and occupants’ productivity.
Approaches for Achieving DR Levels Following are some common approaches—accompanied by illustrations—to achieve desired demand reduction levels.
Maximize and Maintain DR Control Actions Maximize demand reduction from the start, and maintain the reduction level throughout the DR event. This approach is suitable for situations in which utilities expect committed demand reduction to be reached at the DR event’s start time, and be maintained throughout the DR event. To account for the time delay of the HVAC distribution system’s reaching the desired steady state, you must execute DR control actions—in particular, ones that involve adjusting HVAC system setpoints and sequence of operations—before the actual DR event start time.
For this approach, first consider DR strategies with high certainties of demand reduction, such as turning off lights and noncritical electrical equipment. Actual demand reduction for this approach is similar to the following graph.

Automated Demand Response Using OpenADR Application Guide
58 Siemens Industry, Inc.
DR Control Actions.20
Implement and Monitor Step-Wise DR
Implement step-wise DR with continuous demand response monitoring and control action. This strategy improves upon the previous approach, Maximize and Maintain DR Control Actions, by continuously monitoring the actual demand and providing real-time calculation of demand reduction levels. If the target demand can’t be reached within a pre-defined time period (for example, 15 minutes after the DR event start time), additional DR strategies can be executed to further lower the demand.
This approach is only possible if you can calculate the level of demand reduction in real time and manually or automatically execute additional DR control strategies. To calculate demand reduction in real time, you must have metering capability and the baseline number of the Day-of-Event available and programmed in the system.
20 Kenneth D. Schisler. The Demand Response Baseline. 2008. EnerNOC, Inc.
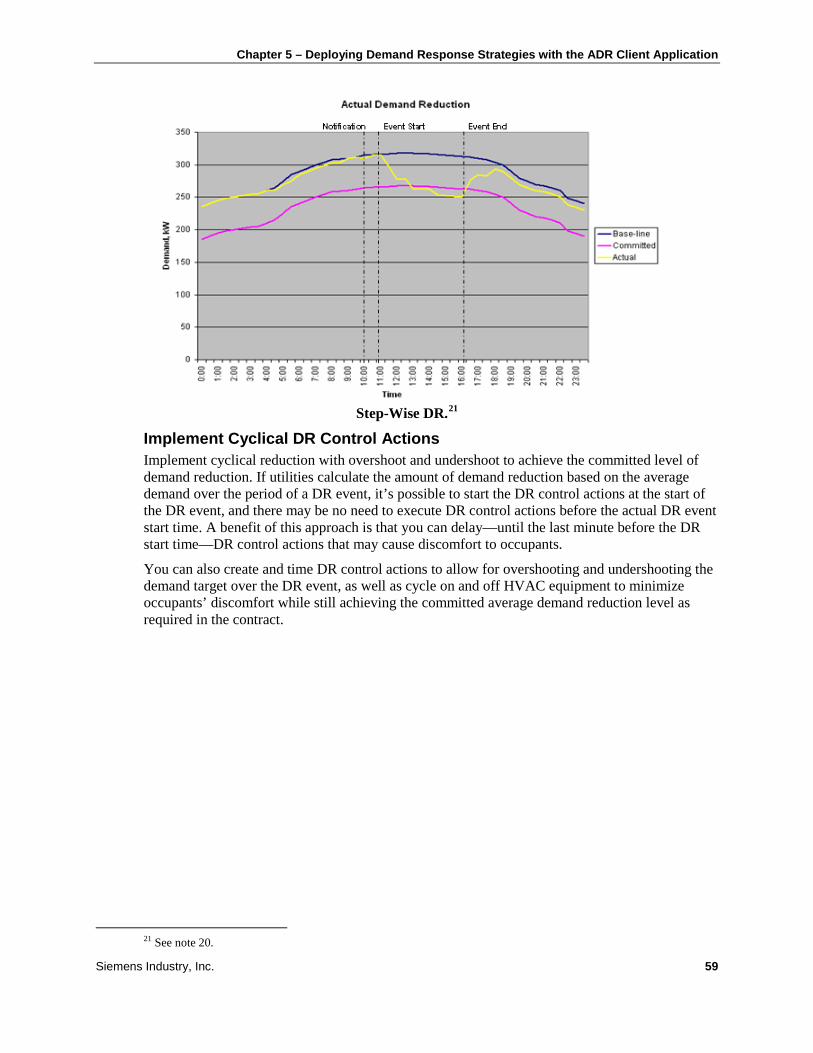
Chapter 5 – Deploying Demand Response Strategies with the ADR Client Application
Siemens Industry, Inc. 59
Step-Wise DR.21
Implement Cyclical DR Control Actions
Implement cyclical reduction with overshoot and undershoot to achieve the committed level of demand reduction. If utilities calculate the amount of demand reduction based on the average demand over the period of a DR event, it’s possible to start the DR control actions at the start of the DR event, and there may be no need to execute DR control actions before the actual DR event start time. A benefit of this approach is that you can delay—until the last minute before the DR start time—DR control actions that may cause discomfort to occupants.
You can also create and time DR control actions to allow for overshooting and undershooting the demand target over the DR event, as well as cycle on and off HVAC equipment to minimize occupants’ discomfort while still achieving the committed average demand reduction level as required in the contract.
21 See note 20.

Automated Demand Response Using OpenADR Application Guide
60 Siemens Industry, Inc.
Cyclical DR Control Actions.22
Approaches for Achieving Automatic DR
The ADR Client application gives you several options to automate DR control actions when DR event signals are received from utilities. While you can program all DR control actions in PPCL, the ADR Client application is capable of handling DR event signals and creating schedules to command both BACnet and APOGEE points. This enables you to configure simple DR control strategies (such as changing setpoints, turning off lights, dimming lighting levels, etc.) for deployment by the ADR Client application. To support this, the ADR Client application processes DR event information and DR control actions and commands control points at the specified time with proper command priority.
For sites requiring complex DR strategies and specific sequences of operation, the recommended approach is to use the ADR Client application’s DR event scheduling capability along with PPCL programming. See the following table for sample DR strategies and approaches.
Approach Strategies and Situations
▪ DR strategies are configured in the ADR Client application.
▪ Control points are commanded by the ADR Client application.
▪ Raise/lower the setpoint value of control points. ▪ Turn on/off lighting, assuming that the lighting controller is
integrated to the building automation system. ▪ Lower the lighting level, assuming that the lighting
controller is integrated to the building automation system. ▪ Turn on/off electrical equipment that does not require
specific shutdown and/or start up sequences.
▪ DR strategies are programmed in PPCL. ▪ DR mode status (enabled/disabled)
control points are configured in the ADR Client application.
▪ All the above, plus: ▪ Raise/lower the setpoint value of control points, and check
the new setpoint value against the limit. ▪ Turn on/off HVAC equipment for which specific shut
22 See note 20.

Chapter 5 – Deploying Demand Response Strategies with the ADR Client Application
Siemens Industry, Inc. 61
Approach Strategies and Situations ▪ DR mode status control points are
commanded by the ADR Client application. down and/or start up sequences must be strictly followed to prevent damage to the equipment.
▪ Turn on/off HAVC equipment that requires time delays between control actions.
▪ Before executing DR strategies, check DR control situations for operator “opt-out”.
▪ PPCL can rely on the ADR Client application (scheduling and commanding priority) to command the DR mode status control points at the right time to enable/disable PPCL control blocks for DR strategies.
▪ DR mode status (enabled/disabled) BACnet control points are configured in the ADR Client application.
▪ DR mode status BACnet control points are commanded by the ADR Client application.
▪ The ADR Client application is sold to BACnet installation sites with no APOGEE systems.
▪ Program DR control actions in native programming languages of the BACnet field panel controllers.
▪ Execute DR control actions when the DR mode status BACnet control points are enabled.
▪ You can program any DR control actions in the BACnet field panel controllers.
▪ The ADR Client application only publishes DR event and mode level information.
▪ DR control strategies and execution are done at the field panel controllers.
▪ The ADR Client application is only used for receiving DR event signals from utilities and publishing DR event information to the controllers on the network.
▪ The programming capabilities at the controllers must be able to handle date and time logic for properly executing DR control actions at the right time.
Understanding Differences in Commanding Control Points Before configuring the ADR Client application to command points, you should understand BACnet command priorities and APOGEE point priorities. These are explained in the following section, Command Priority Properties, which is taken from the BACnet Application Guide (125-1984).
NOTE: The term, BACnet points, refers to BACnet points in BACnet field panels and APOGEE points that are exported through the Insight BACnet Server as BACnet points.
Command Priority Properties BACnet has an application-controlled prioritization mechanism, the Command Priority Array, that determines which application is commanding an object property. The Command Priority Array is similar to the Point Command Priority in the APOGEE Automation System.
The BACnet properties that implement the command priority array are Priority_Array and Relinquish_Default. Every commandable object property supports a 16-slot Priority_Array plus a Relinquish_Default value that serves as a default if no applications are controlling the object value when all 16 slots are empty. The following figure shows the standard priorities within the 16 slots along with BACnet’s recommended applications for these priorities. The unused slots are available for other priorities.

Automated Demand Response Using OpenADR Application Guide
62 Siemens Industry, Inc.
BACnet Standard Priorities.
When multiple applications, each with a different priority, have active commands to the object, the object decides which to accept based on the relative priorities of the applications. As commands are set and released, the object will continuously re-evaluate which command to use. Each commanding application must stay in its own priority slot and not interfere with commands from other applications. If all commands are released, the object will default to the value held in the mandatory Relinquish_Default object property. The following figure shows an example of how the Command Priority Array operates.
Example of the BACnet Command Priority Array Operation.
Command Priority Array vs. APOGEE The BACnet Command Priority Array, which is similar to APOGEE’s Point Command Priority, manages the Present_Value property. Each Insight application that commands points has a configurable default priority that is used for point commands and releases.
The following table shows the Command Priority Array, along with the default mapping to APOGEE priorities. If desired, you can change any of the six defaults. For OPERATOR, the value in the table is used as the highest priority slot available for commanding. For example, you can command at this priority and lower.

Chapter 5 – Deploying Demand Response Strategies with the ADR Client Application
Siemens Industry, Inc. 63
BACnet Command Priority Array Mapped to APOGEE Priorities.
Slot BACnet Name APOGEE Priority
1 Manual Life Safety
2 Automatic Life Safety
3 Available
4 Available
5 Critical Equipment Control
6 Minimum On/Off
7 Available
8 Manual Operator OPERATOR
9 Available
10 Available SMOKE
11 Available
12 Available EMERGENCY
13 Available
14 Available PDL
15 Available
16 Available SCHEDULING, PPCL, NONE, TEC TOOL
Relinquish Default TEC APPLICATION
Selecting Command Priorities The recommendations in this section are based on the following assumptions:
• For BACnet points, the default command priority for the PPCL program is Priority 16.
• For APOGEE points, the command priority for PPCL is NONE, which is the default for PPCL.
• For point control statements (such as ON, OFF, FAST, SLOW, SET, STATE, etc), leave the command priorities at the default values (@NONE for APOGEE points, Priority 16 for BACnet points). If you use command priorities other than the default values, you must make the field engineer aware of the exceptions, since they will affect how DR strategies are programmed and commanded from the ADR Client application.
• The default BACnet command priority has not been modified and the command priorities match those shown in the Command Priority Array vs. APOGEE section.
APOGEE Points For executing DR control strategies, command APOGEE control points at the PDL priority. If the control points are already set at the OPERATOR priority, they will remain at the OPERATOR

Automated Demand Response Using OpenADR Application Guide
64 Siemens Industry, Inc.
priority and will not be affected by the command at the PDL priority. This is the preferred strategy, as building operators typically place control points at the OPERATOR priority level to prevent changes to such control points.
If those control points are needed for participating in automated DR actions, the building operator must release them from the OPERATOR priority (command the points with @NONE priority).
BACnet Points Similar to commanding APOGEE points at the PDL priority, you should command BACnet points at Priority 14, which is equivalent to the PDL priority. This allows the EMERGENCY (Priority 12), SMOKE (Priority 10), and OPERATOR (Priority 8) priorities to take over DR control actions when necessary.
In addition, setting the BACnet point command priority at a level below OPERATOR ensures that any BACnet points already commanded at the OPERATOR priority won’t be overridden by DR control actions.
The building operator is responsible for relinquishing the OPERATOR priority command for points participating in DR control events.
CAUTION: Commanding control points with improper values and command priorities can cause undesired system operation behavior. Control points commanded from the ADR Client application must be commanded at a priority level lower than the OPERATOR priority. This allows building operators to override commands from the ADR Client application and return the system to normal operation.
Setting up the ADR Client Application on an APOGEE System NOTE: Throughout this section, sample building data and DR strategies from Appendix A are
used to illustrate setting up and configuring the ADR Client application to automatically execute DR control actions.
At this point, it’s assumed that you have completed DR audits and have identified DR control strategies for various DR modes of operation. Complete the following steps to set up the APOGEE control system and the ADR Client application:
• Step 1: Identify control points for executing DR control strategies
• Step 2: Create control points for DR event information
• Step 3: Create additional control points for DR control actions
• Step 4: Create additional control points to allow exclusions from DR events
• Step 5: Decide how to implement DR control actions
• Step 6: Determine offset times for DR control actions
• Step 7: Configure notification points
• Step 8: Configure response points
• Step 9: Configure control points for DR control actions
• Step 10: Write PPCL for DR control actions

Chapter 5 – Deploying Demand Response Strategies with the ADR Client Application
Siemens Industry, Inc. 65
• Step 11: Test DR strategies and publish DR test reports
• Step 12: Create graphic screens for real-time monitoring (Optional)
Step 1: Identify control points for executing DR control strategies NOTE: Point names included in each SOAP request from the ADR Client application must
exactly match point names defined in the Insight database.
APOGEE Control Points
Sample Points
Strategy # Description Point Name Point Type
1 Turn off perimeter lights on all floors. F1.PERIM.LIGHT.EAST.STATUS DO
F1.PERIM.LIGHT.WEST.STATUS
F1.PERIM.LIGHT.NORTH.STATUS
F1.PERIM.LIGHT.SOUTH.STATUS
2 Turn off 1 out of 3 interior light fixtures on all floors, except those in critical and lab areas.
F1.INT.LIGHT.ONETHIRD.STATUS DO
4 For the cooling season, raise the room temperature setpoint of all non-critical areas by 4°F.
F1.NORMAL.ROOM.TEMP.STPT AO
BACnet Control Points If DR control actions will be carried out in the BACnet field panel, you must identify the BACnet control points for executing DR control actions. Be sure to record the BACnet Object Type, Network ID, Device ID, and Object ID.
Sample Points
Strategy # Description Point Name BACnet Object Type
Network ID
Device ID
Object ID
3 Turn off all outdoor water fountain pumps.
FOUNTAIN.PUMP1.STATUS Binary Value 0 9050 0
FOUNTAIN.PUMP2.STATUS Binary Value 0 9050 1
5 For the cooling season, raise the supply air temperature setpoint of the VAV-AHU by 4°F.
AHU1.SAT.STPT Analog Value 0 7050 0
AHU2.SAT.STPT Analog Value 0 7050 1
AHU3.SAT.STPT Analog Value 0 7050 2
AHU4.SAT.STPT Analog Value 0 7050 3
Limit the fan speed to 75%.
AHU1.FAN.SPEED.MAX Analog Value 0 7050 4
AHU2.FAN.SPEED.MAX Analog Value 0 7050 5
AHU3.FAN.SPEED.MAX Analog Value 0 7050 6
AHU4.FAN.SPEED.MAX Analog Value 0 7050 7

Automated Demand Response Using OpenADR Application Guide
66 Siemens Industry, Inc.
Step 2: Create control points for DR event information The ADR Client application uses notification points to pass information about DR events to the controller. Each DR event consists of the following:
• Alarm Point. Informs building operators about an active DR event.
• Active DR Event Mode. DR operation mode value.
• Active DR Event Start Date. Start date for the active DR event. The value is expressed as the day of the current year.
• Active DR Event End Date. End date for the active DR event. The value is expressed as the day of the current year.
• Active DR Event Start Time. Start time since midnight for the active DR event. The value is expressed as seconds.
• Active DR Event End Time. End time since midnight for the active DR event. The value is expressed as seconds.
• Next DR Event Mode. DR operation mode value of the next DR event.
• Next DR Event Start Date. Start date for the next DR event. The value is expressed as the day of the current year.
• Next DR Event End Date. End date for the next DR even. The value is expressed as the day of the current year.
• Next DR Event Start Time. Start time since midnight for the next DR event. The value is expressed as seconds.
• Next DR Event End Time. End time since midnight for the next DR event. The value is expressed as seconds.
APOGEE Control Points If you want to use APOGEE control points to store DR event information, you must create additional APOGEE points. These will be used in a later step for configuring the ADR Client application’s notification points.
Sample Points
# Point Name Point Type Description
1 DrEventAlarmPoint BO Alarm point indicating that a DR event is in effect
2 CurDrMode LENUM DR operation mode
3 CurDrStartTimeDayOfYear AO Start date of current DR mode event
4 CurDrStartTimeSecSinceMidNight AO Start time of current DR mode event
5 CurDrEndTimeSecSinceMidNight AO End time of current DR mode event
6 CurDrEndTimeDayOfYear AO End date of current DR mode event
7 NxtDrMode LENUM Current mode level of demand reduction
8 NxtDrStartTimeDayOfYear AO Start date of current DR mode event
9 NxtDrStartTimeSecSinceMidNight AO Start time of current DR mode event

Chapter 5 – Deploying Demand Response Strategies with the ADR Client Application
Siemens Industry, Inc. 67
# Point Name Point Type Description
10 NxtDrEndTimeSecSinceMidNight AO End time of current DR mode event
11 NxtDrEndTimeDayOfYear AO End date of current DR mode event
BACnet Control Points If you want to use BACnet control points to store DR event information, you must create additional BACnet points. Be sure to record the BACnet Object Type, Network ID, Device ID, and Object ID.
Sample Points
# Point Name BACnet Object Type Network ID Device ID Object ID
1 B_DrEventAlarm Binary Value 0 7050 21
2 B_CurDrMode Multistate Value 0 7050 0
3 B_CurDrStartTimeDay Analog Value 0 7050 8
4 B_CurDrStartTime Analog Value 0 7050 9
5 B_CurDrEndTime Analog Value 0 7050 10
6 B_CurDrEndTimeDay Analog Value 0 7050 11
7 B_NxtDrMode Multistate Value 0 7050 1
8 B_NxtDrStartTimeDay Analog Value 0 7050 12
9 B_NxtDrStartTime Analog Value 0 7050 14
10 B_NxtDREndTime Analog Value 0 7050 15
11 B_NxtDrEndTimeDay Analog Value 0 7050 13
Step 3: Create additional control points for DR control actions Depending on the approaches you selected to carry out DR control actions, you may need additional control points. These points will be used in PPCL as flags to enable/disable PPCL programming blocks for different groups of DR control actions. The number of points you create depends on how you organize DR control actions.
APOGEE Control Points
Sample Points
# Point Name Point Type Description
1 DR.CONTROL.1 BO Enable DR control strategy 1
2 DR.CONTROL.2 BO Enable DR control strategy 2
3 DR.CONTROL.3 BO Enable DR control strategy 3
4 DR.CONTROL.4 BO Enable DR control strategy 4
5 DR.CONTROL.5 BO Enable DR control strategy 5

Automated Demand Response Using OpenADR Application Guide
68 Siemens Industry, Inc.
Sample PPCL Programming Blocks Sample PPCL programming blocks using the previous control points for enabling/disabling groups of DR control actions. 00850 PROCESS DR CONTROL ACTION
00860 IF ("CurDRMode" .EQ. MODERATE) THEN ON ("DR.CONTROL.1", “DR.CONTROL.3”)
00900 IF (“DR.CONTROL.1” .EQ. ON) THEN GOSUB 2000
00910 IF (“DR.CONTROL.3” .EQ. ON) THEN GOSUB 3000
02000 C SUBROUTINE TO EXECUTE DR CONTROL STRATEGY 1 – TURN OFF PERIMETER LIGHT, EAST, WEST, NORTH, THEN SOUTH WITH 1 MINUTE WAIT IN BETWEEN.
02010 OFF(“F1.PERIMETER.LGHT.EAST.STATUS”)
02020 WAIT(60, “F1.PERIMETER.LGHT.EAST.STATUS”, “F1.PERIMETER.LGHT.WEST.STATUS”, 00)
02030 WAIT(60, “F1.PERIMETER.LGHT.WEST.STATUS”, “F1.PERIMETER.LGHT.NORTH.STATUS”, 00)
02040 WAIT(60, “F1.PERIMETER.LGHT.NORTH.STATUS”, “F1.PERIMETER.LGHT.SOUTH.STATUS”, 00)
02050 RETURN
03000 C SUBROUTINE TO EXECUTE DR CONTROL STRATEGY 3 – TURN OFF ALL OUTSIDE WATER FOUNTAIN PUMPS
03010 OFF(“FOUNTAIN.PUMP.1.STATUS”,”FOUNTAIN.PUMP.1.STATUS”)
03020 RETURN
BACnet Control Points For BACnet jobs, you can create additional BACnet control points for carrying out DR control actions in the BACnet devices. These points will be used in the native languages of the BACnet field panel controllers as flags to enable/disable programming blocks for different groups of DR control actions. The amount of points to be created depends on how you organize DR control actions.
Sample Points
# Point Name BACnet Object Type Network ID Device ID Object ID
1 BACNET.DR.CONTROL.1 Binary Value 0 7050 16
2 BACNET.DR.CONTROL.2 Binary Value 0 7050 17
3 BACNET.DR.CONTROL.3 Binary Value 0 7050 18
4 BACNET.DR.CONTROL.4 Binary Value 0 7050 19
5 BACNET.DR.CONTROL.5 Binary Value 0 7050 20
Step 4: Create additional control points to allow exclusions from DR events In certain and/or unforeseen situations, building operators may want to disable certain DR strategies or exclude certain building systems from participating in DR events. This is equivalent to providing an “opt-out” ability during the DR event. For these situations, you can create additional control points, which will be used in PPCL as flags to enable/disable PPCL programming blocks to exclude certain systems and buildings.

Chapter 5 – Deploying Demand Response Strategies with the ADR Client Application
Siemens Industry, Inc. 69
For example, to exclude all HVAC systems in Building 60 from participating in all DR events, you can create additional control points such as DR.BLDG60.L1, DR.BLDG60.L2, and DR.BLDG60.L3. These points’ statuses will be checked first in PPCL before DR control actions are executed.
APOGEE Control Points
Sample Points
# Point Name Point Type Description
1 DR.BLDG60.L1 BO Enable/disable DR control strategy level 1 participation for Building 60
2 DR.BLDG60.L2 BO Enable/disable DR control strategy level 2 participation for Building 60
3 DR.BLDG60.L3 BO Enable/disable DR control strategy level 3 participation for Building 60
Sample PPCL Programming Blocks Sample PPCL programming blocks using the previous control points for enabling/disabling certain buildings and/or systems from participating in DR events. 00850 C DR.BLDG60.L1 is a virtual point to allow an operator to exclude BLDG60 from DR event
00900 IF (“DR.CONTROL.1” .EQ. ON .AND. “DR.BLDG60.L1” .EQ. ON) THEN GOSUB 2000
02000 C SUBROUTINE TO EXECUTE DR CONTROL STRATEGY 1 – TURN OFF EAST PERIMETER LIGHT
02010 OFF(“F1.PERIMETER.LGHT.EAST.STATUS”)
02050 RETURN
BACnet Control Points For BACnet jobs, you can create additional BACnet control points for disabling certain DR strategies or excluding certain building systems from participating in DR events. Be sure to record the BACnet Object Type, Network ID, Device ID, and Object ID.
Sample Points
# Point Name BACnet Object Type Network ID Device ID Object ID
1 BACNET.DR.BLDG60.L1 Binary Value 0 7050 22
2 BACNET.DR.BLDG60.L2 Binary Value 0 7050 23
3 BACNET.DR.BLDG60.L3 Binary Value 0 7050 24
Step 5: Decide how to implement DR control actions As discussed earlier in this chapter, with the ADR Client application, you will have several options to automate DR control actions. For simple DR control strategies, you can command control points directly from the ADR Client application. For more complex DR control actions, implement a combination of commanding points from the ADR Client application and PPCL.

Automated Demand Response Using OpenADR Application Guide
70 Siemens Industry, Inc.
Sample Moderate DR Event DR Control Strategy Approach
Turn off perimeter light on all floors. Command APOGEE control points from PPCL.
Turn off all outdoor water fountain pumps. Command BACnet points from the ADR Client application.
Sample High DR Event DR Control Strategy Approach
Turn off perimeter lights on all floors. Command APOGEE control points from PPCL.
Turn off all outdoor water fountain pumps. Command BACnet control points from the ADR Client application.
Turn off 1 out of 3 interior light fixtures. Command APOGEE control points from PPCL.
Raise the room temperature cooling setpoint. Command APOGEE control points from the ADR Client application.
Raise the supply air temperature setpoint. Command BACnet control points from the ADR Client application.
Limit the maximum fan speed. Command BACnet control points from the ADR Client application.
Step 6: Determine offset times for DR control actions Offset times are used for two purposes in the ADR Client application:
• Executing DR control actions before the start of DR events and/or DR modes to ensure that the expected demand reduction is achieved by the start time.
• Minimizing the rebound effect at the end of DR events, when systems are returned to normal operating conditions.
Offset times are optional, and you can implement them at your discretion. See Chapter 3 for offset time suggestions for commonly-used DR control strategies.
NOTE: While Chapter 3 provides offset time suggestions, you must still determine the proper offset times for all DR control actions.
Offset Time Types and Potential Uses In the ADR Client application, there are several ways to specify offset times for DR control actions for each DR operation mode. The following table explains the differences between offset time types and their potential uses for various DR control actions.
Offset Time Type Purpose Potential Use
From DR Event Start Time
Ensure Expected Demand Reduction*
Any pre-cooling and/or pre-heating DR control strategies in which the system must reach a certain operating stage before the start of DR event in order to achieve the demand reduction by the start time.
From DR Event End Time
Minimize the Rebound Effect**
Most DR control actions. This type prevents systems from returning to normal operation at the same time, which creates a spike in power demand.
From DR Mode Start Time
Ensure Expected Demand Reduction‡
Almost every DR control strategy develops around changing control setpoint values. This type is usually needed to account for the fact that it would take some time for the HVAC system to fully react to new value of control setpoints, adjust the operation, and deliver the

Chapter 5 – Deploying Demand Response Strategies with the ADR Client Application
Siemens Industry, Inc. 71
Offset Time Type Purpose Potential Use
expected demand reduction.
From DR Mode End Time
Minimize the Rebound Effect§
All DR control actions. This allows systems to slowly return to normal operation after DR modes end.
* Specify a number, in minutes, to indicate how far ahead of the event start time DR control actions must be executed. ** Specify a number, in minutes, to indicate how long to wait after the DR event ends before returning the system to normal operating conditions. ‡ Specify a number, in minutes, to indicate how far ahead of the mode start time DR control actions must be executed. § Specify a number, in minutes, to indicate how long to wait after the DR mode ends before returning the system to normal operating conditions.
Sample Offset Times from DR Event/Mode Start DR Mode
Level DR Control Strategy Time
Reference Offset Time
Justification
Moderate Turn off perimeter lights on all floors.
DR Mode Start Time
5 Minutes Turning off lights results in instantaneous demand reduction.
Turn off all outdoor water fountain pumps.
DR Mode Start Time
0 Minutes Turning off pumps results in instantaneous demand reduction.
High Turn off perimeter lights on all floors.
DR Mode Start Time
5 Minutes Turning off lights results in instantaneous demand reduction.
Turn off all outdoor water fountain pumps.
DR Mode Start Time
0 Minutes Turning off pumps results in instantaneous demand reduction.
Turn off 1 out of 3 interior light fixtures.
DR Mode Start Time
5 Minutes Delay the impact to occupants until necessary.
Raise the room temperature cooling setpoint.
DR Mode Start Time
15 Minutes There is a lag time for HVAC air distribution systems and cooling plants to react to new setpoints. Raise the supply air
temperature setpoint. DR Mode Start Time
15 Minutes
Limit the maximum fan speed. DR Mode Start Time
0 Minutes Limiting the fan speed can take affect instantaneously.
Sample Offset Times from DR Event/Mode End DR Mode
Level DR Control Strategy Time
Reference Offset Time
Justification
Moderate Turn on perimeter lights on all floors.
DR Mode End Time
5 Minutes Allow other equipment to be turned on before the perimeter light.
Turn on all outdoor water fountain pumps.
DR Mode End Time
15 Minutes Allow other equipment to be turned on before the fountain pump.
High Turn on perimeter lights on all floors.
DR Mode End Time
5 Minutes Allow other equipment to be turned on before the perimeter light.
Turn on all outdoor water fountain pumps.
DR Event End Time
15 Minutes Water fountain pumps can be the last equipment to be turned on at the end of DR event.
Turn on all interior light fixtures.
DR Mode End Time
0 Minutes Restore lighting condition to the interior as soon as possible.
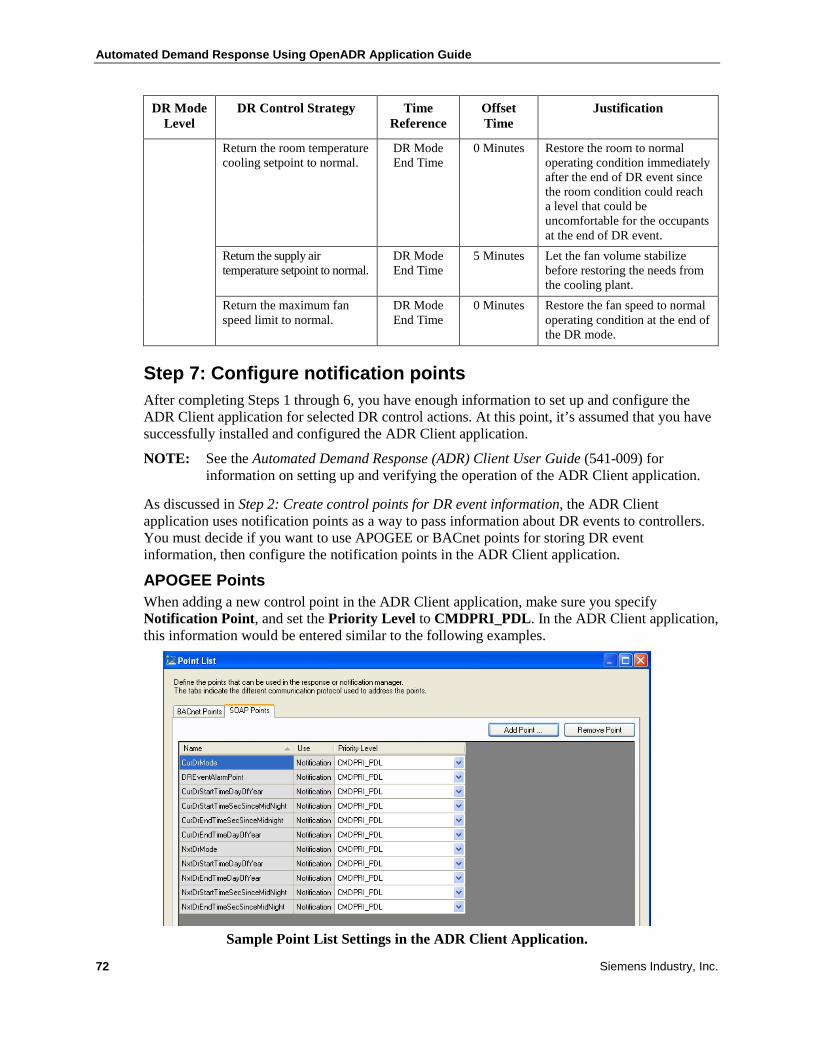
Automated Demand Response Using OpenADR Application Guide
72 Siemens Industry, Inc.
DR Mode Level
DR Control Strategy Time Reference
Offset Time
Justification
Return the room temperature cooling setpoint to normal.
DR Mode End Time
0 Minutes Restore the room to normal operating condition immediately after the end of DR event since the room condition could reach a level that could be uncomfortable for the occupants at the end of DR event.
Return the supply air temperature setpoint to normal.
DR Mode End Time
5 Minutes Let the fan volume stabilize before restoring the needs from the cooling plant.
Return the maximum fan speed limit to normal.
DR Mode End Time
0 Minutes Restore the fan speed to normal operating condition at the end of the DR mode.
Step 7: Configure notification points After completing Steps 1 through 6, you have enough information to set up and configure the ADR Client application for selected DR control actions. At this point, it’s assumed that you have successfully installed and configured the ADR Client application.
NOTE: See the Automated Demand Response (ADR) Client User Guide (541-009) for information on setting up and verifying the operation of the ADR Client application.
As discussed in Step 2: Create control points for DR event information, the ADR Client application uses notification points as a way to pass information about DR events to controllers. You must decide if you want to use APOGEE or BACnet points for storing DR event information, then configure the notification points in the ADR Client application.
APOGEE Points When adding a new control point in the ADR Client application, make sure you specify Notification Point, and set the Priority Level to CMDPRI_PDL. In the ADR Client application, this information would be entered similar to the following examples.
Sample Point List Settings in the ADR Client Application.

Chapter 5 – Deploying Demand Response Strategies with the ADR Client Application
Siemens Industry, Inc. 73
Sample Control Point Settings in the ADR Client Application.
Sample Notification Manager Settings in the ADR Client Application.
BACnet Points When adding a new control point in the ADR Client application, make sure you specify Notification Point, and set the Priority Level to 14 (which is equivalent to CMDPRI_PDL for APOGEE points). In the ADR Client application, this information would be entered similar to the following examples.

Automated Demand Response Using OpenADR Application Guide
74 Siemens Industry, Inc.
Sample Point List Settings in the ADR Client Application.
Sample Control Point Settings in the ADR Client Application.
Sample Notification Manager Settings in the ADR Client Application.

Chapter 5 – Deploying Demand Response Strategies with the ADR Client Application
Siemens Industry, Inc. 75
Step 8: Configure response points Before the ADR Client application can command control points to carry out DR control actions, you must configure the control points as response points.
APOGEE Points NOTE: In order to command TEC points from the ADR Client application, you must first
unbundle them.
When adding a new response point in the ADR Client application, make sure you specify Response Point, and have the following information ready:
• Point Name NOTE: APOGEE point names configured in the ADR Client application must exactly
match point names defined in the Insight database.
• Command Priority In the ADR Client application, this information would be entered similar to the following examples.
Sample Point List Settings in the ADR Client Application.
Sample Control Point Settings in the ADR Client Application.
BACnet Points When adding a new response point in the ADR Client application, make sure you specify Response Point, and have the following information ready:
• Point Name NOTE: Since the ADR Client application references each BACnet control point by other
values, the point names in the BACnet device and the ADR Client application do not have to exactly match. However, to avoid later confusion, it is strongly recommended you set up the names in both locations so that they exactly match.
• BACnet Object Type • Network ID

Automated Demand Response Using OpenADR Application Guide
76 Siemens Industry, Inc.
• Device ID • Object ID • BACnet Command Priority
In the ADR Client application, this information would be entered similar to the following examples.
Sample Point List Settings in the ADR Client Application.
Sample Control Point Settings in the ADR Client Application.
Step 9: Configure control points for DR control actions After completing Steps 1 through 8, you can configure DR control actions for DR operation modes. In the ADR Client application, each DR control action is defined as a control function of a DR operation mode (NORMAL, MODERATE, HIGH, or SPECIAL), control point, value to command the control point, and an offset time to command the control point. Consider each control action for each DR operation mode as an independent control action.
For each control point, the ADR Client application automatically creates a control action for the NORMAL operation mode, with a time reference of ACTIVE_DR_MODE with an offset time of 0. For BACnet points, the ADR Client application, by default, commands the points to Relinquish for the NORMAL operation mode.
NOTE: Operation conflicts between DR control actions for different DR operation modes during the DR event will be handled by the pre-defined logic implemented in the ADR Client application. For more information on how conflicts are handled, see the Automated Demand Response (ADR) Client User Guide (541-009).

Chapter 5 – Deploying Demand Response Strategies with the ADR Client Application
Siemens Industry, Inc. 77
Following are the scenarios for which you can configure DR control actions.
DR Control Actions without Offset Times For this scenario, specify the control point, DR operation mode, a time reference of ACTIVE_DR_MODE with an offset time of 0, and the value to which the control point must be commanded during the DR mode.
The following example shows an action for setting an AHU’s maximum fan speed for various DR operation modes.
Sample Settings in the ADR Client Application.
DR Control Actions with Offset Times from the Start and End of DR Modes For this scenario, specify three control actions for each DR operation mode:
• First Control Action. Specify the control point, DR operation mode, a time reference of ACTIVE_DR_MODE with an offset time of 0, and the value to which the control point must be commanded during the DR mode.
• Second Control Action. Specify the control point, DR operation mode, a time reference of START_TIME_DR_MODE with an offset time value to execute the control action before the start of the DR mode, and the value to which the control point must be commanded before the start of the DR mode.
• Third Control Action. Specify the control point, DR operation mode, a time reference END_TIME_DR_MODE with an offset time value to execute the control action after the end of the DR mode, and the value to which the control point must be commanded after the end of the DR mode.
The following example shows actions for setting an AHU’s supply air temperature setpoint for various DR operation modes.
Sample Settings in the ADR Client Application.
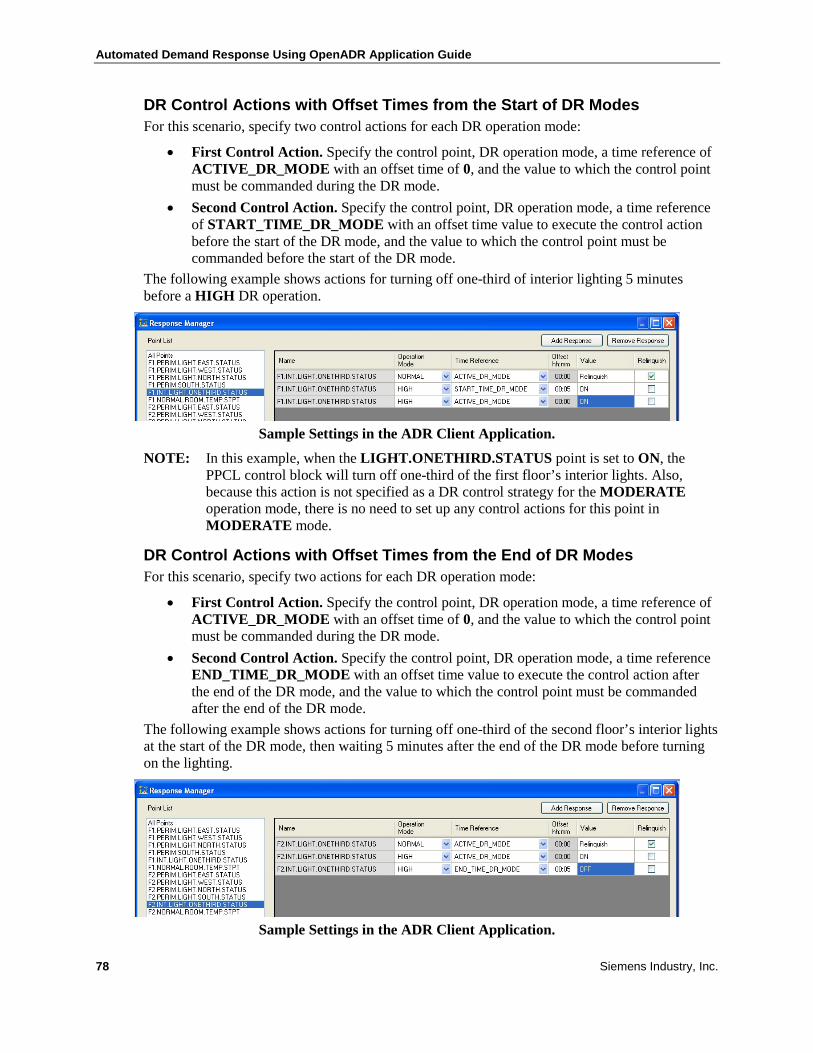
Automated Demand Response Using OpenADR Application Guide
78 Siemens Industry, Inc.
DR Control Actions with Offset Times from the Start of DR Modes For this scenario, specify two control actions for each DR operation mode:
• First Control Action. Specify the control point, DR operation mode, a time reference of ACTIVE_DR_MODE with an offset time of 0, and the value to which the control point must be commanded during the DR mode.
• Second Control Action. Specify the control point, DR operation mode, a time reference of START_TIME_DR_MODE with an offset time value to execute the control action before the start of the DR mode, and the value to which the control point must be commanded before the start of the DR mode.
The following example shows actions for turning off one-third of interior lighting 5 minutes before a HIGH DR operation.
Sample Settings in the ADR Client Application.
NOTE: In this example, when the LIGHT.ONETHIRD.STATUS point is set to ON, the PPCL control block will turn off one-third of the first floor’s interior lights. Also, because this action is not specified as a DR control strategy for the MODERATE operation mode, there is no need to set up any control actions for this point in MODERATE mode.
DR Control Actions with Offset Times from the End of DR Modes For this scenario, specify two actions for each DR operation mode:
• First Control Action. Specify the control point, DR operation mode, a time reference of ACTIVE_DR_MODE with an offset time of 0, and the value to which the control point must be commanded during the DR mode.
• Second Control Action. Specify the control point, DR operation mode, a time reference END_TIME_DR_MODE with an offset time value to execute the control action after the end of the DR mode, and the value to which the control point must be commanded after the end of the DR mode.
The following example shows actions for turning off one-third of the second floor’s interior lights at the start of the DR mode, then waiting 5 minutes after the end of the DR mode before turning on the lighting.
Sample Settings in the ADR Client Application.
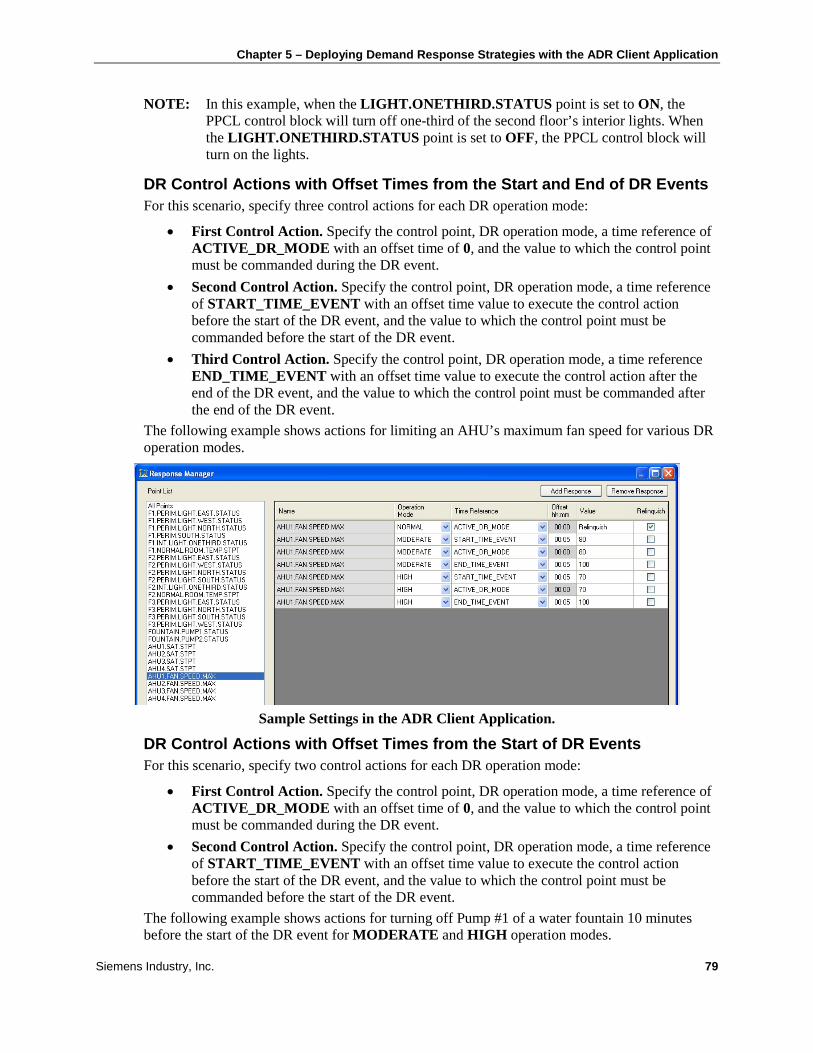
Chapter 5 – Deploying Demand Response Strategies with the ADR Client Application
Siemens Industry, Inc. 79
NOTE: In this example, when the LIGHT.ONETHIRD.STATUS point is set to ON, the PPCL control block will turn off one-third of the second floor’s interior lights. When the LIGHT.ONETHIRD.STATUS point is set to OFF, the PPCL control block will turn on the lights.
DR Control Actions with Offset Times from the Start and End of DR Events For this scenario, specify three control actions for each DR operation mode:
• First Control Action. Specify the control point, DR operation mode, a time reference of ACTIVE_DR_MODE with an offset time of 0, and the value to which the control point must be commanded during the DR event.
• Second Control Action. Specify the control point, DR operation mode, a time reference of START_TIME_EVENT with an offset time value to execute the control action before the start of the DR event, and the value to which the control point must be commanded before the start of the DR event.
• Third Control Action. Specify the control point, DR operation mode, a time reference END_TIME_EVENT with an offset time value to execute the control action after the end of the DR event, and the value to which the control point must be commanded after the end of the DR event.
The following example shows actions for limiting an AHU’s maximum fan speed for various DR operation modes.
Sample Settings in the ADR Client Application.
DR Control Actions with Offset Times from the Start of DR Events For this scenario, specify two control actions for each DR operation mode:
• First Control Action. Specify the control point, DR operation mode, a time reference of ACTIVE_DR_MODE with an offset time of 0, and the value to which the control point must be commanded during the DR event.
• Second Control Action. Specify the control point, DR operation mode, a time reference of START_TIME_EVENT with an offset time value to execute the control action before the start of the DR event, and the value to which the control point must be commanded before the start of the DR event.
The following example shows actions for turning off Pump #1 of a water fountain 10 minutes before the start of the DR event for MODERATE and HIGH operation modes.

Automated Demand Response Using OpenADR Application Guide
80 Siemens Industry, Inc.
Sample Settings in the ADR Client Application.
NOTE: In this example, because FOUNTAIN.PUMP1.STATUS is a BACnet binary value point, commanding it to Inactive is equivalent to commanding it to OFF.
DR Control Actions with Offset Times from the End of DR Events For this scenario, specify two control actions for each DR operation mode:
• First Control Action. Specify the control point, DR operation mode, a time reference of ACTIVE_DR_MODE with an offset time of 0, and the value to which the control point must be commanded during the DR event.
• Second Control Action. Specify the control point, DR operation mode, a time reference END_TIME_EVENT with an offset time value to execute the control action after the end of the DR event, and the value to which the control point must be commanded after the end of the DR event.
The following example shows actions for turning off Pump #2 of a water fountain at the start of a DR event, and keeping it off for 15 minutes after the end of DR event.
Sample Settings in the ADR Client Application.
Step 10: Write PPCL for DR control actions For complex DR control actions, it’s recommended that you write PPCL programs to ensure proper sequences of operation of DR control actions. As discussed in Step 3: Create additional control points for DR control actions, you can enable/disable sections of PPCL programming blocks to handle groups of DR control actions by using these additional control points. With the ADR Client application’s DR scheduling feature, these control points will be enabled and disabled at the appropriate times.

Chapter 5 – Deploying Demand Response Strategies with the ADR Client Application
Siemens Industry, Inc. 81
Sample PPCL Program 00850 PROCESS DR CONTROL ACTION
00900 IF (“DR.CONTROL.1” .EQ. ON) THEN GOSUB 2000
……………………………
02000 C SUBROUTINE TO EXECUTE DR CONTROL STRATEGY 1 – TURN OFF PERIMETER LIGHT, EAST, WEST, NORTH, THEN SOUTH WITH 1 MINUTE WAIT IN BETWEEN.
02010 OFF(“F1.PERIMETER.LGHT.EAST.STATUS”)
02020 WAIT(60, “F1.PERIMETER.LGHT.EAST.STATUS”, “F1.PERIMETER.LGHT.WEST.STATUS”, 00)
02030 WAIT(60, “F1.PERIMETER.LGHT.WEST.STATUS”, “F1.PERIMETER.LGHT.NORTH.STATUS”, 00)
02040 WAIT(60, “F1.PERIMETER.LGHT.NORTH.STATUS”, “F1.PERIMETER.LGHT.SOUTH.STATUS”, 00)
02050 RETURN
Step 11: Test DR strategies and publish DR test reports Most utilities require DR participants to submit demand reduction test reports for approval before paying incentives, and participants are required to follow certain test procedures. Typical steps, restrictions, and guidelines for testing may include the following23
• Testing occurs on a normal business day (M-F, 11-6 P.M., no holidays or weekends).
:
• Allocate time for utility test engineer to inspect and review DR strategies and system implementation prior to the start of testing.
• Customer employee(s) or outsourced on-site staff, not a controls contractor, initiates and ends all DR actions performed on site.
• The controls contractor, not customer, initiates and ends all DR actions performed remotely.
• The customer successfully pre-tests each and every DR measure, per the Test Plan, prior to testing.
• All tested equipment and programming must be permanent. Temporary power, equipment, controls, computers or software is not allowed. Equipment used for data acquisition above that required for full operation is acceptable.
• Once the testing begins, the equipment and controls must remain hands-off unless safety, health, or business reasons require otherwise. Setpoints cannot be manually changed once the test begins.
• Power and energy readings for use in determining DR, if the utility electric meter is not used, must be recorded in at least 15-minute intervals. Demand is calculated for average 15-minute demand (quarter hour energy (kWh)/4) in kW. Near real-time data is visible on-site by the use of a computer.
• Automated control cannot be converted to manual control during testing. If a control sequence fails, the customer can choose to stop testing or continue through the planned duration “as-is”.
• Testing of DR measures that are weather and time-independent, such as lighting, must be tested for at least two complete 15-minute demand intervals.
23 San Diego Gas & Electric. Demand Response Testing Plan: San Diego Gas & Electric Demand Response Program: Technology Incentives. 2006.

Automated Demand Response Using OpenADR Application Guide
82 Siemens Industry, Inc.
• HVAC DR measures must be tested for at least 6 15-minute demand intervals with at least 4 being in DR and at least 2 being in recovery.
• Testing of HVAC and other DR measures that generate air-conditioning loads should be tested simultaneously to increase the demand reduction.
• Retesting: One retest may be scheduled if the measured DR falls more than 10 percent below the testing goal. The same rules and guidelines apply to the retest that applied to the first test.
• Results from the tests must be submitted using the utilities’ issued/approved report templates.
Step 12: Create graphic screens for real-time monitoring (Optional) To monitor and verify demand reduction during DR events, use the Insight software’s Enhanced Graphics Option to create and present performance-monitoring dashboards to building operators. (See Chapter 4 for examples of DR performance dashboards.) As discussed earlier, you may be able to program real-time baseline and actual demand reduction calculations in PPCL, and present the information in the dashboards.
If you cannot easily program baseline value calculations in PPCL, you must create virtual control points for entering baseline values, after which calculation of actual demand reduction can be handled in PPCL using the baseline values and actual demand measurements from metering and sub-metering devices.

Appendix A – Sample Building Data for Deploying Demand Response Strategies
Siemens Industry, Inc. 83
Appendix A – Sample Building Data for Deploying Demand Response Strategies
To illustrate how you can set up the ADR Client application for automated DR in Chapter 5 – Deploying Demand Response Strategies with the ADR Client Application, this appendix describes a sample building and its data, operating schedules, HVAC and BAS systems, and DR strategies. The sample building’s information is based on the DR workflow described in Chapter 4 – Typical Workflow for Implementing Demand Response Strategies.
Building Data Item Data
Building ID 100001
Building Type Large Commercial Office
Date of Audit 02/23/2011
City San Diego
State CA
Owned or Leased? Owned
Number of Floors 4
Gross Floor Area (sq. ft.) 250000
Total Conditioned Area (sq. ft.) 200000
Conditioned Area: Heated Only (sq. ft.) −
Conditioned Area: Cooled Only (sq. ft.) 134000
Conditioned Area: Heated and Cooled (sq. ft.) 66000
Number of Conditioned Floors: Above Grade 4
Number of Conditioned Floors: Below Grade 0
Year of Construction 2000
Date of Last Major Renovation or Addition −
Description of Building Structures Steel structure with glass exterior
Building Automation System Installed? (Y or N) Yes
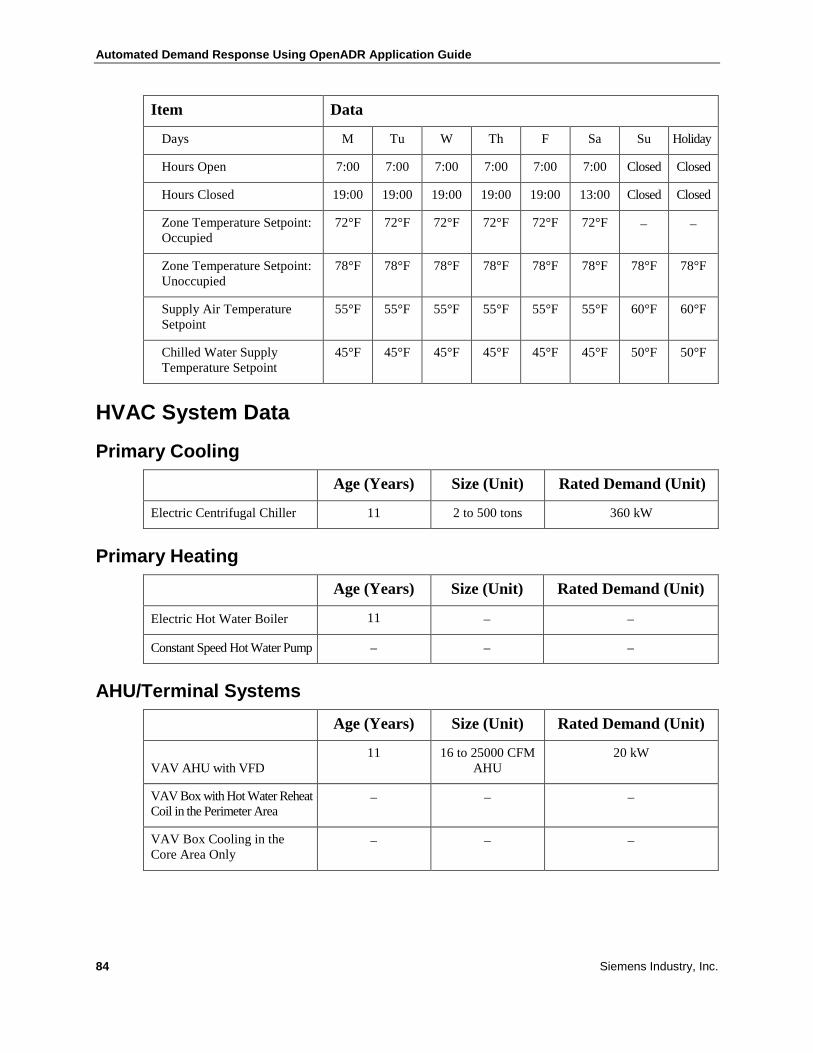
Automated Demand Response Using OpenADR Application Guide
84 Siemens Industry, Inc.
Item Data
Days M Tu W Th F Sa Su Holiday
Hours Open 7:00 7:00 7:00 7:00 7:00 7:00 Closed Closed
Hours Closed 19:00 19:00 19:00 19:00 19:00 13:00 Closed Closed
Zone Temperature Setpoint: Occupied
72°F 72°F 72°F 72°F 72°F 72°F − −
Zone Temperature Setpoint: Unoccupied
78°F 78°F 78°F 78°F 78°F 78°F 78°F 78°F
Supply Air Temperature Setpoint
55°F 55°F 55°F 55°F 55°F 55°F 60°F 60°F
Chilled Water Supply Temperature Setpoint
45°F 45°F 45°F 45°F 45°F 45°F 50°F 50°F
HVAC System Data
Primary Cooling Age (Years) Size (Unit) Rated Demand (Unit)
Electric Centrifugal Chiller 11 2 to 500 tons 360 kW
Primary Heating Age (Years) Size (Unit) Rated Demand (Unit)
Electric Hot Water Boiler 11 − −
Constant Speed Hot Water Pump − − −
AHU/Terminal Systems Age (Years) Size (Unit) Rated Demand (Unit)
VAV AHU with VFD 11 16 to 25000 CFM
AHU 20 kW
VAV Box with Hot Water Reheat Coil in the Perimeter Area
− − −
VAV Box Cooling in the Core Area Only
− − −
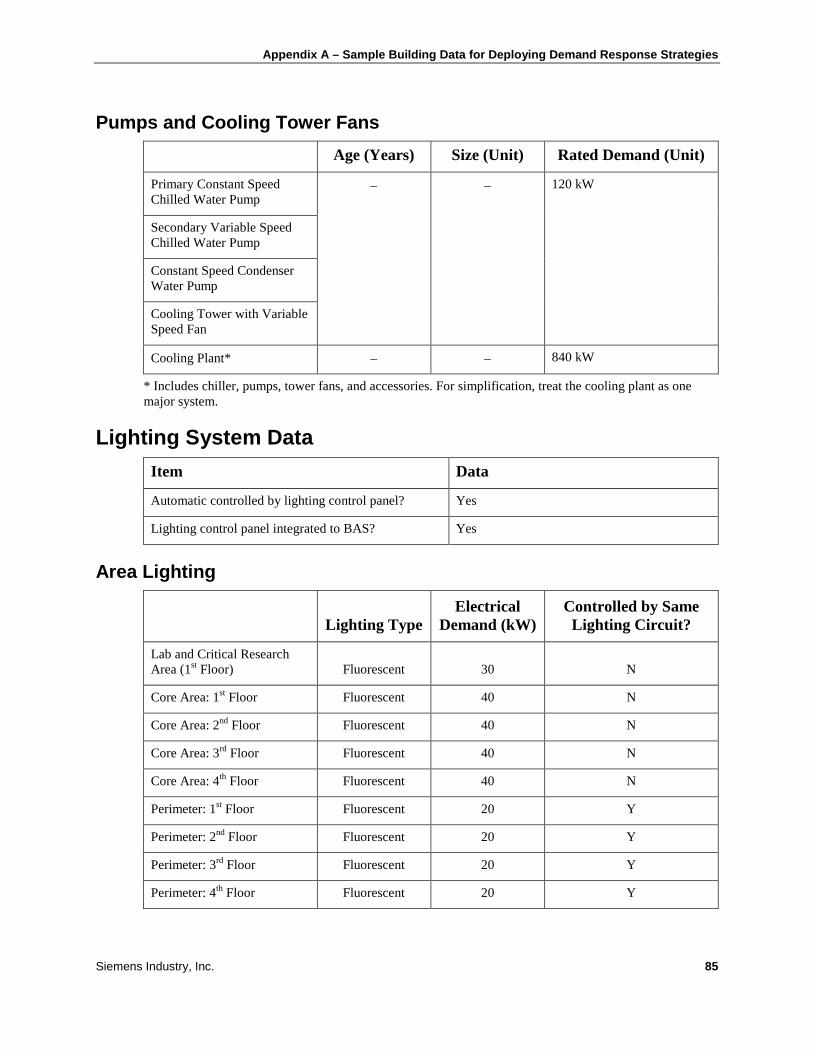
Appendix A – Sample Building Data for Deploying Demand Response Strategies
Siemens Industry, Inc. 85
Pumps and Cooling Tower Fans Age (Years) Size (Unit) Rated Demand (Unit)
Primary Constant Speed Chilled Water Pump
− − 120 kW
Secondary Variable Speed Chilled Water Pump
Constant Speed Condenser Water Pump
Cooling Tower with Variable Speed Fan
Cooling Plant* − − 840 kW
* Includes chiller, pumps, tower fans, and accessories. For simplification, treat the cooling plant as one major system.
Lighting System Data Item Data
Automatic controlled by lighting control panel? Yes
Lighting control panel integrated to BAS? Yes
Area Lighting
Lighting Type Electrical
Demand (kW) Controlled by Same
Lighting Circuit?
Lab and Critical Research Area (1st Floor) Fluorescent 30 N
Core Area: 1st Floor Fluorescent 40 N
Core Area: 2nd Floor Fluorescent 40 N
Core Area: 3rd Floor Fluorescent 40 N
Core Area: 4th Floor Fluorescent 40 N
Perimeter: 1st Floor Fluorescent 20 Y
Perimeter: 2nd Floor Fluorescent 20 Y
Perimeter: 3rd Floor Fluorescent 20 Y
Perimeter: 4th Floor Fluorescent 20 Y
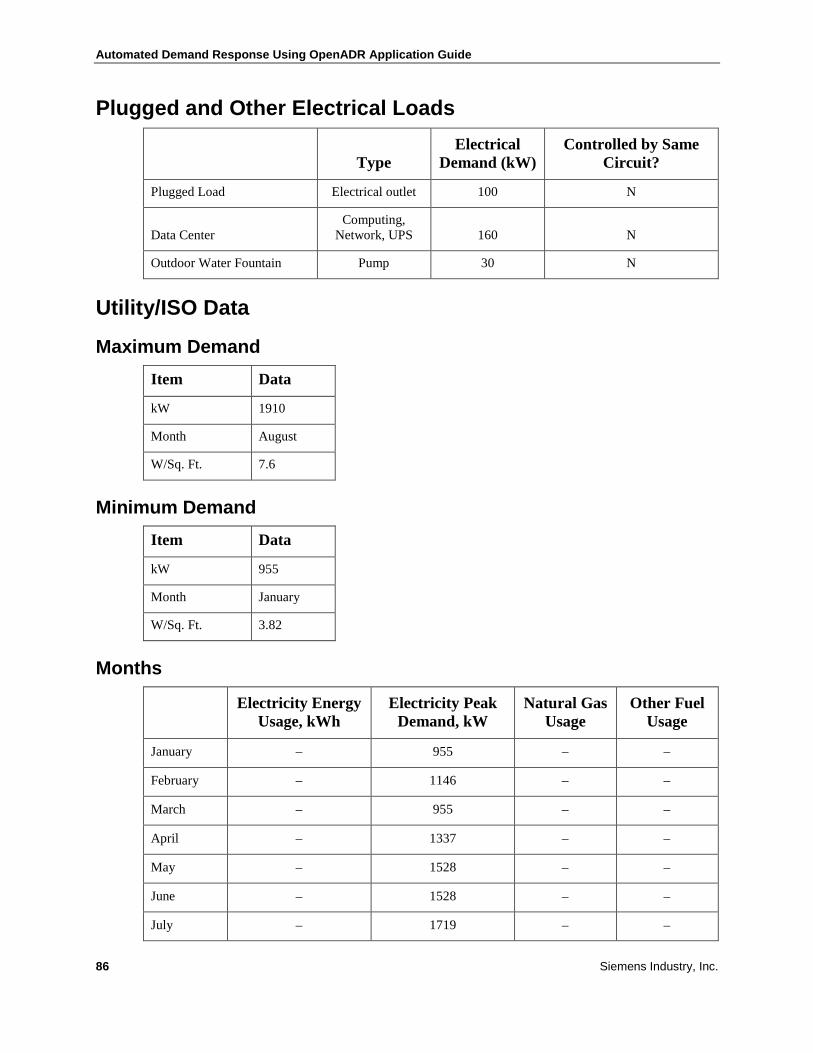
Automated Demand Response Using OpenADR Application Guide
86 Siemens Industry, Inc.
Plugged and Other Electrical Loads
Type Electrical
Demand (kW) Controlled by Same
Circuit?
Plugged Load Electrical outlet 100 N
Data Center Computing,
Network, UPS 160 N
Outdoor Water Fountain Pump 30 N
Utility/ISO Data
Maximum Demand Item Data
kW 1910
Month August
W/Sq. Ft. 7.6
Minimum Demand Item Data
kW 955
Month January
W/Sq. Ft. 3.82
Months
Electricity Energy
Usage, kWh Electricity Peak
Demand, kW Natural Gas
Usage Other Fuel
Usage
January − 955 − −
February − 1146 − −
March − 955 − −
April − 1337 − −
May − 1528 − −
June − 1528 − −
July − 1719 − −
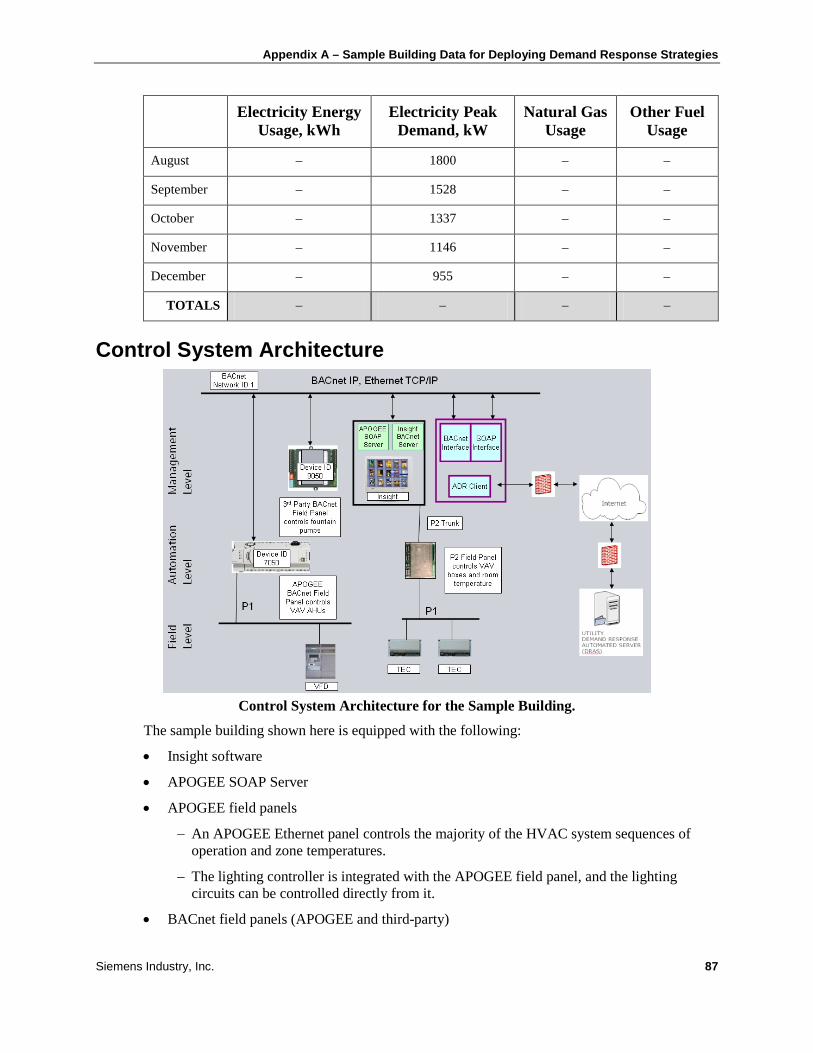
Appendix A – Sample Building Data for Deploying Demand Response Strategies
Siemens Industry, Inc. 87
Electricity Energy
Usage, kWh Electricity Peak
Demand, kW Natural Gas
Usage Other Fuel
Usage
August − 1800 − −
September − 1528 − −
October − 1337 − −
November − 1146 − −
December − 955 − −
TOTALS − − − −
Control System Architecture
Control System Architecture for the Sample Building.
The sample building shown here is equipped with the following:
• Insight software
• APOGEE SOAP Server
• APOGEE field panels
− An APOGEE Ethernet panel controls the majority of the HVAC system sequences of operation and zone temperatures.
− The lighting controller is integrated with the APOGEE field panel, and the lighting circuits can be controlled directly from it.
• BACnet field panels (APOGEE and third-party)

Automated Demand Response Using OpenADR Application Guide
88 Siemens Industry, Inc.
− The APOGEE BACnet field panel connected to a VFD controller (with a P1 integration driver) controls the VAV AHU.
− A third-party BACnet device controls the fountain pumps.
Recommended DR Control Strategies In this scenario, it’s assumed that the strategies are recommended and accepted by the building owner and operator.
Selected DR Strategies Strategy
# Description Estimated Demand
Reduction (kW)
1 Turn off perimeter lights on all floors. 113 kW (80 kW from lighting, 20 to 40 kW from cooling
plant reduction)
2 Turn off 1 out of 3 interior light fixtures on all floors, except those in critical and lab areas.
60 kW (40 kW from lighting, 10 to 30 kW from cooling
plant reduction)
3 Turn off all outdoor water fountain pumps. 30 kW
4 For the cooling season: Raise the room temperature setpoint of all non-critical areas by 4°F.
40 to 100 kW
5 ▪ For the cooling season: Raise the supply air temperature setpoint of the VAV AHU by 4°F.
▪ Limit the maximum fan speed of the VAV AHU to 75%.
▪ You cannot change the supply air temperature and operating parameters of the VAV AHUs that supply lab areas.
40 to 100 kW
DR Strategies Mapped to DR Mode Levels The DR strategies from the previous section will be deployed for the following DR modes.
DR Mode Level Strategy # Target Demand Reduction
Moderate 1, 2, 3 110 to150 kW
High 1, 2, 3, 4, 5 250 to 350 kW
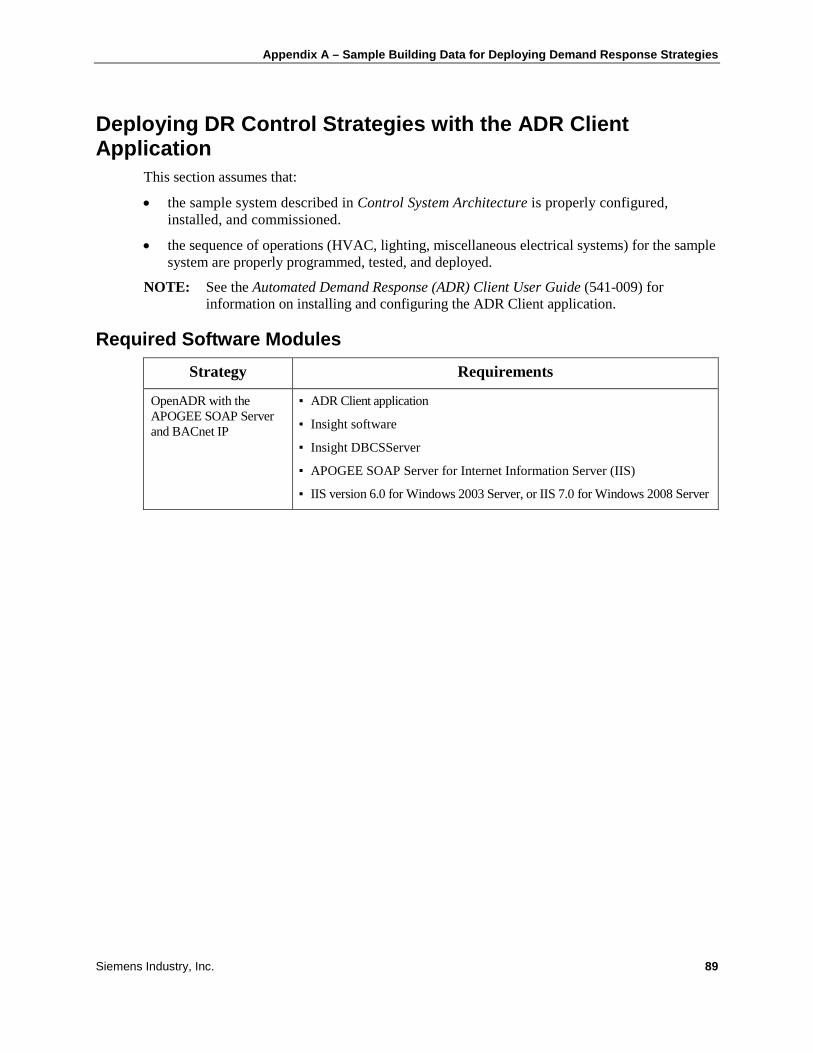
Appendix A – Sample Building Data for Deploying Demand Response Strategies
Siemens Industry, Inc. 89
Deploying DR Control Strategies with the ADR Client Application
This section assumes that:
• the sample system described in Control System Architecture is properly configured, installed, and commissioned.
• the sequence of operations (HVAC, lighting, miscellaneous electrical systems) for the sample system are properly programmed, tested, and deployed.
NOTE: See the Automated Demand Response (ADR) Client User Guide (541-009) for information on installing and configuring the ADR Client application.
Required Software Modules Strategy Requirements
OpenADR with the APOGEE SOAP Server and BACnet IP
▪ ADR Client application
▪ Insight software
▪ Insight DBCSServer
▪ APOGEE SOAP Server for Internet Information Server (IIS)
▪ IIS version 6.0 for Windows 2003 Server, or IIS 7.0 for Windows 2008 Server
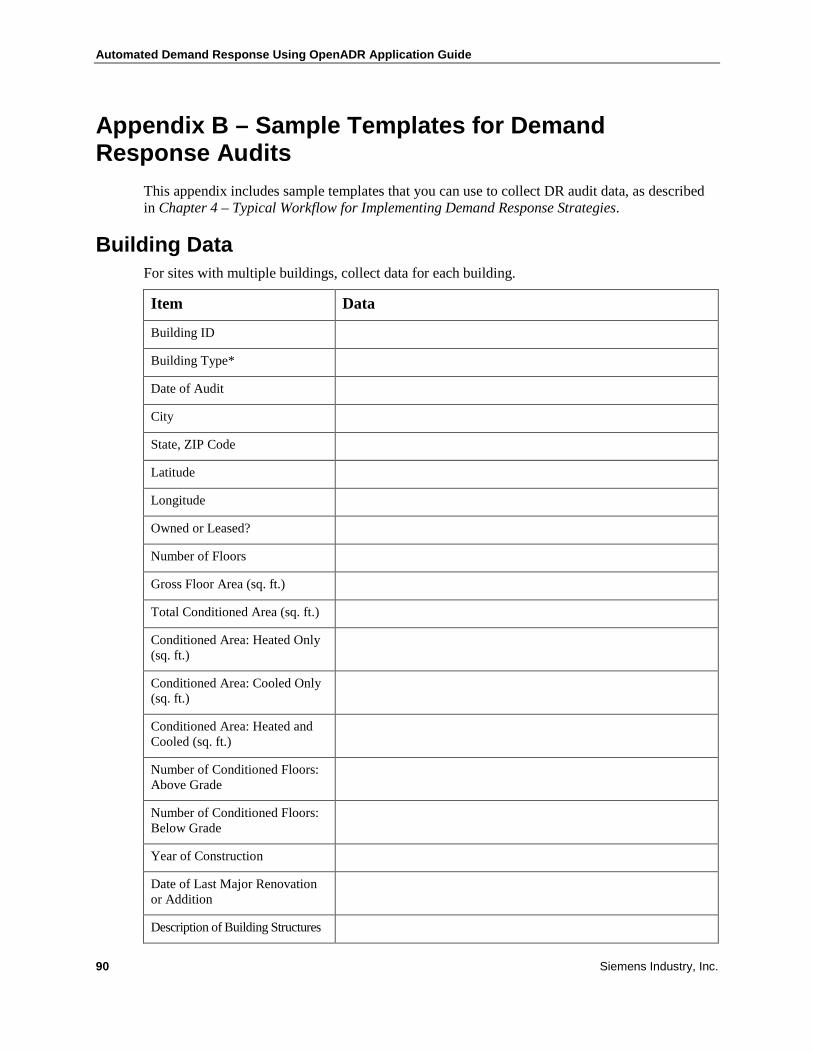
Automated Demand Response Using OpenADR Application Guide
90 Siemens Industry, Inc.
Appendix B – Sample Templates for Demand Response Audits
This appendix includes sample templates that you can use to collect DR audit data, as described in Chapter 4 – Typical Workflow for Implementing Demand Response Strategies.
Building Data For sites with multiple buildings, collect data for each building.
Item Data
Building ID
Building Type*
Date of Audit
City
State, ZIP Code
Latitude
Longitude
Owned or Leased?
Number of Floors
Gross Floor Area (sq. ft.)
Total Conditioned Area (sq. ft.)
Conditioned Area: Heated Only (sq. ft.)
Conditioned Area: Cooled Only (sq. ft.)
Conditioned Area: Heated and Cooled (sq. ft.)
Number of Conditioned Floors: Above Grade
Number of Conditioned Floors: Below Grade
Year of Construction
Date of Last Major Renovation or Addition
Description of Building Structures

Appendix B – Sample Templates for Demand Response Audits
Siemens Industry, Inc. 91
Item Data
Schedule During Months of
Days M Tu W Th F Sa Su Holiday
Hours Open
Hours Closed
Peak # of Occupants
Avg. # of Occupants When Open
* As characterized by at least 51% of conditioned space.
HVAC System Data
Primary Cooling Age (Years) Size (Unit) Rated Demand (Unit)
Centrifugal Chiller
Reciprocating Chiller
Screw Chiller
Absorption Chiller
Package DX
Split DX
Air-cooled Heat Rejection
Water-cooled Heat Rejection
Package DX VRV
Primary Heating Age (Years) Size (Unit) Rated Demand (Unit)
Hot Water Boiler
Steam Boiler
Furnace
Ground Source Heat Pump
Air Source Heat Pump
Re-circulating Water Source Heat Pump

Automated Demand Response Using OpenADR Application Guide
92 Siemens Industry, Inc.
AHU/Terminal Systems Age (Years) Size (Unit) Rated Demand (Unit)
Single Zone
Multi Zone
Dual Duct
VAV with VFD
Reheat (electric)
Fan Coil Units
Unit Ventilators
Package Terminal Air Conditioners
Steam/Hot Water Radiators/Convectors
Above System(s) with Economizer
VAV with Inlet Vane Damper
VAV with Discharge Damper
VRV Fan Coil Units
Exhaust Systems Age (Years) Size (Unit) Rated Demand (kW/HP)
Fume Hoods, Constant Volume
Fume Hoods, VAV
Kitchen Hoods
Toilet
Locker
General

Appendix B – Sample Templates for Demand Response Audits
Siemens Industry, Inc. 93
Pumps Age (Years) Size (Unit) Rated Demand (Unit)
Primary Chilled Water
Secondary Chilled Water
Condenser Water
Tertiary
Cooling Tower Fans Age (Years) Size (Unit) Rated Demand (Unit)
Single Speed
Multiple Speed
Variable Speed
Lighting System Data Collect data for each major controllable lighting circuit.
Item Data
Average Installed Load (W/ft²)*
Switches accessible to more than 51% of occupants? Yes No
Automatic controlled by lighting control panel? Yes No
Lighting control panel integrated to BAS? Yes No
* Including ballast in more than 51% of occupied space.
Area Lighting NOTE: Lighting types include fluorescent, incandescent, mercury vapor, sodium, metal halide,
LED, and others.
Lighting Type Electrical
Demand (kW) % of Building
Electrical Demand
Office Area
Core Area

Automated Demand Response Using OpenADR Application Guide
94 Siemens Industry, Inc.
Plugged and Other Electrical Loads Age (Years) Size (Unit) Rated Demand or Efficiency
Cogeneration
On-site Generation
Active Solar Equipment
Thermal Storage
Electrical Storage
Plugged Electrical Load
Utility/ISO Data You will need copies of utility bills to complete this section.
Item Data
Building ID
Electric Utility Name
Electric Utility Rate or Tariff
Number of Electric Meters
Natural Gas Utility Name
Natural Gas Utility Rate or Tariff
Number of Natural Gas Meters

Appendix B – Sample Templates for Demand Response Audits
Siemens Industry, Inc. 95
Energy Types
Total
Annual Use Units
Conversion Multiplier to
Thousand Btu Thousand
BTU (kBtu)
Total Annual Cost ($)
Electricity: Energy Usage
Electricity: Peak Demand
Natural Gas
Purchased Steam
Purchased Hot Water
Purchased Chilled Water
Oil # (Insert here)
Propane
Coal
Other
TOTALS
Indices Measure Metric
Energy Utilization Index (A ÷ Gross Floor Area) kBtu/sq. ft./year
Energy Cost Index (B ÷ Gross Floor Area) $/sq. ft./year
Total Water Use kGal/yr
Water Use Index kGal/year
Water Cost Index $/year
Cost Index, Including Water (B + C) ÷ (Gross Floor Area) $/sq. ft./year
Maximum Demand Item Data
kW
kVA
Month
W/Sq. Ft.

Automated Demand Response Using OpenADR Application Guide
96 Siemens Industry, Inc.
Minimum Demand Item Data
kW
kVA
Month
W/Sq. Ft.
Months
Electricity Energy
Usage, kWh Electricity Peak
Demand, kW Natural Gas
Usage Other Fuel
Usage
January
February
March
April
May
June
July
August
September
October
November
December
TOTALS

Appendix B – Sample Templates for Demand Response Audits
Siemens Industry, Inc. 97
Sub-Metering
Meter Name Major End-Use
System
% of Electrical Demand
Electricity kW
% of Electrical
Energy Usage
Electricity Energy
Usage, kWh
Ventilation
Cooling
Boiler
Space Heating
Lighting
Office Equipment
Other
TOTALS

Automated Demand Response Using OpenADR Application Guide
98 Siemens Industry, Inc.
Glossary AHU
Air Handling Unit.
Auto-DR See Automated Demand Response.
Automated Demand Response (Auto-DR) Fully-automated demand response that uses proprietary technologies and/or software systems.
BACnet Open data communication protocol for building automation and control networks. This ASHRAE standard (135-1995) allows building automation equipment from multiple manufacturers to work together as a coherent system.
BACnet MS/TP BACnet Master-Slave/Token-Passing (MS/TP). The BACnet MS/TP protocol uses a token-passing scheme to control access to a bus network. A master device that holds the token can initiate the transmission of a data frame. All other master and slave devices on the network can respond to requests from this master by transmitting data.
BAS Building Automation System.
bandwidth Amount of data that can be transmitted in a fixed amount of time. For digital devices, the bandwidth is usually expressed in bits per second (bps) or bytes per second. For analog devices, the bandwidth is expressed in cycles per second, or Hertz (Hz).
business logic In Auto-DR tests, it determines EMCS actions based on price and business rules.
CA ISO California Independent Systems Operator.
client (computer) Part of client-server architecture. Typically, a client is an application that runs on a workstation and relies on a server to perform some operations. For example, an e-mail client is an application that enables you to send and receive e-mail. In Auto-DR tests, clients at each site poll the server for current pricing information. See also Server.
Glossary
Siemens Industry, Inc. 99
client/server software architecture Versatile message-based modular architecture based on a tired concept between clients and servers, which allows for flexibility, interoperability, scalability, and usability, as opposed to centralized mainframe-based shared system architecture.
CLIR Client and Logic with Integrated Relay. The hardware interface DRAS Software-Client for less sophisticated controls to convert Internet signals to relay-based signals.
Co-lo See Co-Location.
co-location Server, usually a Web server, that is located at a dedicated facility designed with resources which include a secured cage or cabinet, regulated power, dedicated Internet connection, security, and support. These co-location facilities offer a secure place to physically house hardware and equipment, as opposed to locating it in offices or warehouses where the potential for fire, theft, or vandalism is increased.
data logging Process by which I/O points are logged into a database.
DMZ Demilitarized zone. A computer or small sub-network that sits between a trusted internal network, such as a corporate private LAN, and an untrusted external network, such as the Internet. Typically, a DMZ contains devices accessible to Internet traffic, such as Web servers.
DOE U.S. Department of Energy.
DR Demand Response.
DRRC Demand Response Research Center of the Lawrence Berkeley National Laboratory.
DRAS Demand Response Automation Server that receives the DR event related signals from utilities or CA ISO and publishes the services that are used by participating clients within customers.
DRAS Web Service Software-Client Secure software on client’s computer within a building, which polls DRAS-published services at the participant’s site.
Automated Demand Response Using OpenADR Application Guide
100 Siemens Industry, Inc.
EIS Energy Information System.
EMCS Energy Management and Control System.
gateway Used in building telemetry systems, a gateway connects two otherwise incompatible networks (networks with different protocols) and allows communications between them. It also provides translation and usually abstraction of messages passed between two networks, and often provides other features such as data logging and control and monitoring of I/O points.
generation In electronics, computer equipment, and software, this describes a major upgrade for which previous versions may or may not be compatible.
high availability Used to quantify the “uptime” for computer servers and systems and is a requirement for operation of critical systems. High availability systems are often described in terms of the number of “nines” of availability; for example, four 9s or 99.99% means less than one hour of unscheduled downtime per year.
HVAC Heating, Ventilation, and Air Conditioning.
I/O Input/Output. Used in the controls industry and refers to input such as sensors, and output such as actuators.
I/O Controller Input/Output Controller. Device that measures input values from sensors and commands outputs such as temperature control valves, usually to maintain a defined setpoint.
IP I/O Device Measures input (for example, electric meter data) and controls output (such as relays) that can be measured and actuated remotely over a LAN, WAN, or Internet using Internet Protocols (IP).
IP Relay Device with a relay(s) that can be actuated remotely over a LAN, WAN, or Internet using Internet Protocols (IP).
ISO Independent System Operator.

Glossary
Siemens Industry, Inc. 101
LBNL Lawrence Berkeley National Laboratory.
LEED Leadership in Energy and Environmental Design.
load balancing Method of distributing processing and communications activity evenly across a computer network so that no single device is overwhelmed. This is especially important for networks where it’s difficult to predict the number of requests that will be issued to a server. Busy Web sites typically employ two or more Web servers in a load balancing scheme so that if one server becomes overloaded, requests are forwarded to another server with more capacity. Load balancing can also refer to the communications channels themselves.
machine-to-machine (M2M) Describes the technologies that enable computers, embedded processors, smart sensors, actuators and mobile devices to communicate with one another, take measurements, and make decisions, often without human intervention.
MCC Motor Control Center.
Modbus Open standard control network protocol. Modbus is a common interface with electrical equipment such as meters and generators, and is rarely used for complete building EMCSs.
modem Hardware device that allows computers to communicate with one another over the public switched telephone network (PSTN).
NOC Network Operations Center. Physical space from which a typically large telecommunications network is managed, monitored, and supervised. Among other things, the NOC coordinates network troubles, provides problem management and router configuration services, and manages network changes. NOCs also provide network accessibility to users connecting to the network from outside of the physical office space or campus.
oBIX Open Building Information Exchange. Industry-wide initiative to define open XML- and Web services-based mechanisms for building control systems.
ODBC Open Database Connectivity. Database access method developed by Microsoft Corporation, which makes it possible to access any data from any application, regardless of which database

Automated Demand Response Using OpenADR Application Guide
102 Siemens Industry, Inc.
management system (DBMS) is handling the data. For this to work, both the application and the DBMS must be ODBC-compliant—that is, the application must be capable of issuing ODBC commands and the DBMS must be capable of responding to them. Since version 2.0, the standard supports SAG SQL.
OpenADR Open Automated Demand Response. Uses open standard, platform-independent, and transparent end-to-end technologies and/or software systems.
open protocol Communications protocol used to communicate between devices of any compliant manufacturer or organization. Open protocols are published in a public forum for use by all interested parties.
PG&E Pacific Gas & Electric.
point mapping Process by which I/O points are mapped to another system or protocol.
poll Method by which one computer gets information from another.
polling client In Auto-DR tests, the software that polls the server to get price information.
price server In Auto-DR tests, the common source of current price information.
protocol (data communication) Set of rules governing the exchange of data over a computer network.
publish and subscribe System based on existing DRAS SOA that refers to the basic implementation of the messaging terminology that forms a small part of the middleware to ease and facilitate the service extensibility to users using secure/authenticated Web services.
pull architecture In client-server architecture, the client “pulls” information from the server by polling. See also Poll.
pulse Contact closures that are measured by an I/O device. Pulses are often produced by electric meters and other devices to indicate a given unit of measurement; for example, 1 pulse = 1 kWh.

Glossary
Siemens Industry, Inc. 103
real-time In real-time control and monitoring systems, data is measured, displayed, and controlled at a rate fast enough that the system latencies are negligible compared with the process at hand. Acceptable latency can vary substantially based on the type of process; for example, from 1 millisecond to several minutes.
SDG&E San Diego Gas & Electric.
SCE Southern California Edison.
sensor Device that responds to a physical stimulus—such as heat, light, sound, pressure, magnetism, or a particular motion—and transmits a resulting impulse for measurement or operating a control.
server (computer) Part of client-server architecture. Typically, a server is a computer program running as a service, to serve the needs or requests of other applications or computers (referred to in this context as “clients”) which may or may not be running on the same computer. In Auto-DR tests, pricing information was served from a Web services server. See also Client.
SOA Service Oriented Architecture. Architectural style whose goal is to achieve loose coupling among interacting software agents. A service is a unit of work done by a service provider to achieve desired end results for a service consumer. Both provider and consumer are roles played by software agents on behalf of their owners.
setpoint Target value that an I/O controller attempts to maintain. Set point values—such as temperature, pressure, etc.—are maintained through adjustments of the final control elements—such as temperature control valves, dampers, etc.
SOAP Simple Object Access Protocol. Specification for exchanging structured information in the implementation of Web services in computer networks that relies on Extensible Markup Language (XML) for its message format. For message negotiation and transmission, it usually relies on other Application Layer protocols, most notably Remote Procedure Call (RPC) and Hypertext Transfer Protocol (HTTP).
systems integrator Type of business that designs, installs, and configures computer and control systems, usually with components and software from multiple vendors.

Automated Demand Response Using OpenADR Application Guide
104 Siemens Industry, Inc.
TCP/IP Transmission Control Protocol/Internet Protocol. Set of protocols and standards responsible for interpreting data packets over the network and communicating them to any computer on the network.
telemetry Communications process that enables monitoring and/or controlling of remote or inaccessible sensors and/or actuators. Often uses radio frequency signals or Internet technologies for communications.
time stamp Digital message that indicates the time in which a given computer transaction occurred. The time stamp message is usually associated and stored with the original transaction record.
translation Process by which I/O points are translated to another system or protocol. Translation changes messages in one protocol to the same messages in another.
UTC Coordinated Universal Time, abbreviated UTC. Basis for the worldwide system of civil time and is determined using highly precise atomic clocks. UTC differs from Greenwich Mean Time (GMT) in that GMT is based on the rotation of the Earth, which is substantially less accurate than atomic clocks. When GMT differs from UTC by more than 0.9 seconds, UTC is re-calibrated by adding a leap second so that it is closer to the Earth’s rotation.
VAV Variable Air Volume.
VFD Variable Frequency Drive.
VPN Virtual Private Network. Network which allows employees to access their company’s internal networks and computers over the Internet or other public network, using encryption to keep data secure.
WAN Wide Area Network. Network that spans a relatively large geographical area. Typically, a WAN consists of two or more local-area networks (LANs). The largest WAN in existence is the Internet, which is open to the public. Private and corporate WANs use dedicated leased lines or other means of assuring that the network is only available to authorized users of the organization.

Glossary
Siemens Industry, Inc. 105
Web Services Set of self-describing and self-contained modular applications that can be easily integrated with other Web services to create objects and processes, and upon which the infrastructure of the Auto-DR system is based.
XML Extensible Markup Language. Flexible method for creating and sharing common information formats and data over the Internet, intranets, and elsewhere. An XML file can be processed purely as data, stored with similar data, or displayed (like an HTML file).


