Department of State Development, Manufacturing ... · arrangements and effective delivery of an...
124
Department of State Development, Manufacturing, Infrastructure and Planning Cairns Marine Precinct Growth Strategy (DSD-4692-16) Final Report NOT GOVERNMENT POLICY November 2018
Transcript of Department of State Development, Manufacturing ... · arrangements and effective delivery of an...

Department of State Development, Manufacturing, Infrastructure and Planning
Cairns Marine Precinct Growth Strategy (DSD-4692-16) Final Report
NOT GOVERNMENT POLICY
November 2018

GHD | Report for DSDMIP - Cairns Marine Precinct Growth Strategy (DSD-4692-16), 4219953 | i
Disclaimer This report: has been prepared by GHD for the Department of State Development, Manufacturing, Infrastructure and Planning (DSDMIP) and may only be used and relied on by DSDMIP for the purpose agreed between GHD and the DSDMIP as set out in Section 1.2 of this report. GHD otherwise disclaims responsibility to any person other than the DSDMIP arising in connection with this report. GHD also excludes implied warranties and conditions, to the extent legally permissible.
The services undertaken by GHD in connection with preparing this report were limited to those specifically detailed in the report and are subject to the scope limitations set out in the report. The opinions, conclusions and any recommendations in this report are based on conditions encountered and information reviewed at the date of preparation of the report. GHD has no responsibility or obligation to update this report to account for events or changes occurring subsequent to the date that the report was prepared.
The opinions, conclusions and any recommendations in this report are based on assumptions made by GHD described in this report (refer Section 1.2.1 of this report). GHD disclaims liability arising from any of the assumptions being incorrect.
GHD has prepared this report on the basis of information provided by DSDMIP and others who provided information to GHD (including Government authorities)], which GHD has not independently verified or checked beyond the agreed scope of work. GHD does not accept liability in connection with such unverified information, including errors and omissions in the report which were
The opinions, conclusions and any recommendations in this report are based on information obtained from, and testing undertaken at or in connection with, specific sample points. Site conditions at other parts of the site may be different from the site conditions found at the specific sample points. Investigations undertaken in respect of this report are constrained by the particular site conditions, such as the location of buildings, services and vegetation. As a result, not all relevant site features and conditions may have been identified in this report. Site conditions (including the presence of hazardous substances and/or site contamination) may change after the date of this Report. GHD does not accept responsibility arising from, or in connection with, any change to the site conditions. GHD is also not responsible for updating this report if the site conditions change.

GHD | Report for DSDMIP - Cairns Marine Precinct Growth Strategy (DSD-4692-16), 4219953 | ii
Executive summary Background
The Queensland Government through the Department of State Development, Manufacturing, Infrastructure and Planning (DSDMIP) have initiated a Growth Strategy project for the Cairns Marine Precinct (CMP), as depicted in Figure 1. The project seeks to identify opportunities to enhance modernise and improve capability and capacity of existing marine facilities within the CMP.
Figure 1 – Cairns Marine Precinct
Source: GHD & Bing Maps based on Cairns Defence and Marine Proposal
Underpinning the Growth Strategy, and identified implementation options, is a vessel demand analysis completed that specifies potential future infrastructure requirements with a view to maximise regional economic outcomes for, and from, the CMP1. Potential options for the CMP, as with any infrastructure development, are framed within constraints, thereby influencing the arrangements and effective delivery of an optimum future infrastructure plan on a cost to benefit basis.
This project (Cairns Marine Precinct Growth Strategy) aims to inform the government and the private sector of priority developments (both infrastructure and non-infrastructure) within the CMP to support a long-term sustainable marine industry. Additionally, the strategy aims to harmonise the interests of stakeholders including, but not limited to, defence, commercial maritime, Superyacht Group, Great Barrier Reef and tourism operators. A clear focus on
1 This report is subject to, and must be read in conjunction with, the limitations set out in Section 1.2 and the assumptions and qualifications contained throughout the Report.

GHD | Report for DSDMIP - Cairns Marine Precinct Growth Strategy (DSD-4692-16), 4219953 | iii
utilising potential future funds in the most appropriate manner is required so that Cairns can competitively tender for future naval and commercial re-fit contracts.
The Growth Strategy therefore forms a necessary input into future land use planning for the CMP, and an integrated long term Master Plan with the port of Cairns, which will assist with local shipbuilding and maintenance employment protection, as well as growth into the future.
Australian Shipbuilding and Repair
The shipbuilding and repair services industry in Australia is a $3 billion industry2, which centres on services provided to the Royal Australian Navy (RAN). Defence shipbuilding activities include construction of military warships and ships which are highly specialised with unique designs and specifications that generally require technologically intensive processes. The CMP has a long history of defence vessel construction, through the original NQEA operations; however, defence vessel construction from the precinct has declined significantly, with the majority of activities in the precinct now focussed on repair and maintenance.
Australian commercial shipbuilding has faced fierce competition from global shipbuilders from industry dominating countries such as China and South Korea, which has led to decline in revenue for this segment over the past five years. This has been observed, generally across the commercial vessel sector, with a significant reduction in vessel construction from the CMP, as with the rest of Australia, with the exception of some niche players in the market.
Ship repair and maintenance works can be done at anchorage, whilst on voyage and off-site. Off-site repairs are typically completed at a plant or facility, such as the CMP. Ship repair and maintenance services are provided for commercial and government vessels operating in Australian waters, with through-life support contracts contributing a large portion of this segment’s revenue. Ship repair and maintenance has remained steady as a percentage of revenue over the past five years, largely driven by regular defence maintenance requirements.
The Shipbuilding and repair industry in North Queensland is predominantly serviced by organisations within the Cairns Marine Precinct. The precinct is a mature ship building and naval vessel maintenance industry cluster that has a long tradition in providing marine industry support activities. The precinct is private sector led, comprising a broad range of marine services companies and supporting service and product suppliers. In delivering services to the maritime industry, a range of infrastructure assets are located within the precinct which are predominantly privately owned and operated.
CMP industry and infrastructure
Within the CMP, there are a range of businesses offering different services, infrastructure, and levels of engagement with the maritime sector. For the most part, organisations within the CMP fall into four main categories.
Ship and repair & maintenance and fabrication businesses that provide direct marine services for the repair, maintenance and construction of vessels.
Fishing fleet leased wharf areas where fishing vessels are either home ported or laid up during the off-season.
Mixed marine use organisations (or land area) with a maritime focus, that is not directly and/or solely related to ship and repair & maintenance and fabrication. This typically includes land used for recreational vessel storage (which may include small and
2 Industry revenue estimated by IBIS World for 2015-16 financial year. The average industry value added for the past five years is around $1.14 billion. Source: Terrant, N. (2016) IBISWorld Industry Report C2391: Shipbuilding and Repair Services in Australia.

GHD | Report for DSDMIP - Cairns Marine Precinct Growth Strategy (DSD-4692-16), 4219953 | iv
recreational vessel repair and maintenance), shipping operators and freight consolidation and storage).
Administration and training organisations that provide marine training services. Port operations/administration and Water Police have been excluded.
There are a number of notable features with respect to organisational distribution in the CMP, which includes:
There is spatial fragmentation of the ship and repair & maintenance and fabrication organisations within the precinct.
There are a number of organisations at waterfront locations that are not dependent on direct water access.
There are ship and repair & maintenance and fabrication organisations located outside the defined precinct area.
While the above observations, for a ‘greenfield’ development are not ideal, the location and distribution of organisations within the precinct is an evolution of demand for infrastructure and services in the region. As such, availability of land, the opportunity to achieve rent on vacant land, and the suitability of waterside locations in Smith’s Creek has resulted in the current arrangements within the CMP. Furthermore, organisations at their current locations have made significant investment in private facilities, limiting their portability, and the ability to optimise spatial distribution. However, as the evolution of services demand (type and size) has moulded the industry to its current arrangements, evolution of demand, driven by the market, will continue to evolve the services and infrastructure required at the CMP to both retain business and grow.
Key CMP Infrastructure and capacities
There is a broad range of infrastructure within the CMP, largely to support ship and repair & maintenance and fabrication service providers. This infrastructure includes a CMP (Ports North) power network which is fed from the Ergon Energy network, as well as a number of slipways, dry docks and vessel lifts (Figure 2).

GHD | Report for DSDMIP - Cairns Marine Precinct Growth Strategy (DSD-4692-16), 4219953 | v
Figure 2 – Distribution of key infrastructure within the CMP
Source: GHD
In addition to the identified key CMP infrastructure, there are numerous roads, warehouses, wharves and barge ramps that support and provide capacity and capability for the CMP maritime industry.

GHD | Report for DSDMIP - Cairns Marine Precinct Growth Strategy (DSD-4692-16), 4219953 | vi
The current layout of organisations is an evolution of demand for services, as well as available land and site specific constraints and capabilities. Similarly, infrastructure provided by industry, through lay down and hardstand areas, lifting and slipway capacities, the size and controls of workshops, and land transfer access ways, has, and will, continue to be an evolution of market and industry demands. This is particularly the case with potential future change in the type of work, quality of services demanded, as well as the type and capacity of infrastructure to sustain demand for services. Where there is misalignment between industry and market services; changing environmental and regulatory compliance; or a loss of capability with an ever-moving market demand, the ability for industry to retain and grow business is limited.
Conclusions from the analysis
Based on the analysis undertaken as part of this study, a number of key conclusions against the key objectives have been identified. These include:
Potential for future market growth future opportunities for marine precinct operators
Analysis of current and future vessel fleets identified a potential demand increase for drydock activities by 13% over the next five years. Potential opportunities largely come from:
An increase in the number of Cairns homeported superyachts – with the level of growth largely dependent on changes to the Australian Coastal Act and GBRMPA regulations for international vessels. These vessels are likely to increase in size from a maximum length of 60m up to potentially 140-150m.
A net reduction in the number of naval vessels is expected; however, the replacement vessels will be larger than the current fleet at 80m LOA with a weight of 1,500-2,000 tonnes (potentially up to 3,000 tonnes). In addition, the 19 Pacific Patrol boats are likely to be serviced in Cairns3.
The fishing fleet is expected to increase in number with home porting decisions made by a number of operators.
Infrastructure needs to capture future market opportunities including both dedicated and common users
Based on the gaps and opportunities analysis using current and future demand of vessels and key stakeholder themes, a sequential staged approach to sustain the current industry and grow to secure future demand was identified. This included:
Improve current infrastructure – through minimal intervention to overcome current shortfalls.
Expand current infrastructure – modifications to existing infrastructure through minimal capital investment to provide increased capacity and maintain market share.
Assess new infrastructure – the introduction of new enabling infrastructure for CMP to capture growth opportunities, which may include future private development or Common Use Infrastructure.
In addition to infrastructure needs, a number of non-infrastructure strategies were identified for implementation that would assist in the development of skills and retain employment within the CMP, as well as open new market opportunities and minimise potential leakage for ship repair and maintenance services from the region. These included:’
3 Note that since the demand analysis was completed an additional 2 Pacific Patrol boats have been ordered as part of the Commonwealth’s Pacific Maritime Security Program (PMSP), taking the total to 21 vessels. The additional 2 vessels are not included within the demand assessment completed as part of this study.

GHD | Report for DSDMIP - Cairns Marine Precinct Growth Strategy (DSD-4692-16), 4219953 | vii
Precinct coordination, marketing, compliance, monitoring, support and services/practices initiatives.
Form strategic alliances with prime contractors and, where advantageous, other competing service providers.
Facilitate change in regulation, particularly the Australian Coastal Shipping Act for determination of GST payments, to unlock potential growth, particularly resulting from superyacht homeporting in Cairns.
An overview of the marine infrastructure strategy developed as part of this study is shown below in Figure 3.
Figure 3 – Marine infrastructure strategy overview
Source: GHD

GHD | Report for DSDMIP - Cairns Marine Precinct Growth Strategy (DSD-4692-16), 4219953 | viii
Risks to operators of strategic significance from domestic and international sources
Based on the SWOT analysis undertaken to identify key gaps and opportunities, the primary risks to operators include:
Infrastructure capacity and capability to accommodate change in the specification of vessels, particularly in the key non-traditional market sector growth.
Increasing compliance requirements and the fit with some existing infrastructure, particularly driven by increasing controls associated with the GBRMP.
The ability to retain, and upskill, a specialist skilled labour pool, particularly with sporadic demand.
The increasing industrial hygiene and practices required for key growth sectors, particularly with the development of new specialised infrastructure targeted at growth market sectors, and the ability for CMP to retain that work.
Land use and precinct planning for marine infrastructure upgrades
A staged development strategy was identified as the best approach for land use and precinct planning for current infrastructure, which, dependent on further land use planning investigations, provisioning of access for CMP users with key new infrastructure is critical. Beyond the delivery of potential new infrastructure (private or common use), an ultimate development strategy, by way of an integrated Cairns long term master plan needs to be developed, which is aimed at alignment, purposing and protection of land related to key CMP activities.
Priority marine precinct infrastructure that will contribute to the long term development of the marine precinct and interests of stakeholders
The sequential staged development for sustaining and growing the CMP, identified numerous infrastructure requirements. The key staging infrastructure and basis of investment identified through infrastructure needs and strategy assessment is shown in Table 1.
Table 1 – Sequential staged development of infrastructure requirements (CMP)
# Infrastructure requirements Basis
Impr
ove
Cur
rent
In
frast
ruct
ure
A Rehabilitation and access to appropriate existing wharves within Smith’s Creek
Overcoming industry identified shortcomings at precinct
B Ports North to identify options for increased power supply capacity
Overcoming industry identified shortcomings at precinct
C Create new land backing at the rehabilitated/new wharf area – for repair access and additional car parking for the area
Land backing is required to fully enable the rehabilitation works – i.e. require access to rehabilitated wharves
Expa
nd C
urre
nt In
frast
ruct
ure
D Increase capacity at TRS with a slipway extension
Reduce current lost work opportunities
E Increase available wharf length by connecting selected existing rehabilitated/new wharves
With increased slip capacity (D) there is a corresponding increase in berth requirement – increased wharf length to align with provision of new slip capacity
F Investing in a modernisation and infrastructure quality improvement across the precinct
Industry protection measure for increasing environmental compliance requirements and increasing demands of customer base

GHD | Report for DSDMIP - Cairns Marine Precinct Growth Strategy (DSD-4692-16), 4219953 | ix
# Infrastructure requirements Basis
Asse
ss N
ew In
frast
ruct
ure
G Introduction of ship lifting capacity with an initial length of 90m and capacity with the weight of the OPV fleet)
Enabler of new market opportunities (i.e. superyachts) and sized to meet infrastructure requirements of the new Defence OPVs. Also supports other business as usual demand growth potential. Shiplift location must be capable of 90m LOA and deep water access.
H Removal of redundant infrastructure and conversion to new hardstand area
Linked to development of the shiplift (G).
I Provide access and efficient transfer to and from the new shiplift infrastructure (numerous additional works are required, including any reclamation works)
Reclamation driven by providing equitable access to all service providers Reclaimed land can be used as a hardstand area and or sheds (enclosed hardstand), particularly for superyachts.
J Development of new facilities as a result of relocations
Driven by reclamation and to support any relocation. Provide access to additional precinct capacity.

GHD | Report for DSDMIP - Cairns Marine Precinct Growth Strategy (DSD-4692-16), 4219953 | x
Table of contents 1. Introduction .................................................................................................................................... 1
1.1 Background .......................................................................................................................... 1
1.2 Scope and limitations ........................................................................................................... 2
2. Australian Shipbuilding and Repair ................................................................................................ 4
3. Approach ........................................................................................................................................ 6
4. CMP industry and infrastructure .................................................................................................... 7
4.1 Major marine related activities in the CMP .......................................................................... 7
4.2 Key CMP infrastructure and capacities................................................................................ 8
4.3 CMP infrastructure capacity and limitations ........................................................................ 9
5. Current fleet and market .............................................................................................................. 13
5.1 Current Fleet ...................................................................................................................... 13
5.2 Fleet summary and market demand .................................................................................. 15
6. Future fleet and demands ............................................................................................................ 17
6.1 Passing fleet opportunities ................................................................................................. 20
6.2 Future fleet specifications and demand ............................................................................. 23
7. Stakeholder outcomes ................................................................................................................. 25
8. Potential infrastructure requirements ........................................................................................... 29
9. Precinct strategic options ............................................................................................................. 30
9.1 Approach to strategy development .................................................................................... 30
9.2 SWOT Analysis .................................................................................................................. 30
9.3 Strategy development and synthesisation ......................................................................... 31
9.4 Non infrastructure strategies .............................................................................................. 33
9.5 Infrastructure strategies ..................................................................................................... 34
9.6 Summary of potential infrastructure delivery ..................................................................... 37
9.7 Strategy effectiveness and implementation timing ............................................................ 38
10. Conclusions .................................................................................................................................. 39
11. Next Steps .................................................................................................................................... 41
Table index Table 1 – Sequential staged development of infrastructure requirements (CMP) ................................ viii
Table 2 – Maritime industry historical and forecast performance ............................................................ 5
Table 3 – Key maritime interface infrastructure ....................................................................................... 9
Table 4 – Other key maritime interface infrastructure ............................................................................ 11
Table 5 – Key maritime services support infrastructure ......................................................................... 11
Table 6 – Other infrastructure development and industry initiatives ...................................................... 12

GHD | Report for DSDMIP - Cairns Marine Precinct Growth Strategy (DSD-4692-16), 4219953 | xi
Table 7 – Fishing fleet number and size (as at February 2017) ............................................................ 13
Table 8 – Cairns based commercial fleet ............................................................................................... 15
Table 9 – Current CMP facility demand estimate ................................................................................... 16
Table 10 – CMP potential superyacht demand ...................................................................................... 18
Table 11 – Current and future fleet summary ........................................................................................ 23
Table 12 – Future CMP infrastructure demand estimate (2022) ............................................................ 24
Table 13 – Future potential infrastructure requirements (CMP) ............................................................. 29
Table 14 – CMP SWOT analysis ............................................................................................................ 31
Table 15 – SWOT strategy formulation .................................................................................................. 32
Table 16 – Key CMP growth strategies .................................................................................................. 33
Table 17 – Sequential staged development of potential infrastructure .................................................. 37
Table 18 – Summary of strategy effectiveness assessment .................................................................. 38
Figure index Figure 1 – Cairns Marine Precinct ............................................................................................................ ii
Figure 2 – Distribution of key infrastructure within the CMP .................................................................... v
Figure 3 – Marine infrastructure strategy overview ................................................................................ vii
Figure 4 – Cairns Marine Precinct ............................................................................................................ 1
Figure 5 – Study approach ....................................................................................................................... 6
Figure 6 – Distribution of organisations within the CMP .......................................................................... 7
Figure 7 – Distribution of key infrastructure within the CMP .................................................................... 8
Figure 8 – Current and future maritime interface infrastructure ............................................................. 10
Figure 9 – Vessel movement intensity – North Queensland .................................................................. 21
Figure 10 – Passing and calling unique vessels by length (50-100m LOA) .......................................... 21
Figure 11 – Passing unique vessels by length (50-100m LOA) ............................................................. 22
Figure 12 – Approach to strategy development ..................................................................................... 30
Figure 13 – Marine infrastructure strategy overview .............................................................................. 36
Appendices Appendix A – Vessel demand (TCS)
Appendix B – Strategy effectiveness assessment
Cover Image: Cairns Marine Precinct. Image courtesy of Bing Maps website.

GHD | Report for DSDMIP - Cairns Marine Precinct Growth Strategy (DSD-4692-16), 4219953 | 1
1. Introduction 1.1 Background
The Queensland Government through the Department of State Development, Manufacturing, Infrastructure and Planning (DSDMIP) has initiated a Growth Strategy project for the Cairns Marine Precinct (CMP), as depicted in Figure 4. The project seeks to identify opportunities to enhance modernise and improve capability and capacity of existing marine facilities within the CMP.
Figure 4 – Cairns Marine Precinct
Source: GHD & Bing Maps based on Cairns Defence and Marine Proposal
Underpinning the Growth Strategy, and identified implementation options, is a vessel demand analysis that specifies potential future infrastructure requirements with a view to maximising regional economic outcomes for, and from, the CMP.
Potential options for the CMP, as with any infrastructure development, are framed within constraints, thereby influencing the arrangements and effective delivery of an optimum future infrastructure plan on a cost to benefit basis.
This project (Cairns Marine Precinct Growth Strategy) aims to inform the government and the private sector of priority developments (both infrastructure and non-infrastructure) within the CMP to support a long-term sustainable marine industry. Additionally, the strategy aims to harmonise the interests of stakeholders including, but not limited to, defence, commercial maritime, Superyacht Group, Great Barrier Reef and tourism operators. A clear focus on utilising potential future funds in the most appropriate manner is required so that Cairns can competitively tender for future naval and commercial re-fit contracts.

GHD | Report for DSDMIP - Cairns Marine Precinct Growth Strategy (DSD-4692-16), 4219953 | 2
The Growth Strategy therefore forms a necessary input into the long term Masterplan for the CMP, and the port of Cairns, which, together with Commonwealth Government funding, will assist local shipbuilding and maintenance employment protection, as well as growth into the future.
In developing the Growth Strategy, GHD, in association with Thompson Clarke Shipping (TCS), was engaged to undertake the study with the objectives to:
Quantify the potential for future market growth and future opportunities for marine precinct operators.
Determine the optimum infrastructure needs to capture future market opportunities including both dedicated and common users.
Identify risks to operators of strategic significance from domestic and international sources including government policy, economic conditions and other world market sources.
Determine preferred land use and precinct planning for marine infrastructure upgrades including (but not limited to) wharfs, floating docks, refit areas, workshops, and hardstands.
Provide a list of priority marine precinct infrastructure that will contribute to the long term development of the marine precinct and interests of stakeholders.
Identify and quantify investment opportunities for both government and private investors in the development of the marine precinct.
1.2 Scope and limitations
The scope of work undertaken for this study primarily focuses on investigation of demand for future marine construction, maintenance and repair operations, competitive advantage and situation, and an attempt to identify overall infrastructure needs for the precinct. To that end, the work includes:
Literature review of previous reports and studies undertaken
Demand analysis for construction and maintenance, repair and operations (MRO)
– existing demand assessment
– future demand opportunities for defence, superyachts, commercial marine
– competitive situation
– infrastructure needs for the overall industry
Audit of existing industry capacity
Gap analysis of existing industry to meet capacity and infrastructure requirements of current and future demand
option analysis to meet gaps within existing business locations, greenfield locations and other locations
Assessment of development options against criteria
– impact
– value
– capacity increase
A shortlist of prioritised development options and infrastructure requirements.

GHD | Report for DSDMIP - Cairns Marine Precinct Growth Strategy (DSD-4692-16), 4219953 | 3
1.2.1 Assumptions and exclusions
Due to the strategic nature and early investigative nature of this report, there are a number of assumptions and exclusions to the scope of work and battery limits for this study. These include:
Port of Cairns long term masterplan is outside the scope of this study.
The study area is limited to the Cairns Marine Precinct and adjacent land areas.
No costing of capital, or assessment of potential economic impacts has been undertaken.

GHD | Report for DSDMIP - Cairns Marine Precinct Growth Strategy (DSD-4692-16), 4219953 | 4
2. Australian Shipbuilding and Repair The shipbuilding and repair services industry in Australia is a $3 billion industry4, which centres on services provided to the Royal Australian Navy (RAN). Defence shipbuilding activities include construction of military warships and vessels, which are highly specialised with unique designs and specifications that generally require technologically intensive processes. Examples of recent major projects include the Hobart Class Air Warfare Destroyer and the Canberra Class Land Helicopter dock. The second largest product in this industry is commercial shipbuilding, which contributes to 15.1 percent of the industry, followed by ship repair and maintenance at 14.7 percent and submarine manufacturing at 7.3 percent for the 2015-16 financial year.
Military shipbuilding
The significance of naval shipbuilding in this industry means that revenues tend to be sporadic with demand largely determined by the Federal Government’s capital expenditure on military-related shipbuilding requirements. The industry has experienced a moderate compound annual growth rate (CAGR) of 1.5 percent over the last five years to 2015-16. Once the SEA 1000 Future Submarine Project starts in 2017-18, the industry is expected to grow at a CAGR of 3.93 percent to 2021-22 financial year.
The CMP has a long history of defence vessel construction, through the original NQEA operations; however, defence vessel construction from the precinct has declined significantly, with the majority of activities in the precinct focussed on repair and maintenance. Most recently, despite the shortlisting of a Cairns based consortium ‘The Cairns Solution’5 bid to build and support the Pacific-class patrol boat replacement, they were unsuccessful in securing the $2 billion contract.
Commercial shipbuilding
Commercial shipbuilding includes the construction of all types of ships that have a variety of sizes, structure and functions. Most of the ships produced in this category are 50 deadweight tonne displacement and over. The competitive advantage of the commercial shipbuilding industry is in the niche market of fast passenger catamaran ferries with innovative design, advanced materials and construction. Australian shipbuilders in this segment have faced fierce competition from global shipbuilders from industry dominating countries such as China and South Korea, which has led to decline in revenue for this segment over the past five years. This has been observed, generally across the commercial vessel sector, with a significant reduction in vessel construction from the CMP, as with the rest of Australia, with the exception of some niche players in the market.
Other associated services in the maritime industry
Ship repair and maintenance works can be done at anchorage, whilst on voyage and off-site. Off-site repairs are typically completed at a plant or facility, such as the CMP. Ship repair and maintenance services are provided for commercial and government vessels operating in Australian waters, with through-life support contracts contributing a large portion of this segment’s revenue.
4 Industry revenue estimated by IBIS World for 2015-16 financial year. The average industry value added for the past five years is around $1.14 billion. Source: Terrant, N. (2016) IBISWorld Industry Report C2391: Shipbuilding and Repair Services in Australia. 5 The Cairns Solution comprised a consortium of four contractors including consortium of four contractors, including Teekay Shipping Australia, BSE, Norship Marine and Damen

GHD | Report for DSDMIP - Cairns Marine Precinct Growth Strategy (DSD-4692-16), 4219953 | 5
Ship repair and maintenance has remained steady as a percentage of revenue over the past five years, largely driven by regular defence maintenance requirements.
In addition to ship related services, boat repair and maintenance contributes over one quarter of the $1.2 billion industry. As many sporting and recreational vessels are sold at very high price points, consumers generally seek to maintain and repair their old boats rather than buying new ones. This trend has increased over the past five years, with fairly sluggish discretionary income growth and volatile consumer sentiment encouraging many boat owners to look after their existing vessels. As a result, the boat repair and maintenance segment’s share of revenue has grown over the period.
Table 2 – Maritime industry historical and forecast performance
Industry 2015-16 Revenue ($m)
CAGR 2011-2016
Forecast CAGR 2017-2022
Shipbuilding and Repair Services 3,013.0 1.50% 3.93%
Boatbuilding and Repair Services 1,097.2 -2.52% -0.32%
Source: Ibis World; GHD Analysis.
2.1.1 Cairns shipbuilding and repair industry
The Cairns Regional Council is a diverse economy with a gross value added (GVA) contribution of $6.7 billion (or a gross regional product (GRP) of $7.8 billion) to the Queensland economy6. Of this total, Transport Equipment Manufacturing industry contributed $40.8 million (or 0.6 percent), Water Transport industry contributed $17.6 million (or 0.3 percent), and the general Transport Support Services industry contributed $169.2 million (or 2.5 percent) toward the region’s economy.7
The Shipbuilding and repair industry in North Queensland is predominantly serviced by organisations within the Cairns Marine Precinct. The precinct is a mature ship building and naval vessel maintenance industry cluster that has a long tradition in providing marine industry support activities. The precinct is private sector led, comprising a broad range of marine services companies and supporting service and product suppliers. In delivering services to the maritime industry, a range of infrastructure assets are located within the precinct which are predominantly privately owned and operated.
6 The Cairns Regional Council area is bounded by Douglas Shire in the north, the Coral Sea and Yarrabah Aboriginal Shire in the east, the Cassowary Coast Regional Council area in the south, and the Tablelands Regional Council area and Mareeba Shire in the west. The economic profile area includes the townships, suburbs and localities of Aeroglen, Aloomba, Babinda, Barron, Barron Gorge, Bartle Frere, Bayview Heights, Bellenden Ker, Bentley Park, Bramston Beach, Brinsmead, Bungalow, Cairns City, Cairns North, Caravonica, Clifton Beach, Deeral, Earlville, East Russell, East Trinity, Edge Hill, Edmonton, Ellis Beach, Eubenangee (part), Fishery Falls, Fitzroy Island, Freshwater, Glen Boughton, Goldsborough, Gordonvale, Green Hill, Green Island, Holloways Beach, Kamerunga, Kanimbla, Kewarra Beach, Lamb Range, Little Mulgrave, Macalister Range, Machans Beach, Manoora, Manunda, Mirriwinni, Mooroobool, Mount Peter, Mount Sheridan, Ngatjan (part), Packers Camp, Palm Cove, Parramatta Park, Portsmith, Redlynch, Smithfield, Stratford, Trinity Beach, Trinity Park, Waugh Pocket, Westcourt, White Rock, Whitfield, Woopen Creek, Wooroonooran (part), Woree, Wrights Creek and Yorkeys Knob. Source: http://economy.id.com.au/cairns/about 7 Source: National Institute of Economic and Industry Research (NIEIR).(2015) and .id (2016).

GHD | Report for DSDMIP - Cairns Marine Precinct Growth Strategy (DSD-4692-16), 4219953 | 6
3. Approach For the purposes of this study, a six stage sequential process (Figure 5) has been applied so that the information gained through the duration of the study informs and builds upon the knowledge developed in the preceding tasks. The study seeks to provide an outcome that is based on the latest and most relevant information and understanding, and, is aligned with broader industry and stakeholder needs.
Figure 5 – Study approach
The major tasks undertaken in the approach to this study include:
A desktop review of previous work and public domain documentation related to the CMP and the broader maritime repairs and maintenance industry.
Stakeholder consultation with a broad cross section of interested parties, including government departments, infrastructure owners, industry bodies, users of facilities, and customers to assist with baselining current demand, identifying forward demand, and gaps and opportunities in the market and CMP infrastructure. A summary of the stakeholder consultation details, as described by TCS, is provided in Appendix A.
Demand assessment to identify and capture potential change in market sectors, the nature and level of demand for CMP infrastructure, and the specification demands for these vessels. A summary of the TCS demand assessment completed is provided in Appendix A.
Needs assessment to identify potential non-infrastructure and infrastructure requirements of industry, both in terms of addressing current gaps or shortfalls, and what infrastructure is required to support growth and retain business into the future.
Strategy development using gaps and opportunities identified during the stakeholder consultation process to align with current and future needs.
Implementation options for the key non-infrastructure and infrastructure strategies that have the potential to sustain and grow the CMP.
Desktop review Stakeholder consultation
Demand assessment
Needs assessment
Strategy development
Implementation options

GHD | Report for DSDMIP - Cairns Marine Precinct Growth Strategy (DSD-4692-16), 4219953 | 7
4. CMP industry and infrastructure The Cairns Marine Precinct is a ship building and naval vessel maintenance industry cluster providing marine industry support activities across Northern Australia. The precinct is private sector led, comprising a broad range of marine services companies and supporting service and product suppliers. In delivering services to the maritime industry, a range of infrastructure assets are located within the precinct which are predominantly privately owned and operated.
4.1 Major marine related activities in the CMP
Within the CMP, there are a range of businesses offering different services, infrastructure, and levels of engagement with the maritime sector. For the most part, organisations within the CMP fall into four main categories.
Ship and repair & maintenance and fabrication businesses that provide direct marine services for the repair, maintenance and construction of vessels.
Fishing fleet leased wharf areas where fishing vessels are either home ported or laid up during the off-season.
Mixed marine use organisations (or land area) with a maritime focus, that is not directly and/or solely related to ship and repair & maintenance and fabrication. This typically includes land used for recreational vessel storage (which may include small and recreational vessel repair and maintenance), shipping operators and freight consolidation and storage).
Administration and training organisations that provide marine training services. Port operations/administration and Water Police have been excluded.
The distribution of organisations by type in the CMP is shown in Figure 6.
Figure 6 – Distribution of organisations within the CMP
Source: GHD

GHD | Report for DSDMIP - Cairns Marine Precinct Growth Strategy (DSD-4692-16), 4219953 | 8
There are a number of notable features with respect to organisational distribution in the CMP, which includes:
There is spatial fragmentation of the ship and repair & maintenance and fabrication organisations within the precinct.
There are a number of organisations at waterfront locations that are not dependent on direct water access.
There are ship and repair & maintenance and fabrication organisations located outside the defined precinct area.
While the above observations, for a ‘greenfield’ development are not ideal, the location and distribution of organisations within the precinct is an evolution of demand for infrastructure and services in the region. As such, availability of land, the opportunity to achieve rent on vacant land, and the suitability of waterside locations in Smith’s Creek has resulted in the current arrangements within the CMP. Furthermore, organisations at their current locations have made significant investment in private facilities, limiting their portability, and the ability to optimise spatial distribution. However, as the evolution of services demand (type and size) has moulded the industry to its current arrangements, evolution of demand, driven by the market, will continue to evolve the services and infrastructure required at the CMP to both retain business and grow.
4.2 Key CMP infrastructure and capacities
There is a broad range of infrastructure within the CMP, largely to support ship and repair & maintenance and fabrication service providers. This infrastructure includes a CMP (Ports North) power network which is fed from the Ergon Energy network, as well as a number of slipways, dry docks and vessel lifts (Figure 7)
Figure 7 – Distribution of key infrastructure within the CMP
Source: GHD

GHD | Report for DSDMIP - Cairns Marine Precinct Growth Strategy (DSD-4692-16), 4219953 | 9
In addition to the identified key CMP infrastructure, there are numerous roads, warehouses, wharves and barge ramps that support and provide capacity and capability for the CMP maritime industry.
The current layout of organisations, as discussed previously, is an evolution of demand for services, as well as available land and site specific constraints and capabilities. Similarly, infrastructure provided by industry, through lay down and hardstand areas, lifting and slipway capacities, the size and controls of workshops, and land transfer access ways, has, and will continue to be an evolution of market and industry demands. This is particularly the case with potential future change in the type of work, quality of services demanded, as well as the type and capacity of infrastructure to sustain demand for services. Where there is misalignment between industry and market services, changing environmental and regulatory compliance, the ability for industry to retain business and grow results is limited.
4.3 CMP infrastructure capacity and limitations Infrastructure development at the CMP has been driven largely by the location and growth of the organisations located and operating within it, as well as the ownership and access arrangements. Additionally, the historical development of infrastructure has been influenced by the nature and specifications of services demanded, technology and practices of the day, network load, cost of construction and operation, and the site specific physical constraints. As a result, there is a range of technologies and infrastructure capacities located through the CMP.
In addition to the capacity and capability of developed infrastructure, there are a number of physical constraints and limitations for the CMP, driven primarily by the width of Smith’s Creek, which restricts turning space available for manoeuvring vessels, and therefore limits access to vessels to 80m LOA or less. While there are depth restrictions in Smith’s Creek, vessels less than 80m are largely unconstrained, particularly with higher water levels from tidal flows. As such, depth constraints are related to access to facilities and associated berth pocket depth.
A summary of key maritime interface infrastructure for ship and repair & maintenance and fabrication services is provided in Table 3 and Figure 8. Other current infrastructure development initiatives are summarised in Table 6.
Table 3 – Key maritime interface infrastructure
Infrastructure Organisation Current Capacity
Planned Upgrades
Comments
Slipway TRS 3,000 t 100m LOA
135m LOA
Vessels occupy slipway for the duration of works (typically 3-4 weeks). The total length of vessels and separation is currently limited to 100m. The planned upgrade of the TRS slipway will extend the maximum vessel length from 100m to 135m. Timing of when works are expected to be completed has not been publicly released.
Floating Dock TRS 350 t - Vessel remains on dock for the duration of works.
Dry dock BSE 60m LOA 1,120t travel lift
Dimensions of the dry dock are 60m x 11.8m x 3m. The existing dry dock is planned to be decommissioned and replaced with a 1,120t mobile boat hoist (travel lift), with the first boat expected to be hauled out in mid-2019.
Slipway BSE 1200 t 80m LOA 22m Beam
- Vessel can be transferred to nearby facilities by rail. Curve in slipway profile makes slipping of large vessels more difficult 80m LOA restriction – access to Smith’s Creek.

GHD | Report for DSDMIP - Cairns Marine Precinct Growth Strategy (DSD-4692-16), 4219953 | 10
Infrastructure Organisation Current Capacity
Planned Upgrades
Comments
Travel lift CCYC 40 tonnes
- Vessels can be transferred to nearby facilities, hardstand and storage. Lift operated by Norship.
Travel lift Norship 400 tonnes 70m LOA 12m Beam 3.5m Draught
- Vessels can be transferred to nearby facilities and hardstand. Overarching 80m LOA restriction – access to Smith’s Creek. Access depth limited to 3.5m draught, requiring tidal assistance for access.
Source: GHD based on public sources and industry consultation
Figure 8 – Current and future maritime interface infrastructure
# Existing Cairns Slipway 60m LOA dry dock to be decommissioned and the wharf upgraded to accommodate the mobile boat hoist Source: GHD based on industry consultation and various sources

GHD | Report for DSDMIP - Cairns Marine Precinct Growth Strategy (DSD-4692-16), 4219953 | 11
In addition to maritime interface infrastructure described above, which is for dry works on vessels, there are a number of wharves, laydown areas and shed facilities used by ship and repair & maintenance and fabrication services. These include:
Table 4 – Other key maritime interface infrastructure
Infrastructure Organisation Capacity Comments
Berth TRS 110m LOA Combined wharfage 250m over 3 locations, single berth capable of 110m LOA
Berth BSE 300m 300 metres of fitting out berths, including 80 metre floating wharf
Berth (Smith’s Creek Wharf / Masons 1 and 2)
Common User (Ports North)
65m Mostly used for overflow layup berth
Berth (DPI Wharf) Department of Agriculture and Fisheries
- 37 metre wharf
Berth Norship 85m LOA 60 and 25 metre wharves – 85m LOA
Barge Ramp Common User (Ports North)
55m LOA 13.2m beam <500 tonnes
2 barge ramps located about one nautical mile upstream in Smith’s Creek. Both can accommodate landing craft up to 55 m LOA, 13.2 m beam and <500 GRT
Source: GHD based on imagery calculation; Ports North Information Sheet – Port of Cairns Facilities & Services; and various industry sources
Table 5 – Key maritime services support infrastructure
Organisation Infrastructure Type
Comments
TRS Sheds Approximately 1,660m²
Hardstand Approximately 9,840m²
BSE Sheds Approximately 3,660m². Three large sheds for refits during wet season.
Hardstand Approximately 42,940m²
CCYC Sheds Approximately 1,230m²
Hardstand Approximately 17,170m²
Norship Sheds Approximately 2,300m². Two sheds up to 27m LOA, engineering workshop, storage units and paint shop.
Hardstand Approximately 22,000m²
Big Boat shed Sheds Approximately 1,340m²
Hardstand Approximately 4,010m²
NQEA Sheds Approximately 4,850m²
Hardstand Approximately 17,650m²
Ports North Power Electricity is connected to all wharves with both single phase power and 3-phase power available at most berths
Source: GHD based on imagery calculation; Ports North Information Sheet – Port of Cairns Facilities & Services

GHD | Report for DSDMIP - Cairns Marine Precinct Growth Strategy (DSD-4692-16), 4219953 | 12
Table 6 – Other infrastructure development and industry initiatives
Organisation Infrastructure Development Initiatives
Ports North Cairns Shipping Development Project Upgrades at the Port of Cairns to improve access for larger ships, including cruise ships: • Dredging to widen (to 20m) and deepen (8.8m) the existing
outer shipping channel (Trinity Inlet) • Widening and deepening (8.8m) of the existing inner harbour
channel and Crystal swing basin • Establishment of a new shipping swing basin (Smith's Creek
swing basin – to a 310m diameter) to enable future expansion of the HMAS Cairns Navy base
• Placement of material from capital dredging on land • Upgrade of the existing cruise shipping wharves (Trinity
wharves 1 to 5) • Relocation and installation of new navigational aids.
Queensland Government (DSDMIP)
Queensland Superyacht Strategy The Queensland Superyacht Strategy, launched on 22nd May 2018 seeks to attract investment, expand infrastructure and create jobs by working with the Federal Government and industry. The superyacht strategy seeks to: • Deliver clear policy settings • Promote infrastructure to facilitate industry growth, • Promote Queensland as a global superyacht destination • Support and develop Queensland’s superyacht supply chain.

GHD | Report for DSDMIP - Cairns Marine Precinct Growth Strategy (DSD-4692-16), 4219953 | 13
5. Current fleet and market The CMP supports a range of vessel markets from a local, regional and national, and to some extent an international fleet base. The majority of demand for services is generated by the Cairns based fleet, which is common through ship repair and maintenance facilities throughout Australia. Analysis of the current and future fleet and demand for services has been undertaken by TCS as part of this study. Findings from the TCS work is provided in Appendix A. The remainder of this section of the report summarises TCS findings with respect to the current fleet and market demand.
5.1 Current Fleet
The current fleet serviced by the CMP comprises six separate markets, each with specific services needs and infrastructure requirements. The six markets include Superyachts, White Boats, Fishing Vessels, Government Vessels, Reef fleet and Commercial.
Superyachts
Superyachts are considered to be vessels above 24m LOA, professionally crewed and carrying not more than 12 passengers. There were 12 home ported superyachts in the Cairns Marina, all less than 60m LOA. The beam and displacement of these superyachts has not been detailed within the available data.
In addition to the locally based fleet, there were 39 visiting superyacht vessels in 2016. The visiting superyacht vessels ranged in length from 24m to 91.5m LOA.
White Boats
White boats are the boats that don’t make it into the superyacht category. There are 4 white boats listed in the Ports North database.
White boats are usually privately owned and generally less than 24m LOA. However this is not supported by the available data which does not include any detail on the length, beam or displacement/lightship weight.
Fishing Vessels
The fishing fleet is largely divided into two periods of demand based on the prawn industry season when the fleet is out to sea (September to January) and the remainder when they are homeported. Other vessels fishing for finfish are not constrained by the prawn season and provide a much smaller proportion of the homeported fleet as indicated lower numbers in the below table.
Table 7 – Fishing fleet number and size (as at February 2017)
Type Number berthed Average LOA (m) Average Beam (m)
In-prawn season 19 15.08 5.17
Out-of prawn season 79 13.54 5.08
Total 98 14.31 5.13
Source: TCS based on Ports North data

GHD | Report for DSDMIP - Cairns Marine Precinct Growth Strategy (DSD-4692-16), 4219953 | 14
Government Fleets - Navy, Border Patrol, Customs, State Government
Navy
The RAN vessels as being home ported in Cairns include 2 x Cape Class; 1 x Armidale Class; 4 x SML, and, 2 x Leeuwin Class Hydrographic Survey. In addition, 4 x Armidale Class vessels called at Cairns in 2016.
Border Force
Australian Border Force has eight vessels (Bay Class), and are operated out of Canberra with no fixed home port. However, these vessels, undertake maintenance and sustainment activities at Norship facilities in Cairns.
Australian Customs
Australian Customs base six vessels in Cairns and undertake their maintenance and sustainment at Norship in Cairns.
Queensland Police
Queensland Police maintain three patrol vessels in north Queensland with Cairns being the base for maintenance and repairs.
Great Barrier Reef Marine Park Authority
GBRMPA maintains one major patrol vessel in north Queensland which is based in Cairns.
Maritime Safety Qld (MSQ)
MSQ has a fleet of three work boats in Cairns. Up until recently, it also had responsibility for the six Pilot Boats in the region; however, these have been transferred to the respective Port Authorities and are stationed at various ports throughout North Queensland. Each vessel returns to Cairns for maintenance.
Reef Fleet
The Reef Fleet comprises a multitude of different vessels to support tourism activities operating from Cairns, and to some extent those operating from nearby locations, such as Port Douglas. The fleet can be broken down into the following categories, each with vastly differing dimensions and passenger capacity:
Large high speed passenger catamarans
Smaller passenger catamarans
Day/reef exploration boats
Dive boats
Adventure boats
Snorkelling boats
Outer reef boats
Charter vessels
Semi subs and glass bottom boats
Permanently moored reef pontoons.
Cairns Marlin Marina has 219 pontoon berths, 30 Reef Fleet Berths and 12 superyacht berths. Data suggests that 29 Reef Fleet vessels are berthed at the Marlin Marina Wharf and Finger A. 107 vessels are berthed on Fingers B to H and the Sailfish Quay, 37 of which are commercial vessels.

GHD | Report for DSDMIP - Cairns Marine Precinct Growth Strategy (DSD-4692-16), 4219953 | 15
Commercial
The commercial fleet based in Cairns includes a mix of landing barges, dumb barges, tugs, and small cargo vessels up to 90m LOA (Table 8). Fleet sizes and dimensions are provided in Annex 2 of Appendix A
Table 8 – Cairns based commercial fleet
Type Number berthed
Comment
Tugs 35-418 Includes tugs servicing Mourilyan, Cape Flattery, SeaSwift (including ones operating In the Torres Straits but maintained in Cairns), small tugs/works boats for various operators (Perrots, Tim Norths, Carpentaria Contractors, MIPEC, and Toll)
Barges 31 -
Cargo 14 -
Source: TCS based on Ports North data
5.2 Fleet summary and market demand
To gauge the level of current potential demand for facilities at CMP, TCS has calculated the number of demand days using average time between docking periods and average times for vessels on the slip for the home ported fleet. This is based on, for example, a standard dry-docking for a Pacific Patrol boat of 6 weeks, however an extended refit for the same vessel can take up to 6 months. SeaSwift’s new 90m LOA line haul vessel addition to its fleet will require dry docking/slipping every 2.5 years with a refit every 2 – 3 years.
The exact demand for facilities is not practical to calculate, due to variability in the nature, timing and duration of vessel servicing. The operators also have the ability to optimise scheduling using a mix of their private infrastructure, and the award of contracts. This, in turn, is also influenced by price and availability of infrastructure, as well as the capacity and capability of the infrastructure. However, as a gauge of potential demand for infrastructure, demand days is an appropriate proxy for gauging services demand.
Analysis undertaken by TCS, as shown in Table 9 indicates a total annual demand of 5,210 days across the CMP, with the largest market demand from the resident fishing and reef fleet, primarily due to the size of fleet.
8 There are differences in the Ports North available data.

GHD | Report for DSDMIP - Cairns Marine Precinct Growth Strategy (DSD-4692-16), 4219953 | 16
Table 9 – Current CMP facility demand estimate
Source: TCS analysis (February 2017)
The above analysis does not take into account vessels that do not visit Cairns. Analysis of Reef VTS data indicates that very few vessels bypass Cairns in transit that could be serviced or maintained within the capability and capacity of facilities in Cairns. This is further explained in Section 6.1.

GHD | Report for DSDMIP - Cairns Marine Precinct Growth Strategy (DSD-4692-16), 4219953 | 17
6. Future fleet and demands The evolution of demand for services at the CMP has resulted in the current arrangements, layout and infrastructure, and so also will the nature of services demand continue to shape the CMP. To inform what future services demand may be, a forward view of the resident and calling fleet in Cairns has been considered, and what likely infrastructure may be required to both maintain current market share, and where specific areas of growth potential may lie.
Analysis of the future fleet potential and demand for services has been undertaken by TCS as part of this study. Findings from the TCS work are provided in Appendix A. The remainder of this section of the report summarises TCS findings with respect to the future fleet and market demand.
Superyachts
Superyachts have been calling at Cairns for some time with an estimated 2,850 days in the Cairns region. In 2016, 10 superyachts spent a total of 474 days split between BSE Cairns Slipway and Norship Marine Slipways.
As a driver for demand and growth, the number of days in the region and more particularly at repair and maintenance facilities could be increased should there be a relaxation of the Australian Coastal Act. At present, the Act prevents foreign flagged superyachts from chartering whilst in Australian waters. The Act states that these visiting superyachts must pay the full duty and GST payable on the value of the yacht prior to taking up charter opportunities. This cost may well exceed any income derived from the chartering income. As such, this is a significant barrier for the superyacht market to homeport at Cairns, particularly for larger superyachts of up to 150m that are operating in the western Pacific region.
Further to the restrictions of the Australian Coastal Act, the GBRMPA places restriction on the movement of these vessels, which further limits the range of activities and areas of the reef where they are not permitted to travel. New Zealand and Fiji had similar restrictions on visiting superyachts, however, both countries have relaxed their legislation with regards to chartering activities. These changes included:
New Zealand changed its legislation allowing superyachts to stay in that country for up to two years with some chartering. This has led to a 54% increase in superyacht visits since the introduction of the new Legislation.
Fiji has introduced a superyacht charter decree, which has led to a 40% increase in vessel visitations and an increase of average stay from 21 days to 136 days.
Engagement with stakeholders indicated that a relaxation of the Coastal Shipping Act, which is currently being considered by the Queensland Government, has the potential outcomes:
No change to the Australian Coastal Act - 3 – 5% increase in superyacht visits
Easing of the Australian Coastal Act - 10 – 15% increase in superyacht visits
Removal of all restrictions - 25 – 30% increase in superyacht visits
The following table illustrates the potential outcomes of these changes to the visitation of superyachts to the Cairns Region and in particular the slipways.

GHD | Report for DSDMIP - Cairns Marine Precinct Growth Strategy (DSD-4692-16), 4219953 | 18
Table 10 – CMP potential superyacht demand
Type Current Situation
4% Increase 12.5% Increase 27.5% Increase
Cairns Region Days 2,850 2,964.00 3,206.25 3,633.75
Slipway Days 474 492.96 533.25 604.35
Visiting Slipway No 10 10.40 11.25 12.75
Source: TCS based on stakeholder consultation
Based on these assumed growth rates, potential exists for an additional 3 superyachts per annum, which is the equivalent to an extra 130 days per annum, with the Australian Coastal Act and other restrictions fully lifted.
White Boats
With Australia’s growth in wealth over recent years, there has been an increase in the number of white boats being seen in our waterways. These boats are capable of moving around the vast majority of Australian coastal waters, particularly NSW and Queensland. Owners of these vessels often live aboard and do not have professional crews.
Accurate data is limited for these privately owned vessels, which in TCS’ opinion has led to an increase of 5 – 10 vessels per annum for the CMP. Based on 14 days per dry docking these vessels have the potential to add up to 140 days of occupancy for Cairns dry docking infrastructure.
Fishing Fleet
The fishing fleet based in Cairns has been stable for some years. New larger vessels are replacing boats that are being retired, and are not generally increasing the number of fishing vessels based in Cairns. Despite this general trend, Austral Fisheries have also recently relocated 15 vessels in their fleet to Cairns. These vessels are in the 22 – 25m LOA range, which are anticipated to be slipped every 2.5 years, which translates to 6 vessels per annum.
The arrival of this fleet homeporting in Cairns could result in an additional 14 fishing vessels in port at the same time in the 22m – 30m LOA range seeking dry docking per annum with a time ashore being approximately 25 – 30 days. This increases the dock usage by between 300 and 360 days per annum not including any servicing required outside the dry dock periods.
Government Fleets - Navy, Border Patrol, Customs, State Government
The largest driver for change in the government fleet market will come from Defence; however, Border Force are planning to have 2 refurbished Bay Class patrol boats operating out of Cairns. These will be maintained in Cairns.
The Navy base in Cairns caters for a number of different class vessels ranging from patrol boats to hydrographic survey vessels. The Navy is also going through a period of considerable change with older vessels being decommissioned and new vessels coming on line or in the planning stage for delivery around 2020. Indicative changes for the Naval fleet include:
Armidale Class patrol boats will be replaced by 12 OPVs (max length 80m), starting early 2020. Four OPVs will be stationed in Cairns, with maintenance requirements and location not yet determined; however, it is expected that they will be removed from the water every two years of their life9.
9 Demand analysis completed as part of this study based on 3 to 5 OPVs being stationed at Cairns.

GHD | Report for DSDMIP - Cairns Marine Precinct Growth Strategy (DSD-4692-16), 4219953 | 19
The four Survey Motor Launches will be decommissioned in 2022-23 without replacement.
A new larger hydrographic vessel may be outsourced, with the potential for one at 90m LOA.
Considerable work needs to be done to the Navy base and the sugar wharf to permit the OPVs to berth in Cairns, with the potential need for a future wharf for the Navy in Cairns
These changes in the Defence fleet will cause change for the CMP. This includes:
The decommissioning of the Armidale Class patrol boats starting around 2020.
The decommissioning of the 2 Leeuwin class hydrographic survey vessels.
The decommissioning of the four SMLs in 2022-23.
This totals 8 or 9 Naval vessels being decommissioned from Cairns. However, Cairns will gain 4 of the OPVs. The major hydrographic vessel replacement has not been confirmed for Cairns.
The replacement program for the Armidale Class sees a larger OPV operating in the region. The new OPV will have a length approximately 80m and are to be constructed German shipbuilder Lürssen10. The light ship weight is unknown, but the standard OPV 80 vessel design on Lürssen’s website has a reported displacement of 1,486 tonnes11 (which includes the vessels contents). Based on this it is expected that the OPVs will be in the order of 1,300-1,750 tonnes. At 1,300-1,750 tonnes, there is only one slipway capable of handling these vessels, which is currently at maximum capacity. Should there be 4 OPVs stationed in Cairns and maintained in Cairns, the out of water requirement would be 2 per annum. Assuming an out of water period of 40 days these vessels will require approximately 80 days of slipway time each year. This is less than that currently required by the 4-5 major vessels currently accessing the slipways.
Pacific Patrol Boats
In addition to the above noted changes in the Government Fleets, Austal recently announced that they have been awarded the contract for the Pacific Patrol Boat Replacement Program for the building of 19 steel-hulled boats at Henderson (WA) and the initial 7 year contract for their sustainment, which will be carried out in Cairns. The news of the 19 new Pacific Patrol Boats being maintained in Cairns is seen as being business as usual and not new work for the shipyards as the existing Pacific Patrol Boat Fleet is currently already being serviced in Cairns.
It is anticipated that first delivery will be in Q4 CY2018 with construction work running through to CY2023. This will produce 3.6 patrol boats each year. The patrol boats will be 39.5m LOA on a beam of 8m and a loaded draft of 2.5m. The light ship weight has not been supplied at this point in time. The light ship weight is expected to be less than 400t12 therefore able to access all three slipways.
Whilst nothing has been confirmed, it is suggested these vessels will have a dry docking/slipping period not dissimilar to Australian Navy vessels and commercial vessels of once every 2.5 years with the first vessel due for docking in approximately Q2 CY2021 and thereafter at approximately three month intervals or four per year. The period out of the water has not been determined but may be in the order of 5 – 6 weeks. Given this duration, the total dock time required for the Pacific Patrol Boats would be in the vicinity of 3.8 boats per year by (say 6 weeks) or 160 days.
10 https://navaltoday.com/2018/01/31/australia-signs-offshore-patrol-vessel-construction-contract-with-lurssen/ 11 https://www.luerssen-defence.com/opv-80/ 12 Lightship tonnes (or vessel weight) for defence vessels are not typically reported in the public domain.

GHD | Report for DSDMIP - Cairns Marine Precinct Growth Strategy (DSD-4692-16), 4219953 | 20
The current Pacific Patrol Boats are being maintained in Cairns (apart from a few which are being maintained in their country of home porting) for periods of between six weeks and six months.
Reef Fleet
Since 2009/10 there has been an uplift in tourist numbers increasing steadily, led by increased Asian visitation numbers. As a result, there have been new vessels added over the past three years. One of the major tourism operators, in particular, has been buying boats, principally from existing operators without dramatically increasing the number of boats working out of Trinity Inlet and Port Douglas; however, this operator will be replacing boats as the older vessels are decommissioned, whilst also gradually increasing the number of vessels in their reef fleet.
The majority of the reef fleet vessels are less than 35m LOA due largely to a higher level Certificate of Competency which can be difficult to recruit and maintain. Vessels under this size do not have to have vessel specific crew qualifications and this provides maximum flexibility to the operators for crewing their entire fleet. As such, the reef fleet is expected to largely remain the same in size, but increase gradually in number, offset by increasing passenger seating capacity per vessel. There is considered to be latent capacity in the existing fleet that would need to be taken up with growth before any significant new additional vessels would be considered.
The resulting impact on Cairns slipways is that the number of days’ occupancy for future Reef Fleet demand is not significant and could be catered for within the current capability.
Commercial Ships
SeaSwift is the largest cargo operator based in Cairns with a fleet of ships, tug and barges and landing craft stationed in Cairns, Torres Strait and Darwin. All vessels return to Cairns for all slipping and programmed maintenance/refits. SeaSwift is adding one new line haul vessel to its fleet, with an expected length of 90m LOA and a lightship weight of approximately 1,500 tonnes., Besides the addition of this new vessel, demand levels are considered to remain fairly steady with growth dictated by growth and infrastructure development in the regions being serviced by the SeaSwift fleet for the next five years.
As with the other market sectors, dry docking/slipping will be routinely required every 2.5 years with a refit every 2 – 3 years. Due to its size, this vessel will require the use of the TRS slipway and will be on the slip for an anticipated 35 – 60 days.
6.1 Passing fleet opportunities
In addition to changes in the Cairns based fleet and traditional served markets, which have been the primary focus of investigation, the potential scale of passing vessels has been assessed.
The Queensland coast line has a high intensity of vessel movement activity, with a significant number of recorded movements within the region, as well as those vessels coming to and from Australia, transiting inside the Great Barrier Reef (Figure 9). These vessel movements present potential opportunities for ship repair and maintenance facilities at the CMP.

GHD | Report for DSDMIP - Cairns Marine Precinct Growth Strategy (DSD-4692-16), 4219953 | 21
Figure 9 – Vessel movement intensity – North Queensland
Source: Generated using https://www.marinetraffic.com/
Analysis of Reef VTS data for the Cairns region in the CMP infrastructure target range of 50-100m LOA during 2016 showed in the order of 400 vessel movements. A significantly higher number of movements, as shown by vessel movement intensity, is of vessels over 100m, such as large cargo/container ships, fuel tankers and bulk carriers (primarily coal and copper concentrate ships). Further analysis identified that the 400 movements were made by 32 individual vessels13. A breakdown of these vessels, as shown in Figure 10, shows a spread of size and type, with the majority of these vessels classified as General Cargo.
Figure 10 – Passing and calling unique vessels by length (50-100m LOA)
Source: GHD analysis based on REEFVTS data (50-100m LOA)
13 VTS data did not identify vessel names. To identify individual vessels the combination of vessel length and gross tonnage was used. As a result, some vessels may be missed, particularly if sister ships.

GHD | Report for DSDMIP - Cairns Marine Precinct Growth Strategy (DSD-4692-16), 4219953 | 22
While the vessels identified in Figure 10 provide some insights for activities in the Cairns region, the data includes vessels calling at Cairns. These vessels may be either homeported in Cairns, or visiting (for either commercial or servicing reasons), and therefore captured within the existing market.
To identify potential opportunities arising from passing vessels, additional analysis of the Reef VTS data was conducted, where the origin or destination port was not Cairns. Analysis of the data showed a total of 8 individual vessels for the last 12 month period, with a target length of 50-100m, some of which may potentially use the CMP. As shown in Figure 11, a range of vessel types and sizes (between 50m and 100m LOA) passed Cairns; however, the potential for these vessels to use dry docking facilities is limited, largely driven by the nature of their activities when operating in the region. As such:
Cargo vessels (and tankers), which will be largely international vessels operating to and from Australia, will typically seek to use facilities at their home port, or major services hub for routine maintenance and survey. This preference will be driven by not interrupting schedule, particularly when carrying cargo, and minimising off-hire time, which would be required to reposition to Cairns to have work done.
Non cargo vessels, such as research vessels and tugs (including supply vessels), have the potential to undertake scheduled maintenance at the end of their engaged period activities. As such, these vessels, if undertaking activities in the Northern Queensland area, may seek to use CMP facilities, and therefore have potential.
Figure 11 – Passing unique vessels by length (50-100m LOA)
Source: GHD analysis based on REEFVTS data (50-100m LOA)
Based on the analysis of the passing fleet, there appears to be only a small potential, with the majority of vessel activities in the region significantly larger than CMP infrastructure capabilities, or are unlikely to undertake scheduled dry docking work. As a result, an additional 1-2 vessels per year may reasonably be attracted to ship repair and maintenance facilities at the CMP; with

GHD | Report for DSDMIP - Cairns Marine Precinct Growth Strategy (DSD-4692-16), 4219953 | 23
more significant potential arising from ad-hoc unscheduled and breakdown repair work, which will typically demand in-water services only, rather than dry docking.
6.2 Future fleet specifications and demand
TCS analysis of the current and future fleet has identified a number of potential changes in the existing fleet and some potential growth opportunities for the CMP. As shown in Table 11 these include:
A potential increase in the number of Cairns homeport superyachts – with the level of growth largely dependent on changes to the Australian Coastal Act and GBRMPA regulations for international vessels. These vessels are likely to increase in size from a maximum length of 60m up to potentially 140-150m.
Growth in the number of white boats, as well as modest changes in the Reef Fleet; however vessel size is expected to largely remain the same.
The number of commercial vessels is expected to remain relatively stable; however, the maximum size of the fleet is expected to increase to 90m LOA with a weight of 1,500t.
A net reduction in the number of naval vessels; however, the replacement vessels will be larger than the current fleet at 80m LOA with a weight of 1,500-2,000 tonnes (potentially up to 3,000 tonnes). In addition, the Commonwealth Government has committed for the 19 new Pacific Patrol boats to be serviced in Cairns14.
The fishing fleet is expected to increase in number with home porting decisions made by a number of operators; however the specifications of these vessels is well within existing capabilities.
Table 11 – Current and future fleet summary
Source: TCS Assumes: Navy includes Customs, Border Patrol and State Government vessels (separated in this table). (1) Superyachts is assuming the Coastal Act hindrances and GBRMPA rules are removed and
visitation rate increases at 27.7%.
(2) White boats could increase considerably more.
14 It is understood that there is the potential for the number to increase to 21

GHD | Report for DSDMIP - Cairns Marine Precinct Growth Strategy (DSD-4692-16), 4219953 | 24
Assuming there are sufficient berths for the expected white boats.
Pacific Patrol Boat Replacement Program commences on time.
3 to 5 x OPVs are homeported in Cairns15.
Navy major Hydrographic vessel is homeported in Cairns.
Private vessels have not been included in this study
Based on dry dock demand calculations for the forward fleet (5,869 days - Table 12), there is a potential market increase of approximately 13% by 2022 from current 2016 levels (5,210 days), which is slightly below the national expected growth rate of around 5% per annum, which is largely driven by defence construction and support. However to be able to maintain market share, and grow with market demand, infrastructure capability, infrastructure capacity, and quality of service offering need to be aligned with those demanded by customers and regulators.
Table 12 – Future CMP infrastructure demand estimate (2022)
Source: TCS
15 It is understood that there are likely to be 4 OPVs stationed in Cairns; however, the demand analysis completed as part of this study applies a range of 3 to 5 OPVs to assess the CMP infrastructure demand requirement.

GHD | Report for DSDMIP - Cairns Marine Precinct Growth Strategy (DSD-4692-16), 4219953 | 25
7. Stakeholder outcomes In addition to providing input and information regarding current and future demand, stakeholders were engaged to assist identify issues and opportunities for the CMP. These primarily related to market, infrastructure, and commercial factors for the precinct. Based on these discussions, a number of themes were identified, which can be broadly grouped into the areas of:
Market factors
Infrastructure
Regulation and funding
Skills and labour
Alliances and integration
The remainder of this section addresses key themes identified through stakeholder consultation
7.1.1 Market factors
Stakeholders identified five main market factor themes, which shape the nature of demand (similar to that discussed in the previous sections of this report), and most notably, how industry perceives the ability of the CMP to be able to respond. The identified themes include:
Evolving services market – There are a number of high value market sectors which are increasing as a result of growing personal wealth. These sectors have an increasing demand for new technology capability, and, a high level of industrial hygiene. In meeting these niche demands there has been an emergence of smaller operators and service providers within the CMP, and more generally in the industry.
Underlying demand for other marine services – There is the opportunity for the broader industry to provide ancillary or complimentary services from the CMP through the industry cluster. For example, Border Force has the largest seagoing workforce in Australia. In addition to repair and maintenance services, complementary offerings, such as training can be provided to crew during this time.
New and emerging market potential is limited by the quality and capacity of existing infrastructure - Scale, capability and age of facilities and infrastructure in the CMP limits the ability for industry to be able to respond to current opportunities and expected changes in demand. For example, the nature of work and potential to increase services for superyachts is limited without upgrading facilities to meet industrial hygiene and work practices requirements. Similarly, some vessel repair and maintenance works require dredging to accept the larger naval vessels, and suitable wharf space for layup and in-water activities is very limited at some facilities.
The largest potential for growth is in the non-traditional market – While the changes over time in demand for maritime services has evolved the CMP to what it is currently, the majority of growth is expected to come from non-traditional sectors. For example, vessels supporting Tourism are not expected to show much growth; however, vessels supporting sectors such as oil and gas, and superyachts are expected to drive growth potential.
Service and maintenance facility decisions will be made by prime contractors, which have alternative facilities in Australia – With the award of vessel construction contracts, primarily defence, to large specialist ship builders such as Austal, the decision on locations for repair and maintenance services will be heavily influenced by these prime contractors. As these contractors have their own facilities elsewhere in Australia, it is

GHD | Report for DSDMIP - Cairns Marine Precinct Growth Strategy (DSD-4692-16), 4219953 | 26
critical for the CMP to be viewed attractively to secure these support contracts, particularly where Cairns is the best logistical location.
7.1.2 Infrastructure
Infrastructure capability meets current needs and targeted expansion – The capability of existing infrastructure broadly meets the needs of current demand, with the current ability to access additional land for expansion at some facilities. Additionally, there are good wharves at some facilities. These facilities have the capability to largely meet current and future needs (with respect to capability) of traditional markets – typically vessels 90m LOA or less, and, 1500 tonnes or less.
Infrastructure capability is competitive for the region – Despite the development of other facilities in the region, infrastructure capability is competitive, e.g., TRS having the largest capacity slipway between Sydney and Dampier. However, other facilities developed in the region have targeted specific market sectors for their resident fleet and opportunistic work.
New and emerging market potential is limited by the quality and capacity of existing infrastructure – There is the perception that the scale, capability and age of facilities and infrastructure in the CMP limits the ability for industry to be able to respond to current opportunities and expected changes in demand. For example, the nature of work and potential to increase services for superyachts is limited without upgrading facilities to meet industrial hygiene and work practices requirements. Similarly, some vessel repair and maintenance works require dredging to accept the larger naval vessels, and suitable wharf space for layup and in-water activities is very limited at some facilities.
Services quality and infrastructure access limits growth and flexibility for the industry – Capacity, quality of service and access to infrastructure within the CMP is unable to meet current demand, and is a limiting factor for growth and flexibility of the industry. For example, the capacity of electricity supply to the slipways is a major issue, requiring the use of on-site generators to meet site specific demands. Additionally, road access is considered an issue, as well as parking within the precinct, and the lack of public or common user access in Smith’s Creek
There are infrastructure capability constraints at existing facilities – While infrastructure generally meets the needs of current demand (but not all potential demand), this is not without a number of challenges and limitations. For example, some slipways are difficult to get on and off; sheds are limited in size, and, there is not enough peak slipway capacity (particularly where constraints limit access to particular facilities), which has resulted in the loss of 5 – 6 vessels per year
Development of new infrastructure that meets changing market quality needs – The development of new infrastructure within the CMP has been previously considered, and that any such infrastructure must meet changing market needs and quality. In particular, consideration has been given for improved lifting capacity for trawlers, lift capacity required for defence, and, improved quality facilities
Refurbishment/Rehabilitation/Improvement of existing infrastructure to deal accommodate current demand shortfalls – There are a number of potential options to deal with current demand shortfalls by rectifying or improving existing infrastructure within the CMP. In particular, the rehabilitation of some wharves within Smith’s Creek to provide additional layup capacity, modifications to existing infrastructure and improving access to CFB2 (the ‘duckpond’) to lift some restrictions placed on navigation in Smith’s Creek, and complementary infrastructure, such as fuelling space.

GHD | Report for DSDMIP - Cairns Marine Precinct Growth Strategy (DSD-4692-16), 4219953 | 27
Competing precincts have invested heavily in new market growth opportunities, which Cairns has struggled to capture – The development of new specialised, and market targeted infrastructure in the region has limited the ability of Cairns to respond. In particular, beyond Cairns, yards have improved/developed facilities to attract white boats (Brisbane and NZ), and Fiji is increasing the size of its marina to cater for the increase in superyacht numbers.
Changes in vessel characteristics in some markets increases the potential for loss of market share – With the evolving nature of market demand and the specifications of vessels, particularly in the traditional CMP market, there is the potential that if infrastructure in the CMP does not meet these demands, there is potential for a loss of market share, let alone growth. For example, the new deeper draft tugs require deeper water for slipping, with service work lost to other facilities, due to timing availability issues at the facilities that can provide the required capability.
7.1.3 Regulation and investment
There are regulatory constraints which limit growth potential – There are a number of regulatory barriers to growth, particularly for superyacht homeporting in Cairns, which places Cairns at competitive advantage for vessel repair and maintenance, as well as refit work. In particular, GST and Duty conditions under the Federal Government’s Coastal Trading Act are seen as a major limitation on potential growth.
Increase awareness of regional economic contribution –The CMP, as part of the port community, needs to increase awareness of the economic contribution to the region so that informed investment decisions can be made to sustain and grow the industry.
Increasing environmental controls (regulation and requirements), will require a shift from traditional practices to maintain market share – With increasing environmental requirements and standards for marine related activities near the GBRMP, infrastructure standards and practices will need to continually improve within the precinct, particularly as the majority of infrastructure within the CMP was developed to the standards of the day around 40 years ago.
7.1.4 Skills and Labour
A potential inability to accommodate changing skills demand, project management, and quality requirements, limits the ability of the industry to move with customer requirements – The increasing demand for new technology skills, industrial hygiene (particularly in growth market opportunities) standards, and project management practices of customers limits potential growth, as well as retaining existing customers that have increasing demands on service providers.
Difficulties in retaining a critical mass, appropriately skilled workforce has the potential to impact the ability of the precinct to move with customer needs and emerging market opportunities – Skills in ship building/maintenance are diminishing within the CMP, driven largely by an older skilled workforce retiring and the attractiveness of other industries. This has been observed particularly with the demand for skilled labour during the mining boom and oil and gas project development in Australia over recent years. The ability to retain and develop a base skilled labour force in Cairns is also impacted by sporadic workload, and the needs of workers to have reliable employment.

GHD | Report for DSDMIP - Cairns Marine Precinct Growth Strategy (DSD-4692-16), 4219953 | 28
7.1.5 Alliances and integration
Leverage marine services capability from the precinct – There is the opportunity for the broader industry to leverage off services provided by all organisations (and supporting service providers) in the CMP by effectively using the industry cluster.
Form strategic alliances with inter-regional competitors – There is advantage to be gained from having access arrangements and partnering with competing infrastructure and service providers. This limits potential customer leakage from the Cairns area and enables Cairns based companies to remain engaged where infrastructure requirements cannot be met in Cairns.

GHD | Report for DSDMIP - Cairns Marine Precinct Growth Strategy (DSD-4692-16), 4219953 | 29
8. Potential infrastructure requirements A number of key factors drive future infrastructure requirements at CMP, such as:
• Drydock activity demand,
• Capability requirements needed to unlock further growth opportunities,
• Future vessel size profile,
• Precinct shortcomings, and
• Ongoing environmental compliance.
As a part of this study each of the areas above were considered with respect to CMP in order to document future infrastructure requirements. The key infrastructure requirements identified, based on demand (capacity and capability) and stakeholder outcomes identified in the previous sections of this report for the CMP are listed in Table 13 below. The identified infrastructure requirements and associated works, are considered in the development of infrastructure strategies in Section 9.5.
Table 13 – Future potential infrastructure requirements (CMP)
Infrastructure requirements Basis Additional wharf capacity within Smith’s Creek
Overcoming industry identified shortcomings at precinct
Ports North to identify options for increased power supply capacity
Overcoming industry identified shortcomings at precinct
Increase capacity at TRS slipway, including corresponding increase in wharf capacity
Reduce current lost work opportunities
Ongoing investment in a modernisation and infrastructure quality improvement across the precinct
Industry protection measure for increasing environmental compliance requirements in the future and meet increasing customer demands
Introduction of new shiplift capacity (with an initial length of 90m) and further development of new hardstand and shed areas
This will require associated infrastructure works to provide access for current service providers and best use of available land and optimisation of existing infrastructure for hardstand development and purpose built sheds – particularly to meet superyacht requirements

GHD | Report for DSDMIP - Cairns Marine Precinct Growth Strategy (DSD-4692-16), 4219953 | 30
9. Precinct strategic options 9.1 Approach to strategy development
A sequential approach has been applied for development of strategy options for the CMP (Figure 12). The approach utilises the key themes identified in the stakeholder consultations, as described in the Section 7 of the report, and, to then undertake a gap and opportunities analysis using a SWOT framework. Based on the outcomes of the SWOT analysis, a range of options are developed and synthesised into a small number of aligned strategies with a view of maintaining market share and maximising growth opportunities. A range of implementation options are then identified (informed by the market demand assessment) with corresponding strategies (non-infrastructure and infrastructure).
Figure 12 – Approach to strategy development
9.2 SWOT Analysis
Utilising the themes identified in Section 7 of this report, a SWOT analysis was used to identify both gaps and opportunities for the CMP. Each key theme was assigned as a Strength, Weakness, Opportunity or Threat, to then be used for strategy option identification. The output of the SWOT analysis is summarised in Table 14.
Stakeholder outcomes SWOT analysis Strategy development and synthesizing
Implementation optionsEffectivness assessmentStrategy implementation

GHD | Report for DSDMIP - Cairns Marine Precinct Growth Strategy (DSD-4692-16), 4219953 | 31
Table 14 – CMP SWOT analysis
Strengths Weaknesses
Evolving services capability New and emerging market potential is limited by the quality and capacity of existing infrastructure
Breadth of marine services Services quality and infrastructure access limits growth and flexibility for the industry
Infrastructure capability meets current needs and targeted expansion
There are infrastructure capability constraints at existing facilities
Infrastructure capability is competitive for the region
There are regulatory constraints which limit growth potential
Mature industry with strong reputation The largest potential for growth is in the non-traditional market
Opportunities Threats
Development of new infrastructure that meets changing market quality needs
Competing precincts have invested heavily in new market growth opportunities, which Cairns has struggled to capture
Refurbishment/Rehabilitation/Improvement of existing infrastructure to deal accommodate current demand shortfalls
Changes in vessel characteristics in some markets increases the potential for loss of market share
Leverage marine services capability from the precinct
Increasing environmental controls (regulation and requirements), will require a shift from traditional practices to maintain market share
Form strategic alliances with inter-regional competitors
Service and maintenance facility decisions will be made by prime contractors, which have alternative facilities in Australia
Release of regulatory constraints
A potential inability to accommodate changing skills demand, project management, and quality requirements, limits the ability of the industry to move with customer requirements
Increase awareness of regional economic contribution to assist with state support funding
Difficulties in retaining a critical mass, appropriately skilled workforce has the potential to impact the ability of the precinct to move with moving customer needs and emerging market opportunities
9.3 Strategy development and synthesisation
Based on the outcomes of the SWOT analysis, strategies were formulated using the combinations of:
Strengths and Opportunities
Weaknesses and Opportunities
Strengths and Threats
Weaknesses and Threats
In developing the strategies, each of the identified themes is covered in combination, thereby producing a set of strategies for the CMP that are aligned with gaps and opportunities. The resulting strategies are provided in the below tables

GHD | Report for DSDMIP - Cairns Marine Precinct Growth Strategy (DSD-4692-16), 4219953 | 32
Table 15 – SWOT strategy formulation
SO Strategies WO
Strategies
S3,S4, O2 Targeted improvement of existing infrastructure to meet changing market needs
W1, W2, W3, O1
Develop/expand quality and capacity of existing infrastructure to meet market demands
S1, S2, S3,S4, S5, O3, O4
Position for strategic alliances (facilities and skills) based on industry reputation and capability
W1, W2, W3, O1
Refurbish/repurpose existing infrastructure to target capacity shortfalls
S2, S5, O5, O6
Leverage industry maturity and reputation to facilitate change in regulation and investment
W4, W5, O5, O6
Facilitate change in regulation and investment framework to respond to changing market demands and capacity/capability requirements
ST Strategies
WT Strategies
S3, S4, T1, T2
Target infrastructure investment (upgrade) for new market growth opportunities
W1, W2, W3, W4, T1, T2
Expand existing infrastructure capacity/capability to meet changes in demand (quantity and service level)
S5, T3, T1, T2
Introduce precinct level environmental monitoring and compliance protocols
W1, W2, W3, W4, T1, T3, T5
Develop new infrastructure to meet future specification, service levels and demand
S1, S2, S3,S4, S5, T4, T5, T6
Leverage off industry maturity, reputation, infrastructure and services capability and capacity to form strategic relationships or alliances with prime contractors
W1, W2, W5, T1, T3, T4
Refurbish and develop infrastructure to industry best practice (environmental)
S1, S2, S3,S4, S5, T4, T5, T6
Form strategic alliances with other infrastructure providers for services delivery to maintain and increase base level work load
W2, W5, T1, T2, T3, T4, T5
Form strategic alliances with prime contractors and facilitate process/project management transfer
S1, S5, T5 Introduce an industry wide services/practices initiative
W1, W2, W3, W5, T5, T6
Form strategic alliances with prime contractors and/or other infrastructure owners to facilitate skill and knowledge transfer for labour and increase base level work load to retain and grow industry capacity and capability for Cairns homed workforce
Consolidation and synthesising of the combination outcomes from Table 15 results in six key strategies to address identified gaps and pursue opportunities for the CMP, as shown in Table 16

GHD | Report for DSDMIP - Cairns Marine Precinct Growth Strategy (DSD-4692-16), 4219953 | 33
Table 16 – Key CMP growth strategies
Strategy Strategy type
Precinct coordination, marketing, compliance, monitoring, support and services/practices initiatives
Non-infrastructure
Form strategic alliances Non-infrastructure
Facilitate change in Federal Government regulation Non-infrastructure
Improve current infrastructure - standards and environmental standards Infrastructure
Expand current infrastructure Infrastructure
Assess new infrastructure to meet future demand (specifications and standards)
Infrastructure
The following sections define each of the key strategies and identify the potential benefits delivered through their implementation
9.4 Non infrastructure strategies
Three non-infrastructure strategies were identified that had varying potential for industry in the precinct.
9.4.1 Precinct coordination
Precinct coordination, for the large part provides a virtual/quasi vertical integration for the industry. It provides a centralised function for marketing, compliance, monitoring, support (including education) and services/practices initiatives. This strategy is common in many industries; however the reach of service integration varies.
The strategy is becoming increasingly important for strategic and targeted marketing, including promotion of a regional industry and capability through industry clustering and development of industry excellence.
There are a number of benefits that are realised for organisations in the CMP, including:
As a consolidated industry, provides opportunity for strategic alliances with inter-regional competitors to advantage CMP organisations. Additionally, this will assist in the perceived capability and capacity of the CMP to support prime contractors.
Improves services capability development through precinct wide coordination of training, skills sharing, and the ability to provide cross-skilling between precinct partner organisations.
Defers/offsets investment for organisations by having a more coordinated and efficient use of precinct wide infrastructure. This provides a whole of industry benefit, as opposed to three competing facilities in the CMP which, at times, may result in sub-optimal use of infrastructure. However this is limited by the capability of existing infrastructure, rather than capacity.
Provides a centralised independent administrative function that monitors compliance and regulation on a precinct wide basis.
Provides sufficient workflow, through potential labour sharing arrangements within the CMP to retain critical mass of skilled labour in the workforce.
Maintains, and to some degree improves, CMP reputation.

GHD | Report for DSDMIP - Cairns Marine Precinct Growth Strategy (DSD-4692-16), 4219953 | 34
9.4.2 Form strategic alliances
Strategic alliances provide broad ranging benefits for an industry. In particular, strategic alliances:
Minimise the potential of additional competition.
Minimise leakage of work from the region.
Improved systems and processes brought about by other management systems and knowledge transfer (providing the right strategic partners are identified).
Skills development and increased breadth.
Increases the labour pool, and provides opportunity to increase base load for the labour force – in the region, as well as outside the region to keep a highly skilled workforce engaged.
Strategic alliances can be formed both within the precinct (similar to coordination); as well as with Prime contractors and market leading ship builders.
With respect to the stakeholder themes used to inform the SWOT analysis, strategic alliances:
Provides a commercial relationship that minimises potential leakage from the Cairns region and provides opportunity to pair with prime contractors.
Improves services capability through systems and knowledge transfer, as well as skills sharing, and the ability to provide cross-skilling between partner organisations.
Provides the opportunity to leverage off the partner organisation’s infrastructure, where capability and capacity at CMP may not be achieved.
Provides sufficient workflow, through potential labour sharing arrangements within the CMP to retain critical mass of skilled labour in the workforce.
Maintains, and to some degree improves, CMP reputation.
9.4.3 Facilitate change in Federal Government regulation and policy
This strategy focuses on accessing potential new/expanded markets for Superyachts aligned with industry needs and future development. While these constraints affect a range of marine service and asset providers, as well as other regional economic and development stakeholders that are progressing change, a coordinated industry strategy to address these limitations, with leverage from a mature and economic contributing industry will add weight to the argument.
There are a number of benefits that are realised through this strategy, including:
Provides the opportunity for growth that is currently supressed due to regulation.
Provides access to the full potential for new fast growing market potential.
9.5 Infrastructure strategies
There were three identified infrastructure strategies for the CMP, based on the stakeholder theme SWOT analysis. The identified strategies, based on the infrastructure requirements in Section 8, essentially provide a sequential and staged level of intervention in response to resolving current industry shortfalls, and the ability to meet market growth. These strategies include:
Improve current infrastructure – minimal intervention to overcome current shortfalls.
Expand current infrastructure – modifications to existing infrastructure through minimal capital investment to provide increased capacity and maintain market share.

GHD | Report for DSDMIP - Cairns Marine Precinct Growth Strategy (DSD-4692-16), 4219953 | 35
Assess new infrastructure – the introduction of new enabling infrastructure for CMP tocapture growth opportunities.’
9.5.1 Improve Current Infrastructure
This strategy looks at a minimal capital spend to deal with pressing industry needs. The strategy does not however deal with changing specifications of vessels (defence), or growth opportunities (superyachts). The strategy addresses power supply issues for the precinct, a lack of common use layup berth area (as well as increasing wet servicing capacity), including access, and, potential car parking.
Infrastructure development delivered through the ‘improve current’ strategy includes:
Rehabilitation and access to appropriate existing wharves within Smith’s Creek.
Ports North to identify options for increased power supply capacity.
Create new land backing at the rehabilitated/new wharf area – for repair access andadditional car parking for the area.
9.5.2 Expand Current Infrastructure
This strategy looks to expand current facilities. The strategy supports the extension of the TRS slipway, increases common use layup berth area to form a continuous land-backed wharf, and invests in the modernisation of existing operator areas to align with competing facilities.
9.5.3 Assess New Infrastructure
Common user infrastructure, including a shiplift was initially considered during the preparation of the strategy. However, upon review, existing shipyard configuration may restrict common user access. To fully consider common user infrastructure it is recommended that the following actions take place:
1. Seek confirmation from the Federal Government of the level of Defence sustainment and maintenance commitments for Cairns (demand).
2. Seek confirmation from the Federal Government of the type of infrastructure required for Defence sustainment and maintenance committed (required infrastructure).
3. Cairns sustainment and maintenance providers analyse existing infrastructure against all demand and required infrastructure.
4. Ports North undertake master planning of the CMP taking into account (1), (2) and (3) above.
If, as a result, it is determined that a common user shiplift will yield the best return for the level of demand then a number of elements need to be considered, including:
Location,
Providing suitable navigable deep water corridor access to the selected appropriateshiplift site,
Improving connectivity between lay down and work areas across the precinct,
Relocating the fishing fleet, and
Determination of suitable business model for delivery.

GHD | Report for DSDMIP - Cairns Marine Precinct Growth Strategy (DSD-4692-16), 4219953 | 36
9.5.4 Marine infrastructure strategy overview
To allow for the efficient future development of the precinct, alignment of land purpose is optimal to minimise industry fragmentation and provide most appropriate use of high value marine access land.
The marine infrastructure strategy developed as part of this study includes the extension of the shiplift to meet superyacht requirements ~150m retaining 1500t capacity, development of an access corridor for efficient transfer of vessels within the broader precinct area, and connects with Tingara Street.
A graphical representation of the marine infrastructure strategy overview developed as part of this study is provided in Figure 13.
Figure 13 – Marine infrastructure strategy overview
Source: GHD
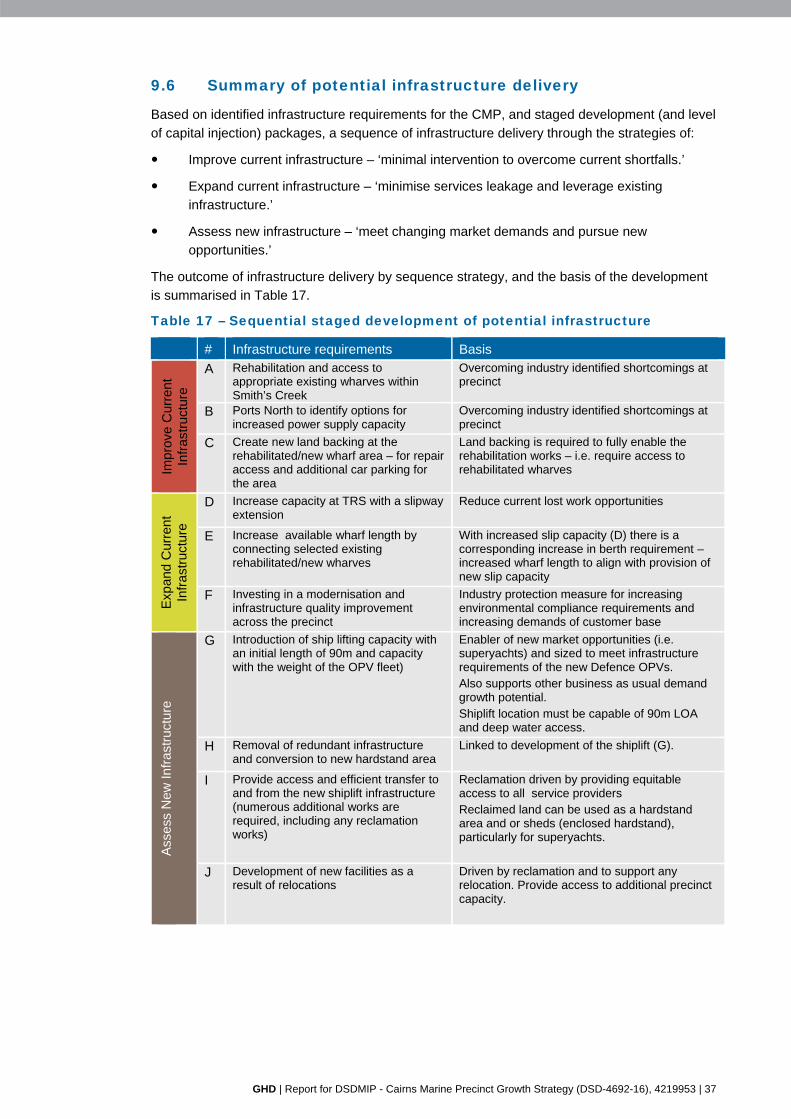
GHD | Report for DSDMIP - Cairns Marine Precinct Growth Strategy (DSD-4692-16), 4219953 | 37
9.6 Summary of potential infrastructure delivery
Based on identified infrastructure requirements for the CMP, and staged development (and level of capital injection) packages, a sequence of infrastructure delivery through the strategies of:
Improve current infrastructure – ‘minimal intervention to overcome current shortfalls.’
Expand current infrastructure – ‘minimise services leakage and leverage existing infrastructure.’
Assess new infrastructure – ‘meet changing market demands and pursue new opportunities.’
The outcome of infrastructure delivery by sequence strategy, and the basis of the development is summarised in Table 17.
Table 17 – Sequential staged development of potential infrastructure
# Infrastructure requirements Basis
Impr
ove
Cur
rent
In
frast
ruct
ure
A Rehabilitation and access to appropriate existing wharves within Smith’s Creek
Overcoming industry identified shortcomings at precinct
B Ports North to identify options for increased power supply capacity
Overcoming industry identified shortcomings at precinct
C Create new land backing at the rehabilitated/new wharf area – for repair access and additional car parking for the area
Land backing is required to fully enable the rehabilitation works – i.e. require access to rehabilitated wharves
Expa
nd C
urre
nt
Infra
stru
ctur
e
D Increase capacity at TRS with a slipway extension
Reduce current lost work opportunities
E Increase available wharf length by connecting selected existing rehabilitated/new wharves
With increased slip capacity (D) there is a corresponding increase in berth requirement – increased wharf length to align with provision of new slip capacity
F Investing in a modernisation and infrastructure quality improvement across the precinct
Industry protection measure for increasing environmental compliance requirements and increasing demands of customer base
Asse
ss N
ew In
frast
ruct
ure
G Introduction of ship lifting capacity with an initial length of 90m and capacity with the weight of the OPV fleet)
Enabler of new market opportunities (i.e. superyachts) and sized to meet infrastructure requirements of the new Defence OPVs. Also supports other business as usual demand growth potential. Shiplift location must be capable of 90m LOA and deep water access.
H Removal of redundant infrastructure and conversion to new hardstand area
Linked to development of the shiplift (G).
I Provide access and efficient transfer to and from the new shiplift infrastructure (numerous additional works are required, including any reclamation works)
Reclamation driven by providing equitable access to all service providers Reclaimed land can be used as a hardstand area and or sheds (enclosed hardstand), particularly for superyachts.
J Development of new facilities as a result of relocations
Driven by reclamation and to support any relocation. Provide access to additional precinct capacity.

GHD | Report for DSDMIP - Cairns Marine Precinct Growth Strategy (DSD-4692-16), 4219953 | 38
9.7 Strategy effectiveness and implementation timing
Based on the benefits identified for each strategy in the preceding sections, a framework has been applied to assess the potential change in responsiveness or alignment of the CMP against each of the stakeholder themes used to develop the SWOT analysis.
Table 18 – Summary of strategy effectiveness assessment
Strategy Factor evaluation score post implementation
Current 4.63 Strategic Alliances 6.08 Improve Current Infrastructure 5.18 Expand Current Infrastructure 5.68 New Infrastructure 6.77 Regulatory Change 5.42 Precinct coordination 6.08
Based on the outcomes of the strategy effectiveness assessment, implementation could effectively include:
Immediate to short term strategy for infrastructure would be to ‘Improve’ and ‘Expand Existing’ and implement port infrastructure strategies.
Medium to long term – implement ‘New expansion’ on achieving Regulatory change and/or the award and sustainment decisions for the OPV fleet with respect to homeporting in Cairns. Introduce precinct protection through land purpose alignment to allow industry to grow/develop private hardstand and shed infrastructure in response to demand materialisation.

GHD | Report for DSDMIP - Cairns Marine Precinct Growth Strategy (DSD-4692-16), 4219953 | 39
10. Conclusions Based on the analysis undertaken as part of this study, a number of key conclusions against the key objectives have been identified. These include:
Potential for future market growth future opportunities for marine precinct operators
Analysis of current and future vessel fleets identified a potential demand increase for drydock activities by 13% over the next five years. Potential opportunities largely come from:
An increase in the number of Cairns home ported superyachts – with the level of growth largely dependent on changes to the Australian Coastal Act and GBRMPA regulations for international vessels. These vessels are likely to increase in size from a typical length of 60m to potentially up to 140-150m, albeit lower in number with changes in regulation.
A net reduction in the number of naval vessels is expected; however, the replacement vessels will be larger than the current fleet at 80m LOA with a weight of 1,500-2,000 tonnes (potentially up to 3,000 tonnes). In addition, the 19 Pacific Patrol boats are likely to be serviced in Cairns.
The fishing fleet is expected to increase in number with home porting decisions made by a number of operators.
Infrastructure needs to capture future market opportunities including both dedicated and common users
Based on the gaps and opportunities analysis using current and future demand of vessels and key stakeholder themes, a sequential and staged approach to sustain the current industry and grow to secure future demand was identified. This included:
Improve current infrastructure – through minimal intervention to overcome current shortfalls.
Expand current infrastructure – modifications to existing infrastructure through minimal capital investment to provide increased capacity and maintain market share.
Assess new infrastructure – the introduction of new enabling infrastructure for CMP to capture growth opportunities, which may include future private development or Common Use Infrastructure.
In addition to infrastructure needs, a number of non-infrastructure strategies were identifies for implementation that would assist in the development of skills and retain employment within the CMP, as well as open new market opportunities and minimise potential leakage for ship repair and maintenance services from the region. These included:
Precinct coordination, marketing, compliance, monitoring, support and services/practices initiatives.
Form strategic alliances with prime contractors and, where advantageous, other competing service providers.
Facilitate change in regulation, particularly the Australian Coastal Shipping Act for determination of GST payments, to unlock potential growth, particularly resulting from superyacht homeporting in Cairns.
Risks to operators of strategic significance from domestic and international sources
Based on the SWOT analysis undertaken to identify key gaps and opportunities, the primary risks to operators include:

GHD | Report for DSDMIP - Cairns Marine Precinct Growth Strategy (DSD-4692-16), 4219953 | 40
Infrastructure capacity and capability to accommodate change in the specification of vessels, particularly in the key non-traditional market sector growth.
Increasing compliance requirements and the fit with some existing infrastructure, particularly driven by increasing controls associated with the GBRMP.
The ability to retain, and upskill, a specialist skilled labour pool, particularly with sporadic demand.
The increasing industrial hygiene and practices required for key growth sectors, particularly with the development of new specialised infrastructure targeted at growth market sectors, and the ability for CMP to retain that work.
Land use and precinct planning for marine infrastructure upgrades
A staged development strategy was identified as the best approach for land use and precinct planning for current infrastructure, which, dependent on further land use planning investigations, provisioning of access for CMP users with for key new infrastructure is critical. Beyond the delivery of new infrastructure (private or common use), an ultimate development strategy, by way of an integrated Cairns long term master plan needs to be developed, which is aimed at alignment, purposing and protection of land related to key CMP activities – with provision for expansion was identified.
Priority marine precinct infrastructure that will contribute to the long term development of the marine precinct and interests of stakeholders
The staged development for sustaining and growing the CMP identified numerous infrastructure requirements. These include:
Improve current infrastructure – increase power supply capacity for the precinct, rehabilitation of common user wharf infrastructure to be used as layup for the precinct, and development of land to provide access to the rehabilitated/new wharf, and resolve issues regarding parking.
Expand current infrastructure – Increasing capacity at TRS with a slipway extension, increasing common user wharf length by connecting selected existing rehabilitated/new wharves, and investing in a modernisation and infrastructure quality improvement across the precinct.
Assess new infrastructure –introduction of a multi or common user shiplift (with an initial length of 90m and capacity of 1,500-2,000 tonnes, which needs to be aligned with requirements for the new OPV vessels). To facilitate access and efficient transfer to and from the new infrastructure, numerous additional works are required, including some reclamation works and a culvert to connect TRS with BSE facilities, development of infrastructure to relocate the fishing fleet from CFB1, most likely to CFB2 and a new CFB3 area, including an extension to Tingara Street for access. Removal of the existing BSE slipway and development of new hardstand area, allocation of an area for Norship within the redeveloped wharf land backed area for access to the shiplift.

GHD | Report for DSDMIP - Cairns Marine Precinct Growth Strategy (DSD-4692-16), 4219953 | 41
11. Next StepsTo fully consider potential new infrastructure the following steps could be taken:
1. Seek confirmation from the Federal Government of the level of Defence sustainment and maintenance commitments for Cairns (demand).
2. Seek confirmation from the Federal Government of the type of infrastructure required for the Defence sustainment and maintenance committed (required infrastructure).
3. Cairns sustainment and maintenance providers analyse existing infrastructure against all demand and required infrastructure.
4. Seek confirmation from the Federal Government to potential changes to the Australian Coastal Act.
5. As regulatory environment improves, determine and analyse infrastructure requirements for Superyacht sustainment and maintenance.
6. Ports North undertake master planning of the CMP taking into account above matters.

GHD | Report for Department of State Development - Cairns Marine Precinct Growth Strategy (DSD-4692-16), 4219953
Appendices

GHD | Report for Department of State Development - Cairns Marine Precinct Growth Strategy (DSD-4692-16), 4219953
Appendix A – Vessel demand (TCS)


GHD Pty Ltd Demand Analysis for the Cairns Marine Precinct – FINAL DRAFT V2 16.02.17
Thompson Clarke Shipping Pty Ltd Office 1B, 78 Terrigal Esplanade
Terrigal NSW 2260 Australia
Tel: +61 (02) 4385 8752 Mb: +61 (0)419 333 550
E-mail: [email protected]
GHD Pty Ltd
Demand Analysis for the Cairns Marine
Precinct
February 2017
FINAL

GHD Pty Ltd Demand Analysis for the Cairns Marine Precinct
February 2017 i
Reliance and Disclaimer The professional analysis and advice in this report has been prepared by Thompson Clarke Shipping (TCS) for the exclusive use of the party or parties to whom it is addressed (the addressee) and for the purposes specified in it. This report is supplied in good faith and reflects the knowledge, expertise and experience of the consultants involved. The report must not be published, quoted or disseminated to any other party without TCS’s prior written consent. TCS accepts no responsibility whatsoever for any loss occasioned by any person acting or refraining from action as a result of reliance on the report, other than the addressee. In conducting the analysis in this report TCS has endeavoured to use what it considers is the best information available at the date of publication, including information supplied by the addressee. Unless stated otherwise, TCS does not warrant the accuracy of any forecast or prediction in the report. Although TCS exercises reasonable care when making forecasts or predictions, factors in the process, such as future market behaviour, are inherently uncertain and cannot be forecast or predicted reliably.

GHD Pty Ltd Demand Analysis for the Cairns Marine Precinct
February 2017 ii
Table of Contents 1 Background ...................................................................................................................................... 1 2 Aim ................................................................................................................................................... 2 3 Scope of Work ................................................................................................................................. 3
3.1 Existing Demand Analysis ....................................................................................................... 3 3.2 Future Demand Analysis ......................................................................................................... 3
4 Approach Methodology .................................................................................................................... 4 4.1 Project Briefing/Inception Meeting .......................................................................................... 4 4.2 Pre Site Research and Review ............................................................................................... 4
4.2.1 Review of all Project Documentation ................................................................................. 4 4.2.2 Research Existing Precinct Users/Proponents .................................................................. 4 4.2.3 Research Existing Vessel Activities and Shipping Movements ......................................... 4
4.3 Conduct Consultations ............................................................................................................ 4 4.4 Post Site Visit Consultations ................................................................................................... 6 4.5 Development of Draft Report .................................................................................................. 6
5 Stakeholders Outcomes .................................................................................................................. 7 5.1 List of Stakeholders ................................................................................................................. 7 5.2 Summary of Stakeholder Feedback ........................................................................................ 7
5.2.1 Current Facilities ................................................................................................................ 7 5.2.2 Future Facilities.................................................................................................................. 7 5.2.3 Superyachts ....................................................................................................................... 8 5.2.4 Opportunities...................................................................................................................... 8 5.2.5 Restrictions ........................................................................................................................ 8
6 Demand Analysis ............................................................................................................................. 9 6.1 Current .................................................................................................................................... 9
6.1.1 Arrivals at Shipyards .......................................................................................................... 9 6.2 Future Demand (Year 2022) .................................................................................................10 6.3 Current Fleet .........................................................................................................................11
6.3.1 Superyachts ..................................................................................................................... 11 6.3.2 White Boats ...................................................................................................................... 11 6.3.3 Fishing Vessels ................................................................................................................ 11 6.3.4 Government Fleets - Navy, Border Patrol, Customs, State Government ........................ 12 6.3.5 Reef Fleet ........................................................................................................................ 12 6.3.6 Commercial ...................................................................................................................... 13
6.4 Future Fleet ...........................................................................................................................14 6.4.1 Superyachts ..................................................................................................................... 14 6.4.2 White Boats ...................................................................................................................... 16 6.4.3 Fishing Fleet .................................................................................................................... 16 6.4.4 Government Fleets - Navy, Border Patrol, Customs, State Government ........................ 17 6.4.5 Reef Fleet ........................................................................................................................ 18 6.4.6 Commercial Ships ............................................................................................................ 18 6.4.7 Pacific Patrol Boat Replacement Fleet ............................................................................ 18 6.4.8 Current and Future Fleets Summary Table ..................................................................... 19 6.4.9 Vessel Measurement ....................................................................................................... 19
7 Current/Future Facilities ................................................................................................................21 7.1 Norship ..................................................................................................................................21 7.2 Cairns Cruising Yacht Squadron ...........................................................................................22 7.3 BSE Cairns Slipway ..............................................................................................................22 7.4 Tropical Reef Shipyard ..........................................................................................................23 7.5 Coconut Slipway ...................................................................................................................25 7.6 Smith Creek Wharf Facilities .................................................................................................25
8 Bibliography ...................................................................................................................................27 Annexures ............................................................................................................................................. i

GHD Pty Ltd Demand Analysis for the Cairns Marine Precinct
February 2017 iii
List of Tables Table 1 - Chronological Stakeholder Discussion ..................................................................................................... 5 Table 2 - Demand Analysis – Current Fleet ............................................................................................................. 9 Table 3 - Vessels Moving to Cairns Shipyards CY (03.02.16 – 02.02.17) ............................................................... 9 Table 4 - Demand Analysis – Future Fleet ............................................................................................................ 10 Table 5 - In Season Fleet ...................................................................................................................................... 11 Table 6 - Out of Season ........................................................................................................................................ 11 Table 7 - Combined Total ...................................................................................................................................... 11 Table 8 - Number of Commercial Vessels Based in Cairns ................................................................................... 13 Table 9 - Superyacht Visitations ............................................................................................................................ 14 Table 10 - Outcome of Changes to Coastal Shipping Act ..................................................................................... 16 Table 11 - Vessel Measurement ............................................................................................................................ 20 Table 12 - Difference in Beam and Lightweight ..................................................................................................... 20 Table 13 - Current Vessels Utilising Cairns Marine Precinct ................................................................................. 20 List of Figures Figure 1 - Port of Cairns Chartlet ............................................................................................................................. 1 Figure 2 - Norship Travel Lift ................................................................................................................................. 21 Figure 3 - Cairns Cruising Yacht Squadron Travel Lift .......................................................................................... 22 Figure 4 - BSE Cairns Slipway Showing Curve on the Slipway Tracks ................................................................. 23 Figure 5 - Tropical Reef Shipyard Floating Dock ................................................................................................... 24 Figure 6 - Tropical Reef Shipyard .......................................................................................................................... 24 Figure 7 - Coconut Slipway.................................................................................................................................... 25 Figure 8 - Smiths Creek Berths ............................................................................................................................. 26

GHD Pty Ltd Demand Analysis for the Cairns Marine Precinct
February 2017 1
1 Background The Queensland Department of State Development (DSD) has entered into an agreement with Ports North to undertake a study for the possible revitalisation of the slipway facilities, in Smiths Creek, and associated wharves and infrastructure. DSD (the “Client”) has contracted GHD Pty Ltd (GHD) to undertake this study. The work undertaken by GHD is to concentrate on the part of Port of Cairns commencing at the Tropical Reef Shipyard and upstream through Smiths Creek concluding to the south of the Queensland Transport Maritime Operations Base as shown in the following chartlet. Figure 1 - Port of Cairns Chartlet
The Royal Australian Navy (RAN) base and sugar terminal are included in this study from a vessel usage point only and not considered for minor or major reconstruction/configuration as may be required of the facilities and berths within Smiths Creek. It is understood the RAN will be assessing its own needs as it works up for the possible arrival of the new Offshore Patrol Vessels (OPVs). Thompson Clarke Shipping Pty Ltd (TCS) has been retained through a sub consultancy, with GHD, to contribute to a demand analysis for the Cairns Marine Precinct, which may include parts or all of the stretch of water and associated wharves and infrastructure shown in the above chartlet, as in input to the development of a wider Strategy.

GHD Pty Ltd Demand Analysis for the Cairns Marine Precinct
February 2017 2
2 Aim Cairns Port has been at the forefront of Australian shipbuilding and ship maintenance at an earlier time when naval patrol boats, fishing boats and passenger ferries were built in facilities adjacent to Smiths Creek. This shipbuilding and maintenance has been an important part of the Cairns economy Shipbuilding generally fell away and the shipyards then concentrated on ship maintenance to keep the yards occupied. However with increasing vessel sizes and complexity, retaining this maintenance work is proving increasingly difficult against increased competition, both nationally and internationally. The Project Objective (aim) for the TCS work is to contribute to a demand analysis for the Cairns Marine Precinct as an input to the development of a wider growth strategy. TCS’ specific role for this project, as maritime consultant, will be to perform the existing shipping demand assessment and to identify future demand opportunities for all potential users of the marine precinct.

GHD Pty Ltd Demand Analysis for the Cairns Marine Precinct
February 2017 3
3 Scope of Work To perform the existing shipping demand assessment and to identify future demand opportunities for all potential users of the marine precinct TCS has been allocated the following scope items:
3.1 Existing Demand Analysis
Demand analysis [for both the construction phase and thereafter for the Maintenance-Repair-Operations (MRO) phase] – existing demand assessment.
3.2 Future Demand Analysis
Demand analysis [for both the construction phase and thereafter for the Maintenance-Repair- Operations (MRO) phase] – future demand opportunities for other sectors, including defence, superyachts and commercial marine etc.

GHD Pty Ltd Demand Analysis for the Cairns Marine Precinct
February 2017 4
4 Approach Methodology Given the specific requirements of GHD’s project brief, TCS proposed the following project methodology. Outcomes of the methodology approach are also detailed here:
4.1 Project Briefing/Inception Meeting
The project briefing/inception meeting was held in the Ports North Cairns office on Monday 30th January with Ports North, DSD, GHD and TCS team members present.
4.2 Pre Site Research and Review
4.2.1 Review of all Project Documentation
TCS undertook a period of research and review of all available literature provided by GHD and Ports North in relation to the head project and the sub consultancy.
4.2.2 Research Existing Precinct Users/Proponents
TCS undertook a period of research and review of all literature determined to be relevant, including details of shipyards and marine maintenance service providers along with the vessel specifications for those vessels capable of utilising businesses along Smiths Creek. Details of the shipyards are included in section 7 - Current/Future Facilities. Details of the frequent user vessels are included in section 6.3 - Current Fleet. Harbour Master’s directions, Port Information Manual and Ports North public information was also researched and reviewed.
4.2.3 Research Existing Vessel Activities and Shipping Movements
Whilst research of existing vessel activities and shipping movement was conducted prior to the interview process the most relevant and beneficial information was gained at the interviews, as it was current, unlike several of the web sites visited where information had been reduced for public access or was missing. Ports North provided the most accurate shipping movement log in the form of an excel spread sheet which had 26,082 line items from 01.03.2012 to 02.02.2017. With prudential manipulation of the data this was reduced to 170 pages of movement logs and further reduced to provide data for the previous twelve months only, which has been analysed for this study.
4.3 Conduct Consultations
A total of seventeen stakeholder discussions were conducted across the five days (Monday 30.01.17 to Friday 03.02.17 inclusive). A sound cross section of key stakeholders were interviewed to inform the demand analysis process. During the week of the interviews a major shipbuilder (Austal) held a press release and industry meetings, in Cairns, to announce future plans for vessel numbers planned to visit Cairns for maintenance purposes. These vessels will be entered into the demand analysis for future vessels. Phone calls were placed with Austal in an attempt to gather further information on Austal’s plans. The complete list of stakeholders consulted is as follows:

GHD Pty Ltd Demand Analysis for the Cairns Marine Precinct
February 2017 5
Table 1 - Chronological Stakeholder Discussion
Organisation Name Title Address Date Time Venue Ports North Chris Boland Chief Executive
Officer cnr Grafton and Hartley Streets, Cairns 4870
30/01/2017
9.00am Ports North offices
Michael Colleton General Manager, Commercial
David Good Kelsey Ormsby
Manager Operations DSD
Norship Marine
Ray Fry Executive Director 56-62 Tingira Street, Portsmith, 4870
10.30am Norship Marine facility Olav Groot Chief Executive
Officer Tropical Reef Shipyard
Rob Downing Neil Stanmore
GM marketing and Business general Manager
1 Trawler Base Road, Portsmith 4870
1.30pm TRS facility
Great Barrier Reef International Marine College
Gary Haddock Portfolio Manager, Marine
55-61 Tingira Street, Portsmith 4870
3.30pm GBRIMC facility
Superyachts Group Great Barrier Reef
Joanne Drake Manager 1/51 Esplanade, Cairns 4870
31/01/2017 9.00am Superyachts Group offices Carrie Carter
Stuart Cowen Chair Advance Cairns
HMAS Cairns Carl Capper Commanding Officer
Draper Street, Cairns 4870
10.30am Telecon - from GHD offices
Department of Defence
Andrew Mackinnon
Navy Infrastructure Plans
Maritime Safety Queensland
Michael Barnett David Ferguson
Regional Harbour Master Cairns ARHM
100-106 Tingira Street, Portsmith 4870
1.30pm MSQ facility
BSE Cairns Slipways
Simon Pedley Dockyard Manager
61-79 Cook Street, Portsmith 4870
3.30pm BSE facility
Defence Industries Qld (DSD)
Mal Lane Director Level 18, 1 William Street, Brisbane 4000
1/02/2017 9.30am Telecon - from GHD offices
Quicksilver Group
Tony Baker Peter Price
Managing Director Group Engineering Manager
Reef Fleet Terminal, 1 Spence Street, Cairns 4870
12.00pm
Sea Swift Peter Domenighini Lino Bruno Fred White
Operations General Manager COO MD & CEO
41-45 Tingira Street, Portsmith Queensland 4870
2.00pm Sea Swift office
Cairns Regional Council
Neil Quinn Executive Manger Level 3, 119-145 Spence Street, Cairns 4870
2/02/2017 12.00pm Council offices Bob Manning Mayor
Association of Marine Park Tourism Operators
Col McKenzie Executive Director PO Box 6829 Cairns 4870 Level 1, 144 Sheridan Street Carins 4870
3.00pm AMPTO offices
Advance Cairns
Trent Twomey Chair 51 The Esplanade, Cairns 4870
3/02/2017 11.00am Advance Cairns offices
Cairns Chamber of Commerce
Debbie Hancock CEO Suit M2A Mezzanine level, The Pier
12.30pm CCC offices
Ports North Michael Colleton + others
General Manager, Commercial
cnr Grafton and Hartley Streets, Cairns 4870
2.00pm Ports North offices

GHD Pty Ltd Demand Analysis for the Cairns Marine Precinct
February 2017 6
4.4 Post Site Visit Consultations (telephone conference with identified potential users)
Post site visit consultations where limited due to the level of input received during the interview stage, however requests for further information were made to: Ports North List of Cairns homeport vessels. Norship Whereabouts of Bay Class vessels. Austal Information on Pacific Patrol Boats. DSD Navy Vessels based in Cairns. Reef VTS Traffic numbers. GHD Home port vessels. MSQ Traffic numbers. Lurssen Defence Light ship weight OPVs.
4.5 Development of Draft Report (to include both existing demand and potential future demand opportunities)
The Report includes both the existing demand and potential future demand opportunities.
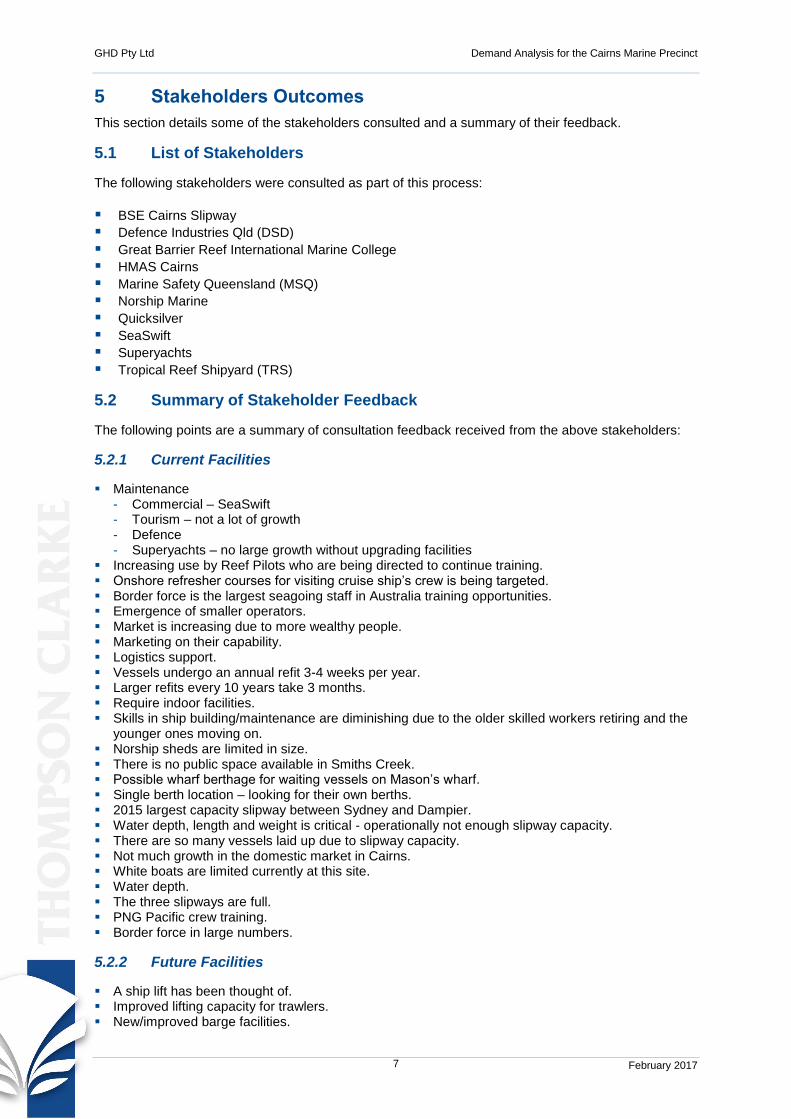
GHD Pty Ltd Demand Analysis for the Cairns Marine Precinct
February 2017 7
5 Stakeholders Outcomes This section details some of the stakeholders consulted and a summary of their feedback.
5.1 List of Stakeholders
The following stakeholders were consulted as part of this process: BSE Cairns Slipway Defence Industries Qld (DSD) Great Barrier Reef International Marine College HMAS Cairns Marine Safety Queensland (MSQ) Norship Marine Quicksilver SeaSwift Superyachts Tropical Reef Shipyard (TRS)
5.2 Summary of Stakeholder Feedback
The following points are a summary of consultation feedback received from the above stakeholders:
5.2.1 Current Facilities
Maintenance - Commercial – SeaSwift - Tourism – not a lot of growth - Defence - Superyachts – no large growth without upgrading facilities
Increasing use by Reef Pilots who are being directed to continue training. Onshore refresher courses for visiting cruise ship’s crew is being targeted. Border force is the largest seagoing staff in Australia training opportunities. Emergence of smaller operators. Market is increasing due to more wealthy people. Marketing on their capability. Logistics support. Vessels undergo an annual refit 3-4 weeks per year. Larger refits every 10 years take 3 months. Require indoor facilities. Skills in ship building/maintenance are diminishing due to the older skilled workers retiring and the
younger ones moving on. Norship sheds are limited in size. There is no public space available in Smiths Creek. Possible wharf berthage for waiting vessels on Mason’s wharf. Single berth location – looking for their own berths. 2015 largest capacity slipway between Sydney and Dampier. Water depth, length and weight is critical - operationally not enough slipway capacity. There are so many vessels laid up due to slipway capacity. Not much growth in the domestic market in Cairns. White boats are limited currently at this site. Water depth. The three slipways are full. PNG Pacific crew training. Border force in large numbers.
5.2.2 Future Facilities
A ship lift has been thought of. Improved lifting capacity for trawlers. New/improved barge facilities.

GHD Pty Ltd Demand Analysis for the Cairns Marine Precinct
February 2017 8
1,000t travel lift required. Requires dredging to accept the OPVs. Require a larger travel lift. Whilst building the new Navy facilities, 2019/20 will require a lot of off base support. Possible future wharf for the Navy vessels. Attractiveness of the existing slipways to the prime contractors for navy redevelopment will be
critical. Question on how to get ammunitions on and off the OPVs in Cairns – OPV has bigger munitions
which can’t be moved across the Navy wharves. Look at Admiralty Island discharge piles then to Swallows Landing by barge. Cut Fishing Wharf No.2 in half and dredge Duckpond to take vessels up to 100m is possible. Floating dry dock would need to be driven up with tug assistance. Servicing lifeboats for visiting cruise ships. Port Douglas glass bottomed boats and 5 semi submersibles done at Port Douglas at the moment. Fueling and berthing space. Common user or multi user site (suggested at BSE site).
5.2.3 Superyachts
Outside Cairns, yards have improved to attract white boats. Superyacht numbers will increase if Great Barrier Reef Marine Authority (GBRMPA) and GST
issues are relaxed. Water depth is critical to cater for bigger vessels. Cruising yachts are restricted due to water depth
in Cairns Harbour – channel, berth pockets and swing basins. When visiting superyachts want to go chartering in Australia they must complete voyages from one
port to another. Can’t go from one port to a reef destination and then back to the same port. The Coastal Trading Act is an obstacle. GST implications (10%) where it is paid on the value of the vessel and the value of the charter. Lots of boats waiting for legislation to change prior to chartering. White boats are limited currently at this site. White boat refreshers.
5.2.4 Opportunities
More Defence. Partnering with Darwin. May be more work coming from the South of Embley project. Improved facilities in terms of quality. Oil and gas. New commercial vessels will need to use the commercial wharves. New commercial vessels will be 90m LOA. New commercial vessel will be 1,500t light ship. Must develop Admiralty Island – good solid granite base.
5.2.5 Restrictions
Deeper draft tugs are looking for slipping but need deeper water. Electricity is a major issue for the slipways. Road access is an issue. Parking is an issue. Environmental constraints are coming. Limitation on the wharf side maintenance access. Dredging limitations. Classification of Government Priority Port. Tidal flooding improvements. Losing out to Brisbane and NZ (which is full and turning boats away). Fiji is increasing the size of its marina to cater for the increase in superyacht numbers. Limitations on environmental control. Water depth.

GHD Pty Ltd Demand Analysis for the Cairns Marine Precinct
February 2017 9
6 Demand Analysis 6.1 Current
The following demand analysis has been calculated using average times between docking periods and average times for vessels on the slip. It is known, for example, that a standard dry docking for a Pacific Patrol boat is 6 weeks, however an extended refit for the same vessel can take up to 6 months. SeaSwift vessels are docked every 2.5 years, however refits are completed every 2 – 3 years. It is possible these two maintenance periods are combined thereby reducing the time required on the slip. Table 2 - Demand Analysis - Current Fleet
Fleet Number for Slipping Calculation Days Required
Superyachts 12 home based 39 visiting
Last CY these vessels utilised 474 slip days
474
White Boats 4 home based unknown visiting
at 15 days per year 60
Fishing 98 home based unknown visiting
21 days every 2 years 1,029
Navy 9 home based 6 weeks every 2 years 189 Federal and State Governments
Border Patrol = 8 vessels slipped @ 2yrs Customs = 6 vessels State Gov. = 14 vessels (includes 6 Pilot Boats)
6 weeks every 2 years 3 per year @ 6 weeks 7 per year @ 4 weeks
168
126 196
Reef Fleet 60 home based 18 slip days per year 90 days every 10 years @ 6 per year
1,080 540
Commercial 80 home based 2 x line haul @ 6 weeks at 2 year intervals 78 @ 4 weeks every 2.5 years 4 x reef pontoons @ 90 days every 10 years 44 x Quicksilver 90 day refits each 10 years
42
874
36
396 TOTAL 5,210
6.1.1 Arrivals at Shipyards
Ports North shipping movement data was inconsistent in defining actual movements to the shipyard areas and was not used further in this Report as their data is based on movement from a Ports North berth only and doesn't capture total movements. Table 3 - Vessels Moving to Cairns Shipyards CY (03.02.16 – 02.02.17)
Shipyard Shipyard Figures Norship At interview the number of boats serviced was stated as 600. At a later
phone call this figure was amended to 400 – 600. BSE Cairns Slipway Undertook 39 slippings/dry dockings for the year. Further vessels were
worked on alongside the wharf. No number supplied. BSE also undertakes work on damaged vessels parts (e.g. propellers) which are road delivered to their yard.
Tropical Reef Shipyard 21 – 24 slippings per annum with a total of 40 boats serviced between slippings and alongside the wharf.
Coconut Slipway Not sought due to the low number of small, principally, recreational vessels utilizing this facility.
Cairns Cruising Yacht Squadron
Not sought due to the low number of small, principally, recreational vessels utilizing this facility.

GHD Pty Ltd Demand Analysis for the Cairns Marine Precinct
February 2017 10
6.2 Future Demand (Year 2022)
The future demand has been calculated through interaction with the principle users of the Cairns Marine Precinct, the three slipways and other stakeholders. Private vessels have not been included as it is believed there would be little increase in the numbers of these vessels utilizing the three major slipways in the Marine Precinct. The majority of these vessels would utilize the Cairns Cruising Yacht Squadron and Coconut Slipway. The figure for growth in the superyacht market has been calculated using the total removal of all chartering restrictions with a projected growth of 27.5% per annum. Over five years this results in a figure of 100 visiting superyachts per year and using the same percentage days at the slipways as for the current fleet results in 1,041 slipway days in year 2022. The vessels on commercial interstate/international voyages transiting past Cairns would conduct any dry docking/slipping activities in a country or port where services were cheaper. TCS utilised data from MSQ/AMSA to determine the number of vessels transiting past Cairns for a twelve month period. The vessels up to 100m LOA (theoretical maximum length for Cairns slipways) have been identified and a total of 28 only passed Cairns whilst on international and coastal voyages. These vessels entered or departed the traffic scheme at the following points: Booby Island, Gladstone, Grafton Passage, Port Alma, Sandy Cape, Townsville and Weipa. Vessels entering the traffic scheme at Booby Island, Grafton Passage and Sandy Cape are quite likely to have come from, or going to, international ports. The number of vessels transiting past Cairns, in this size range, will not vary much as smaller ships are being replaced generally with bigger ships, therefore there will be little growth in the numbers of interstate/international vessels likely to make a call on the Cairns Shipyards. Table 4 - Demand Analysis – Future Fleet
Fleet Number for Slipping Calculation Days Required
Superyachts 12 home based 100 visiting
Last CY the current fleet vessels utilised 474 slip days or average 9.6 days per vessel
1,041
White Boats 8 home based unknown visiting
at 15 days per year 120
Fishing 109 home based unknown visiting
21 days every 2 years 1,145
Navy 4 home based (assuming 3 x OPV, 1 x Hydro (major)
6 weeks every 2 years 84
Federal and State Governments
Border Patrol = 8 vessels slipped @ 2 years Customs = 6 vessels State Govt = 14 vessels (includes 6 Pilot Boats)
6 weeks every 2 years 3 per year @ 6 weeks 7 per year @ 4 weeks
168
126 196
Reef Fleet 60 home based 18 slip days per year 90 days every 10 years @ 6 per year
1,080 540
Commercial 80 home based 3 x line haul @ 6 weeks at 2 year intervals 78 @ 4 weeks every 2.5 years 4 x reef pontoons @ 90 days every 10 years 44 x Quicksilver 90 day refits each 10 years
63
874
36
396 TOTAL 5,869

GHD Pty Ltd Demand Analysis for the Cairns Marine Precinct
February 2017 11
6.3 Current Fleet
6.3.1 Superyachts
TCS is advised that there are 12 home ported superyachts in the Cairns Marina, all less than 60m LOA. The beam and displacement of these superyachts has not been detailed therefore cannot be included in this study. The previous 12 months superyacht visitations to Cairns is contained at section 6.4.1.
6.3.2 White Boats
There are 4 white boats shown on the Ports North database and this is further supported through emails with Ports North. These boats are usually privately owned and generally less than 24m LOA. However this is not supported by the available data which does not include any detail on the length, beam or displacement/lightship weight.
6.3.3 Fishing Vessels
Two databases for the fishing fleet have been supplied by Ports North, one for the Cairns berthed fleet ‘in season’ and the second for ‘out of season’ The summarised data for the two seasons are tabled below. Averaged LOAs and beams are shown. Table 5 - In Season Fleet
Type Number berthed LOA Beam Fishing 11 14.220 4.90 Trawling 8 15.930 5.44 TOTAL 19 15.075 5.17 Table 6 - Out of Season
Type Number Berthed LOA Beam Crab 1 14.00 4.10 Trout 6 13.70 4.30 Prawn 51 18.97 5.91 Mackerel 4 9.98 3.68 Reef Fish 4 13.50 4.67 Pearl 1 15.24 6.10 Aquarium 2 15.90 5.35 Barra 1 9.50 3.90 Tuna 4 15.27 5.70 Fishing 1 14.90 Not supplied Live Fish 2 18.50 6.08 Cray 2 16.55 5.30 TOTAL 79 13.54 5.08 Table 7 - Combined Total
Type Number berthed LOA Beam All 98 14.31 5.13
Total fishing boats homeported in Cairns is 98 vessels.

GHD Pty Ltd Demand Analysis for the Cairns Marine Precinct
February 2017 12
6.3.4 Government Fleets - Navy, Border Patrol, Customs, State Government
6.3.4.1 Navy
An email dated 06.02.2017 from defence lists the following vessels as being based at HMAS Cairns: 1 Armidale class patrol boat 2 Cape class patrol boats 2 Leeuwin class survey vessels 4 SMLs
Whilst not home ported in Cairns the following vessels are listed as visiting Cairns: HMAS Bundaberg (Armidale) HMAS Wollongong (Armidale) HMAS Childers (Armidale) HMAS Launceston (Armidale)
6.3.4.2 Border Patrol
These eight vessels (Bay Class) are operated out of Canberra and have no fixed home port however undertake their maintenance and sustainment at Norship in Cairns.
6.3.4.3 Australian Customs
Australian Customs bases six vessels in Cairns and undertake their maintenance and sustainment at Norship in Cairns.
6.3.4.4 Police
Qld Police Force maintains three patrol vessels in north Queensland with Cairns being the base for maintenance and repairs.
6.3.4.5 Great Barrier Reef Marine Park Authority
GBMPA maintains one major patrol vessel in north Queensland which is based in Cairns.
6.3.4.6 MSQ
MSQ has a fleet of three work boats in Cairns. Up until recently it also had responsibility for the six Pilot Boats in the region however these have been transferred to the respective Port Authorities and are stationed at Ports throughout North Queensland. Each vessel comes back to Cairns for maintenance.
6.3.5 Reef Fleet
The reef fleet vessels can be split into numerous categories, such as: Large high speed passenger catamarans; Smaller passenger catamarans; Day/reef exploration boats; Dive boats; Adventure boats; Snorkelling boats; Outer reef boats; Charter vessels; Semi subs and glass bottom boats; Permanently moored reef pontoons.
Each one having vastly differing dimensions and passenger capacity. See Annex 2 for a guide to the sizes and tonnages of some of the vessels that make up this fleet.

GHD Pty Ltd Demand Analysis for the Cairns Marine Precinct
February 2017 13
Cairns Marlin Marina has 219 pontoon berths, 30 Reef Fleet berths and 12 superyacht berths. 29 Reef Fleet vessels are berthed at the Marlin Marina Wharf and Finger A. 107 vessels are berthed on Fingers B to H and the Sailfish Quay, of which 37 are commercial vessels.
6.3.6 Commercial
Commercial fleets based in the Port of Cairns include landing barges, dumb barges, tugs, and smaller cargo ships up to 90m LOA. Ports North Database tabulates the following number to be home ported or based in Cairns. Table 8 - Number of Commercial Vessels Based in Cairns
Type Database PN Email Comments Tugs 41 35 Includes tugs servicing Mourilyan, Cape Flattery, SeaSwift
(including ones operating IN the Torres Straights but maintained in Cairns), small tugs/works boats, Perrots, Tim Norths, Carpentaria Contractors, MIPEC, Toll etc.
Barges 31 31 Cargo 14 14 The size of the majority of these vessels can be found at Annex 2. During the research and stakeholder consultation periods there was nothing uncovered which identified demand opportunities from international and interstate fleets. TCS has undertaken a review of data received from MSQ/AMSA which identifies vessels passing Cairns, up to 100m LOA for a twelve month period. This study identified 28 vessel only which could have utilised the services of the three shipyards. More on this data is presented at section 6.2 Future Demand. PNG has a fleet of small vessels and landing barges which require regular dry docking and have utilized the services of the Cairns Marine Precinct previously. Port Moresby has a high class dry dock which is capable of handling the local vessels, however this shipyard is currently going through hard times and is not handling much traffic. During the stakeholder consultations it was discussed that the Port Moresby shipyard may be sold to Chinese owners and may use foreign labour. This could become a major competitor to the Cairns Shipyards. During the stakeholder consultation period one US army vessel, slipped at TRS, was discussed as was the difficulty in winning work from the US Army with strong competition from the Hawaiian and West coast USA shipyards. Future demand from this sector is not seen as growing. Commercial fleets based outside Cairns were discussed during the research and consultation period with little being uncovered detailing fleets which may be attracted to the Cairns Marine Precinct. PNG – has a fleet of local vessels and landing barges which have on occasions utilized the Cairns
shipyards. Should the Port Moresby shipyard reopen with foreign owners and labour it will become a strong competitor to Cairns.
Thursday Island/Torres Strait – Has two major fleets being Government vessels and SeaSwift landing barges. These vessels utilise the Cairns shipyards.
Darwin – SeaSwift vessels stationed in Darwin are returned to Cairns for maintenance and refits. Fishing vessels also travel from Darwin to Cairns for maintenance and refits.
Townsville – Research has not highlighted many vessels in Townsville which require the services of the Cairns shipyards apart from the commercial tugs.
Brisbane/Gold Coast – Both these sites have World class shipyards capable of handling the requirements of vessels based at Brisbane and the Gold Coast.
New Zealand – has recently made it more attractive for Superyachts to visit and have work undertaken whilst there. Due to the relaxation of rules for chartering in NZ there has been an increase in superyachts visiting and slipping in this country to a point where the shipyards have reached capacity and are turning work away. There is an opportunity for Cairns to capture some of this overflow, however superyachts prefer to be lifted on a ship lift rather than a traditional slipway or travel lift. Cairns doesn’t have a ship lift.

GHD Pty Ltd Demand Analysis for the Cairns Marine Precinct
February 2017 14
6.4 Future Fleet
6.4.1 Superyachts
Superyachts are considered to be vessels above 24m LOA, professionally crewed and carrying not more than 12 passengers. When originally discussing superyachts the LOA may have been in the vicinity of 24m however that length has grown considerably through to today where lengths in excess of 100m (Azzam 180.61m, Eclipse 162.50m) are not uncommon in various parts of the World. Superyachts have been frequenting Cairns for some time with an annual regional visitation list for 1st December 2015 – 30th November 2016 as follows: Table 9 - Superyacht Visitations (Courtesy of the SuperYachtGroup)
Superyacht Name Length In M
Foreign Flagged
Cairns Marlin Marina
BSE Cairns
Slipway Norship Marine
The Reef Marina
Total No. Of Days
7 SINS MY 29 AUS 2 2 ACHILLES III MY 34.9 AUS 366 366 AQUAMARINA MY 47.5 FF 33 33 ATLANTIC PRINCESS MY
23.91 AUS 11 3 14
BALI HAI MY 35.7 FF 32 32 BEAGLE STAR V MY 34.7 AUS 24 24 BELUGA MY 35 AUS 1 38 314 353 BIG BUD MY 24.43 AUS 322 322 BIG FISH MY 45.1 FF 2 2 BLINDER MY 28.65 AUS 6 7 13 BLISS SY 37 FF 17 17 BLUE STAR MY 45 FF 14 14 BRAVEHEART MY 26 AUS 3 3 CARLA SY 24 AUS 10 10 DESTINATION SY 41 FF 33 33 DRAGONFLY MY 73.3 FF 9 9 DREAMTIME MY 34.5 AUS 170 170 EQUANIMITY MY 91.5 FF 21 21 ETHEREAL SY 58 FF 22 22 FIDELIS SY 56 FF 10 10 FLYING FISH MY 32 AUS 18 219 237 FLYING MANTA MY 42 FF 9 9 GEORGINA MY 23.39 AUS 16 16 GLAZE MY 49 FF 11 1 12 GRAN FINALE MY 45 FF 25 5 30 HUNTRESS MY 30.48 AUS 16 16 JEREMY MY 33 AUS 71 65 136 KALIBOBO SPIRIT MY 28 FF 1 10 11 KEALOHA SY 27.5 AUS 28 28 LA BELLA VITA MY 31.4 AUS 3 3 LA DEA II MY 49.04 FF 41 1 42 LADY AUDREY MY 35.05 AUS 24 31 55 LEGACY MY 49.9 FF 34 34 LLEWELYN 28 AUS 6 6 MISS ANGEL SY 35 AUS 180 180 MUSTIQUE MY 33 AUS 7 1 8 MY SECRET MY 47 FF 19 23 3 45 MY SPIRIT MY AUS 110 110 MY WAY 35 FF 6 6 MYSTIC TIDE MY 26 AUS 30 30 PERFECT PERSUASION MY
45.7 FF 2 2
PHOENIX ONE MY 34.6 AUS 10 30 40 PIPELINER SY 31.7 FF 9 43 52 QING MY 45.73 FF 1 1 RHAPSODY II 27 FF 7 1 9 17 RUBY II AUS 2 30 32 SARAFIN SY 31 FF 8 8

GHD Pty Ltd Demand Analysis for the Cairns Marine Precinct
February 2017 15
SERENDIPITY MY 24.3 AUS 35 2 37 SHAMOUN SY 33.5 FF 17 17 SOLQUEST MY 24.3 AUS 10 10 SORLANDET SY 56.7 FF 8 8 SOUTHERN CLOUD SY 40 FF 14 14 TEXAS T MY 28 AUS 3 3 THE GODFATHER MY 25 AUS 23 23 THOR AUS 10 10 TRITON MY 49 FF 32 32 TWO ANGELS MY 28 AUS 9 9 ULTIMATE LADY MY 28 AUS 7 7 VIBRANT CURIOSITY MY
85.47 FF 44 44
TOTAL DAYS 819 423 51 1,557 2,850 NUMBER OF VESSELS 51 6 4 17 CAIRNS TOTAL 1,293 DAYS PORT DOUGLAS TOTAL 1,557 DAYS TOTAL DAYS FOR REGION 2,850 DAYS TOTAL No. VESSELS TO REGION 59 (Vessels only counted once for total visits to the region) ABBEL POINT MARINA 2,626 DAYS 45 VESSELS Not included in our totals MY 46 SY 13 FF 28 AUS 31 NEW VESSELS 24 REPEAT 35 In summary, Superyachts spent 2,850 days in the Cairns region and of these superyachts 10 spent a total of 474 days split between BSE Cairns Slipway and Norship Marine Slipways. This number of days in the region, and more particularly at the slipways, could be increased should there be a relaxation of the Australian Coastal Act which currently prevents foreign flagged superyachts from chartering whilst in Australian waters. The Act States that these visiting superyachts must pay the full duty and GST on the value of the yacht prior to taking up charter opportunities. This cost may well exceed any income derived from the chartering. Currently, should a superyacht be chartered, it must travel between two ports on a single voyage and not simply visit the reef and return directly to its adopted home port. Further to the restrictions of the Australian Coastal Act, the GBRMPA places restrictions on the movement of these vessels which further limits the range of activities and areas of the reef where they are not permitted to travel. The superyacht sector of the marine field has support for the relaxation of the ACA through Superyacht Australia (a division of Australian Marine Exports), SuperYachtGroup (Great Barrier Reef) and Advance Cairns from which the material presented here is drawn. New Zealand and Fiji had similar restrictions on visiting superyachts however both countries have relaxed their legislation with regards to chartering activities. New Zealand changed its legislation allowing superyachts to stay in that country for up to two years with some chartering. This has led to a 54% increase in superyacht visits since the introduction of the new Legislation. Fiji has introduced a superyacht charter decree which has led to a 40% increase in vessel visitation and an increase of average stay from 21 days to 136 days.

GHD Pty Ltd Demand Analysis for the Cairns Marine Precinct
February 2017 16
Whilst interviewing the team from Defence Industries QLD (DSD) it was indicated that relaxation of the Coastal Shipping Act may have the following outcomes: No change to the Act 3 – 5% increase in superyacht visits Easing of the Act 10 – 15% increase in superyacht visits Removal of all restrictions 25 – 30% increase in superyacht visits
The following table illustrates the potential outcomes of these changes to the visitation of superyachts to the Cairns Region and in particular the slipways. Table 10 - Outcome of Changes to Coastal Shipping Act
Current Situation 4% Increase 12.5% Increase 27.5% Increase
Cairns Region Days 2,850 2,964.00 3,206.25 3,633.75 Slipway Days 474 492.96 533.25 604.35 Visiting Slipway No. 10 10.40 11.25 12.75 For the slipways this represents an extra 3 vessels and an extra 130 days per annum should the Coastal Act and other restrictions be fully lifted.
6.4.2 White Boats
White boats are the boats that don’t make it into the superyacht category. They are more common than their bigger brother and are usually operated by their owner without a professional crew, although maintenance may be carried out by contracted staff. With Australia experiencing growing wealth, particularly, the already wealthy citizens there has been an increase in the number of white boats being seen in our waterways. These boats are capable of moving around the vast majority of Australian coastal waters, particularly NSW and Queensland and are often live aboard vessels. In the absence of accurate data for these privately owned vessels, the possible increase may add 5 – 10 additional boats to the Cairns slipway’s activities per annum. Based on 14 days per dry docking these vessels may add up to 140 days utilisation of the Cairns Slipways.
6.4.3 Fishing Fleet
The fishing fleet based in Cairns has been stable for some years. New larger vessels are coming in however they are replacing boats that are being retired and are not generally increasing the number of fishing vessels based in Cairns. One major fleet has recently relocated to Cairns. Austral Fisheries have also recently relocated 15 vessels in their fleet to Cairns. These vessels are in the 22 – 25m LOA range. It is anticipated these vessels will be slipped every 2.5 years, or 6 vessels per annum. Raptis and Sons have signalled their intention to relocate 14 vessels in their fleet to Cairns if possible. These vessels range in length from 22.3m LOA to 30m LOA. It is anticipated these will be slipped every 2.5 years, or 5.6 (6) vessels per annum. It is anticipated that they will require 11 berths with 2 vessels being serviced at the shipyards when homeported during the end of the fishing season. The Sarriba (LOA 30m) will not be homeported at the same time as these vessels. The arrival of this fleet homeporting in Cairns could result in an additional 14 fishing vessels in the 22m – 30m LOA range seeking dry docking per annum with a time ashore being approximately 25 – 30 days. This increases the dock usage by between 300 and 360 days per annum not including any servicing required outside the dry dock periods.

GHD Pty Ltd Demand Analysis for the Cairns Marine Precinct
February 2017 17
6.4.4 Government Fleets - Navy, Border Patrol, Customs, State Government
Customs and Border Force were not interviewed however in discussions with Defence Industries QLD (DSD) no mention was made regarding changes to the existing Cairns based fleet. The Navy base in Cairns caters for a number of different class vessels ranging from patrol boats to hydrographic survey vessels. The Navy is also going through a period of considerable change with older vessels being decommissioned and new vessels coming on line or in the planning stage for delivery around 2020. Indicative changes for the Navy include:
Armidale Class patrol boats will be replaced by the OPVs (max length 80m). There is planned to be 12 OPVs delivered, starting early 2020. Press reports suggest there may be up to three OPVs stationed in Cairns whereas other reports
suggest five. Maintenance requirements and location has not yet been determined. They will be removed from the water every two years of their life. The four Survey Motor Launches will be decommissioned in 2022-23 without replacement. Large hydrographic vessel may be outsourced. Number of hydrographic vessels present in Cairns maybe one at 90m LOA. Considerable work need to be done to the Navy base and the sugar wharf to permit the OPVs to
berth in Cairns. Whilst building the new Navy facilities 2019/20 there will be a lot of requirement for off base
support. Possible future wharf for the Navy in Cairns.
6.4.4.1 What does this mean for Cairns?
The decommissioning of the Armidale Class patrol boats around 2020. Net loss in approximately 2020 will be 2 or 3 vessels.
The decommissioning of the 2 x Leeuwin class hydrographic survey vessels will result in a net loss of 2 vessels early in the 2020s.
The decommissioning of the four SMLs in 2022-23 will result in a net loss of 4 vessels. That is 8 or 9 Navy vessels being decommissioned from Cairns. It is possible that Cairns will get 3 and maybe 5 of the OPVs however nothing has been confirmed. The major hydrographic vessel replacement has not been confirmed as being based in Cairns.
6.4.4.2 In Summary
8 – 9 vessels removed. 3 – 6 new vessels home ported in Cairns. Net loss 2 – 6 vessels.
The new OPVs will have a length approximately 80m however the lightship weight has not been provided as yet therefore the dry dock/slipway capacity is unknown although press releases suggest these vessels will require a 3,000t capacity slipway. Should this be the case, there is only one slipway capable of handling these vessels and that is TRS, which is currently at maximum capacity. Should there be 3 OPVs stationed in Cairns and maintained in Cairns the out of water requirement would be 1.5 per annum. Assuming an out of water period of 40 days these vessels will require approximately 80 days of slipway time each year. This is less than that currently required by the 4-5 major vessels currently accessing the slipways. Should the major hydrographic vessel be located in Cairns, and it can access the TRS slipway, it could require 40 – 50 days of slipway time every second year.
6.4.4.3 Border Patrol
Email dated 10th February 2017 From Defence states “Border Force are planning to have 2 refurbished Bay Class patrol boats operating out of Cairns. These will be maintained in Cairns.”

GHD Pty Ltd Demand Analysis for the Cairns Marine Precinct
February 2017 18
6.4.5 Reef Fleet
Tourism during 2009/10 went through poor times however there has been a turnaround and tourist numbers have been increasing steadily, led by increased Asian visitation numbers. There have been new vessels added over the past three years. One of the major tourism operators, Quicksilver, has been buying boats, principally from existing operators without dramatically increasing the number of boats working out of Trinity Inlet and Port Douglas. Quicksilver will be replacing boats as the older vessels are decommissioned. They will also be gradually increasing the number of vessels in their reef fleet. The new vessels will not be greater than 35m LOA as above that requires a higher level of Certificate of Competency which can be difficult to recruit and maintain. There will be a gradual increase in reef fleet numbers which will impact on the capacity of the Cairns slipways, however this is thought to be within current capabilities. There will not be a size increase in these vessels. The smaller operators replacing boats but with the same size however with greater seating capacity.
6.4.6 Commercial Ships
The interview team only visited one commercial shipping operator being SeaSwift, the largest cargo operator based in Cairns. SeaSwift have a fleet of ships, tug and barges and landing craft stationed in Cairns, Torres Strait and Darwin. All vessels return to Cairns for all slipping and programmed maintenance/refits. SeaSwift is adding one new line haul vessel to their fleet. It will be 90m LOA and have a lightship weight of approximately 1,500t. There was also discussion regarding the footprint of SeaSwift in the reef however nothing has been finalised. Nothing major is seen on the horizon for the next five years apart from the one new vessel. This one vessel will require dry docking/slipping once every 2.5 years with a refit every 2 – 3 years. This vessel will require the use of the TRS slipway and will be on the slip for an anticipated 35 – 60 days.
6.4.7 Pacific Patrol Boat Replacement Fleet
This recently released (PM Thursday 2nd February 2017) announcement by Austal states they have been awarded the contact for the Pacific Patrol Boat Replacement Program for the building of 19 steel hulled boats at Henderson (WA). Austal has also announced (5th May 2016 Austal Corporate) it has been awarded the sustainment support for an initial seven year period valued at approximately $24 million. Austal advises this sustainment work will be carried out in Cairns. To date it is not known which shipyard(s) will be the service provider(s) nor is it known if a contract has been signed. First delivery will be in Q4 CY2018 with construction work running through to CY2023. This will produce 3.6 patrol boats each year. The patrol boats will be 39.5m LOA on a beam of 8m and a loaded draft of 2.5m. The light ship weight has not been supplied at this point in time. It is expected to be less than 400t therefore able to access all three slipways. Whilst nothing has been confirmed it is suggested these vessels will have a dry docking/slipping period not dissimilar to Australian Navy vessels and commercial vessels of once every 2.5 years with the first vessel due for docking in approximately Q2 CY2021 and thereafter at approximately three month intervals or four per year.

GHD Pty Ltd Demand Analysis for the Cairns Marine Precinct
February 2017 19
The period out of the water has not been determined at this time but may be in the order of 5 – 6 weeks. Given this duration the total dock time required for the Pacific Patrol Boats would be in the vicinity of 3.8 boats per year by (say 6 weeks) or 160 days. The current Pacific Patrol Boats are being maintained in Cairns (apart from a few which are being maintained in their country of home porting) for periods of between six weeks and six months. The news of the 19 new Pacific Patrol Boats being maintained in Cairns is seen as being business as usual and not new work for the shipyards.
6.4.8 Current and Future Fleets Summary Table
Fleet Present Future (2022)
No. LOA Beam Displacement No. LOA Beam Displacement
Superyachts 12 -- -- -- 40 (1) 30
-- -- --
White Boats 4 -- -- -- 8 (2) -- --- -- Fishing 98 14.31 5.13 -- 127 14.5 5.4 -- Navy 9 Varied (see
section 6.3.4)
Varied (see
section 6.3.4)
Varied (see section 6.3.4)
3 - 6 Varied (see
section 6.4.4)
Varied (see
section 6.4.4)
Varied (see section 6.4.4)
Fed. & State Government
18 Varied, generally less than
20m
Varied, generally less than
5.5m
--
18 Varied, generally less than
20m
Varied, generally less than
5.5m
--
Reef Fleet 60 Varied (see section 6.3.5)
Varied (section 6.3.5)
Varied (see section 6.3.5)
65 Varied (see
section 6.4.5)
Varied (see
section 6.4.5)
Varied (see section 6.4.5)
Commercial 80 Varied (see section 6.3.6)
Varied (see
section 6.3.6)
Varied (see section 6.3.6)
84 Varied (see
section 6.4.6)
Varied (see
section 6.4.6)
Varied (see section 6.4.6)
Pacific Patrol
0 -- -- -- 19 39.5 8 --
Notes: Navy includes Customs, Border Patrol and State Government vessels (separated in this table). (1) Superyachts is assuming the Coastal Act hindrances and GBRMPA rules are removed and
visitation rate increases at 27.7%. (2) White boats could increase considerably more. Assuming there are sufficient berths for the expected white boats. Pacific Patrol Boat Replacement Program commences on time. 3 x OPVs are homeported in Cairns. Navy major Hydrographic vessel is homeported in Cairns. Private vessels have not been included in this study.
6.4.9 Vessel Measurement
Vessels are measured in many different way, depending on their trade. The principle measurement references are: Deadweight a measurement of carrying capacity GRT a measurement of internal space NRT a measurement of internal space with exemptions for some spaces Lightweight a vessels weight as built Displacement the weight of water displaced by a floating vessel LOA length overall LBP length between perpendiculars
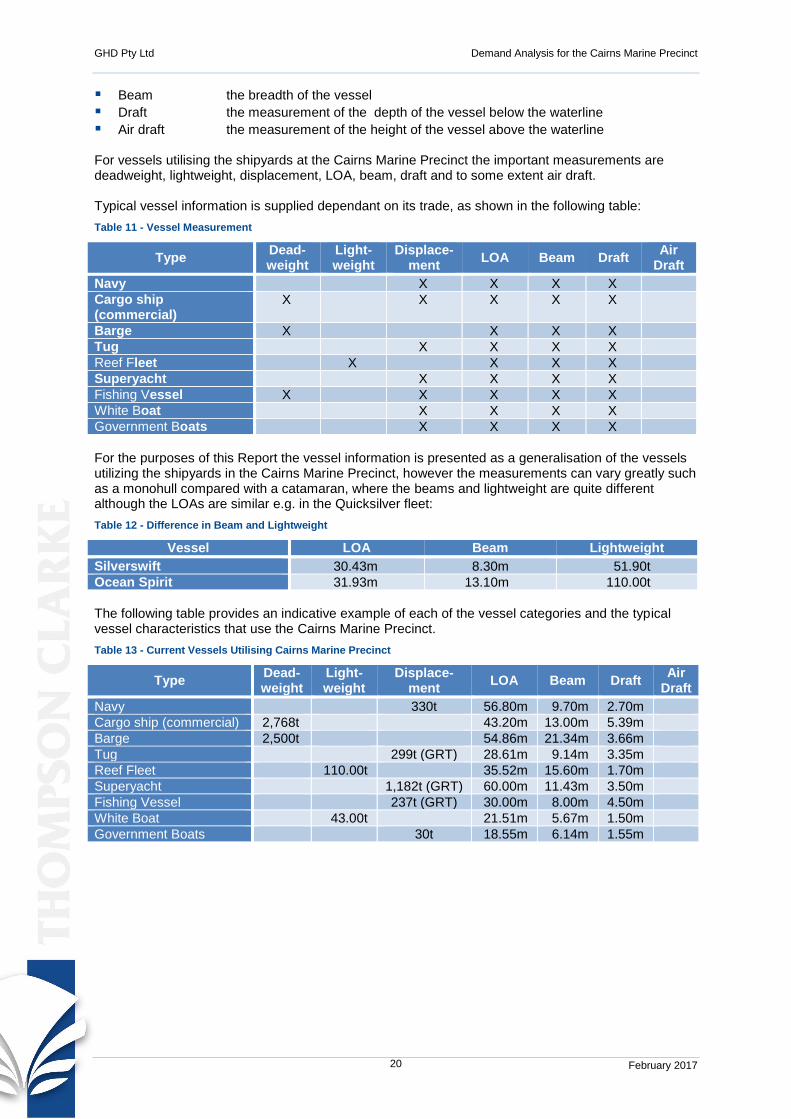
GHD Pty Ltd Demand Analysis for the Cairns Marine Precinct
February 2017 20
Beam the breadth of the vessel Draft the measurement of the depth of the vessel below the waterline Air draft the measurement of the height of the vessel above the waterline
For vessels utilising the shipyards at the Cairns Marine Precinct the important measurements are deadweight, lightweight, displacement, LOA, beam, draft and to some extent air draft. Typical vessel information is supplied dependant on its trade, as shown in the following table: Table 11 - Vessel Measurement
Type Dead-weight
Light-weight
Displace-ment LOA Beam Draft Air
Draft Navy X X X X Cargo ship (commercial)
X X X X X
Barge X X X X Tug X X X X Reef Fleet X X X X Superyacht X X X X Fishing Vessel X X X X X White Boat X X X X Government Boats X X X X For the purposes of this Report the vessel information is presented as a generalisation of the vessels utilizing the shipyards in the Cairns Marine Precinct, however the measurements can vary greatly such as a monohull compared with a catamaran, where the beams and lightweight are quite different although the LOAs are similar e.g. in the Quicksilver fleet: Table 12 - Difference in Beam and Lightweight
Vessel LOA Beam Lightweight Silverswift 30.43m 8.30m 51.90t Ocean Spirit 31.93m 13.10m 110.00t The following table provides an indicative example of each of the vessel categories and the typical vessel characteristics that use the Cairns Marine Precinct. Table 13 - Current Vessels Utilising Cairns Marine Precinct
Type Dead-weight
Light-weight
Displace-ment LOA Beam Draft Air
Draft Navy 330t 56.80m 9.70m 2.70m Cargo ship (commercial) 2,768t 43.20m 13.00m 5.39m Barge 2,500t 54.86m 21.34m 3.66m Tug 299t (GRT) 28.61m 9.14m 3.35m Reef Fleet 110.00t 35.52m 15.60m 1.70m Superyacht 1,182t (GRT) 60.00m 11.43m 3.50m Fishing Vessel 237t (GRT) 30.00m 8.00m 4.50m White Boat 43.00t 21.51m 5.67m 1.50m Government Boats 30t 18.55m 6.14m 1.55m

GHD Pty Ltd Demand Analysis for the Cairns Marine Precinct
February 2017 21
7 Current/Future Facilities Each of the slipways is addressed separately with regard to their current situation and possible future demand based on the future Cairns based fleet. Only the maximum fleet size and make-up is addressed. Intermediate fleet size has not been addressed, in this report. A SWOT analysis is provided elsewhere in this Report.
7.1 Norship
Business as Usual Future Demand History of shipbuilding and
maintenance/repair/refit since 1984 Works as a one-stop-shop Highly experienced staff Network of local suppliers, technicians and
contractors Owners can use their own sub-contractors 150t travel lift (max. 40m x 7.6m) 400t travel lift (max. 60m x 10.8m) 50 hardstand bays fully serviced 60 & 25 metre wharves - 85M LOA 2 sheds – 27m LOA 4 mobile Cranes to SWL 70t Fabrication Project management and technical
assistance Engineering workshops Pressure blasting Trade workshops and storage units Paint shop 1970’s yard – not contemporary 50% of work is Government 600 dockings per annum Operates facilities at Cairns Cruising Yacht
Squadron on their behalf Chandlery ISO 9001 : 2000 DNV accredited welders
Need facilities to cater for the superyachts Increase in wharfage to facilitate in water
servicing Increased alongside berth water depth Water inundation/flooding rectification Upgraded power supply Travel lift to 1,000t capacity (ship’s beam
then becomes an issue) Improve facilities to bring slipway to meet
contemporary standards Increase blasting/painting sheds to cater for
larger vessels Improve slipway to be attractive to the prime
contractors for the Navy (critical) Improve road access Improve parking space issues Be prepared for coming environmental
constraints
Figure 2 - Norship Travel Lift

GHD Pty Ltd Demand Analysis for the Cairns Marine Precinct
February 2017 22
7.2 Cairns Cruising Yacht Squadron
Business As Usual Future Demand Operated on its behalf by Norship Marine Travel lift of 40t Hard standing areas for owners to work on
their vessels Relationship with the Big Boat Shed
May take Quicksilver Port Douglas glass bottomed boats in the future
Private vessels and charter vessels are getting bigger and this facility may need to review its capacity
Figure 3 - Cairns Cruising Yacht Squadron Travel Lift
7.3 BSE Cairns Slipway
BSE Cairns Slipway is on the previous NQEA lease and has land on both sides of Tingira/Ross Streets. NQEA was established in 1948 and commenced shipbuilding in 1966.
Business As Usual Future Demand Is a 1970s slipway and not contemporary Large enclosed blasting and painting shed Good wharf space ‘S’ bend slipway – not suitable for a large
range of vessels and particularly superyachts Difficult to get on and off the slipway No Navy quality/accreditation Actively part of the Defence programs Working with the Primes 1,200t slipway max 80m LOA 60m x 11.8m x 3m dry dock 350t x 40m length sideslip Utilise NQEA labour Hasn’t improved whereas other yards have Services the larger Quicksilver vessels
Electricity supply is a problem Road access is an issue Parking space is an issue Need to meet coming environmental issues Straightened slipway or replaced by a travel
lift or synchrolift Requires improved lifting capability for
trawlers New improved barge facilities Maintain the current lease in one block/don’t
split up the leases (the current BSE site is made up of numerous leases which, in the interest of future development, should be maintained by one leaseholder)

GHD Pty Ltd Demand Analysis for the Cairns Marine Precinct
February 2017 23
Figure 4 - BSE Cairns Slipway Showing Curve on the Slipway Tracks
7.4 Tropical Reef Shipyard
Tropical Reef Shipyard (TRS) is situated on Senrab Point at the northern entrance to Smiths Creek. The slipway and floating dock are accessed from Trinity Inlet which provides deeper water than Smiths Creek and no vessel length restrictions due to the waterway. This slipyard is limited by access to land for use as a hardstand and work areas.
Business As Usual Future Demand Largest capacity slipway between Sydney
and Dampier 100m LOA Vessels can be slipped Max beam up to 19.6m 3,000t capacity 300t floating dock capacity Fitting out berths for up to 7 vessels Four mobile cranes up to SWL 100t Privately owned 40 boats service per year 21 – 35 days average slipping 74% return vessels 21% new vessels 87% repeat customers Limited by booking availability Not enough slipway capacity Only slipway in QLD with DFS5000
accreditation Service Navy vessels at HMAS Cairns Can take vessels up to 150m LOA Want to take the block of land next door
If had a 150m slipway TRS could slip an extra 5 – 6 vessels per year
Increase size of landholding Improve access to the slipway

GHD Pty Ltd Demand Analysis for the Cairns Marine Precinct
February 2017 24
Figure 5 - Tropical Reef Shipyard Floating Dock
Figure 6 - Tropical Reef Shipyard

GHD Pty Ltd Demand Analysis for the Cairns Marine Precinct
February 2017 25
7.5 Coconut Slipway
Coconut Slipway is situated on the Eastern side of Trinity Inlet and caters for the smaller end of the boating market however it is regularly utilised by the small vessels of the Quicksilver fleet. Owners are permitted to undertake their own maintenance. There is little in the way of direct access to specialty workshops such as engine maintenance.
Business As Usual Future Demand Slipway for boats up to 120t and 28m LOA Painting Fibreglass repairs Welding and fabrication Electrical works
Figure 7 - Coconut Slipway (Courtesy of Coconut Slipway Website)
7.6 Smith Creek Wharf Facilities
The common user wharves and wharves belonging to businesses which have since closed and are being used by vessels requiring a berth in Smiths Creek are generally in a poor state of repair and not suitable for securing vessels alongside without risk to both the vessel and those onboard or servicing the vessel from the shore. This includes employees of the three shipyards and in particular Norship which has limited wharf space of its own. This lack of wharf space, for in water maintenance, is seen to be restricting the ability of the yards to encourage vessels to undertake their repairs in Smiths Creek. This is particularly relevant to superyachts which are used to berthing at facilities maintained to pristine conditions. The following photos show some of the berths in Smiths Creek:

GHD Pty Ltd Demand Analysis for the Cairns Marine Precinct
February 2017 26
Figure 8 - Smiths Creek Berths

GHD Pty Ltd Demand Analysis for the Cairns Marine Precinct
February 2017 27
8 Bibliography Cairns Shipping Development Project Draft Environmental Impact Statement, Executive Summary,
Ports North, November 2014. Barge Ramp Scoping Study, Cairns Common User Barge Facility, Ports North, Report for Ports
North by Aurecon with input by Thompson Clarke Shipping, 28th June 2011. Far North Queensland, Marine Industries, Capability Profile, Report for Department of Tourism
Regional Development and Industry by W S Cummings, December 2008. Superyacht Guide, Cairns, Australia, The Great Barrier Reef, Developed by Cairns Regional
Council and the SuperYachtGroup, undated. Cairns Post, Front page article and page four article relating to $100M+ Navy deal 2nd February
2017. Information Sheet (x4) – Port of Cairns, Ports North 2016-7. Ship Types (Arrivals) Port of Cairns, Maritime Safety Queensland. Tropical Reef Shipyard, Tropical Reef Shipyard. Fishing Vessels Homeported in Cairns, Ports North, February 2017. Vessel Arrivals 02.02.2017 – 31.01.2016, Ports North, February 2017. Austal Awarded Pacific Patrol Boat Contract, Austal, 5th May 2016. Austal Engages Cairns Businesses to Highlight Vessel Sustainment Opportunities, Austal, 2nd
February 2017. Austal Patrol 58 – Cape Class Patrol Boat, Austal, undated. Royal Australian Navy – Vessel Technical Details, Ship Data Sheet, Royal Australian Navy,
undated. Wikipedia – RAN Vessel Technical Details (x5), Wikipedia on line web site. Royal Australian Navy – HMAS Cairns, Royal Australian Navy, undated. OPV 8o Data and Information, Lurssen Defence, Undated. Three Shipbuilding Announcements in one Day, Australian Defence, 19th April 2016.

GHD Pty Ltd Demand Analysis for the Cairns Marine Precinct
February 2017 i
Annexures Due to the size of the Annexures they have been provided as a separate document. A summary of their headings is as follows: Annex 1 – Record of Transits Annex 2 – Technical Specifications of Vessels Annex 3 – SWOT Analysis Annex 4 – Qualification


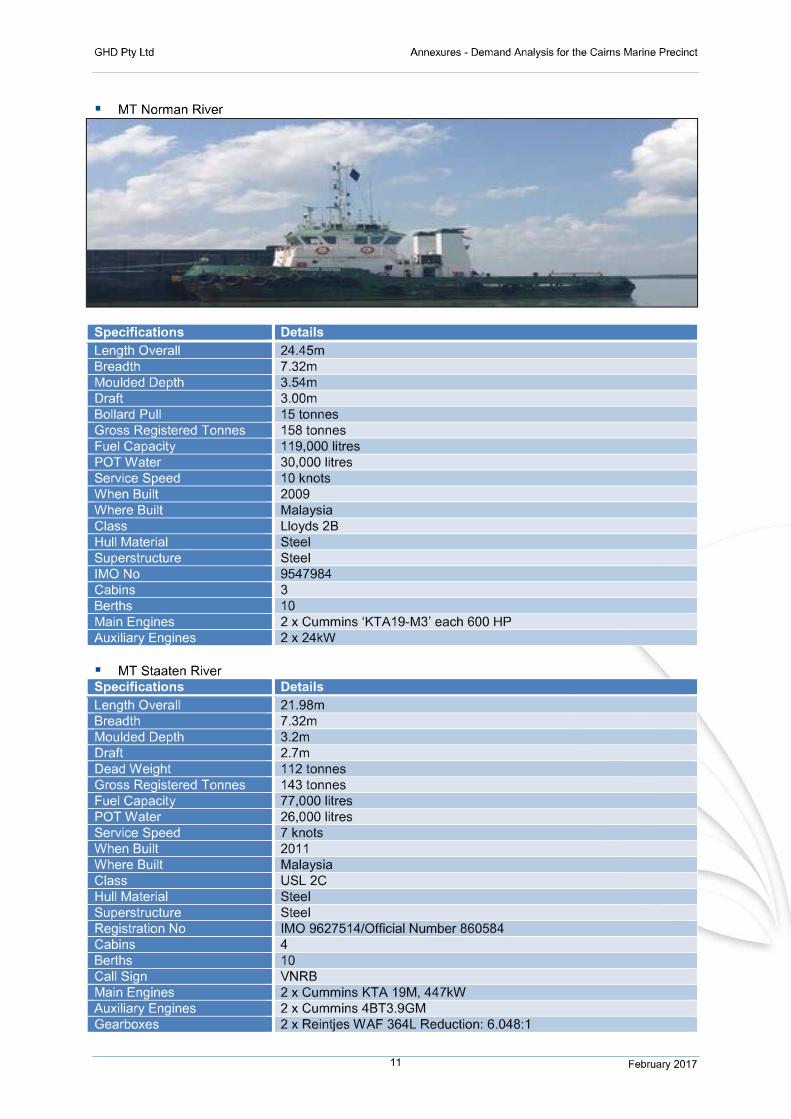


GHD | Report for Department of State Development - Cairns Marine Precinct Growth Strategy (DSD-4692-16), 4219953
Appendix B – Strategy effectiveness assessment
Total Score 4.63 6.08 5.68 6.77 5.18 5.42 6.08
Current Strategic Alliances Expand Current Infrastructure New Infrastructure
Improve Current Infrastructure Regulatory change
Precinct coordination
Opportunities Weight Rating (0 to 4)
Weighted Score
Rating (0 to 4)
Weighted Score
Rating (0 to 4)
Weighted Score
Rating (0 to 4)
Weighted Score
Rating (0 to 4)
Weighted Score
Rating (0 to 4)
Weighted Score
Rating (0 to 4)
Weighted Score
1 Development of new infrastructure that meets changing market quality needs 0.083 3 0.25 2 0.17 2 0.17 4 0.33 3 0.25 3 0.25 3 0.25
2 Refurbishment/Rehabilitation/Improvement of existing infrastructure to deal accommodate current demand shortfalls 0.083 3 0.25 3 0.25 4 0.33 3 0.25 3.5 0.29 3 0.25 3 0.25
3 Leverage marine services capability from the precinct 0.083 3 0.25 4 0.33 3 0.25 4 0.33 3 0.25 3 0.25 4 0.33
4 Form strategic alliances with inter-regional competitors 0.083 1 0.08 4 0.33 1 0.08 2 0.17 1 0.08 1 0.08 3 0.25
5 Release of regulatory constraints 0.083 2 0.17 2 0.17 2 0.17 2 0.17 2 0.17 4 0.33 2 0.17 6
Increase awareness of regional economic contribution to assist with state support funding 0.083 2 0.17 2 0.17 2 0.17 2 0.17 2 0.17 4 0.33 2 0.17
Threats 0 0 0 0 0 1 Competing precincts have invested heavily in
new market growth opportunities, which Cairns has struggled to capture 0.083 2 0.17 3 0.25 3 0.25 4 0.33 2.5 0.21 2 0.17 3 0.25
2 Changes in vessel characteristics in some markets increases the potential for loss of market share 0.083 3 0.25 3 0.25 4 0.33 4 0.33 3 0.25 3 0.25 3 0.25
3 Increasing environmental controls (regulation and requirements), will require a shift from traditional practices to maintain market share 0.083 2 0.17 2 0.17 3 0.25 3 0.25 4 0.33 2 0.17 3 0.25
4 Service and maintenance facility decisions will be made by prime contractors, which have alternative facilities in Australia 0.083 3 0.25 4 0.33 4 0.33 4 0.33 3.5 0.29 3 0.25 4 0.33
5 A potential inability to accommodate changing skills demand, project management, and quality requirements, limits the ability of the industry to move with customer requirements 0.083 2 0.17 4 0.33 3 0.25 3 0.25 2 0.17 2 0.17 4 0.33
6 Difficulties in retaining a critical mass, appropriately skilled workforce has the potential to impact the ability of the precinct to move with moving customer needs and emerging market opportunities 0.083 2 0.17 4 0.33 3 0.25 3 0.25 2 0.17 2 0.17 3 0.25
2.33 3.08 2.83 3.17 2.63 2.67 3.08

GHD | Report for Department of State Development - Cairns Marine Precinct Growth Strategy (DSD-4692-16), 4219953
Current Strategic Alliances Expand Current Infrastructure New Infrastructure
Improve Current Infrastructure Regulatory change
Precinct coordination
Strengths Weight Rating (0 to 4)
Weighted Score
Rating (0 to 4)
Weighted Score
Rating (0 to 4)
Weighted Score
Rating (0 to 4)
Weighted Score
Rating (0 to 4)
Weighted Score
Rating (0 to 4)
Weighted Score
Rating (0 to 4)
Weighted Score
1 Evolving services capability 0.100 2 0.20 3 0.30 2 0.20 3 0.30 2 0.20 2 0.20 4 0.40 2 Breadth of marine services 0.100 3 0.30 4 0.40 3.5 0.35 4 0.40 3 0.30 3.5 0.35 3 0.30 3 Infrastructure capability meets current needs
and targeted expansion 0.100 3 0.30 3 0.30 4 0.40 4 0.40 3.5 0.35 3 0.30 3.5 0.35 4 Infrastructure capability is competitive for the
region 0.100 3 0.30 3 0.30 4 0.40 4 0.40 3 0.30 3 0.30 3.5 0.35 5 Mature industry with strong reputation 0.100 3 0.30 4 0.40 3 0.30 4 0.40 3.5 0.35 3 0.30 4 0.40
Weaknesses 0 0 0 0 0 0 1 New and emerging market potential is limited
by the quality and capacity of existing infrastructure 0.100 2 0.20 2 0.20 3 0.30 4 0.40 3 0.30 2 0.20 3 0.30
2 Services quality and infrastructure access limits growth and flexibility for the industry 0.100 2 0.20 3 0.30 3 0.30 4 0.40 2.5 0.25 2 0.20 3 0.30
3 There are infrastructure capability constraints at existing facilities 0.100 2 0.20 2 0.20 3 0.30 4 0.40 2 0.20 1 0.10 2 0.20
4 There are regulatory constraints which limit growth potential 0.100 1 0.10 3 0.30 1 0.10 1 0.10 1 0.10 4 0.40 1 0.10
5 The largest potential for growth is in the non-traditional market 0.100 2 0.20 3 0.30 2 0.20 4 0.40 2 0.20 4 0.40 3 0.30
2.30 3.00 2.85 3.60 2.55 2.75 3.00

GHD
1st Floor 85 Spence Street T: 61 7 4044 2222 F: 61 7 4044 2288 E: cnsmail.ghd.com
© GHD 2018
This document is and shall remain the property of GHD. The document may only be used for the purpose for which it was commissioned and in accordance with the Terms of Engagement for the commission. Unauthorised use of this document in any form whatsoever is prohibited. 4220328-44196/https://projects.ghd.com/oc/nqoc/cairnsmarineprecinct3/Delivery/Documents/4219953-REP-2-FINAL_GHD Report CMP Growth Strategy DSD-4692-16.docx
Document Status
Revision Author Reviewer Approved for Issue Name Signature Name Signature Date
Rev 0 G Denholm
B Heggie B Heggie* B Heggie B Heggie* 08/03/17
Rev 1 G Denholm
J Greatorex J Greatorex* J Greatorex J Greatorex* 06/04/17
Rev 2 S Chugg G Denholm G Denholm G Denholm G Denholm 7/11/2018

www.ghd.com