Department of Radiology Pusan National University … 2_cjs.pdf · time Normal Myocardium Contrast...
44
Department of Radiology Pusan National University Yangsan Hospital Ki Seok Choo
Transcript of Department of Radiology Pusan National University … 2_cjs.pdf · time Normal Myocardium Contrast...

Department of Radiology Pusan National University Yangsan Hospital
Ki Seok Choo

Introduction Contrast and stress agents injection protocol MR protocol Dark rim artifact Functional analysis

Ischemia
Ischemic Cascade
Subendocardial Hypoperfusion
Transmural Hypoperfusion
Diastolic Dysfunction
Systolic Dysfunction
ECG change
Angina
Time
Stress functional
(Echo, MRI)
Stress perfusion
(SPECT, MRI)
Treadmill test
(TMT)

stress
rest
40% 75%
1
5
Coronary artey stenosis


time
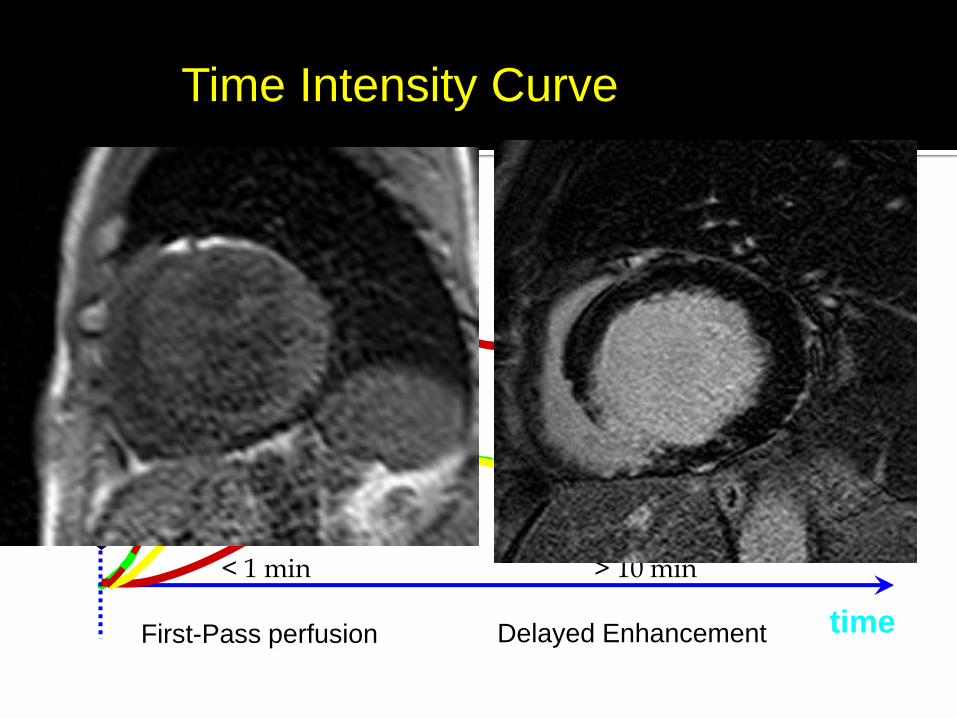
Normal Myocardium
Contrast injection
Infarcted Myocardium
Ischemic Myocardium
First-Pass perfusion Delayed Enhancement
< 1 min > 10 min
Time Intensity Curve

No radiation High temporal resolution High diagnostic performance -> No inferiority to SPECT
MR-IMPACT II European Heart Journal (2008) 29, 480–489
MR-IMPACT II European Heart Journal (2013) 34, 775–781

Author and Year
No Criterion for Significant CAD
Stress Agent
Sensitivity Specificity
Thomas et al, 2008
60 Stenosis > 50% Adenosine 0.93 0.84
Burgstahler et al, 2008
23 Stenosis > 70%
Adenosine
1.0 0.80
Arnold et al, 2010
65 Stenosis > 50%
Adenosine
0.90 0.81
Manka et al, 2010
41 Stenosis > 50%
Adenosine
0.92 0.75
Lockie et al, 2011
42 Fractional flow reserve < 0.75
Adenosine
0.82 0.94
Schwitter et al, 2008
225 Stenosis > 50%
Adenosine 0.85 0.67
Merkle et al, 2007
228 Stenosis > 50%
Adenosine 0.96 0.72
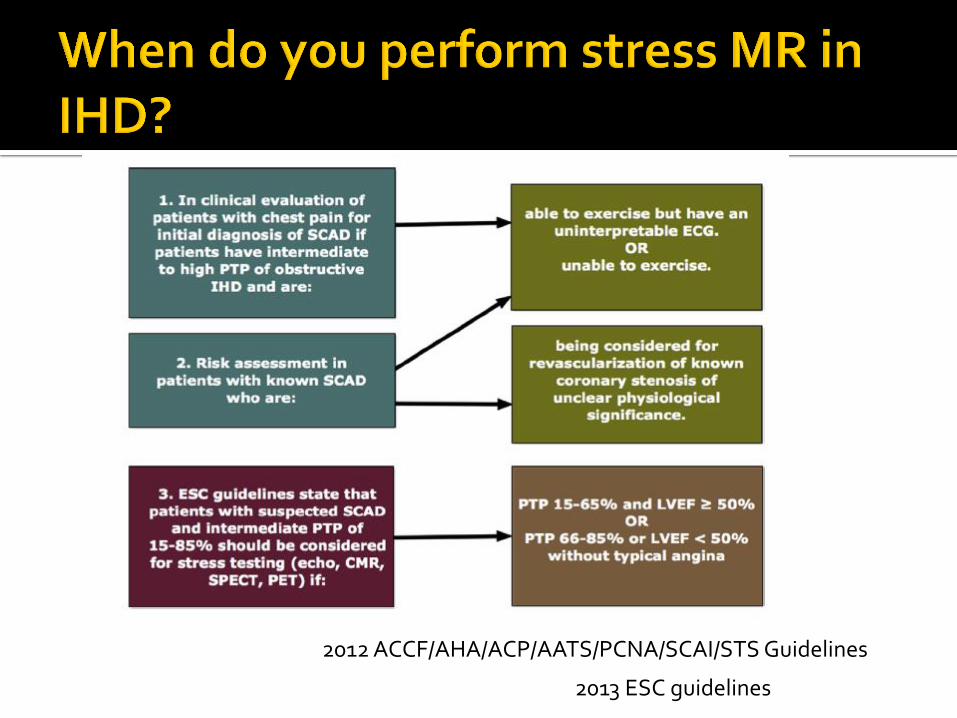
2012 ACCF/AHA/ACP/AATS/PCNA/SCAI/STS Guidelines
2013 ESC guidelines

Bolus with a dosage of 0.05 mmol/kg bw of an extracellular Gd-based contrast agent
4 ml/s is used The bolus is followed by a 20 ml saline flush using
the same injection rate to facilitate a compact bolus passage
We recommend the use of an automatic infusion system
Two 18 gauge venflons for separate administration of the stress agent and contrast agent

Bad Bolus:
• Mean Curve ROI in LV
• Peaks in 20-30 sec
• No recirculation
Good Bolus:
• Mean Curve ROI in LV
• Peaks in 5-10 sec
• Recirculation
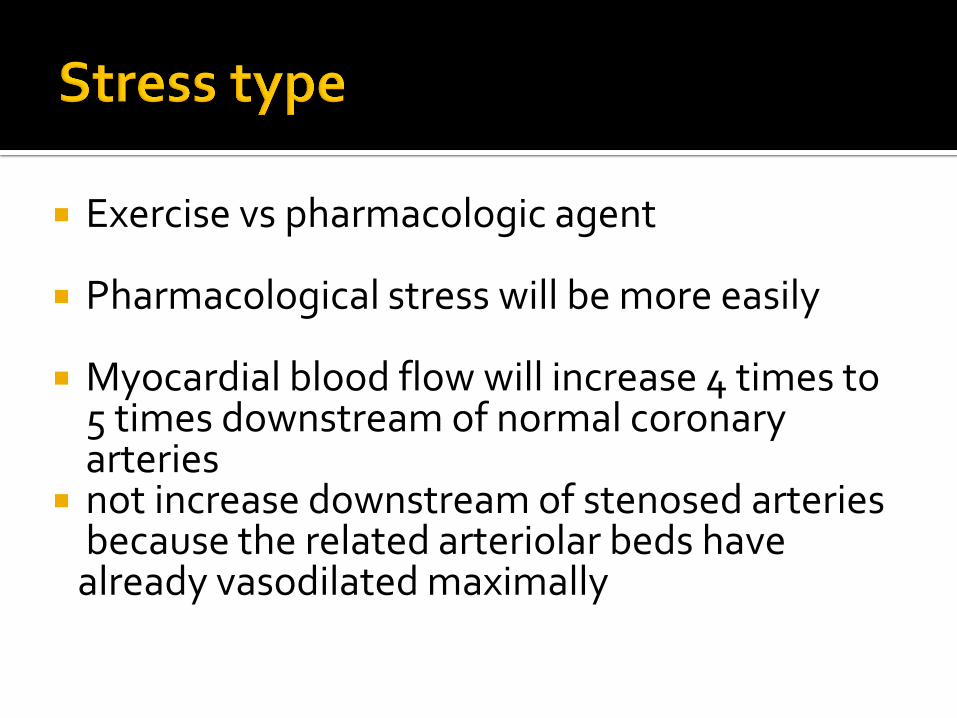
Exercise vs pharmacologic agent
Pharmacological stress will be more easily Myocardial blood flow will increase 4 times to
5 times downstream of normal coronary arteries
not increase downstream of stenosed arteries because the related arteriolar beds have
already vasodilated maximally

Physical stress may not be feasible within the MRI environment

Dipyridamole
Indirect vasodilator through its inhibition of adenosine reuptake, which increases endogenous adenosine
Adenosine
a nonselective vasodilator that activates adenosine A1 receptors.
also activates adenosine A3 receptors, which causes bronchospasm

Regadenoson
a newly approved vasodilator that selectively activates the adenosine A2 receptors
because of its selectivity and ease of use, regadenoson is increasingly being used
Rapid injection by 0.4mg/5mL for all weight

Short half life (<10 secs) Better patient tolerence Side effects of Adenosine
Mild decrease in systemic blood pressure
Mild increase in heart rate
Increase respiratory rate
Headache
Dizziness
Shortness of breath
Nausea
flushing
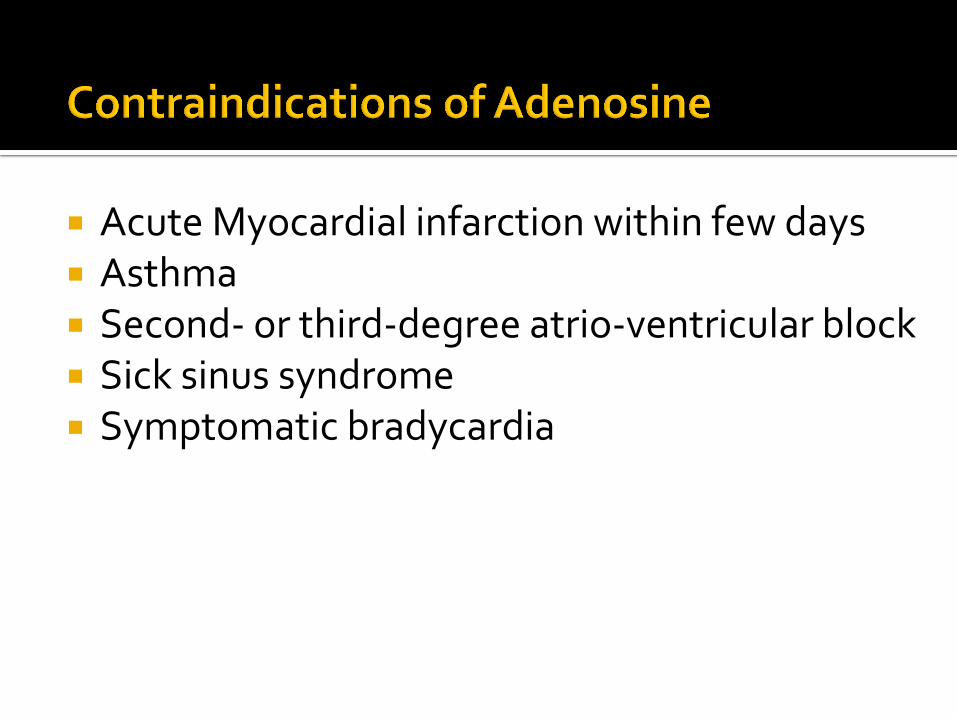
Acute Myocardial infarction within few days Asthma Second- or third-degree atrio-ventricular block Sick sinus syndrome Symptomatic bradycardia
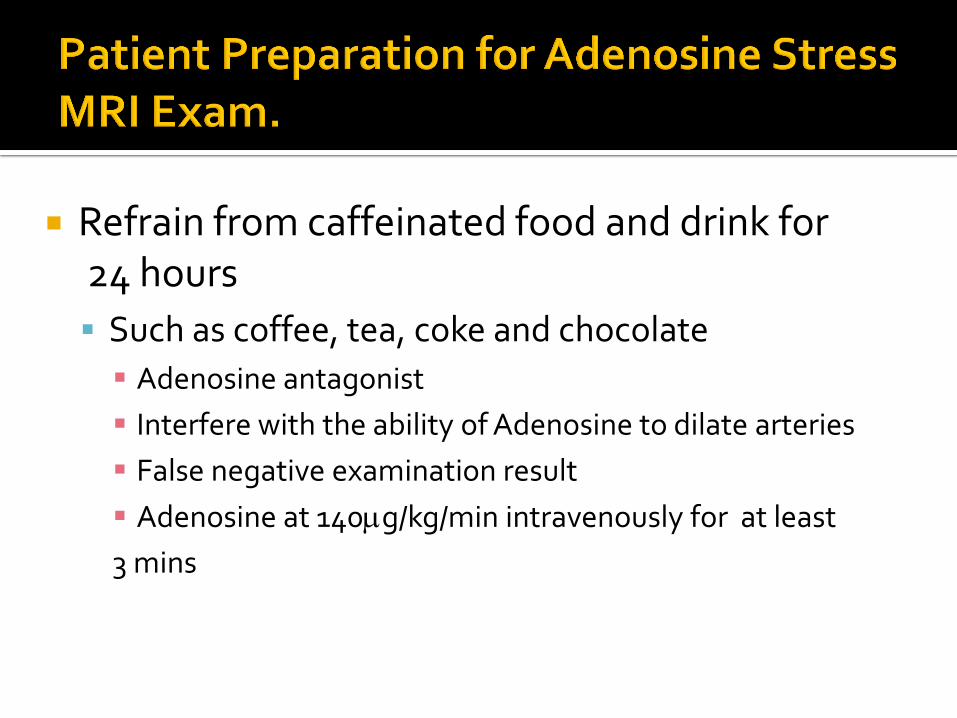
Refrain from caffeinated food and drink for 24 hours
Such as coffee, tea, coke and chocolate
Adenosine antagonist
Interfere with the ability of Adenosine to dilate arteries
False negative examination result
Adenosine at 140g/kg/min intravenously for at least
3 mins

ECG
Slice1 Slice2 Slice3
T1 weighted, single-shot TrueFISP or TurboFLASH
MR Cardiac Perfusion Sequence
ECG-gated single shot imaging
Slice4 Slice1 Slice2 Slice3 Slice4

MR Cardiac Perfusion Sequence
Preparation Pulse for T1 contrast
Magnetization
Preparation pulse
acquisition
To achieve suitable T1 contrast in gradient echo single shot
techniques preparatory pulse must be used.
ECG
Slice1 Slice2 Slice3
T1 weighted, single-shot TrueFISP or TurboFLASH
Slice4 Slice1 Slice2 Slice3 Slice4

MR Cardiac Perfusion Sequence
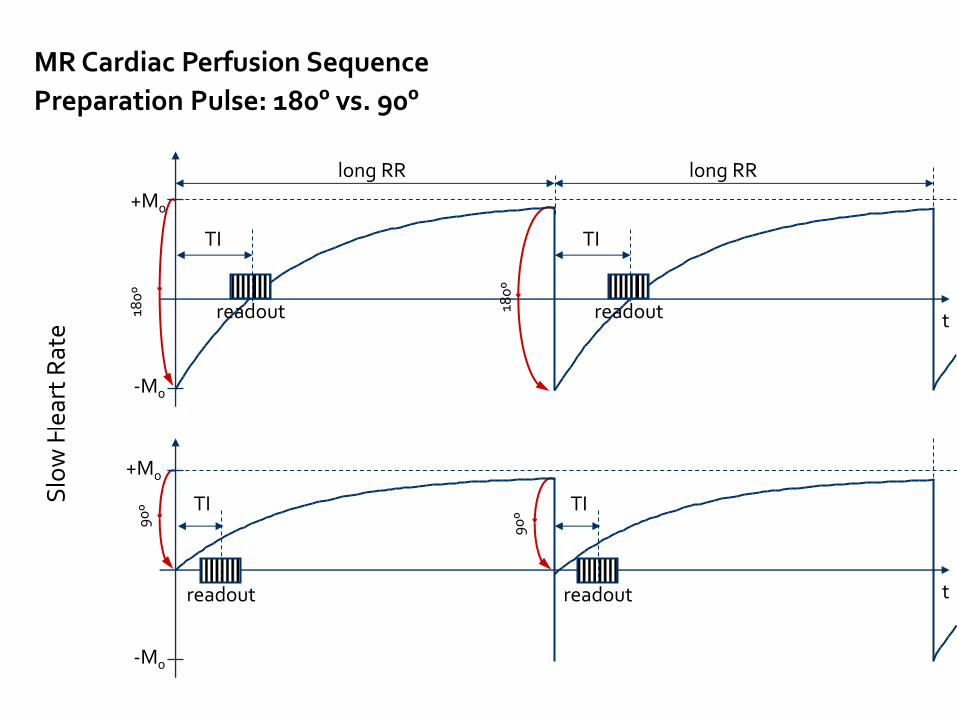
Inversion Recovery Preparation Pulses
With 180º Inversion Recovery pulse With 90º saturation pulse
- Weak T1 contrast
+ Multi-slice capabilities
+ Heart rate independence
(Insensitive to arrhythmia)
+ Strong T1 contrast
- Multi-slice imaging difficult due to long waiting period
- Heart-rate dependent relaxation
(Sensitive to arrhythmia)
Slo
w H
eart
Rat
e
-M0
+M0
t
180
º
180
º
MR Cardiac Perfusion Sequence
Preparation Pulse: 180º vs. 90º
-M0
+M0
TI
long RR
t
90
º
90
º
long RR
readout
readout
TI
readout
TI
readout
TI
180
º
+M0
-M0
Fas
t H
eart
Rat
e
+M0
-M0
t readout
90
º TI
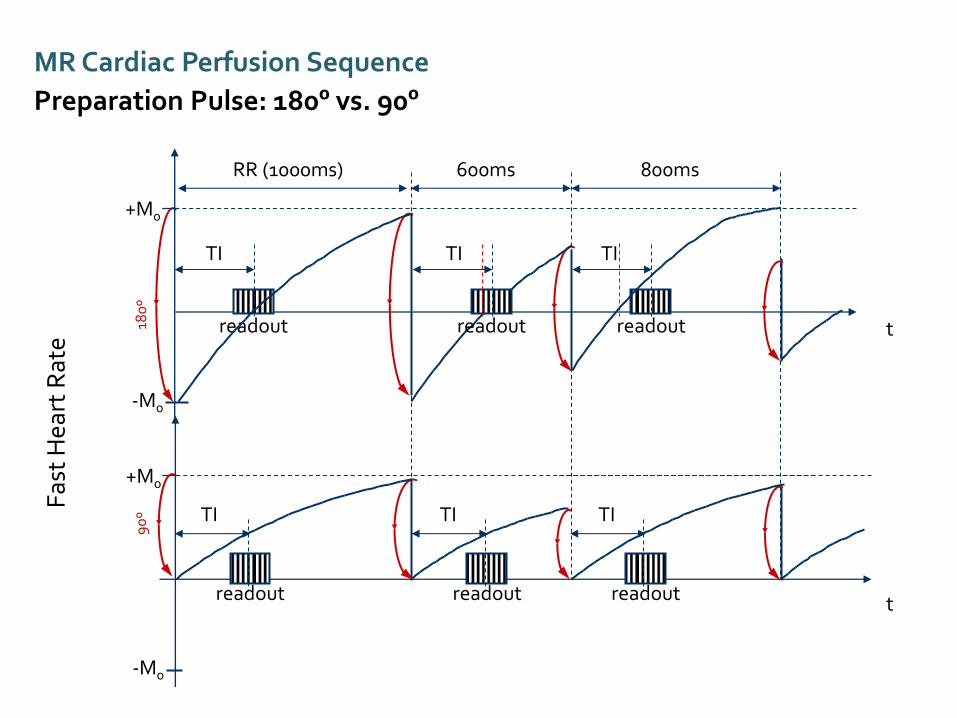
600ms 800ms RR (1000ms)
readout
TI
t
readout
TI
readout
TI
readout readout
TI TI
MR Cardiac Perfusion Sequence
Preparation Pulse: 180º vs. 90º

Myocardial Perfusion (Stress*)
Short axis view
Myocardial Perfusion
(Rest) Short axis view
Myocardial Viability Study:
Short axis, 2-, 3- & 4-chamber views
0.05 or 0.1 mmol/Kg MR Contrast Media
0.05 or 0.1 mmol/Kg MR Contrast Media
Localizer Seque
nces
Delay 10mins
Cine View short
axis
Cine 2-chamber,
4-chamber or 3-chamber view
Delay 10mins
Total Imaging Time: about 45mins
Adenosine infusion
(140 µg/kg/min)
over 3 minutes


1. Gibbs Ringing at border dark-bright (low spatial resolution)
2. Direction of phase en-coding 3. Systolic motion (low temporal resolution) 4. Bo inhomogeneity

Visual Analysis Quantification
Fullyquantification (absolute tissue perfusion) ▪ Myocardial blood flow (MBF)
▪ (Unit: ml/g/min) (requires mathematical modeling)
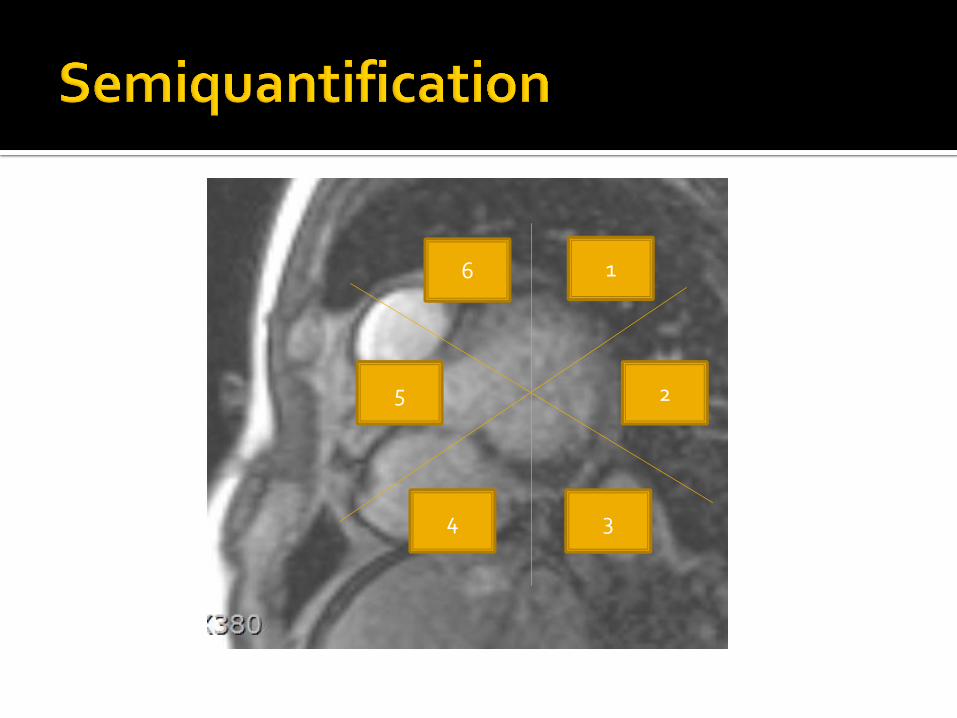
Semiquantification ▪ stress induced change of upslope
▪ Myocardial perfusion reserve (MPR)
▪ Perfusion Index (stress upslope/rest upslope) ▪ Under stress the slope should normally become steeper
▪ The index should be > 1.5 to be considered normal

Four established methods (tracer kinetic analysis methods)
Fermi-constrained deconvolution
model-independent deconvolution
a one-compartment model
an uptake model
con
Radiology. 2014 Dec 18:140433. [Epub ahead of print]
Conclusion : Diagnostic performance of quantitative myocardial perfusion estimates is not affected by the tracer kinetic analysis method used.
1
2
3 4
5
6

Time to peak Peak signal intensity Area under the curve from foot to earliest peak Slope (signal intensity per time)


Perfusion Evaluation
Semi-quantitative Analysis
(Myocardial Perfusion Reserve Index)
Relative upslope [%/s] : myocardial upslope / blood pool upslope
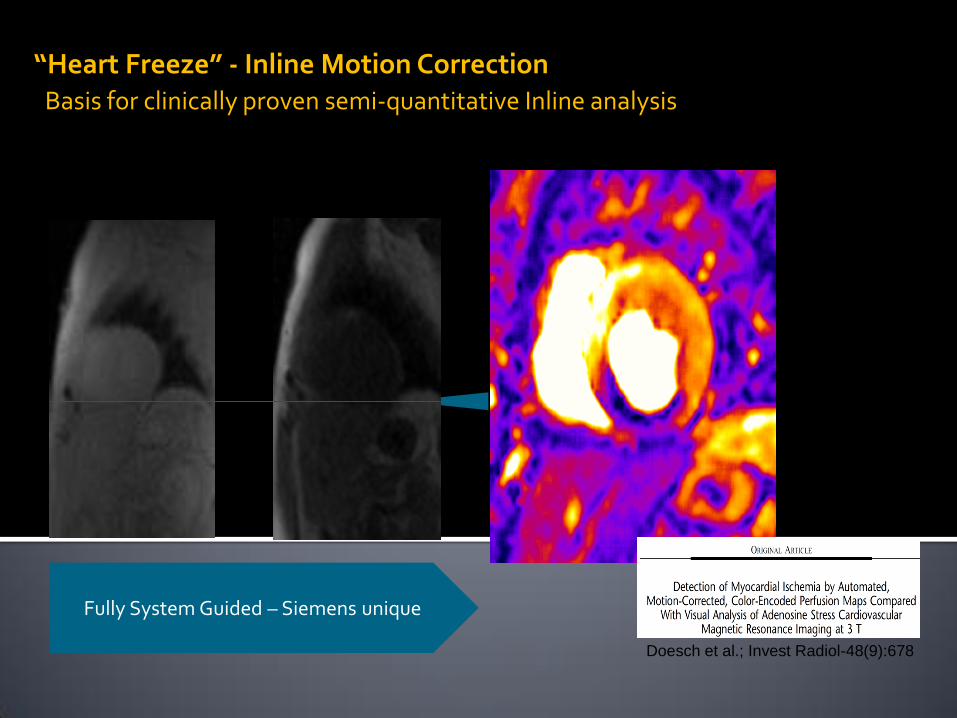
“Heart Freeze” - Inline Motion Correction Basis for clinically proven semi-quantitative Inline analysis
Inline Time
Course Analysis
Doesch et al.; Invest Radiol-48(9):678
Fully System Guided – Siemens unique
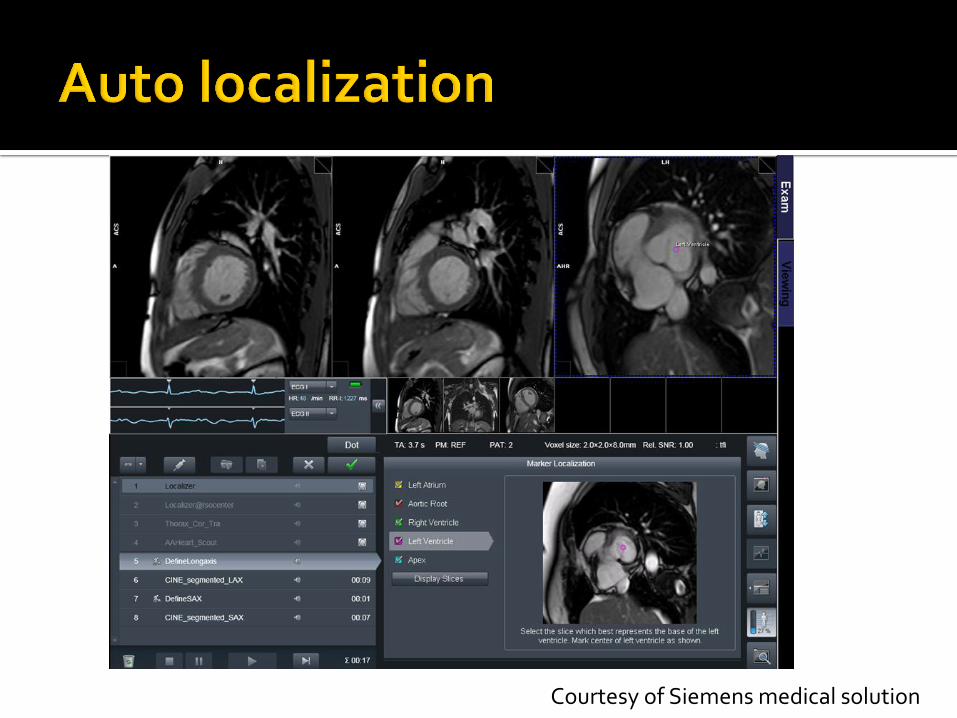
Courtesy of Siemens medical solution

Similar to the interpretation of nuclear MPI Reversibility; key distinguishing feature


Stress MR can be useful tool for evaluation of CAD and IHD in some indication
Should be familiar with how to perform this Dark rim artifact can be caused by various
condition Visual analysis was preferred and semi and
fully quantification will be popular
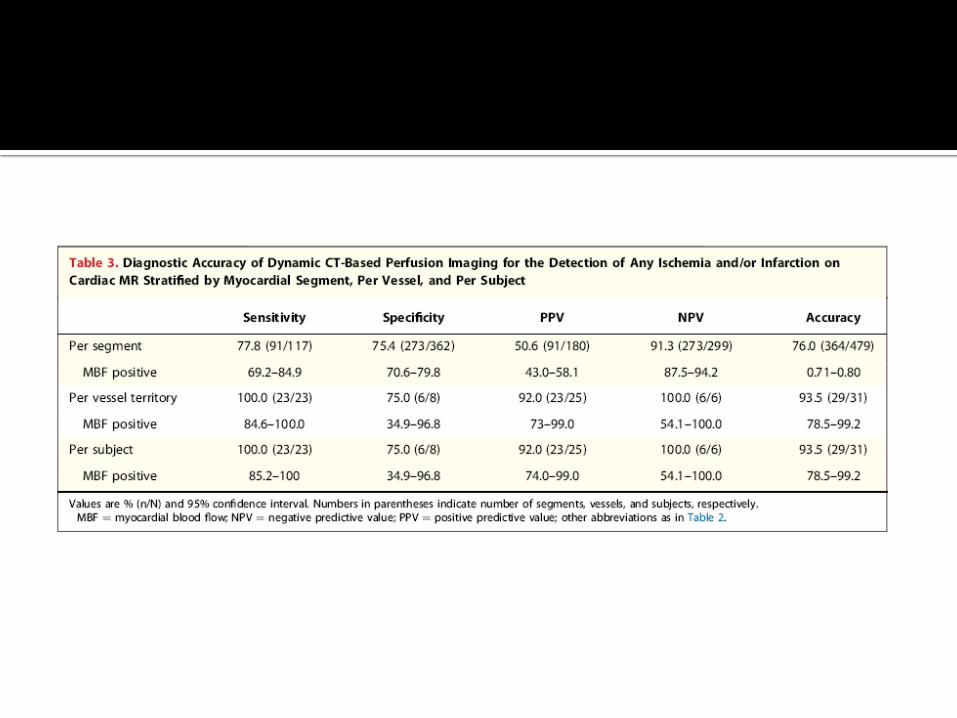
JACC Cardiovasc Imaging. 2014 Mar;7(3):267-77.


Mun Young Paek: Siemens Medical solutions