Denver Drug Court Report - cdpsdocs.state.co.us
82
1 Case Processing Evaluation of the Denver Drug Court February 1999 This report was prepared by Office of Research and Statistics Division of Criminal Justice Colorado Department of Public Safety Diane Patrick and Kim English, Principle Writers Diane Patrick, Lead Analyst Ed Wensuc, Project Coordinator Kim English, Research Director, Division of Criminal Justice William R. Woodward, Director, Division of Criminal Justice Patrick C. Ahlstrom, Executive Director, Colorado Department of Public Safety 700 Kipling Street, Suite 1000 Denver, Colorado 80215 ph (303) 239-4442 fx (303) 239-4491 www.state.co.us/gov_dir/cdps/dcj.htm This project was funded by a Division of Criminal Justice Drug Control and System Improvement Program Grant (#D96DB19151), a Byrne Memorial Fund project sponsored by the U.S. Bureau of Justice Assistance. All views presented here are those of the authors and do not necessarily represent the views of the U.S. Department of Justice.
Transcript of Denver Drug Court Report - cdpsdocs.state.co.us

1
Case Processing Evaluation of the Denver Drug Court
February 1999
This report was prepared by
Office of Research and StatisticsDivision of Criminal JusticeColorado Department of Public Safety
Diane Patrick and Kim English, Principle WritersDiane Patrick, Lead AnalystEd Wensuc, Project Coordinator
Kim English, Research Director, Division of Criminal JusticeWilliam R. Woodward, Director, Division of Criminal JusticePatrick C. Ahlstrom, Executive Director, Colorado Department of Public Safety
700 Kipling Street, Suite 1000Denver, Colorado 80215ph (303) 239-4442fx (303) 239-4491www.state.co.us/gov_dir/cdps/dcj.htm
This project was funded by a Division of Criminal Justice Drug Control and System ImprovementProgram Grant (#D96DB19151), a Byrne Memorial Fund project sponsored by the U.S. Bureau of JusticeAssistance. All views presented here are those of the authors and do not necessarily represent the views of theU.S. Department of Justice.

2

3
ACKNOWLEDGMENTS
Many people participated in the research project and in the preparation of the final research report. Inparticular, we appreciate the work of the data collection staff, Joan Crouch, Linda Swolfs, and Sharon
Thomas. Suzanne Pullen’s assistance with the research design, identification of study groups, and
thoughtful feedback on the draft of the report was invaluable. Careful reviews by Greg Long,
Shannon Gaskill, and the Honorable Judge Meyers were critical to our understanding and properinterpretation of the data. Their efforts to educate us were most appreciated. Vern Fogg and Jack
Lutes gave us very helpful feedback on the draft report.
Finally, Bill Woodward and John Inmann provided consistent and vital support and interest. We
thank you all.
Kim English
Research Director, Colorado Division of Criminal Justice
Ed WensucManager, Data Analysis and Report Production, Colorado Division of Criminal Justice

4
5
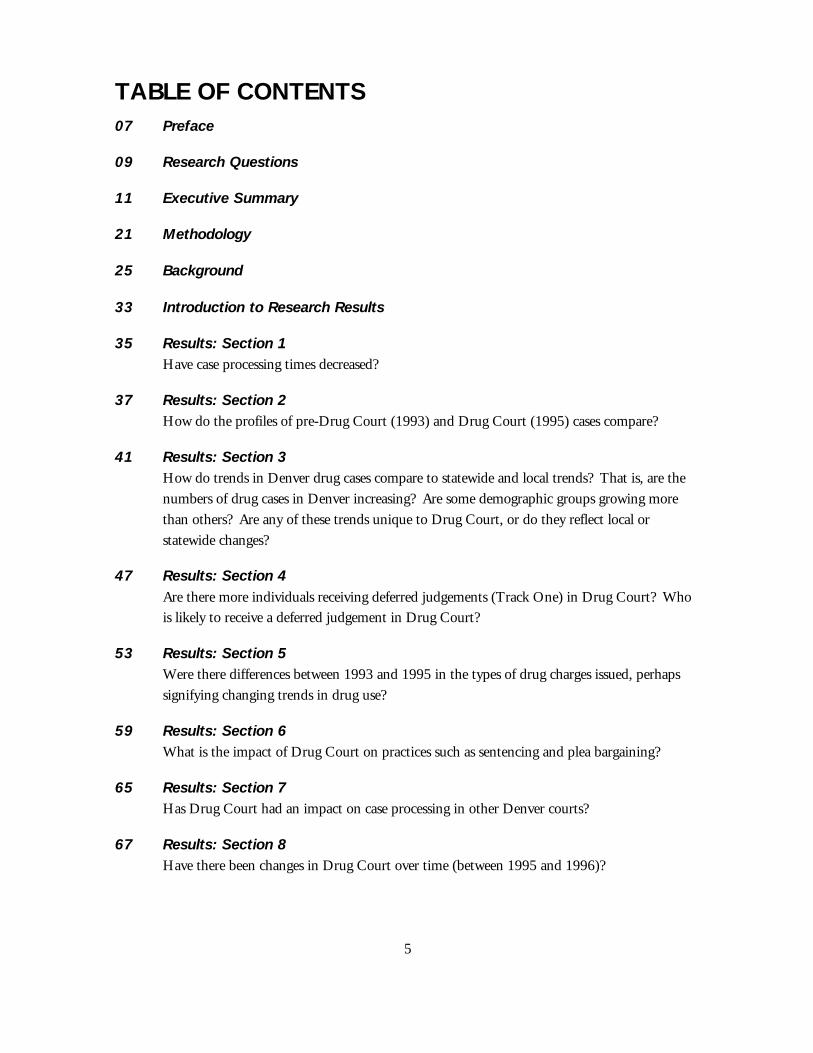
TABLE OF CONTENTS07 Preface
09 Research Questions
11 Executive Summary
21 Methodology
25 Background
33 Introduction to Research Results
35 Results: Section 1Have case processing times decreased?
37 Results: Section 2How do the profiles of pre-Drug Court (1993) and Drug Court (1995) cases compare?
41 Results: Section 3How do trends in Denver drug cases compare to statewide and local trends? That is, are the
numbers of drug cases in Denver increasing? Are some demographic groups growing more
than others? Are any of these trends unique to Drug Court, or do they reflect local or
statewide changes?
47 Results: Section 4Are there more individuals receiving deferred judgements (Track One) in Drug Court? Whois likely to receive a deferred judgement in Drug Court?
53 Results: Section 5Were there differences between 1993 and 1995 in the types of drug charges issued, perhaps
signifying changing trends in drug use?
59 Results: Section 6What is the impact of Drug Court on practices such as sentencing and plea bargaining?
65 Results: Section 7Has Drug Court had an impact on case processing in other Denver courts?
67 Results: Section 8Have there been changes in Drug Court over time (between 1995 and 1996)?

6
77 Results: Section 9What were outcomes for Drug Court participants as measured by adherence to treatment?
81 Stakeholder Feedback

7
PREFACE
It is important to understand that the Denver Drug Court emerged in the context of significant urbanchange. The revitalization of Lower Downtown Denver in the early 1990's included the building of a
major league baseball stadium and the renovation of formerly industrial and commercial buildings into
residential lofts. What had been relatively “hidden” criminal and drug activity in this area now
became the subject of public (particularly the new residents’) outcry. Denver’s Chief of Police and theManager of Public Safety targeted the area and created Police District 6, aided by Weed and Seed
funding. Drug Court Coordinator Shannon L Gaskill explains:
This area had long been a haven for many homeless and addicted men and women, and tar heroinbrought over the Mexican border was sold on almost every corner.... Police sweeps became regular, wellcoordinated (with the District Attorney’s Office) events, especially in the area surrounding Coors Field(personal communication, August 5, 1998).
The police sweeps resulted in the arrests of many Mexican nationals, who were then processed through
the initial phases of the Drug Court. Some cases were forwarded to INS.
This local criminal justice effort to improve the quality of life in Lower Downtown is reflected in the
findings presented in this report. Heroin cases increased significantly between 1993 (the year before
the Drug Court began) and 1995, the year of concentrated sweep strategies, and reduced in 1996 to
pre-1995 levels.
This context of organized local interdiction efforts means that the findings presented in this report
will, unfortunately, be confounded somewhat by larger crime, criminal justice and perhaps even urban
renewal activities that are far outside the control of researchers and Drug Court staff. The Drug Court
is the repository of drug cases filed, and the impact of the Drug Court cannot be isolated from itssurrounding context.
Nevertheless, whenever any group doubles in size – and the number of drug convictions increased by
105% between 1993 and 1995 – the composition of the group also tends to change. The expanded
group includes individuals who otherwise may have been on the fringes, those who might have stayedinvisible when law enforcement had fewer resources, or who might have fallen through the cracks with
a less coordinated response. The composition of the expanded group may also reflect actual changes in
behavior patterns on the part of criminals or decision makers or both. Social science is rarely afforded
the opportunity to exert the necessary environmental controls that allow us to know, with certainty,why things are the way they are.
A complete description of the cases in the expanded group is essential if decision makers and program
planners want to understand who is participating in the program. From the data presented in this
report, it is clear that service providers must target the increased number of women processed through
8
the Drug Court. Likewise, many Drug Court cases must be linked with bi-lingual services thatprovide remedial education, vocational training and, in some cases, residential stability. The Drug
Court’s full-time use of Spanish-speaking interpreters and its current use of treatment agencies capable
of working with Spanish-speaking defendants reflect the commitment of Drug Court staff to respond
to the special needs of this portion of Denver’s drug addicted population. We hope furtherdescriptions of this group will assist with directing services to Drug Court defendants.
Kim English
Research Director, Colorado Division of Criminal Justice
February, 1999

9
RESEARCH QUESTIONS
This research study will focus primarily on Drug Court case processing. Examining specific outcomes,
such as recidivism or rearrest rates, was beyond the scope of the current study. This report is organized
into several sections to answer the following questions:
1) Have case processing times decreased between pre-Drug Court (1993) and DrugCourt (1995)?
2) How do the demographic profiles of pre-Drug Court (1993) and Drug Court(1995) cases compare?
3) How do trends in Denver Drug Cases compare to statewide and local trends? That is, are the number of drug cases in Denver increasing? Are some demographicgroups growing more than others? Are any of these trends unique to Denver DrugCourt or do they reflect local or statewide changes?
4) Are more individuals receiving deferred judgements (Track One) in Drug Court? Who is likely to receive a deferred judgement in the Denver Drug Court?
5) Do differences exist between 1993 and 1995 in the types of drug chargesissued, perhaps signifying different trends in drug use?
6) What is the impact of Drug Court on practices such as sentencing and pleabargaining?
7) Has the Drug Court had an impact on case processing in other Denver Courts?
8) Have changes occurred within Drug Court over time (between 1995 and 1996)?
9) What were the preliminary outcomes for Drug Court participants as measured byadherence to treatment.

10

11
EXECUTIVE SUMMARY
Purpose of the ResearchThe Denver Drug Court began in July of 1994. To examine the impact of the Drug Court on case
processing in Denver, case file descriptions from 1993 (pre-Drug Court) were compared with similardata describing 1995 and 1996 drug cases, in Denver and statewide. Data were collected from district
court files by Division of Criminal Justice researchers. Profiles of drug offenders for these years were
compared to assist policy makers and programming professionals in determining whether the Drug
Court is accomplishing its original and evolving objectives. The findings can also assist decisionmakers in identifying and prioritizing program interventions for Drug Court clientele.
The Executive Summary is followed by the full report presenting the methodology and data tables.
The Research Question and the Confounded FindingsWhenever a new correctional program or placement opens up in a community, common questions forprogram planners and criminal justice analysts are: Who will vitalize the new program/placement?
How are other program/placements affected by the introduction of new services? Are different
clientele caught in a widened criminal justice net who otherwise would have remained on the fringes,
just outside the system's capacity?
One way to address such questions about a program/placement is to collect and analyze data that allow
researchers to profile the cases before and after the new program/placement began, and then infer that
differences can be accounted for by the program, assuming no other significant changes were
happening in the system at the same time. In the case of the Denver Drug Court, we investigated theimpact of the Drug Court on other Denver District Court operations, and profiled the cases processed
through the court in 1993, before the Drug Court opened, and in 1995, one year after the court
began.
But we cannot assume the changes presented here are a function of the Drug Court alone. Thefindings, beginning with Table 3 below, are confounded by numerous simultaneous occurrences
lasting several years. The research findings must be considered in the context of these simultaneous
activities.
Specifically, the Denver Drug Court began in 1994, at a time when a myriad of community changeswere occurring in Denver, changes that centered around the organized establishment of the Lower
Downtown residential and business communities. This geographic area had long been a neglected
part of the city, with a moderate amount of warehouse and retail activity that closed at 5:00 p.m.
After hours, this area became the nighttime quarters for many of Denver's homeless and drug addictedcitizens. When the city built a major league baseball stadium in the area, previously abandoned

12
buildings were renovated into up-scale lofts and upwards of 20 restaurants opened near Coors Field. The city's active renewal of Lower Downtown brought public interest and family traffic to the oldest
part of the city.
The new residents had little tolerance for open-air drug markets that persisted despite urban renewal.
Perhaps attracted by the new activity, local drug enforcement intelligence reported an increase inMexican and Honduras nationals trafficking drugs, especially heroin. The drug activity was overt in
Lower Downtown, and the neighborhood residents organized and complained to the police.
The Denver Department of Public Safety responded to citizens' protests by establishing Police
District 6. Additional Weed and Seed funds increased the number of officers available to assist withfocused, coordinated drug interdiction efforts.
Undoubtedly, some of the participants in these highly publicized police efforts ended up in our Drug
Court sample, but we did not analyze data on the location of the arrest. We cannot, then,
quantitatively describe the impact of urban renewal and law enforcement's response to complaintsabout illegal drug activity in Lower Downtown on the Drug Court client profiles.
According to data collected directly from Drug Court Files, approximately 19% (69 cases) of the 1995
sample (n=357) were referred to INS for possible deportation. Fifty of these cases were placed on
probation (8 were given accompanying jail time), and 19 of those convicted were sentenced to prisonfor between 18 and 96 months.
The ethnicity of sixty-eight (68) of the 69 INS referred cases were coded Hispanic; one was coded
Black. INS cases represent 45% of the Hispanic cases, and 20% of the cases overall, in the 1995
sample. INS referral data were not collected on the 1993 cases, so we cannot determine how thisdiffers from the 1993 sample. Nor can we exclude the INS cases from the 1995 sample since this
would make the two groups uncomparable. Further, the data presented in this report include the INS
cases since these convicted offenders represent a substantial component of the workload for Drug
Court staff, not to mention an important resource issue for other criminal justice system placementsand staff. As long as these drug trafficking patterns continue (that is, bringing drugs from Central
America and Mexico to Denver) so will the workload issues for law enforcement officials and the
Denver District Court. Also, as presented in Table 32, the 1995 INS-referral trend continued into the
following year, 1996, when 40.5% of Hispanic drug cases were referred to INS.

13
Figure 1. Comparison of Ethnicity between 1993 Denver Drug Cases and 1995Denver Drug Court Cases (INS referrals omitted in 1995)
In this report, we note an increase in the proportion of Hispanics convicted of drug cases in DenverDistrict Court: 34.4% (n=55) in 1993 compared to 42.5% (n=148) in 1995. When 1995 Hispanic
INS referrals (n=68) are subtracted from the study sample, the proportion of 1995 Hispanic drug cases
in the sample shrinks from 42.5% to 28.6% (please see Figure One). The 28.6% figure represents a
decrease in the proportion of convicted Hispanic drug cases processed in Denver in 1993 compared to
1995. However, the 1993 data include INS referrals, so we would expect this group to be larger given thelikelihood of the presence of individuals from other countries selling drugs in Denver in 1993.
In sum, when the 1995 Hispanic drug cases referred to INS are excluded from the sample, the differences
in ethnicity of drug cases before and after the inception of the Denver Drug Court are unremarkable. Other characteristics associated with INS cases--lower levels of education and transiency, for example--
repeatedly surface in the findings because INS cases represent 20% of the total 1995 sample. These
offenders remain challenges for Drug Court staff, and so these cases are included in the analyses
presented in this report.

1 The word significantly as used in the Executive Summary and the Research Report means that the finding was statisticallysignificant at a probability level of .05 or greater. This means that the likelihood of the finding occurring by chance alone was lessthan 5%.
2 The date of the crime precedes the arrest date when these dates are not the same.
14
The increase in drugconvictions in Denver isapproximately threetimes larger than for drugcases outside of Denver.
Findings: Comparisons Between 1993 (Pre-drug Court)and 1995 Drug Court Samples of Denver Drug Offenders
Did case processing times decrease between pre-Drug Court and Drug Courtsamples?
P Yes. Denver Drug Court met its goal to expedite the handling of cases. Case processing timesdecreased significantly1 between offense and disposition (169 to 106 days) and between arrest and
disposition (163 to 109 days) between 1993 (pre-Drug Court) and 1995 Denver Drug Court.2
How did 1993 and 1995 trends in Denver Drug Cases compare to statewide andlocal trends? That is, did the number of drug cases in Denver increase? Did somedemographic groups grow more than others? Were any of these trends unique toDenver Drug Court, or did they reflect local or statewide trends?
P The number of drug convictions in Denver more than doubled between 1993 and 1995, an
increase of 105%.
P This increase in drug convictions in Denver was approximately three
times larger than for drug cases in Colorado jurisdictions outside of
Denver. These increases likely reflect significant changes in local law
enforcement activities that occurred concurrently with the start-up of theDrug Court. This finding is more fully discussed in the body of the
research report.
P This increase in drug convictions did not occur evenly across all subgroups in the sample:
P Between 1993 and 1995, female drug convictions increased 168% compared to the overallincrease in female convictions of 105%. Female non-drug convictions increased at more than
double the overall increase in non-drug convictions (61% for females compared to 29%
overall).
P Hispanic drug case convictions in Denver Drug Court increased almost two-thirds more thanthe overall increase in drug case convictions between 1993 and 1995 (169% compared to the
overall increase of 105%); half of these cases were referred to INS. Comparisons to other
Denver courts and jurisdictions outside of Denver indicate that this increase in convictions

15
among Hispanics appears to be unique to Denver’s Drug Court, a finding consistent withlocal law enforcement data regarding highly organized drug trafficking by Mexican and
Honduras nationals. Further comparisons of the characteristics of Hispanic cases showed the
1995 sample to be different from the 1993 sample in ways that are consistent with front-line,
Mexican and Central American street drug traffickers:P A smaller proportion of the Hispanic sample reflected residential stability
P A smaller proportion of the Hispanic sample was employed full time at arrest
P A larger proportion of the Hispanic sample had less than an 8th grade education
P Almost half (45.9%) of Hispanics convicted of drug charges in 1995 were referred to INS.
P A greater proportion of the 1995 sample, compared to the 1993 sample, were mobile and
transient individuals. This difference was found for both the statewide drug cases and the
Denver Drug Court samples.
P Increases in drug case convictions were found for two educational groups: those with less thanan eighth grade education and those with some college or more. This trend appeared in the
statewide sample as well. Drug enforcement officials theorize this finding to reflect increased
trafficking activity by Mexican and Central American nationals and increased illicit drug
abuse by growing numbers of “mainstream,” middle-to-upper class, citizens.
Are more individuals receiving deferred judgments in 1995 Denver Drug Court? If so,what does this mean in terms of the changes in the population flowing through DrugCourt?
P The proportion of the sample receiving deferred judgments increased significantly, from 6.3% in
1993 to 23.5% in 1995. This finding is completely consistent with a goal of the Drug Court: to
identify stable, low-risk drug offenders, place them in Track One, and offer deferred judgementsin exchange for treatment compliance.
P Expected differences were found in the characteristics of individuals receiving deferred judgments
compared to the characteristics of those pleading or found guilty. Several significant differences
were found between these two groups, and the finding was consistent, overall, with thecharacteristics of cases that traditionally receive deferred judgements. The deferred judgment
subgroup contained more individuals with the following demographic characteristics:
P Female
P AngloP Residential stability
P Full time employment
P More education
P Lower overall criminal history scoresP Fewer adult convictions

16
The increase in heroindrug cases in Denver isremarkably different fromjurisdictions outside ofDenver, where heroincharges remained low,but follows the trend ofincreased heroin usagenoted in other largecities.
P Less like to have had a prior adult drug felony convictionP Current drug charges tended to be for possession versus sale of drug
P The data suggest that Drug Court provided an opportunity to expand one subgroup of the types
of cases processed: more persons were likely to be charged with using drugs rather than dealing
drugs. Most individuals who received deferred judgments faced charges for drug possession(79.8%) compared to 48.5% of those pleading guilty. Only 14.3% of those receiving a deferred
judgment faced charges for sale and distribution compared to almost half (49.2%) of the group
pleading or found guilty (designated Track Two cases), indicating that the Court views possession
as less serious than sale of drugs. This is, of course, consistent with the criminal code as well.
Do differences exist between 1993 and 1995 in the types of drug charges issued,perhaps signifying different trends in drug use?
P Yes, differences existed between the two years in type of drug charges
issued. As a proportion of all cases in the sample, heroin chargesincreased from 4% in 1993 to 23.7% in 1995. This finding is consistent
with local law enforcement efforts to interdict organized black tar heroin
trafficking by Mexican nationals.
P Drug of choice, as measured by drug charge, is related to ethnicity in thefollowing ways:
P Black offenders tended to (85.5%) face cocaine/crack related charges.
P Anglos were charged relatively evenly across three major drug
categories: cocaine/crack, heroin and all other drug charges.P Hispanics were charged with crack/cocaine over half the time
(57.8%), and this group faced heroin charges almost a third of the
time (32.7%). Cases charged with heroin crimes were the most likely to receive an INS
referral. Almost every heroin case referred to INS in 1995 was an Hispanic offender (30 outof 31 cases referred). This finding is consistent with local drug enforcement’s data that heroin
in Denver is imported from Mexico and trafficked by Mexican nationals.
P Heroin cases were also linked to very low education levels and transience, both in the INS sub-
sample and in the group that remained in the Drug Court.

3 National Trends in Drug Abuse: Trends in Heroin Drug Use. Pulse Check. (February 1998). (Can be obtained at http://ncjrs.org.)
4 Increased placement in Adult ISP is likely related to increased capacity in this program.
17
The use of communitycorrections for drugoffenders dropped byalmost 40% between1993 and 1995.
P The increase in heroin drug cases in Denver is remarkably different from jurisdictions outside ofDenver, where heroin charges remained infrequent, but follows the trend of increased heroin usage
noted in other large cities.3
P Charges related to stimulant drugs (including methamphetamine and amphetamines) increased
six-fold outside of Denver.
P The jurisdictions of El Paso and Mesa Counties showed the most pervasive use of stimulants in
1995, accounting for over half of the stimulant drug convictions outside of Denver in 1995. This
finding is consistent with law enforcement’s assessment of methamphetamine production in these
rural areas.
What is the impact of Drug Court on practices such as sentencing and pleabargaining?
Sentencing PlacementsP Drug Court placement policies facilitated one of its purposes, i.e., allowing defendants the
opportunity to participate in treatment by placing them in less restrictive, community-based
settings. Specifically, the following changes in placement occurred between 1993 and 1995 forDenver drug convictions:
P Almost three-quarters of Drug Court convictions received some type of probation placement
(probation, probation and jail, or ISP), compared to less than two-thirds of the 1993 sample.
P There was a greater emphasis on the combination of probation and jail as a sanction, and overa ten-fold increase in intensive supervision probation (ISP) placements.4
P Conversely, the use of community corrections for drug offenders in
Denver dropped by almost 40% between 1993 and 1995.
P Direct sentences to prison for Denver drug offenders declined bynearly two percentage points between 1993 and 1995. Though
important, this finding was not found to be statistically significant.
Sentencing, Length of SentenceP In 1995, Drug Court assigned significantly longer sentences in two
placement categories: probation and prison. This may be a way to
operationalize one of the goals of Drug Court: to provide a “meaningful response to behaviors.” In the case of probation, the 17% increase in the average supervision period may reflect the
understanding within the substance abuse treatment community of the long-term nature of
recovery, and the value of using criminal justice sanctions as leverage to compel offenders to

18
The opportunity forpleading guilty to a lesserdrug charge occurred lessfrequently in 1995Denver Drug Court thanin 1993 Denver drugcases.
participate in treatment.P These increased sentence lengths are unique to Denver Drug Court and do not reflect local or
statewide trends, suggesting that the Drug Court was, indeed, processing cases in different and
expected ways compared to other district courts.
Disposition ChargeP After the Drug Court was implemented, a significantly larger proportion of cases received
dispositions for drug crimes consistent with their original charge, rather than a lesser drug charge. For example, in 1993, only 20.9% of offenders charged with a cocaine offense received a
disposition for a cocaine offense. In 1995, 92% of cases charged with cocaine crimes received a
disposition for cocaine crimes.
Has the Drug Court had an impact on case processing in other Denver courts?
Case Processing TimesP As noted earlier, case processing times improved in Denver Drug Court.
There was also considerable improvement between 1993 and 1995 in case
processing times in Denver courts handling non-drug cases. Jurisdictions outside of Denver did not show this same trend of shorter
processing times for non-drug cases. In fact, outside of Denver, both
drug and non-drug case processing times tended to be somewhat longer
in 1995 compared to 1993. This suggests a positive impact on caseprocessing times in Denver District Court associated with the onset of the
Drug Court program. Additional research would be needed to
conclusively determine whether Drug Court caused the reduction in case processing times in other
Denver courts, however, this trend should be noted and tracked in the future as an additionalpositive impact of Drug Court.
Findings from a Different Sample: Changes in Drug Courtover Time -- Comparisons of All Drug Court Cases for theFirst Three Months of 1995 with All Drug Court Cases forthe First Three Months of 1996
Case Processing TimesP Processing times continued to improve in Drug Court in 1996 compared to 1995 on three
measures used in the analysis: offense to disposition, arrest to disposition, and filing to disposition.
This finding may reflect improvements in operations and team functioning over the course of theprogram.

19
1996 cases reflectindividuals with moreresidential stability andmore full timeemployment.
DemographicsP Demographic characteristics of cases in the two Denver Drug Court
samples were found to be statistically similar with two importantexceptions: 1996 cases reflect individuals with more residential stability
and more full time employment. For certain characteristics, then, the
trends found in comparisons between 1993 and 1995 Denver drug cases
may diminish over time.
Criminal History ScoresP Criminal history scores were very similar between the 1995 and 1996 Denver Drug Court
samples.
Drug ChargesP The distribution of types of drugs charged changed between 1995 and 1996. The proportion of
heroin charges dropped by about one-third (16.9% in 1996 compared to 26% in 1995).
P While Hispanics were the group most likely to be involved in heroin, according to Drug Court
data, this percentage decreased by almost half between 1995 (47.1%) and 1996 (24.2%). Thisdecrease in Hispanics charged with heroin appears to explain the overall decline in heroin charges,
and is likely linked to local drug enforcement interdiction efforts. That is, persons charged with
heroin were most likely to receive an INS referral. In 1996, every heroin case in our sample that
received an INS referral was Hispanic.
1995 and 1996 Sentencing Practices - Placements and Sentence LengthP Sentencing practices that provided oversight and sanctions became more clearly identified as Drug
Court policies became more established and developed.
P The trend continued of sentencing a large number (75%) of placements to probation in Drug
Court in 1996; however, a shift to more restrictive placement occurred for the 1996 group.
The percentage of individuals sentenced to ISP doubled as capacity increased(5.3% in 1995 to12.7% in 1996).
P More cases received prison placements in 1996 (22.7%) compared to 1995 (17.4%), and
fewer cases received community corrections placements (3.5% in 1996 compared to 8.0% in
1995). P The trend toward longer sentence lengths for Drug Court cases noted in the 1993 and 1995
comparisons continued in 1996. That is, significantly longer sentence lengths for both
probation and prison were recorded in 1996 compared to 1993, before the Drug Court was
implemented.P However, jail sentences in 1996 were significantly shorter. This likely reflects the Drug
Court’s policy of providing immediate sanctions of short jail sentences for individuals who do

20
not follow through with requirements of treatment and supervision.
Findings: Following the Course of Treatment over the SixMonth Time Period Measured for the 1995 Drug Courtand 1996 Drug Court Groups Combined
What were the outcomes for Drug Court participants as measured by adherence totreatment?
P To address this research question, the Drug Court data for 1995 and 1996 were combined. Thisanalysis suggests that most (81%) individuals stayed with treatment at least through the six-month
time frame measured.
P The most common problem recorded in the file was the offender’s failure to participate in
urinalysis testing. Over half the drug cases in treatment (56%) had at least one instance of thisbehavior.
P In terms of overall problem behaviors (positive urinalyses, failure to participate in urinalyses or
missing treatment appointments), that would have resulted in a change in the level of treatment or
supervision, only 19% of the combined Drug Court groups for both years experienced problems in
this area in the first six months of supervision. This low proportion of problem behavior may be
linked to the intense supervision cases receive, or to the appropriate matching of services to
individual treatment need, or both.
SummaryIn sum, compared to the 1993 data, it appears the net has widened to include more drug offendersprocessed through the Drug Court in 1995. This finding alone is not surprising given the increase in
drug arrests. Certain categories of offenders increased in size more than others, and we discuss this in
greater detail in the full report. To an unmeasurable extent, some of these findings reflect the
interaction of urban change, drug trafficking patterns, and law enforcement priorities. Any findingsreported without the community context will not be considered by the Division of Criminal Justice to
be an accurate representation of this research.

21
METHODOLOGY
The DataCase file data were collected on site by DCJ researchers. These data sets are described below. Qualitative data were also obtained via interviewers with Drug Court staff and non-participant
observation of Drug Court activity.
DCJ Court Data The Division of Criminal Justice (DCJ) has collected data from District Court files every year since
1980. Data are typically collected between the months of May and September the year following the
year under study (e.g., 1996 data were collected in 1997) to maximize the likelihood of dispositiondata. The data are collected for an entire twelve-month period beginning January 1 and ending
December 31. The data is collected from a systematic sample (every fifth case or 20%) from each of 9
Judicial Districts, including the counties of Adams, Arapaho, Denver, El Paso, Jefferson, Larimer,
Mesa, Pueblo and Weld. These districts represent approximately 80% of the state’s population.
Many comparative analyses between the years 1993 and 1995 are included in this report. 1993
represents the year prior to the establishment of Denver’s Drug Court which began in July of 1994.
(The data collection form is included in Appendix A.) 1995 represents the first full year of Denver
Drug Court operations. 1996 data reflect changes between the start-up year and the second year ofoperation.
Drug Court SampleDCJ court data plus additional Drug Court information were collected on every Denver Drug Court
case for the first three months of 1995 and the first three months of 1996 (January 1 through March
31). DCJ researchers collected these data in June through October 1996. Cases out of these
populations that would have normally fallen into the DCJ Court Data sample were identified to allowthe standard DCJ Court Data sample to remain intact. The Drug Court Addendum is included in
Appendix B.
The data from the files were organized into ten groups described below. The groups used in
comparisons will vary with the analysis and the question posed. Please note that for this study allreferences to drug cases in groups 1 through 8 refer to drug convictions. Charges or filings were not
the unit of analysis, unless otherwise identified, due to large amounts of missing data on the variables
of interest in one of the comparison years (1995). This was due to the fact that if a case did not
proceed to a conviction, typically it was dismissed and the file did not contain information on thevariables used in these analyses. These dismissed cases do not flow through the court process, and this
evaluation addresses case processing and court processes. The few demographic variables without large
amounts of missing data for cases with a drug charge only were compared to cases with a drug
conviction and revealed almost identical distributions (analysis not presented). Further, for some

22
analyses, including individuals with cases that were eventually dismissed in the analysis might biasresults. For instance, in a comparison of processing times, including a large group of cases that were
dismissed would result in shorter average processing times. Groups 9 and 10 reflect all cases (rather
than a sample) in Denver Drug Court in the months specified.
P Group 1 - 1993 Denver Drug Cases. 1993 DCJ Court Data sample for Denver cases with a drugoffense as the most serious conviction (n=175).
P Group 2 - 1995 Denver Drug Court Cases. 1995 DCJ Court Data sample for Denver cases with adrug offense as the most serious conviction. All cases come from Denver Drug Court. (n=358).
P Group 3 - 1995 Denver Non-Drug Cases. 1995 DCJ Court Data sample for Denver cases with anoffense other than a drug offense as the most serious conviction (n=667).
P Group 4 - 1993 Denver Non-Drug Cases. 1993 DCJ Court Data sample for Denver cases with anoffense other than a drug offense as the most serious conviction (n=518).
P Group 5 - 1993 Non-Denver Drug Cases. 1993 DCJ Court Data sample for cases in areas of thestate other than Denver with a drug offense as the most serious conviction (n=355).
P Group 6 - 1993 Non-Denver Non- Drug Cases. 1993 DCJ Court Data sample for cases in areas ofthe state other than Denver with an offense other than a drug offense as the most serious conviction(n=2100).
P Group 7 - 1995 Non-Denver Drug Cases. 1995 DCJ Court Data sample for cases in areas of thestate other than Denver with a drug offense as the most serious conviction (n=469).
P Group 8 - 1995 Non-Denver Non-Drug Cases. 1995 DCJ. Court Data sample for cases in areas ofthe state other than Denver with an offense other than a drug offense as the most serious conviction(n=2450).
P Group 9 - 1995 Drug Court Jan-March 1995. All Drug Court cases in that three month periodprocessed through Denver Drug Court (n=484).
P Group 10 - 1996 Drug Court Jan-March 1996. All Drug Court cases in that three month periodprocessed through Denver Drug Court (n=408).
Interview DataDCJ researchers experienced enthusiastic cooperation by Drug Court professionals, including the
Drug Court coordinator, lawyers and the original judge. Interview data were also obtained from the
chief probation officer of the Denver District Court and Denver probation officers. These data were

23
used to understand the local context of the emerging Drug Court and assisted with the interpretationof the qualitative data.
The AnalysesUnivariate and bivariate analyses included frequencies, crosstabs, and t-tests, and were used to compare
the various sample groups and test for differences between groups.

24

5 U.S. Department of Justice. (January 1997). Defining Drug Courts: The Key Components. Washington DC: Office of JusticePrograms, Drug Courts Program Office, p.5.
6 National Institute of Justice, U.S. Department of Justice. (1996). Drug Use Forecasting (DUF) Annual Report.
7 Any Drug = All drugs tested for in the DUF sample (cocaine, PCP, opiates, marijuana, amphetamines, methadone, Valium,Darvon, quaaludes, and barbiturates). Although more recent data from this study is available, the data presented here bestrepresents the time period of the evaluation study.
8 U.S. Department of Justice. (June 1993). Miami’s Drug Court: A Different Approach.. (NCJ142412). Washington, DC: Officeof Justice Programs, National Institute of Justice, Program Focus.
25
BACKGROUND
The ProblemDrug and drug-related offenses are prevalent in almost all communities. Drug use increased greatly between 1950 and 1970, and in the mid-1980's, the use of crack cocaine and accompanying arrests
skyrocketed to epidemic proportions.5 Although penalties and legislation regarding drug possession
and sales increased, these efforts seemed to do little to discourage use of illicit drugs. All too often,
drug users cycle in and out of the criminal justice system, using large amounts of social resources, andshowing little improvement in the face of this expense. The degree to which drug use and criminal
activity are intertwined is noted by the National Institute of Justice Drug Use Forecasting project
collecting data from arrestees. Between November 1993 and August 1994 (time periods of interest for
this study), the percentage of newly arrested adult inmates testing positive for drugs in Denver’s jailand detention facilities was about 67% for males and 66% for females.6 The following figure
illustrates the relationship between drug use by Denver arrestees across an array of charges.
Figure 2. Percentage of 1994 Sample of Denver Adult Male & Female ArresteesWho Tested Positive for Any Drug by Most Serious Charge 7
As a result of increased drug-related arrests, many courts, jails and prisons are becoming increasingly
flooded with drug offenders. “Nationwide there were more than one million arrests for drug offenses
in 1991-- a 56% increase since 1982.”8

9 Granfield, R. & Eby, C. (1997). An Evaluation of the Denver Drug Court: The Impact of a Treatment-Oriented Drug OffenderSystem. Final Report. Denver, Colorado: University of Denver, Department of Sociology.
26
Nationwide there weremore than one millionarrests for drug offensesin 1991 -- a 56%increase since 1982. InColorado, the probabilityof prison incarceration fora drug offense increasedby more than 350%between 1982 and1996.
Denver’s experience mirrors the national trend with drug arrests between 1979 and 1993 (the yearbefore the Denver Drug Court began) increasing from 1,280 to 3,799.9 The impact of drug arrests
on Colorado’s prison system is illustrated in Table 1 below, which notes that the probability of prison
incarceration for a drug offense increased by more than 350% between 1982 and 1996.
Table 1. The Probability of Prison Incarceration Given Arrest for a Drug OffenseIncreased by More than 350% between 1982 and 1996
YEAR PROBABILITY OF PRISONINCARCERATION
GIVEN ARREST FOR ADRUG CRIME
DRUG ARRESTS AS A PERCENT OF TOTAL
ARRESTS
1982 1.43% 4.08%
1983 1.79% 3.54%
1984 * 3.59%
1985 * 3.30%
1986 1.59% 3.29%
1987 2.79% 3.28%
1988 5.89% 4.17%
1989 * 4.17%
1990 7.09% 3.38%
1991 7.73% 3.07%
1992 5.58% 3.90%
1993 5.92% 4.50%
1994 ** **
1995 7.96% 4.74%
1996 6.83% 6.17%
* DOC admission data not available for these years.** Colorado Bureau of Investigation drug abuse violation arrest figures N/A.Source of arrest data: Colorado Bureau of Investigation Annual Reports.
Local jurisdictions, with the support of the Federal Government, are developing new approaches to
address problems resulting from increased drug use and attendant criminal activity. Jurisdictions are
beginning to acknowledge that the traditional adversarial system of justice may be ineffective in
addressing alcohol and drug abuse. Additionally, traditional court systems, with typically long delaysbetween filing of charges and assessment and treatment (if, in fact, treatment is provided) may worsen
matters by reinforcing the offender’s denial of alcohol or drug abuse problems. Further, if treatments
are offered, there is often little incentive in the current system for an offender to participate or
10 Defining Drug Courts: The Key Components. Ibid.
11 Gernstein, Dean R., et al. (July 1994). Evaluating Recovery Services: The California Drug and Alcohol Treatment Assessment(Caldata). Executive Summary. Chicago, Illinois: National Opinion Research Center, University of Chicago.
12 Miami’s Drug Court: A Different Approach. Ibid.
27
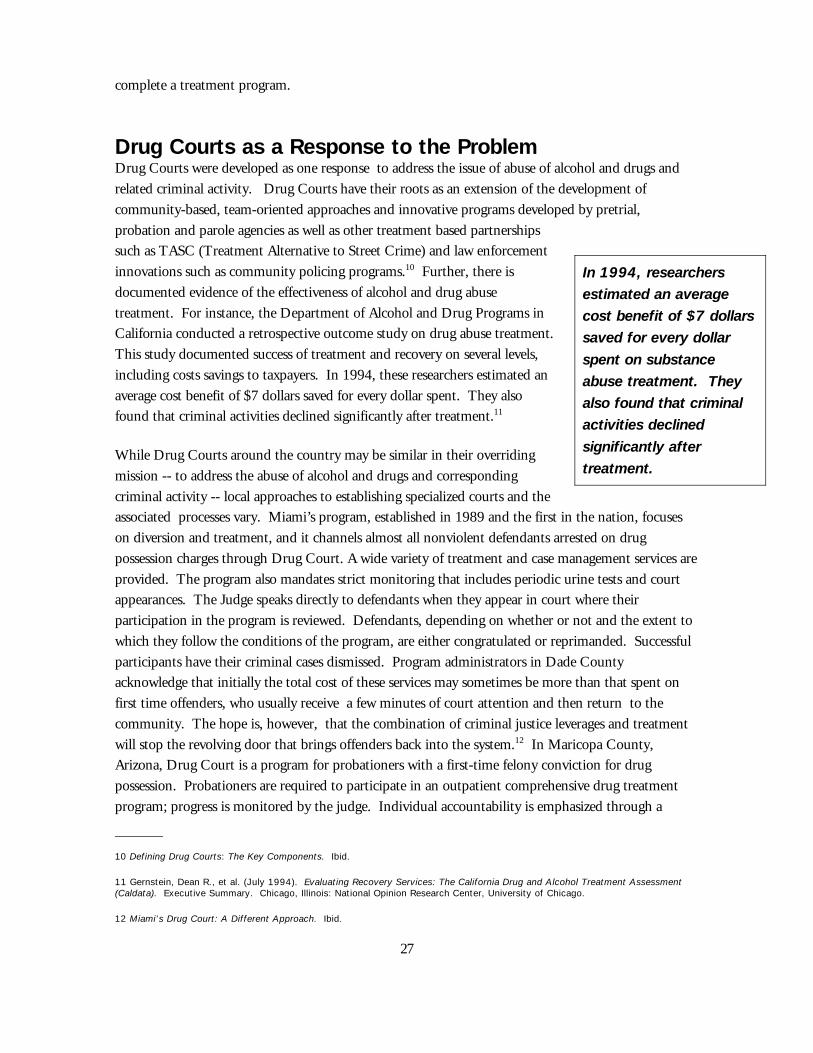
In 1994, researchersestimated an averagecost benefit of $7 dollarssaved for every dollarspent on substanceabuse treatment. Theyalso found that criminalactivities declinedsignificantly aftertreatment.
complete a treatment program.
Drug Courts as a Response to the ProblemDrug Courts were developed as one response to address the issue of abuse of alcohol and drugs and
related criminal activity. Drug Courts have their roots as an extension of the development of
community-based, team-oriented approaches and innovative programs developed by pretrial,
probation and parole agencies as well as other treatment based partnershipssuch as TASC (Treatment Alternative to Street Crime) and law enforcement
innovations such as community policing programs.10 Further, there is
documented evidence of the effectiveness of alcohol and drug abuse
treatment. For instance, the Department of Alcohol and Drug Programs inCalifornia conducted a retrospective outcome study on drug abuse treatment.
This study documented success of treatment and recovery on several levels,
including costs savings to taxpayers. In 1994, these researchers estimated an
average cost benefit of $7 dollars saved for every dollar spent. They alsofound that criminal activities declined significantly after treatment.11
While Drug Courts around the country may be similar in their overriding
mission -- to address the abuse of alcohol and drugs and corresponding
criminal activity -- local approaches to establishing specialized courts and theassociated processes vary. Miami’s program, established in 1989 and the first in the nation, focuses
on diversion and treatment, and it channels almost all nonviolent defendants arrested on drug
possession charges through Drug Court. A wide variety of treatment and case management services are
provided. The program also mandates strict monitoring that includes periodic urine tests and courtappearances. The Judge speaks directly to defendants when they appear in court where their
participation in the program is reviewed. Defendants, depending on whether or not and the extent to
which they follow the conditions of the program, are either congratulated or reprimanded. Successful
participants have their criminal cases dismissed. Program administrators in Dade Countyacknowledge that initially the total cost of these services may sometimes be more than that spent on
first time offenders, who usually receive a few minutes of court attention and then return to the
community. The hope is, however, that the combination of criminal justice leverages and treatment
will stop the revolving door that brings offenders back into the system.12 In Maricopa County,Arizona, Drug Court is a program for probationers with a first-time felony conviction for drug
possession. Probationers are required to participate in an outpatient comprehensive drug treatment
program; progress is monitored by the judge. Individual accountability is emphasized through a

13 Deschenes, E.P, Turner, S. & Greenwood, P.W. (1996). Drug Court or Probation? An Experimental Evaluation of MaricopaCounty. Reprint. Santa Monica, CA: RAND.
14 Harrell, Adele (August 1998). “Drug Courts and the Role of Graduated Sanctions,” Research Preview, National Institute ofJustice, Washington D.C.
15 National Criminal Justice Association. (September 1997). Drug Courts: GAO Withholds Judgment on Effectiveness. JusticeBulletin. 17(9), 1-5. (Available from the National Criminal Justice Association, 444 N. Capitol Street, NW, Washington, DC 20001,(202) 624-1440.)
16 Ibid.
28
According to DrugStrategies, aWashington-basednonprofit researchorganization, more than200 drug free babieshave been born towomen Drug Courtparticipants, resulting ina savings of $50 millionin health care costs.
system of rewards and sanctions.13 The Superior Court of the District of Columbia requiresparticipants to sign a treatment contract demonstrating he or she understands the program rules, the
swiftness of sanctions after violating the rules, and the certainty that specific
sanctions will be
imposed.14
According to the U.S. General Accounting Office, as of March 1997, there
were 161 Drug Courts in operation around the country, and an additional
154 in development.15 According to the GAO, results are inconclusive
regarding the success of Drug Courts in reducing participants’ recidivism andsubsequent drug use. The GAO cites insufficient data and inadequate
methodologies in Drug Court evaluations as a drawback to achieving
conclusive results about the impact of the program. However, according to
Drug Strategies, a Washington-based nonprofit research organization, Drug
Courts have been successful in expediting case processing and drug treatment
referral. According to Drug Strategies, costs to the criminal justice system
have also been reduced by saving dollars that would go to jail and prison
costs. They cite Washington, D.C. as an example where a year of Drug Court costs between $1,800to $4,400 per participant compared to $20,000 per year to jail an offender. The report cites savings in
other costs such as reduced public assistance payments to Drug Court participants who are able to
enter the workforce while in treatment, and reduced health care costs as a result of fewer babies born to
substance abusing mothers. According to Drug Strategies, more than 200 drug free babies have beenborn to women Drug Court participants, resulting in a savings of $50 million in health care costs.
Drug Strategies concluded that Drug Courts are an effective strategy for reducing crime and drug
abuse.16
Denver’s Drug CourtDenver’s Drug Court project began in July of 1994. The inception of the Drug Court paralleled themulti-agency activity prescribed by Colorado House Bill 91-1173. This legislation mandated that all
persons convicted of a felony or misdemeanor and petty offense charges under the Controlled
Substances Act be evaluated for substance abuse during presentence or probation investigations.

17 Long, G. Denver Drug Court: New Approaches to an Old Problem. Paper presented to the National College of District Attorneys.
18 Ibid.
29
Denver officials examined a number ofapproaches in otherjurisdictions beforeestablishing the DrugCourt, seeking toincorporate the best ofeach approach whileaddressing the needs ofthe Denver community.
According to Greg Long, Chief Deputy District Attorney for the Drug Unit, Denver’s criminaljustice system also faced the following problems in the context of designing the Denver Drug Court:17
P Multiple charges on defendants and lack a coordinated response within and across jurisdictions;
P Overcrowding of urban jails, most of which have no facilities for substance abuse treatment;
P Large case loads for probation officers and lack of resources to adequately monitor probationconditions;
P Long delays between violation and sanction;
P Variation in professionals’ (courts and attorneys) understanding of treatment issues;
P Crowded state prisons;P Extensive increase in drug crimes which may result in non-violent and property crimes receiving
less attention; and
P The sheer volume of cases which courtrooms must handle.
Denver officials examined a number of Drug Court approaches in other jurisdictions beforeestablishing the Denver Drug Court, seeking to incorporate the best of each approach while addressing
the needs of the Denver community. Chief Deputy District Attorney Long describes the goals of the
Denver Drug Court as:18
P Early intervention and treatment with tight supervision and immediatemeaningful consequences for behaviors;
P Expedited handling of all cases;
P Computerized on-line information regarding the offender’s compliance
with treatment;P Guilty pleas in all cases, some subject to later withdrawal; and
P A consistent team of personally committed professionals.
Some of the methods cited by Long for accomplishing these goals include:
P Direct filing of felony cases which do not involve other charges of a non-drug nature in one district courtroom. All procedures for a defendant
from the second advisement onward take place in front of the same team
of professionals.
P All arrestees receive a standardized drug and alcohol evaluation, the results of which are availableto the court almost immediately.
P Copies of the file are immediately available to the public defender or private counsel.
P Bond conditions may include requirements that the individual report to the Drug Court
Coordinator, receive treatment and/or submit to a random urinalysis.P The second advisement is held quickly--generally within a few days of arrest. By that time cases
have been reviewed, and determinations made about those in need of treatment.
P Entry into treatment requires a guilty plea, which is subject to withdrawal upon completion of
19 Long, G.F. (1996). Denver Drug Court: New Approaches to Old Problems. The Colorado Lawyer, 25, 29-32.
20 Long, G.F. (1996), Ibid.
21 Long, G.F. Presentation to the National College of District Attorneys, Ibid.
30
successful conditions. On the other hand, judgment can be imposed without the necessity of trialif a defendant does not follow through.
P Presentence reports are expedited; deferred judgment pleas are generally entered within 30 days of
arrest, allowing many offenders to be in treatment within days of arrest.
P Frequent urine tests are required (twice a week to start), as well as frequent reports back to thecourt (initially every two weeks).
P Direct access to private treatment and supervision providers is handled through an automated
management information system, so that problems are dealt with immediately by a variety of
sanctions and treatment modifications.
Those involved in establishing the Denver Drug Court began with the assumption that “shortening
the time between any alleged criminal action and the consequences thereof would strengthen the
connection between the two in the offender’s mind.”19 To enhance communication among personnel
and reduce manipulation of the system by offenders, the proponents of Denver’s Drug Court endeavor to “present a unified system of personnel in a single courtroom.”20 To obtain this unified approach, all
agency administrators agreed that participants, including the judge, district attorneys, public
defenders, and probation officers, would commit to the Drug Court to the exclusion of other
assignments for a specified period of time (one year). To further support this unified system, aseventh criminal district courtroom, devoted entirely to drug cases, was opened. The Drug Court
handles all felony drug cases which do not involve other charges of a non-drug nature.21
Indeed, these objectives seem to have been incorporated in the Drug Court operations. As part of the
process evaluation presented here, DCJ staff officially observed ten Drug Court sessions between Juneand October 1996. As reported in the field notes, the following provides a qualitative description of
the actual court process.
The proceedings of the Denver Drug Court match well with the description of the characteristics thatdistinguish the Drug Court from other Denver District Courts. During the DCJ observation period,the Drug Court provided a rapid response to both positive and negative behaviors. Sanctions wereimposed almost immediately for violation of treatment and other program conditions. Substanceabusingoffenders were supervised closely by both court and probation officers, and progress was monitored byfrequent urinalysis.
The characteristic that made the greatest impression, however, was the broad discretion granted to andused by the court. Drug Court cases are direct-filed, so there is no preliminary County Court review ofa drug case before it reaches the Drug Court. This fact takes a defendant from arrest to arraignment in

22 Comments from the Observation Report, DCJ Denver Drug Court Process Evaluation, prepared by Joan Crouch.
31
record time. From that point on, a defendant becomes the client of a court that maintains close andfrequent contact with each of its clients and determines, on a highly individual, and at times, non-traditional basis, what programs and sanctions will best prevent reoffending and ensure public safety. Successful conclusion of the program is recognized with a graduation ceremony, complete with acertificate of completion. Graduates comment on their experiences with the program and receivesuggestions for follow-up treatment.22
The Denver Drug Court's Systematic Approach toTreatment Need and InterventionThree major components of the Drug Court are key to understanding the Court's approach to services
and public safety: Pretrial Services, the Track, Level and Phase system, and Offender Classification.
Each of these components is described briefly below. The objective of Pretrial Services is the identification of individuals eligible for release to the
community on a reduced bond while confining the serious offender. Those eligible for bond reduction
must agree to random urine drug screening and intensive pretrial supervision by a case manager. This
part of Drug Court programming is designed to improve the offender's probability for successfulgraduation from the Drug Court. Immigration and Naturalization Services (INS) is involved at
Pretrial Services and places non-citizens on "hard" holds (i.e., not eligible for community release on
bond) and makes determinations about deportation. Note that the current sample analyzes cases
convicted of a drug crime (the only exception to this is when charges and convictions are compared),
even when those cases were referred to INS according to file data.
The Track, Level and Phase system works to assign each defendant an intervention and treatment level
depending on systematically assessed need (based on House Bill 1173 requirements) determined at the
presentence investigation stage. Tracks describe the sentencing placement, Levels relate toprogramming requirements, and Phase reflects supervision requirements.
Track 1 is a Deferred Judgement and Sentence; Track 2 is Supervised Probation and/or Community
Corrections placement; and Track 3 is a sentence to the Department of Corrections. Level 1 consists
of no program intervention; Level 2 requires education class, 1/week; Level 3 is group therapy,1/week; Level 4 is intensive outpatient treatment (6-9 hours per week); Level 5 is inpatient treatment;
Level 6 is therapeutic community; and Level 7 calls for no treatment and an assessment for
psychopathy.
The Phase system is comprised of three phases plus graduation, each with different levels of courtcontact and supervision intensity. Phase I (90-120 days) requires the offender, among other things, tosubmit to a minimum of 8 urine screens per month (averaging 2/week), one court appearance permonth, and the completion of 25% of the community service hours. Supervision includes specific

23 Shannon Gaskill, letter to Kim English, August 5, 1998.
32
contact standards and a record check completed through the Denver Police Department, among otheractivities.
Phase II (90-120 days) requires the offender to submit to at least 4 urine screens monthly, to appear incourt monthly, to complete at least 50% of community service hours, and the case manager mustcomplete an LSI re-evaluation, among other activities.
Phase III requires the offender to submit to a urine screen on average every 3-4 weeks, to appear inCourt quarterly, to pay all court/supervision fees in full, and to fully complete the community servicework requirements. Another record check through the police department is completed, as is anotherLSI re-evaluation.
This evaluation study intended to tap these important aspects of the Drug Court programming, but
researchers were unable to locate assessment information (specifically, the Level of Supervision
Inventory [LSI] scores) and referral data in the paper files of the district from which the study datawere collected. This information is apparently available to the Court electronically and decisions are
made based on LSI information. Researchers were unable to tap this data source. This information
may link to outcome, however. According to Drug Court Coordinator Shannon Gaskill, "Based on
the existing phase system, an offender who experienced no decrease in the hourly level of supervisionover time would be considered a failure and would have the current probation track revoked."23
Organization and Focus of This ReportThe report is organized according to research questions. These questions were posed to assist in theunderstanding of how cases--and people--were processed in Denver before and after the inception ofthe Drug Court. Researchers compared a 20% sample of case file data from 1993 (the year before theDrug Court started) with a similar sample of case file data in 1995. Unless otherwise indicated, onlyconvicted cases were analyzed.
To help sort out if changes were Drug Court specific, or happening in Denver generally or happeningstatewide, we compared Denver District Court data with a 20% sample of cases selected from 8jurisdictions statewide. Depending on the research question, we compared drug and non-drug cases. Then, because program start-up activities are sometimes different from later years after the programbecomes institutionalized, we compared all the convicted Drug Court cases during the first quarter of1995 with all the convicted Drug Court cases processed during the first quarter of 1996. This lattercomparison unexpectedly reflected significant changes in type of drug charge, which likely reflectstrafficking patterns in the community more than any program features. This finding certainlyunderscores the necessity of collecting and analyzing multiple years of data to best understand both theprogram and the local context in which it operates.
INTRODUCTION TO THE RESEARCH RESULTS

24 Gaskill, ibid.
25 Drug Use Trends in Denver and Colorado, Alcohol and Drug Division, January 1998, p. 5.
33
It is common in the social sciences, and perhaps criminology in particular, to qualify empiricalfindings by enumerating the common problems of applied research, specifically, the larger social forces
affecting the data and researchers' inability to control (methodologically) for these factors. This is, in
fact, always the case. This research was undertaken in the context of significant urban change that
occurred in the City and County of Denver in the years just before and just after the inception of theDrug Court in 1994. Massive urban renewal projects were underway or had just been completed,
specifically the Coors baseball field and Elitch's Amusement Park.
These facilities attracted hundreds of thousands of people into areas that had been relatively ignored by
the public. Old warehouses were renovated into upscale lofts and commercial establishments withcompeting micro breweries took over areas of downtown that had for years been occupied by a
different kind of night crowd. Illegal activity, including open-air drug markets, were now highly
visible. Public outcry resulted in the creation of Police District 6 in Lower Downtown, and Weed and
Seed funding increased the number of officers on the street.24
Intelligence information from local police and DEA officials confirmed significant trafficking activities
in Denver by organizations in Mexico and Central America. In Drug Use Trends in Denver and
Colorado,25 we are informed that "In Denver, Mexican black tar is the exclusive type of heroin sold on
the streets. The distribution and sale of heroin continues to be dominated by Hondurans,Guatemalans, Nicaraguans, and Mexican nationals. Ethnographic interviews with heroin users on the
street indicate that most of the heroin comes from Mexico."
Mexican and Honduras nationals began appearing in Lower Downtown during early 1994, according
to Drug Court staff, perhaps drawn to some extent by the crowds visiting the new Coors Field andElitch Amusement Park facilities. Staff from the district attorney's office informed researchers they
were charging "substantial numbers of defendants" who listed Mexico or Honduras as their country of
birth and had few or no previous Denver addresses. In our data base, these cases will have been coded
as Hispanics having no or little residential stability and probably very little education.
In sum, the explosion of popular activity in downtown Denver, combined with new police resources
and perhaps new drug trafficking patterns, limit researchers' abilities to tie changes with case profiles
to the inception of the Drug Court alone.

34

26 Granfield, et al., Ibid.
35
Case processing time inother Denver courtsdecreased significantlyfor non-drug cases.
RESULTS Section 1: Have Case Processing Times Decreased?
Yes, case processing between offense/arrest and disposition significantly decreased. These findings
concur with those of Granfield, et al.26 These University of Denver researchers found that time from
arrest to sentencing was significantly lower for the Denver Drug Court compared to two pre-Drug
Court comparison cohort groups. The current study expands on the this by permitting comparisonsof processing times between drug cases in Drug Court and a sample of drug cases in Denver in 1993
(prior to the establishment of Drug Court), as well as a comparison processing times of
contemporaneous non-drug cases in Denver.
The results of this analysis show that Denver Drug Court decreased processing times compared to1993 drug cases between 10% and 37% on three measures. Two of these decreases are statistically
significant: offense to disposition and arrest to disposition.
Table 2. Denver Case Processing Time in Days1993 and 1995 Comparisons of Drug and Non-Drug Cases
CASE PROCESSINGAverage # of Days From
1993DRUG
1995DRUG
COURT
*=p<.001N.S.=NotSignificant
1993NON-DRUG
1995NON-DRUG
*=p<.001N.S.=NotSignificant
Offense to Disposition 169 106 * 265 192 *
Arrest to Disposition 163 109 * 167 132 *
Filing to Disposition 103 93 N.S. 129 88 *
Source: DCJ Court Data Base 1993 and 1995.
Case processing time in other Denver courts decreased significantly for non-drug cases as well. Between 1993 and 1995 case processing measures for non-drug cases in Denver decreased between
21% and 31% (p <.001 for all three measures). This issue will be discussed
in more detail in Section 7 which examines the possible impact of Drug
Court on other courts, but should be considered a positive impact of theDrug Court on other Denver district court dockets.

36

37
RESULTSSection 2: How Do the Profiles of Pre-drug Court (1993)and Drug Court (1995) Cases Compare?
Demographic Differences
Table 3. Comparison of Demographic Characteristics between 1993 Denver DrugCases and 1995 Denver Drug Court Cases
DEMOGRAPHIC DIFFERENCES
1993DENVER DRUG CASES
1995DENVER DRUG COURT
*=Chi SquareSignificance
at .05 or greater N.S.=Not Significant
% n % n
MalesFemales
85.7 14.3
15025
81.218.8
29067
N.S.
AngloBlackHispanic(Percentages based on 3ethnic groups only; remainingnumbers are <1% of n)
23.142.534.4
376855
21.635.942.5
75125148
N.S.
Ages<2425-3031-35>35
23.424.024.028.6
41424250
22.723.819.633.9
818570
121
N.S.
Reside Continuously for 2 yrsMoved 1-3 TimesMove 4+ Times or Transient(Transient was not an optionin 1993; moved 4+ times wasan option in both years)
33.154.512.3
518419
29.936.234.0
809791
*
SingleEver Married
52.547.5
8577
49.750.3
159161
N.S.
Employed Full TimeUnemployed/PT/Sporadic
38.761.3
6095
27.472.6
91241
*
8th Grade or LessSome High SchoolHigh SchoolGEDSome College or more
10.735.827.715.110.7
1757442417
20.228.121.811.418.6
6489693659
*
Note: Percents in tables are rounded and so may not exactly equal 100. Also, numbers of cases may vary because of missing data.
Several important differences emerged in the profile analysis of drug cases processed in Denver in 1993
compared to 1995. Table 3 reveals one demographic difference was statistically different by Chi
Square analysis: employment. A larger proportion of the 1995 sample (72.6% compared to 61.3% in
1993) was unemployed, employed part time, or employed sporadically. Conversely, the proportion of

27 Cohen (1986). Research on criminal careers: Frequency rates and offense seriousness. In Criminal Careers and Career Criminals,National Academy Press, Washington DC.
28 English, K. (1993). Self-Reported crime rates of women prisoners. Journal of Quantitative Criminology, 9, 357-382.
38
the sample employed full time decreased, from 38.7% in 1993 to 27.4% in 1995. This increase inunemployment is consistent with the residential stability and education factors discussed below.
Other differences revealed in Table 3, although not statistically significant by Chi Square analysis,
reflect considerable changes in the drug court cases in Denver between 1993 and 1995. In 1995
compared to 1993, drug cases included more females, more Hispanics (this increase disappears whenINS referrals are removed from the 1995 sample; see Figure One), older offenders, and almost three
times as many transients. Also, the size of the group with less than an 8th grade education doubled.
The transiency and education variables are linked to INS referrals (data not presented).
The increase in proportion of the sample comprised of women is consistent with trends statewide andnationally and represents an important criminal justice programming need. According to the
Department of Corrections 1995 annual report, the overall proportion of women sent to prison from
Denver County increased by 42.9% between 1990 and 1995, slightly more than the 40.5% increase in
the proportion of men during the same period (Table 19). The increase is particularly noticeablewhen only prison commitments for drug crimes are considered. In the same document, DOC reports
gender differences by crime type between 1994 and 1995 (Table 22). In 1994, 73 women and 502
men were committed to prison for a drug offense, compared to 94 women and 663 men in 1995.
This represents a one-year increase of 28.8% for women and 32.1% for men.
Comparing the Drug Court data with data from the Department of Corrections, it appears that there
is a slightly greater proportion of men compared to women committed to prison statewide for drug
offenses between 1994 and 1995 (see discussion in prior paragraph), while there is a greater proportion
of women compared to men sent to Drug Court between 1993 and 1995 (see Table 3). Are womensomewhat more vulnerable to arrest for drug crimes and slightly less vulnerable (than men) to prison
commitment?
The War on Drugs may disproportionately affect some groups participating in the drug trade. When
drugs are consumed openly, on the street, offenders are more likely to be detected and apprehended bylaw enforcement. These highly visible drug activities vary by ethnicity, social class, and residential
stability, and all of these factors vary with each other. Nevertheless, when drug crimes are committed
frequently, the probability for detection increases.27 Given these factors, some evidence exists that
women may be more vulnerable to arrest for drug crimes. In The Female Offender, Meda Chesney-
Lind cites research by the Colorado Division of Justice28 conducted on Colorado prisoners:
Recall the research by English (1993) on women's and men's self-reported drug selling, wherein shefound that female prisoners were much more likely than their male counterparts to report numerous
29 The Colorado Criminal History Score, developed by Dr. M. Mande in the mid-1980's, is an index derived from a weightedcombination of the following data items (weights shown in parentheses): number of juvenile adjudications (x.5); number of juvenileplacements in secure institutions (x1.0); number of prior adult felony convictions (x1.0); number of prior adult violent felonyconvictions (x1.5); number of adult probation revocations (x.75); and number of adult parole revocations (x2.0). Scores are addedand then collapsed to form a five-point scale ranging from 0-4, with 0 being the lowest and 4 being the highest. Scores arecollapsed into the following categories: 0=0, .001-1.25=1, 1.26-2.25=2, 2.26-3.25=3, 3.26-highest=4.
39
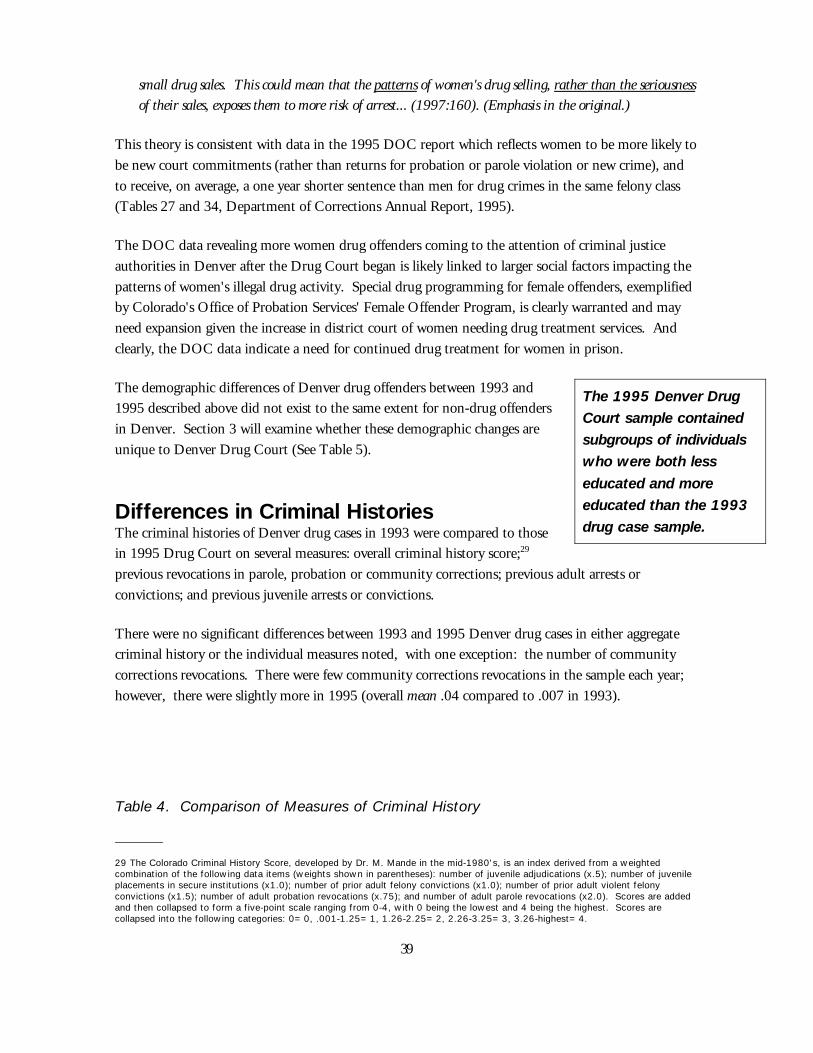
The 1995 Denver DrugCourt sample containedsubgroups of individualswho were both lesseducated and moreeducated than the 1993drug case sample.
small drug sales. This could mean that the patterns of women's drug selling, rather than the seriousnessof their sales, exposes them to more risk of arrest... (1997:160). (Emphasis in the original.)
This theory is consistent with data in the 1995 DOC report which reflects women to be more likely to
be new court commitments (rather than returns for probation or parole violation or new crime), and
to receive, on average, a one year shorter sentence than men for drug crimes in the same felony class(Tables 27 and 34, Department of Corrections Annual Report, 1995).
The DOC data revealing more women drug offenders coming to the attention of criminal justice
authorities in Denver after the Drug Court began is likely linked to larger social factors impacting the
patterns of women's illegal drug activity. Special drug programming for female offenders, exemplifiedby Colorado's Office of Probation Services' Female Offender Program, is clearly warranted and may
need expansion given the increase in district court of women needing drug treatment services. And
clearly, the DOC data indicate a need for continued drug treatment for women in prison.
The demographic differences of Denver drug offenders between 1993 and1995 described above did not exist to the same extent for non-drug offenders
in Denver. Section 3 will examine whether these demographic changes are
unique to Denver Drug Court (See Table 5).
Differences in Criminal HistoriesThe criminal histories of Denver drug cases in 1993 were compared to thosein 1995 Drug Court on several measures: overall criminal history score;29
previous revocations in parole, probation or community corrections; previous adult arrests or
convictions; and previous juvenile arrests or convictions.
There were no significant differences between 1993 and 1995 Denver drug cases in either aggregatecriminal history or the individual measures noted, with one exception: the number of community
corrections revocations. There were few community corrections revocations in the sample each year;
however, there were slightly more in 1995 (overall mean .04 compared to .007 in 1993).
Table 4. Comparison of Measures of Criminal History

40
1993 Denver Drug Convictions and 1995 Denver Drug Court Convictions
MEASURES OF CRIMINAL HISTORY
1993 DENVER DRUG CONVICTIONS
1995 DENVERDRUG COURT CONVICTIONS
SIGNIFICANCELEVEL*t-test
**Chi-Square
Mean n Mean n
Criminal History Score 1.51 174 1.35 353 N.S.
Adult Community CorrectionsRevocations
.007 155 .04 328 *.01
Adult Parole Revocations .03 155 .08 327 N.S.
Adult Probation Revocations (see note below)
.21 155 .16 323 N.S.
% Yes %Yes
Prior Adult Arrests 83.4 136 83.7 277 N.S.
Prior Adult Convictions 72.4 113 71.3 239 N.S.
Juvenile Arrests 17.6 27 17.0 51 N.S.
Juvenile Convictions 13.8 21 14.2 43 N.S.
Note: Small means for revocation measures indicate that most cases in the sample had zero revocations.
SummaryCompared to 1993, the profile of 1995 Drug Court cases was somewhat different demographically. The 1995 group tended to be more female, non-white and older than 1993 drug conviction cases.
Further, the Drug Court defendants were three times more likely to have moved in the two years prior
to arrest, and were less likely to be employed full time. The 1995 group also was different in terms of
educational level, with a subgroup of minimally educated individuals and a subgroup of individualswho attained relatively high levels of education. Both groups were similar in terms of criminal history.

30 As noted earlier in this report, the DCJ Court Data Base was used for comparisons of pre-Drug Court and Drug Court cases. DCJCourt Data is a systematic 20% sample of all cases filed in Denver and seven other jurisdictions in 1993 and 1995. Samplingprocedures were identical between 1993 and 1995. Thus, comparisons of changes between the two years in the number of drugcases collected in the sample reflect percentage changes in the total number of drug cases.
31 Denver is not unique in its experience of increased drug cases since the inception of Drug Court. Hennepin County Drug Court inMinneapolis, Minnesota, experienced a 47% increase in the number of drug filings between 1996 and 1997 (from a conversationwith Hennepin County Drug Court personnel).
41
The increase in drugcases in Denver is approximately threetimes larger than for drugcases outside of Denver.
RESULTSSection 3: How Do Trends in Denver Drug CasesCompare to Statewide and Local Trends? That Is, Are theNumber of Drug Cases in Denver Increasing? Are SomeDemographic Groups Growing More than Others? Are Any of These Trends Unique to Denver Drug Court, or DoThey Reflect Local or Statewide Changes?
The following analyses describes the overall percentage increase in Denver drug cases between 1993 and
1995 as well as the percentage increases in various demographic subgroups. This is another way to
view demographic differences in drug cases before and after Drug Court.
To understand whether changes reflect local trends, increases in non-drug Denver cases are examined.
To understand whether similar statewide trends exist, increases in drug and non-drug cases outside ofDenver are also examined.30
Are the Number of Drug Cases in Denver Increasing?Yes, the number of drug convictions in Denver has doubled between 1993 and 1995 (105%
increase).31 This increase in drug cases in Denver is approximately three times larger than for drug
cases outside of Denver, and is also much larger than increases of non-drugconvictions for both Denver and other jurisdictions. While drug convictions
have also increased outside of Denver, the increase has been much smaller
(32%). Similarly, non-drug convictions have also increased, both in Denver
and outside of Denver, but these increases are also much smaller (29% and15%, respectively).

42
Hispanic drug caseconvictions haveincreased more than theoverall increase in drugcases (169% comparedto the overall increase of105%). This increaseappears to be unique tothe Drug Court, reflectingin large part the arrest ofCentral Americannationals traffickingcocaine and heroin inDenver.
Table 5. Percentage Changes Between 1993 and 1995 Case ConvictionsDrug and Non-drug Cases, Denver and Non-Denver Cases
% CHANGES BETWEEN 1993 AND 1995 IN DRUG AND NON-DRUG CASE CONVICTIONSINSIDE AND OUTSIDE OF DENVER
DEMOGRAPHICCHARACTERISTICS
DENVER DRUG CASECONVICTIONS1993 n=1751995 n=358
DENVER NON-DRUGCASE CONVICTIONS
1993 n=5181995 n=667
NON-DENVER DRUGCASE CONVICTIONS
1993 n=3551995 n=469
NON-DENVER /NON-DRUG CASE
CONVICTIONS1993 n=20951995 n=2409
Overall Increase inCase Convictions
105% 29% 32% 15%
MalesFemales
93%168%
24%61%
31%34%
14%20%
AngloBlackHispanic
103%84%
169%
65%36%29%
53%5%
31%
25%14%15%
Age 18-2425-3031-35Over 35
98%102%67%
142%
7%32%40%43%
24%32%45%27%
1%5%
40%29%
Moved Less Than 3xMove 4x or Transient
31%379%
(17%)95%
(1%)140%
7%74%
SingleEver Married
87%109%
(16%)24%
37%33%
20%34%
Employed Full TimeUnemp/PT/Sporadic
52%154%
9%10%
29%52%
38%39%
<8th GradeSome HSHS GradGEDSome College or >
276%56%57%50%
247%
30%(18%)
11%(31%)
12%
65%11%49%12%68%
38%22%7%
25%77%
Are Some Demographic Groups IncreasingMore than Others?The overall increase in the percentage of Denver drug case convictionsbetween 1993 and 1995 does not occur equally across demographic groups, as
shown in Table 5. That is, certain demographic groups (Hispanics) have
experienced very large increases in cases convictions, while others (Blacks)
have experienced a relatively small increase. Most of the time this reflectseither statewide or local demographic trends, with the exception that Hispanic
drug case convictions have increased significantly more than the overall
increase in drug cases (169% compared to the overall increase of 105%), and
cannot be accounted for by changes in the general population. This increaseappears to be unique to the Drug Court, reflecting in large part the arrest of
Central American nationals trafficking cocaine and heroin in Denver.
Local Trends - An Increase in Female Case Convictions

43
Female convictionsincreased at twice therate of the overallincrease of non-drugconvictions in Denver(61% compared to29%). This trend is notapparent for either drugor non-drug cases injurisdictions outside ofDenver, suggestingsignificant genderdifferences in crime,arrest patterns and/orfelony case processing inthe 2nd Judicial District.
There is a striking increase in both drug and non-drug convictions for females in Denver. Convictions for females increased 168% compared to the overall increase in Drug Court cases of
105%. While the increase is lower for non-drug cases in Denver, female convictions increased at
twice the rate of the overall increase of non-drug convictions in Denver (61% compared to 29%).
This trend is not apparent for either drug or non-drug cases in jurisdictionsoutside of Denver, suggesting significant gender differences in crime, arrest
patterns or felony case processing in the 2nd Judicial District.
Statewide Trends - Increases in Case Convictions of Mobile andTransient IndividualsBetween 1993 and 1995, there was an increase in the size of the group that
moved four or more times in the 24 months prior to arrest in both the
statewide and Denver Drug Court samples. The number of Denver drug case
convictions who reported more than four moves in the past two yearsincreased at almost three times the overall rate of increase (379% compared to
105%). The increase in this mobile population for Denver non-drug case
convictions increased at a similar level (95% compared to an overall increase
of 29%). Comparable trends occur for drug and non-drug cases in otherjurisdictions. Thus, increases in case convictions of mobile and transient
persons reflect the changing demographics of the state’s population at risk of
arrest rather than a phenomenon unique to Denver or the Drug Court. This
is an important offender characteristic that needs to be considered statewideby program planners.
Statewide Trends - Increases in Two Educational GroupsAs previously discussed, there are increases in case convictions in Drug Court for two educational
groups: the minimally educated (8th grade or less) and the more highly educated (some college or
greater). Both groups increase at more than double the overall increase for Denver drug cases (276%
and 247% compared to 105%, respectively). This also appears to be a statewide trend (i.e.,jurisdictions outside of Denver) for drug and non-drug cases, but is not apparent for Denver non-drug
cases, suggesting that Drug Court cases are significantly reflecting this trend in Denver. This finding
has implications for Level Two cases who are referred for education only. Remedial programming may
be necessary for a growing proportion of drug cases.
Increases Unique to Denver Drug Court - More Hispanic Case ConvictionsThe significant increase in the proportion of Hispanic case convictions between 1993 and 1995appeared to be unique to the Denver Drug Court, but the difference disappeared when INS cases were
omitted from the analysis. For drug cases outside of Denver, for Denver cases when INS referrals are
omitted and for non-drug cases both inside and outside of Denver, the proportion of case convictions
for Anglos increased more than other ethnic groups. This finding is consistent with the overall ethnicdistribution in the state and is likely linked to the increased use and distribution of methamphetamine

44
in non-metro Denver Colorado. However, Hispanic Drug Court case activity is increasingdisproportionally.
Since the high proportion of Hispanic case convictions (including INS referrals) is unique to the
Denver Drug Court (169% compared to an overall increase of 105% across all ethnic groups), it is
important that court and program administrators, judges and policy makers better understand thispopulation. Table 6 below compares the sample of Hispanic drug convictions in 1993, before Drug
Court was initiated, with the sample of Hispanic drug convictions processed through the Denver Drug
Court in 1995 on several demographic variables. In particular, the 1995 Hispanic sample is
significantly more transient, unemployed, and uneducated than the 1993 Hispanic sample.
Table 6. Demographic Comparisons of Hispanic Case Convictions 1993 Denver Drug Cases and 1995 Drug Court Cases
(Comparisons of Marital Status andAge were not significant)
1993 DENVER DRUG CASES
1995 DENVER DRUG COURT CASES
SIGNIFICANCE LEVELSbased on Chi SquareN.S.=Not Significant
% n % n
MalesFemales
92.77.3
514
85.814.2
12721
N.S.*
Reside Continuously last 2 yearsMoved 1-3 TimesMoved 4+ Times or Transient(Transient was not an option in1993; moved 4+times was anoption in both years)
46.934.718.4
23179
26.127.945.9
293151
.002
Employed Full TimeUnemployed/PT/Sporadic
49.051.0
2526
26.973.1
3698
.004
8th Grade or LessSome High SchoolHigh SchoolGEDSome College or more
20.841.518.915.13.8
11221082
41.535.410.86.26.2
54461488
.03
* The lack of a finding of a statistical difference is likely due to the small number of women in the sample.
Convicted cases processed in the Drug Court in 1995, as mentioned previously, include 69 drug
offenders who pled guilty or no contest to felony drug crimes. Fifty (50) of these cases received
probation sentences and eight of these were ordered to serve jail time in addition to probation. The
remainder of the INS referrals (19) received prison sentences ranging from 18-96 months (9 of thesecases received 48 month sentences).
Approximately half (50.7%) of the drug offenders considered themselves transient (however 4.3%
reported currently residing at the same address for more than 24 months). Nearly one-third of the
transients (31.9%) were over the age of 30, and 70.4% reported completing less than 8 grades ofeducation. This group represents a subset of the Hispanic cases processed through the Drug Court in
1995 (Table 6) and described in the text below.

45
Given the description of 1995 INS-referred Hispanics, it is not surprising to find significantdifferences between the 1993 and 1995 Hispanics on other demographic characteristics. (Note that
the INS cases in 1993 could not be identified, so for both years, in Table 6, INS-referred cases remain
in the analysis.) No statistical differences were indicated for age and marital status (data not
presented). However, given the overall increase in females in Denver convictions between 1993 and1995 (see Table 5), it is of interest to note the increase in Hispanic females compared to Hispanic
males. The number of males increased by 149% between 1993 and 1995. Although the number of
female Hispanics convicted of drug charges in Denver in 1993 was very small (4), the overall increase
to 21 in 1995 is quite dramatic (425%).
Table 7 compares the criminal histories of Hispanics with drug convictions in Denver in 1993 and
1995, and no significant differences in criminal histories were found between these two samples. It is,
however, noteworthy that criminal histories of Hispanics in both years were lower than overall
criminal history scores for the entire samples in both 1993 and 1996 (see Table 4) on all measuresexcept for 1993 juvenile arrests and convictions. Thus, Hispanics made up the largest proportion of
drug convictions in 1995 Drug Court, and also ranked lowest on our measures of criminal history.
Table 7. Comparison of Criminal Histories - Hispanics Case Convictions1993 Denver Drug Cases and 1995 Denver Drug Court Cases
MEASURES OF CRIMINAL HISTORY
1993 DENVERDRUG CASES
1995 DENVERDRUG COURT CASES
SIGNIFICANCE LEVEL*t-test
**Chi-SquareN.S.=Not Significant
Mean n Mean n
Criminal History Score .93 54 .95 148 N.S.
Adult ComCor Revocations <.001(*) 52 .007(*) 130 N.S.
Adult Parole Revocations <.001(*) 52 .05(*) 130 N.S.
Adult Probation Revocations .10(*) 52 .11(*) 129 N.S.
% Yes
% Yes
Adult Arrests 69.2 36 71.0 93 N.S.
Adult Convictions 51.9 27 53.8 71 N.S.
Juvenile Arrests 17.6 9 10.7 13 N.S.
Juvenile Convictions 15.7 8 8.2 10 N.S.
(*) Small overall means for revocation measures indicate that most cases in the sample had zero revocations.
The following Table (INS Referrals) shows that nearly half (45.9%) of Hispanic cases in 1995 Denver
Drug Court were referred to the Immigration and Naturalization Service (INS). Unfortunately,information regarding referral to INS was not available in the 1993 DCJ court data base; however,
comparisons can be made to non-drug cases in Denver in 1995 as well as to drug cases in other areas

46
Hispanics made up thelargest proportion of drugconvictions in 1995 DrugCourt, and also rankedlowest on our measuresof criminal history. Thisis not surprising since45% of the Hispanicswere referred to INS andthey may not haveaccumulated a criminalhistory record in the U.S.
Hispanic offenders inDenver Drug Court wereover two times as likelyto receive an INS referralcompared to non-drugHispanic offenders inDenver (45.9%compared to 20.8%). This finding is consistentwith drug traffickingpatterns described earlierin this report.
of the state in 1995 to determine if referrals to INS of Hispanics is unique toDenver Drug Court. Indeed, Hispanic offenders in Denver Drug Court were
over two times as likely to receive an INS referral compared to non-drug
Hispanic offenders in Denver (45.9% compared to 20.8%).
The findings presented in Table 8 are consistent with the drug traffickingpatterns described earlier in this report. Urban renewal projects in LowerDowntown led to the establishment of Police District 6, and law enforcementdrug interdiction efforts may have "swept" many Central American nationalsinto Denver County's criminal justice system.
Table 8. Comparisons of Ethnicity of Case Convictions Referredto INS in1995 Denver Drug Court Cases, 1995 Denver Non-Drug Cases,1995 Non-Denver Drug Cases
REFERRALS TO INS 1995 DENVER DRUG COURT CASES
1995 DENVER NON-DRUG CASES
1995 NON-DENVERDRUG CASES
AngloBlackHispanic
0%<1%
45.9%
01
68
0%.6%5%
01
11
0%0%
20.8%
00
16
As previously discussed, Hispanic cases referred to INS described in thisreport have been convicted of a drug crime and sentenced to probation or
prison. Seventy-two percent (72.4%) were sentenced to probation and 27.5%
were sentenced to prison; 63.8% were unemployed at the point of arrest,
50.7% had moved 4 or more times in the past 24 months, and 70.4%reported an 8th grade or less education. This is a high-need group, indeed,
and this analysis underscores the need for Drug Court staff to continue their
efforts to assure bilingual services are made available to these offenders.

32 In Drug Court, deferred judgments require a guilty plea, generally to the primary charge, which is subject to withdrawal uponsuccessful completion of conditions which may include education, work, cognitive behavioral therapy, and treatment.
47
RESULTSSection 4: Are More Individuals Receiving DeferredJudgments (Track One) in Drug Court? Who Is Likely toReceive a Deferred Judgment in the Denver Drug Court?
The following table shows a dramatic increase in the proportion of deferred judgments granted asdispositions between 1993 and 1995 in Denver drug case convictions.32 There were few cases disposed
of as deferred judgments in the 1993 sample (11 cases reflecting only 6.3% of the sample), while in
1995 deferred judgments represent close to a quarter of the sample.
Table 9. Comparison of Dispositions1993 and 1995 Denver Drug Case Convictions
DISPOSITION 1993 DENVER DRUG CASE
CONVICTIONS
1995 DENVER DRUG COURT CASE
CONVICTIONS
INCREASE INDEFERRED
JUDGMENTS
% n % n
Deferred Judgments (Track One in 1995)
6.3 11 23.5 84 664%
Guilty/Nolo Plea/Guilty by Trial 93.7 164 76.5 273
Total 100% 175 100% 357
This finding suggests that the Drug Court did, indeed, operationalize new programming in theDenver District Court. Drug Court cases that received deferred judgements are Track One cases and,
as mentioned above, the proportion of drug cases receiving deferred judgements increased nearly four-
fold between 1993 and 1995. Deferred judgements are typically stipulated for cases that are less
serious in nature (79.8% were charged with possession, not sale, of drugs) and/or the offender hascommunity ties and little or no criminal history. Track One cases, when the LSI score is 17 or below,
may be granted an unsupervised term with limits set on travel and other freedoms.
The following analyses describe differences in demographics, criminal history, type of drug charge, andplacement for those receiving deferred judgments compared to those pleading guilty or found guilty by
the trial process. The 1993 sample was not included in the analysis due to the small number of cases.
Table 10. Demographic Comparisons 1995 Denver Drug Court

48
The subgroup of thosereceiving deferredjudgments in the 1995Drug Court caseconviction sample had asignificantly lower overallcriminal history score, aswell as significantlyfewer communitycorrections and parolerevocations compared tothose with guiltydispositions.
Deferred Judgments (Track One) and Guilty/Nolo Pleas/Guilty by Trial
DEMOGRAPHIC DIFFERENCES
1995 DENVER DRUG COURTDEFERRED JUDGMENTS
(TRACK ONE)
1995 DENVER DRUG COURTGUILTY/NOLO PLEAS/
GUILTY BY TRIAL
*=Chi Square Signat .05 or greater
N.S.=Not Significant
% n % n
MalesFemales
72.627.4
6123
83.916.1
22944
*
AngloBlackHispanic(Percentages based on 3ethnic groups only;remaining numbers are <1% of n)
34.629.635.8
282429
17.637.844.6
47101119
*
Ages<2425-3031-35>35
26.516.919.337.3
22141631
21.525.919.732.8
59715490
N.S.
Reside Continuously 2 yearsMoved 1-3 TimesMove 4+ TimesTransient
35.447.712.34.6
233183
28.132.58.4
31.0
57661763
<.001
SingleEver Married
52.048.0
3936
49.051.0
120125
N.S.
EmploymentFull TimeUnemployed/PT/Sporadic
37.362.7
3152
24.175.9
60189
*
8th Grade or LessSome High SchoolHigh SchoolGEDSome College or more
9.129.927.32.6
31.2
723212
24
23.827.520.014.214.6
5766483435
*
There were several significant demographic differences between individualsreceiving a deferred judgments and those pleading guilty or found guilty in
the trial process. The subgroup of deferred judgments included more
females, Anglos, and more individuals reporting higher residential
stability, full time employment and higher levels of education than personsreceiving guilty dispositions. These findings are consistent with the notion
that deferred judgements give a “second chance” to relatively stable
offenders with little or no criminal history.
As expected, the subgroup of those receiving deferred judgments in the1995 Drug Court case conviction sample had a significantly lower mean
overall criminal history score, as well as significantly fewer community
corrections and probation revocations compared to those with guilty
dispositions. The deferred judgment subgroup also faced fewer adultconvictions of any type and was significantly less likely to have had a prior

49
Persons receivingdeferred judgments hadfewer charges for heroinand more charges foramphetamines and otherdrugs. This group wasalso far more likely to becharged with simplepossession compared tothose pleading or foundguilty.
adult drug felony conviction in their background.
Table 11. Measures of Criminal HistoryComparisons of 1995 Deferred Judgments & 1995 Guilty/Nolo Pleas/Guilty by Trial
MEASURES OF CRIMINAL HISTORY 1995 DENVER DRUGDEFERRED JUDGMENTS
(TRACK ONE)
1995 DENVER DRUG COURTGUILTY/NOLO
PLEAS/GUILTY BY TRIAL
SIGNIFICANCELEVEL*t-test
**Chi-Square
% n % n
Criminal History Score (mean) (range 1-4) .58 84 1.58 269 *
Adult Community Corrections Revocations 0 82 .05(*) 246 <.001
Adult Parole Revocations 0 82 .10(*) 245 N.S.
Adult Probation Revocations .06(*) 80 .19(*) 243 *
% Yes % Yes
Adult Arrests 88.0 73 82.3 204 N.S.
Adult Convictions 61.4 51 74.6 188 **
Juvenile Arrests 16.5 13 17.2 38 N.S.
Juvenile Convictions 11.5 9 15.1 34 N.S.
Prior Adult Drug FelonyConvictions
8.9 7 25.7 55 **
(*) Small overall means for revocation measures indicate that most cases had no revocations in their criminal histories.
Table 12 below indicates that individuals receiving deferred judgments were somewhat less likely to
face heroin charges but somewhat more likely to face charges for amphetamines and other drugs. Cocaine and crack charges were similar for both deferred judgments and
guilty dispositions.
Salient differences were found between the two groups regarding type of crime
charged. A large proportion of persons with deferred judgments faced chargesof possession (79.8%) compared to less than half (48.5%) of those with guilty
dispositions. A relatively small percentage of deferred judgments were
charged with distribution, sale or possession with intent to sell (14.3%).
Almost half (49.2%) of all guilty dispositions faced these types of charges.
These differences in types of drug charges and criminal history are reflected in
the comparisons of placements for those with deferred judgments and those
pleading or found guilty in Table 13 below.
Table 12. Comparisons of Type of Drug Charge and Type ofCharge

50
1995 Deferred Judgments and 1995 Guilty/Nolo Plea/Guilty by Trial
TYPE OF DRUG CHARGED* 1995 DENVER DRUG COURTDEFERRED JUDGMENTS
(TRACK ONE)
1995 DENVER DRUG COURTGUILTY/NOLO PLEAS/
GUILTY BY TRIAL
% n % n
Crack/Cocaine 63.1 53 63.7 172
Amphetamines 9.5 8 3.3 9
Heroin 16.7 14 25.9 70
All Other Drugs 10.7 9 7.0 19
TYPE OF CHARGE* % n % n
Possession 79.8 67 48.5 131
Possession with Intent to Sell 9.5 8 24.4 66
Distribution/Sale 4.8 4 24.8 67
Cultivation/Rx Fraud/Use 6.0 5 2.2 6
* Note: Chi Square analyses for both drug charged and type of charge by disposition were significant at <.05. Attempts to isolatespecifically which drugs or charges were responsible for the significance levels were difficult to ascertain due to higher percentages inone category compensating for lower percentages in another category when specific drugs or charges were measured against allothers. The usefulness of the chart is more in terms of describing overall differences between deferred judgment and guiltydispositions rather than statistical comparisons of each drug and charge by every other drug or charge.
Table 13. Comparisons of Placement1995 Denver Drug Court Case ConvictionsDeferred Judgments and Guilty/Nolo Pleas/Guilty by Trial
PLACEMENT 1995 DENVER DRUG COURTDEFERRED JUDGMENTS
(TRACK ONE)
1995 DENVER DRUG COURTGUILTY/NOLO PLEAS/
GUILTY BY TRIAL
% n % n
Probation 94.0 79 48.1 124
Probation and Jail 4.8 4 7.4 19
ISP 0 0 9.7 25
Community Corrections 1.2 1 5.8 15
Prison 0 0 29.1 75
Most (94%) of the deferred judgments received probation supervision, compared to less than half(48.1%) of those with guilty dispositions. This is consistent with Drug Court programming regarding
Track One cases.
Summary

51
A comparison of 1993 and 1995 Denver drug convictions showed a dramatic increase in the numberof individuals receiving deferred judgments who were processed through the Denver Drug Court. The
subgroup of cases with deferred judgments included more females, Anglos and more individuals who
reported higher residential stability, full time employment and higher levels of education. As expected,
this subgroup also had much lower levels of criminal history compared to those who plead or werefound guilty. Persons receiving deferred judgments had fewer charges for heroin and more charges for
amphetamines and other drugs. This group was also far more likely to be charged with simple
possession compared to those pleading or found guilty, and it represents those programmed as Track
One cases in the Drug Court.

52

53
Important differencesrelating to type of druginvolvement were foundfor other demographiccharacteristics. Themost outstanding wereethnic differences in drugcharge.
RESULTSSection 5: Were There Differences Between 1993 and1995 in the Types of Drug Charges Issued, PerhapsSignifying Changing Trends in Drug Use?
The answer to the first part of this question is yes. In 1995, heroin charges increased nearly six-foldcompared to 1993 (23.7% compared to 4%) and, cocaine/crack charges decreased (63.6% compared
to 77.5% in 1993). Please see Table 14 below.
Table 14. Comparison of Type of Drug Charged in Denver between 1993 DrugCases and 1995 Drug Court Cases
TYPE OF DRUG CHARGE 1993 DENVER DRUG CASE CONVICTIONS
1995 DENVER DRUG COURT CASE
CONVICTIONS
% n % n
Cocaine/Crack 77.5 134 63.6 225
Marijuana 8.1 14 4.8 17
Hallucinogen 0 0 1.7 6
Stimulant(Including amphetamine/methamphetamine)
4.0 7 4.8 17
Depressant 5.2 9 .6 2
Heroin 4.0 7 23.7 84
Other 1.3 2 .8 3
For the purpose of developing both policy and programs, it is important to know what was driving
this changing trend. Table 15 below presents demographic characteristics in relation to type of drugcharged.
Clearly, in 1995, cocaine was the drug of choice (as measured by drug
charge), with a similar high level of involvement for both males and females
(approximately 64% of both males and females faced cocaine charges). Important differences relating to type of drug involvement were found for
other demographic characteristics. The most outstanding were ethnic
differences in drug charge. Black offenders almost always faced cocaine/crack
related charges (85.5%). Anglos were charged more evenly across the threedrug types, but tended to face cocaine/crack charges somewhat more
frequently. Hispanics were charged with crack/cocaine over half the time

54
Cocaine and crack wasthe drug of choice forboth females and males--even more so than in1995 compared to 1993(due to the lesserinfluence of heroin).
(57.8%), but they were also the leader in heroin charges, facing them almost a third of the time(32.7%). Hispanics referred to INS were charged equally with either cocaine or heroin crimes.
Table 15. 1995 Denver Drug Court Case ConvictionsDemographic Differences in Drug Charge
DEMOGRAPHICDIFFERENCES
COCAINE/CRACK
HEROIN OTHER (CombinesMarijuana,
Hallucinogen,Stimulant,
Depressant, &Other)
ROW TOTALSPercentages
Across 3 DrugTypes (Cocaine,
Heroin &Other= 100%)
SIGNIFICANCELEVEL
based onChi Square
% n % n % n % n
Male Female
63.863.6
18342
23.324.2
6716
12.912.1
378
100%100%
28766
N.S.
Anglo Black Hispanic
40.585.557.8
3010685
28.49.7
32.7
211248
31.14.89.5
236
14
100%100%100%
74124147
<.001
Ages<24 25-30 31-35 >35
67.970.665.755.0
53604666
20.523.521.426.7
16201532
11.55.9
12.918.3
959
22
100%100%100%100%
788570
120
N.S.
Reside ContinuouslyMoved <3xMoved 4x or >/Transient
67.572.254.4
547049
13.817.537.8
111734
18.810.37.8
15107
100%100%100%
809790
<.001
<8th Grade EducSome HSHSGEDSome College or >
50.068.269.172.269.5
3260472641
43.818.217.619.416.9
2816127
10
6.313.613.28.3
13.6
412938
100%100%100%100%100%
6488683659
.009
Employed Full TimeUnemp/Part Time/Sporadic
63.763.2
58151
19.824.7
1859
16.512.1
1529
100%100%
91239
N.S.
Individuals with minimal education (8th grade or less) and those who were residentially unstable faced
heroin charges more frequently than other demographic groups. These characteristics are linked to
INS referral.
The same analysis was performed with 1993 Denver drug cases (see Table 16
below). As noted earlier, there were far fewer charges for heroin, making
comparisons somewhat difficult because of the small numbers. Despite this,
several observations can still be made. Overall, cocaine and crack was thedrug of choice for both females and males--even more so than in 1995
compared to 1993 (due to the lesser influence of heroin). Cocaine and crack
was the drug of choice for blacks in 1993, as it was in 1995. The 1993 data
diverges from 1995 for Hispanics; in 1993, there was much moreinvolvement with crack and cocaine than in 1995. Again, this was likely due

55
to the relatively small amount of heroin charges in 1993 compared to 1995. Once again, the datasuggest a link between residential stability and heroin use. Those with high residential mobility or
transience faced heroin charges more often than those with a greater degree of residential stability
(although comparisons are based on very small numbers). Again, these characteristics link to
convicted cases referred to INS.
Table 16. 1993 Denver Drug Case ConvictionsDemographic Differences in Drug Charge
DEMOGRAPHICDIFFERENCES
COCAINE/CRACK
HEROIN OTHER(combinesmarijuana,
hallucinogen,stimulant,
depressant, &other)
ROW TOTALSPercentages
Across 3 DrugTypes (Cocaine,Heroin, & Other
=100%)
SIGNIFICANCELEVEL
based onChi Square
% n % n % n % n
Male Female
77.279.1
11519
4.04.2
61
18.816.7
284
100%100%
14924
N.S.
Anglo Black Hispanic
50.091.281.8
186245
2.82.95.5
123
47.25.9
12.7
1747
100%100%100%
366855
<.001
Ages<24 25-30 31-35 >35
87.585.469.070.0
35352935
2.52.44.86.0
1123
10.012.226.224.0
45
1112
100%100%100%100%
40414250
N.S.
Reside ContinuouslyMoved <3 xMove 4 x or >/Transient
80.474.473.7
416214
03.6
15.8
033
19.721.810.6
10182
100%100%100%
518319
.04
<8th Grade EducSome HSHSGEDSome College or >
88.284.272.769.675.0
1548321612
5.97.0
08.7
0
14020
5.98.8
27.321.725.0
15
1254
100%100%100%100%100%
1757442316
N.S.
Employed Full TimeUnemp/Part Time/Sporadic
79.775.5
4771
06.4
06
20.318.1
1217
100%100%
5994
N.S.
Section 3 described the finding that almost 46% of all Hispanics in Drug Court were referred to INS.
In this section we further examined the relationship among drug charge, referral to INS and ethnicity.
Table 17 below shows that over a third (36.9%) of heroin cases resulted in a referral to INS. However,this finding is linked to the finding presented earlier, indicating that almost half (45.6%) of drug cases
for Hispanics resulted in an INS referral. Almost all (30 out of 31) of the heroin cases resulting in an
INS referral are also Hispanic.

33 NCJRS (February 1998) National Trends in Drug Abuse: Trends in Heroin Drug Use. Pulse Check. (Available at http://ncjrs.org.)
56
INS referred heroin caseswere also linked to verylow education levels andtransience.
Table 17. 1995 Sample of Drug Court Case ConvictionsDrug Charge by Ethnicity and Referral to INS
DRUG CHARGE ANGLOREFERRED TO INS
BLACKREFERRED TO INS
HISPANICREFERRED TO INS
% OF DRUG TYPEREFERRED TO INS
# Yes # No # Yes # No # Yes # No
Cocaine/Crack 0 30 0 106 32 53 46.4%(32)
Heroin 0 21 1 11 30 18 44.9%(31)
All Other Drugs 0 23 0 6 5 9 8.7%(6)
In summary, in 1995 we see a different pattern of drug charges than two yearsprevious, with large increases in heroin charges. Further, this increase was
linked to several demographic characteristics. Hispanics and Anglos were
more likely to face heroin charges than blacks. There was a link between
ethnicity, heroin charges and referral to INS: almost all heroin cases referredto INS were also Hispanic. INS referred heroin cases were also linked to very
low education levels and transience.
The question remains as to whether this trend toward increased heroin charges appeared in other areas
of the state or was unique to Denver. We address this in the following section.
As reflected in Table 18 below, the proportion of cases charged with heroin-related activities between
1993 and 1995 remained stable outside of Denver (2% of all drug charges in 1993 and 3% in 1995).
This information should be viewed cautiously given the few cases falling in the category of heroin
charges each year. This suggests that the nearly six-fold increase in heroin cases in Denver between1993 and 1995 was remarkably different from drug case processing patterns in jurisdictions elsewhere
in the state. (It should be noted that heroin usage appears to be on the rise in other urban areas, e.g.,
El Paso, Chicago and New York.33)
Although heroin charges remained stable outside Denver, charges related to stimulant drugs (includingmethamphetamine and amphetamines) increased six-fold, from 4.8% of drug cases in 1993 to 29.6%
in 1995. Tables 19 and 20 below present the distribution of drug charges in 1993 and 1995 for
jurisdictions outside of Denver.

57
Table 18. Comparison of Type of Drug Charge1993 and 1995 Non-Denver Jurisdictions
DRUG CHARGE 1993 DRUG CASESNON-DENVER
1995 DRUG CASESNON-DENVER
SIGNIFICANCE LEVELbased on Chi Square
% n % n
Cocaine/Crack 65.9 232 43.7 201 <.001
Marijuana 15.3 54 16.3 75
Hallucinogenic 3.7 13 1.7 8
Stimulant 4.8 17 29.6 136
Depressant 7.1 25 1.3 6
Heroin 2.0 7 3.0 14
Other 1.1 4 4.3 20
Total 100% 352 100% 460
Table 19. Drug Charge Type by Jurisdiction Outside of Denver - 1993
DRUG CHARGETYPE
JEFFERSON ADAMS ARAPAHOE EL PASO MESA PUEBLO LARIMER WELD
% n % n % n % n % n % n % n % n
HeroinCocaine/CrackMarijuanaHallucinogenicStimulantDepressantOther
3.061.015.08.17.03.01.4
245116527
080.611.11.44.22.8
0
05881320
1.769.56.85.11.7
10.25.1
14143163
2.468.212.92.42.4
11.80
2581122
100
057.128.67.1
07.1
0
0841010
12.550.018.8
018.8
00
2830300
031.836.4
013.618.2
0
0780340
058.341.7
0000
0750000
Total 100 78 100 72 100 59 100 85 100 14 100 16 100 22 100 12
Table 20. Drug Charge Type by Jurisdiction Outside of Denver - 1995
DRUG CHARGETYPE
JEFFERSON ADAMS ARAPAHOE EL PASO MESA PUEBLO LARIMER WELD
% n % n % n % n % n % n % n % n
HeroinCocaine/CrackMarijuanaHallucinogenicStimulantDepressantOther
6.736.718.0
026.75.06.7
422110
1634
1.466.25.41.4
21.60
4.1
14941
1603
3.856.411.51.3
20.50
6.4
34491
1605
1.438.911.11.4
42.40.74.2
256162
6116
014.317.12.9
62.92.9
0
0561
2210
031.343.76.3
18.700
0571300
13.323.343.36.73.33.36.7
47
132112
056.539.1
04.3
00
01390100
Total 100 60 100 74 100 78 100 144 100 35 100 16 100 30 100 23
An in-depth analysis of drug use trends outside of Denver is beyond the scope of this report; however,comparison of the 1993 and 1995 data suggest two important findings that may be of interest to
policy makers. First, stimulant charges increased considerably in almost all jurisdictions outside of
Denver between 1993 and 1995. Second, the jurisdictions of El Paso and Mesa showed the most

58
Stimulant chargesincreased considerably in almost all jurisdictionsoutside of Denverbetween 1993 and1995.
pervasive charging of stimulants in 1995. It was the drug of choice (as measured by charge) in both El Paso and Mesa Counties, and use in these two jurisdictions was a major contributor to the finding
of increased involvement with stimulants outside of Denver in 1995. That is, over half (83 of 136) of
our sample of drug offenders facing charges for stimulants outside of Denver in 1995 were in these
two jurisdictions.
As noted above, the data used in this study are targeted to identifying drug
case processing in the Denver Drug Court and so cannot assist in explaining
why these trends may be occurring. As previously discussed, actual drug
trafficking and use patterns may be changing, arrest and charging practicesmay be changing, or these may be occurring in combination with other
factors. It is interesting to note that the proportion of Denver arrestees, both
adult and juvenile, testing positive for heroin did not increase during this
time period, (see Table 21 below ) suggesting that the heroin increaseobserved in Drug Court may reflect a population who was selling or
transporting the drug rather than using it. If this hypothesis were true, it may suggest the need for
Drug Court officials to augment substance abuse treatment with significant vocational training and
job placement programming.
Table 21. 1996 Denver Arrestees. Drug Use by Most Serious ChargeFor Each Charge, the Percentage of Arrestees Testing Positive for Each Drug*
MOSTSERIOUSCHARGE
ADULT MALES – % POSITIVE ADULT FEMALES – % POSITIVE JUVENILE MALES – % POSITIVE
(n) Cocaine Marij Opiates **AnyDrug
(n) Cocaine Marij Opiates **AnyDrug
(n) Cocaine Marij Opiates **AnyDrug
Homicide (3) 0 33 0 33 (1) 0 100 0 100 (3) 0 33 0 33
Sex Assault (14) 43 43 0 57 (0) n/a***
n/a n/a n/a (4) 0 75 0 75
Assault (111) 24 36 4 52 (49) 41 27 2 55 (13) 0 54 0 54
Robbery (11) 46 55 18 91 (2) 0 100 0 100 (20) 10 55 0 55
Burglary (37) 38 35 11 65 (1) 0 0 0 0 (10) 0 50 0 50
Theft (61) 38 41 5 66 (31) 48 36 3 74 (2) 0 100 0 100
MV Theft (39) 41 56 0 80 (4) 50 75 0 100 (26) 19 69 0 69
Weapons (25) 12 44 0 44 (2) 100 0 50 100 (25) 8 64 4 64
Drug Poss (287) 63 46 8 85 (60) 78 25 12 87 (7) 29 71 0 86
Drug Sale (12) 58 42 0 92 (6) 67 33 17 83 (0) n/a***
n/a n/a n/a
Other (284) 36 38 4 63 (260) 50 25 4 65 (108) 5 57 0 56
* Rows will not total 100%: An arrestee may test positive for more than one drug. Not all drugs tested for in the DUF sample are shown here.Note: Juvenile Female data not shown due to the small number of juvenile females arrested.** Any Drug = All drugs tested for in the DUF sample (cocaine, PCP, opiates, marijuana, amphetamines, methadone, Valium, Darvon, quaaludes, andbarbiturates).*** n/a indicates that no members of this age/gender group in the sample were charged with this crime.Source: Denver Drug Use Forecasting quarterly data, 1996. Colorado Division of Criminal Justice.

34 Increases in ISP are likely related to the expansion of the ISP program in 1995.
59
Drug Court placementpolicies facilitated one ofits purposes, i.e., toallow defendants theopportunity to participatein treatment by placingthem in less restrictivesettings.
RESULTSSection 6: What Is the Impact of Drug Court on PracticesSuch as Sentencing and Plea Bargaining?
Impact on Sentencing - PlacementsThis analysis looks at sentencing practices of both placements and length of sentence to see how DrugCourt practices have been operationalized in these two areas. According to data presented in Table 22
below, 1995 Drug Court convictions received different placements compared
to Denver drug convictions in 1993. In particular, there was significantly
greater emphasis on the combination of probation and jail as a sanction, anda ten-fold increase in intensive supervision probation (ISP) placements
(although the number of cases in the 1993 sample is only two, and so the
increase must be viewed with caution). Almost three-quarters (73.4%) of
Drug Court convictions received some type of probation placement(probation, probation and jail, and ISP) compared to 60.8% in 1993.34
Thus, Drug Court placement policies facilitated one of its purposes, i.e., to
allow defendants the opportunity to participate in treatment by placing them
in less restrictive settings.
The use of community corrections for drug offenders dropped by over 200% between 1993 and 1995.
This finding may be related to the fact that the probation department has specialized officers assigned
to the Drug Court, and this is not the case for community corrections. If policy makers and program
officials value the use of community corrections with Drug Court offenders, it may be necessary forcommunity correction administrators to coordinate with the Drug Court and, in particular, assign
specific case managers to work closely with the Drug Court team of professionals.
The use of prison declined by nearly two percentage points. This difference is not statistically
significant (p=.633, analysis not presented).

60
Table 22. Comparison of Sentence Placements for Convictions1993 Denver Drug Cases and 1995 Denver Drug Court Cases
PLACEMENTSSignificance Level forChi Square <.001
1993 DENVER DRUG CASES
1995 DENVER DRUG COURT CASES
% n % n
Probation 54.8 92 59.4 203
Probation & Jail 4.8 8 6.7 23
ISP 1.2 2 7.3 25
Community Corrections 15.5 26 4.7 16
Prison 23.8 40 21.9 75
Impact on Sentencing - Sentence LengthThe following table presents a number of comparisons so that Drug Court can be understood in termsof 1993 and 1995 sentencing practices for both drug and non-drug cases.
Table 23. Comparison of Sentence Lengths Drug Case Convictions: 1993 and 1995 Denver, 1993 and 1995 Non-Denver
SENTENCELENGTH
DRUG CASES
1993 DENVER
1995DENVER
DRUGCOURT
SIG.LEVEL
%CHANGE
1993NON-
DENVER
1995NON-
DENVER
SIG.LEVEL
%CHANGE
# of MonthsCommunityCorrections
38.6(27)
49.8(16)
N.S.** 29% 57.9(17)
49.0(45)
N.S. (15%)
# of MonthsProbation*
28.9(105)
33.9(256)
.001 17% 32.7(262)
32.8(339)
N.S. <1%
# of MonthsPrison
42.7(40)
54.6(75)
.019 28% 57.8(59)
76.0(65)
N.S. 31.5%
# of Days Jail
69.0(11)
51.8(39)
N.S.** 33% 70.6(67)
61.6(62)
N.S. (13%)
* Probation includes regular probation, ISP, and probation and jail.** Small sample size may affect statistical significance.
In 1995, average probation and prison sentence lengths for cases processed in the Denver Drug Court
were significantly longer compared to sentences applied in 1993 drug cases. This tendency towards
longer sentence lengths for drug cases was not evident outside of Denver (see Table 23 below), withthe exception of average prison sentences for drug offenders, which increased by 31.5%. Despite the
lack of statistical significance, this trend is worth noting. Outside of Denver, the average sentence
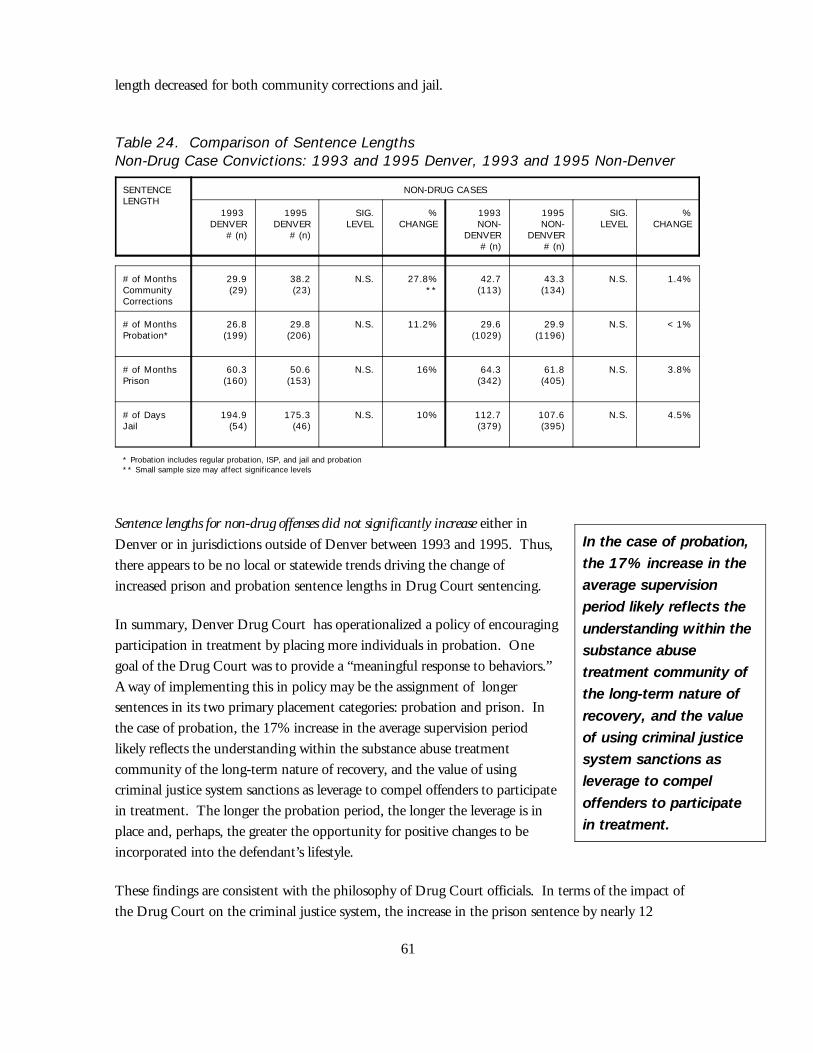
61
In the case of probation,the 17% increase in theaverage supervisionperiod likely reflects theunderstanding within thesubstance abusetreatment community ofthe long-term nature ofrecovery, and the valueof using criminal justicesystem sanctions asleverage to compeloffenders to participatein treatment.
length decreased for both community corrections and jail.
Table 24. Comparison of Sentence Lengths Non-Drug Case Convictions: 1993 and 1995 Denver, 1993 and 1995 Non-Denver
SENTENCELENGTH
NON-DRUG CASES
1993 DENVER
# (n)
1995 DENVER
# (n)
SIG.LEVEL
%CHANGE
1993NON-
DENVER# (n)
1995NON-
DENVER# (n)
SIG.LEVEL
%CHANGE
# of MonthsCommunityCorrections
29.9(29)
38.2(23)
N.S. 27.8%**
42.7(113)
43.3(134)
N.S. 1.4%
# of MonthsProbation*
26.8(199)
29.8(206)
N.S. 11.2% 29.6(1029)
29.9(1196)
N.S. <1%
# of MonthsPrison
60.3(160)
50.6(153)
N.S. 16% 64.3(342)
61.8(405)
N.S. 3.8%
# of DaysJail
194.9(54)
175.3(46)
N.S. 10% 112.7(379)
107.6(395)
N.S. 4.5%
* Probation includes regular probation, ISP, and jail and probation** Small sample size may affect significance levels
Sentence lengths for non-drug offenses did not significantly increase either in
Denver or in jurisdictions outside of Denver between 1993 and 1995. Thus,
there appears to be no local or statewide trends driving the change of
increased prison and probation sentence lengths in Drug Court sentencing.
In summary, Denver Drug Court has operationalized a policy of encouraging
participation in treatment by placing more individuals in probation. One
goal of the Drug Court was to provide a “meaningful response to behaviors.”
A way of implementing this in policy may be the assignment of longersentences in its two primary placement categories: probation and prison. In
the case of probation, the 17% increase in the average supervision period
likely reflects the understanding within the substance abuse treatment
community of the long-term nature of recovery, and the value of usingcriminal justice system sanctions as leverage to compel offenders to participate
in treatment. The longer the probation period, the longer the leverage is in
place and, perhaps, the greater the opportunity for positive changes to be
incorporated into the defendant’s lifestyle.
These findings are consistent with the philosophy of Drug Court officials. In terms of the impact of
the Drug Court on the criminal justice system, the increase in the prison sentence by nearly 12

62
Conviction crimes moreclosely matched crimecharges in Denver in1995 compared to 1993.
months likely offsets the value of the Drug Court for prison diversion purposes. As noted above, thedata reflect a 2% decrease in the proportion of drug cases sentenced to prison from Denver between
1993 and 1995, the first year of Drug Court operations. Additional information would be needed to
fully explore this issue, given that the calculation of the actual length of stay in prison includes earned
time and jail time credits.
Impact on Plea BargainingThe effect of Denver Drug Court on plea bargaining was examined in two ways. First, Table 25
below presents the sample distributions by type of drug for persons charged with a drug offense as the
first offense as well as the distributions of convictions for this group. It must be noted here that the
samples used for this analysis are different than the samples used in most of the report. Recall thatcase convictions are the basis for the analysis in this report (see Data Section in the beginning of the
report). Much of the data that are the focus of this report examine case processing of convicted cases.
Data are generally missing if the case did not proceed through the court process, i.e., if the case was
not filed or was dismissed. In 1995, Drug Court shows 165 of the 529 cases in the sample havedispositions noted as “no charges filed.” This is reflected in Table 25 below, where 1995 Denver Drug
Court convictions identify 34% of cases for which a paper file was opened due to an arrest but lacked
sufficient evidence for prosecution (or was otherwise deemed unsuitable for court action). This is a
procedure that typically occurs in County Court, but because the Drug Court is self-contained to fast-track cases, a file is opened – and quickly closed – in a matter of days when it is an inappropriate case
for prosecution. Most of the remaining group is our sample of case convictions used elsewhere in the
report.
The information presented in Table 25 suggests that conviction crimes more closely matched crimecharges in Denver in 1995 compared to 1993. Of particular note in 1993 was the apparent shift from
crack/cocaine charges to lesser drugs (78% charges compared to 13.8%
convictions), while marijuana, hallucinogenic and depressants, in particular,
had higher percentages of convictions than charges. On the other hand, the1995 Denver data show that the percentage of heroin convictions (11.5%)
was only half that of heroin charges (21.2%), but this is consistent with the
finding that 45% of heroin cases were referred to INS (discussed later).
Outside of Denver, the 1993 data also show a general shift down between charge and conviction tolesser drugs. In particular, there were 2.5 cocaine/crack charges for every conviction (65.5% to
26.5%) and 3.5 convictions for depressants for every charge (6.8% to 23.7%). There was greater
consistency outside Denver in 1995 in the distributions of drug charges and convictions; however,
convictions for lesser charges were also apparent. For example, there were over 1.5 cocaine/crackcharges for each conviction (43.2% to 26.3%) outside of Denver in 1995.

63
Table 25. Sample Distributions of Charges and Convictions by Type of Drug1993 Denver Drug, 1995 Denver Drug, 1993 Non-Denver Drug, 1995 Non-Denver Drug
TYPE OF DRUGCHARGED
DRUG CHARGES AND CONVICTIONS
1993 DENVER DRUG
1995 DENVER DRUG COURT
1993 NON-DENVERDRUG
1995 NON-DENVERDRUG
Chargen=196
%
Convictn=196
%
Chargen=519
%
Convictn=519
%
Chargen=426
%
Convictn=426
%
Chargen=542
%
Convictn=542
%
None 12.7 34.0 19.0 16.2
Cocaine/Crack 78.0 13.8 64.5 41.5 65.5 26.5 43.4 26.4
Marijuana 7.6 10.7 4.6 5.9 15.0 15.5 14.4 18.1
Hallucinogenic .5 9.2 1.9 1.3 4.3 9.9 1.8 3.3
Stimulant 3.6 3.0 5.6 3.2 5.6 3.3 31.9 20.1
Depressant 5.6 48.5 1.2 .4 6.8 23.7 1.3 1.3
Heroin 3.6 .5 21.6 11.5 2.1 1.2 3.1 3.5
Other 1.0 1.0 .6 2.0 .7 .9 4.1 10.7
Total 100% 100% 100% 100% 100% 100% 100% 100%
While Table 25 above presents the distributions of charges and convictions for the entire sample, Table 26 below presents a comparison of drug charge to conviction by case, for convictions only, and
calculates the percentage of individuals with drug charges and convictions that were the same.
Likewise, the percentage of individuals for whom drug charge and conviction were different is also
presented. When the drug charge and conviction do not match, the conviction was for a lesser drug--for instance, a cocaine charge may result in a conviction for a depressant drug.
In 1995 Denver drug charges matched convictions more frequently than in 1993. Drug charges
matched convictions outside of Denver more frequently in 1995 as well, indicating statewide trend of
convictions reflecting charges. Denver seems to have made greater gains in consistency, since the gapthat existed between charge and conviction prior to the establishment of Drug Court was larger
compared to areas outside of Denver. (For example, in 1993, only 20.9% of persons charged with
cocaine/crack were convicted of cocaine crack.) In 1995, this number increased to 92%. For drug
cases outside of Denver in 1993, 50% of cases convicted of cocaine/crack matched charges, with thenumber increasing to 70.5% in 1995. In addition to changes in plea practices, improvements in
evidentiary procedures and arrest practices could account for these differences over time.
Table 26. Match Between Drug Charge and Conviction Comparisons of Four Groups: 1993 Denver Drug Cases, 1995 Denver Drug CourtCases, 1993 Non-Denver Drug Cases, 1995 Non-Denver Drug Cases
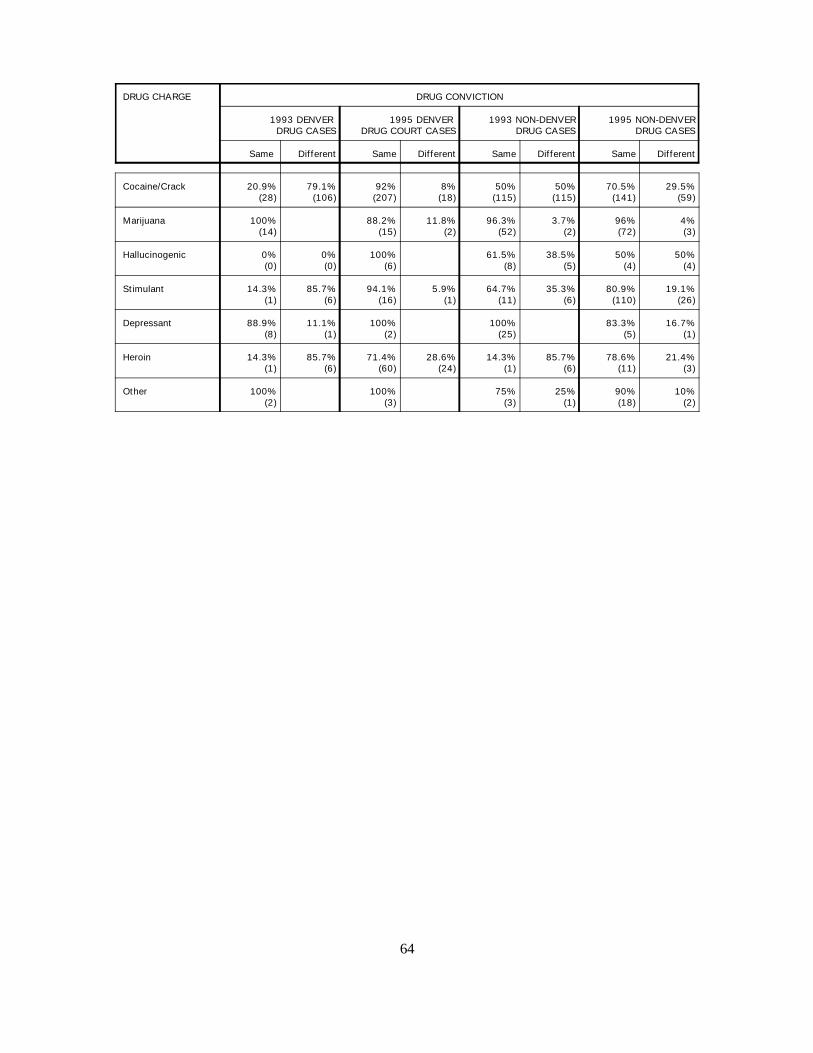
64
DRUG CHARGE DRUG CONVICTION
1993 DENVER DRUG CASES
1995 DENVER DRUG COURT CASES
1993 NON-DENVERDRUG CASES
1995 NON-DENVERDRUG CASES
Same Different Same Different Same Different Same Different
Cocaine/Crack 20.9%(28)
79.1%(106)
92%(207)
8%(18)
50%(115)
50%(115)
70.5%(141)
29.5%(59)
Marijuana 100%(14)
88.2%(15)
11.8%(2)
96.3%(52)
3.7%(2)
96%(72)
4%(3)
Hallucinogenic 0%(0)
0%(0)
100%(6)
61.5%(8)
38.5%(5)
50%(4)
50%(4)
Stimulant 14.3%(1)
85.7%(6)
94.1%(16)
5.9%(1)
64.7%(11)
35.3%(6)
80.9%(110)
19.1%(26)
Depressant 88.9%(8)
11.1%(1)
100%(2)
100%(25)
83.3%(5)
16.7%(1)
Heroin 14.3%(1)
85.7%(6)
71.4%(60)
28.6%(24)
14.3%(1)
85.7%(6)
78.6%(11)
21.4%(3)
Other 100%(2)
100%(3)
75%(3)
25%(1)
90%(18)
10%(2)

65
Case processing timesimproved in 1995Denver Drug Courtcompared to 1993Denver drug cases. Jurisdictions outside ofDenver did not show thesame trend of shorterprocessing timesbetween 1993 and 1995for either drug or non-drug cases. This findingsuggests the Drug Courtfacilitated caseprocessing in the otherDenver courtrooms.
RESULTSSection 7: Has Drug Court Had an Impact on CaseProcessing in Other Denver Courts?
Case ProcessingDenver Drug Court was developed in part to address the issue of overcrowded court rooms. It wasanticipated that handling drug cases in a separate court room, and moving them through the system
more quickly, would alleviate some of the burden in other courts. As reported at the beginning of this
report, (Table 2), case processing times improved in 1995 Denver Drug Court compared to 1993
Denver drug cases. There was also considerable improvement between 1993 and 1995 in caseprocessing times in other Denver courts handling non-drug cases. This is an important finding
suggesting that the creation of the Drug Court facilitated faster case processing in the other
courtrooms.
Court data for jurisdictions outside of Denver were examined to determine whether the trend ofshorter processing times occurred between 1993 and 1995 for either drug or non-drug cases.
Table 27. Jurisdictions Outside of Denver OnlyCase Processing: 1993 and 1995 Comparisons of Drug and Non-Drug Cases
CASE PROCESSINGAverage # of Days
1993 DRUG
1995 DRUG
1993NON-DRUG
1995NON-DRUG
Offense to Disposition 258 266 281 304
Arrest to Disposition 204 222 184 188
Filing to Disposition 147 156 138 135
Jurisdictions outside of Denver did not show the same trend of shorter
processing times between 1993 and 1995 for either drug or non-drug cases.
In fact, outside of Denver, drug case processing times were somewhat longeron all three measures in 1995; non-drug cases were somewhat longer on two
measures.

66

67
Processing timesimproved in 1996, andimprovements werestatistically significant onall three measures.
1996 cases reflect moreresidential stability (35%residing in the sameresidence for two yearsin 1996 compared to26.7% in 1995) andmore full timeemployment (34% in1996 compared to 23%in 1995).
RESULTSSection 8: How Did the Denver Drug Court Changebetween 1995 and 1996?
The DCJ undertook a special data collection of the total population of DrugCourt Cases for the first three months in 1995 and the first three months in
1996 (see Data Section at the beginning of this report). These data were used
to determine if changes occurred in Denver Drug Court regarding case
processing, other court practices, or other variables between 1995 (about 6months after Drug Court began) and 1996, approximately one and one-half
years after the program was established.
Case Processing TimesCase processing times for 1995 and 1996 were compared to determine if improvements could be noted
after the program was well-established.
Table 28. Comparison of Case ProcessingDenver Drug Court 1995 and 1996
CASE PROCESSING# of Days From
DENVER DRUG COURTJan-Mar 1995
DENVER DRUG COURTJan-Mar 1996
* = p.<.05
Offense to Disposition 96.8 81.9 *
Arrest to Disposition 93.8 80.8 *
Filing to Disposition 87.4 77.0 *
Indeed, processing times improved in 1996, and improvements were
statistically significant on all three measures. This may reflect improvements
in operations and team functioning over the course of the program, the fact
the judge participating in the court changed between 1995 and 1996, that theDrug Court may now be more “institutionalized” as part of the criminal
justice system, or a combination of these factors.
DemographicsDemographic characteristics of cases in the 1995 and 1996 Denver Drug
Court groups were examined (see Table 29 below) and found to bestatistically similar with two important exceptions: 1996 cases reflect more
residential stability (35% residing in the same residence for two years in 1996

68
compared to 26.7% in 1995) and more full time employment (34% in 1996 compared to 23% in1995). Thus, the trends noted in the earlier analysis comparing 1993 and 1995 Denver drug cases,
were somewhat diminished in comparisons of 1995 and 1996 Denver Drug Court data. In 1996,
however, there was still a relatively large proportion of individuals reporting that they moved more
than four times in the last two year or that they were transient (28% for each category). Also, theproportion of the 1996 group that completed high school increased from 14.9% to 21.6%.
Table 29. Demographic ComparisonsDenver Drug Court 1995 and 1996
DEMOGRAPHIC DIFFERENCES
1995 DENVER DRUG COURT CASES
1996 DENVER DRUG COURT CASES
SIGNIFICANCE LEVEL*=Chi Square Sig.
at <.05 N.S.=Not Significant
% n % n
MalesFemales
82.417.6
39885
81.418.6
33276
N.S.
AngloBlackHispanic(Percentages based on 3ethnic groups only;remaining numbers are <1%of n)
23.230.546.2
111146221
22.431.346.3
90126186
N.S.
Ages<2425-3031-35>35
26.926.718.428.1
13012989
136
27.723.014.734.6
1139460
141
N.S.
Reside Continuously 2 yearsMoved 1-3 TimesMove 4+ TimesTransient
26.736.96.7
29.6
9913725
110
35.336.87.0
21.0
1161212369
*
SingleEver Married
48.951.1
220230
49.250.8
188194
N.S.
Employed Full TimeUnemployed/PT/Sporadic
22.977.1
105353
34.066.0
132256
*
8th Grade or LessSome High SchoolHigh School GraduateGEDSome College or More
22.730.314.912.419.7
99132655486
19.531.121.68.7
19.2
74118823373
N.S.
Changes in Criminal HistoriesThe criminal histories of drug cases in 1995 Drug Court were very similar to those in 1996 Drug
Court. The 1996 Drug Court group had a history of more community corrections revocations (.08
compared to .03 in 1995). Thus, the same trend noted in the comparison of 1993 Denver drug casesto 1995 Denver Drug Court continued to appear in the 1996 data.
Table 30. Comparisons of Criminal History Measures

69
Previous analysesrevealed a dramaticincrease in the number ofHispanic drug caseconvictions in Denver between 1993 and1995. This patterncontinued in the 1996Drug Court data group,although the group wasmore likely to beemployed full time andbe residentially stable.
1995 Denver Drug Court and 1996 Denver Drug Court
MEASURES OF CRIMINAL HISTORY
1995 DENVER DRUG COURT CASES
1996 DENVER DRUG COURT CASES
SIGNIFICANCELEVEL*t-test
**Chi-SquareN.S.=Not Significant
Mean n Mean n
Criminal History Score 1.32 471 1.35 394 N.S.
Adult Community CorrectionsRevocations
.03 428 .08 382 .01*
Adult Parole Revocations .07 428 .07 381 N.S.
Adult Probation Revocations .13 425 .16 377 N.S.
%Yes %Yes
Adult Arrests 81.1 361 79.9 306 N.S.
Adult Convictions 68.3 302 69.8 270 N.S.
Juvenile Arrests 19.9 82 20.2 73 N.S.
Juvenile Convictions 13.7 57 16.6 61 N.S.
Note: The small means in revocation figures reflect the fact that most individuals had zero revocations.
Changes in Hispanic Case ConvictionsPrevious analyses revealed a dramatic increase in the number of Hispanic drugcase convictions in Denver between 1993 and 1995. Table 29 above
(demographic comparisons) indicates that this pattern continued in the 1996
Drug Court data group. Table 31 below examines selected demographic
characteristics of Hispanics to determine whether any changes occurredwithin this group between 1995 and 1996.
As with the general demographic trends presented earlier in Table 29,
Hispanics in Drug Court appeared somewhat more stable residentially in
1996, (although the number indicating they are transient remained relativelyhigh at 32%). Significantly more Hispanics also reported being employed full
time in 1996. Other characteristics remained the same (data not presented).

70
There were about a thirdfewer heroin charges in1996 compared to 1995.There were morecocaine/crack chargesand more marijuanacharges in 1996compared to 1995.
Table 31. Selected Demographic ComparisonsHispanic Case Convictions, Drug Court 1995 and Drug Court 1996
DEMOGRAPHIC DIFFERENCES(Comparisons of Gender,Marital Status, Age, andEducation were not significant)
1995 DENVER DRUG COURT CASES
1996 DENVER DRUG COURT CASES
SIGNIFICANCE LEVELSbased on Chi Square
*=<.05
% n % n
Reside Continuously 2 yearsMoved 1-3 TimesMoved 4+ Times Transient
19.327.55.3
48.0
33479
82
29.333.35.3
32.0
44508
48
*
Employed Full TimeUnemployed/PT/Sporadic
14.086.0
28172
37.162.9
65110
*
Changes in Referrals to INSTable 32 below shows that there continued to be a large proportion (40.5%) of referrals of HispanicDrug Court cases to INS from 1996 Drug Court.
Table 32. Referrals to INS by Ethnic GroupComparison of 1995 and 1996 Denver Drug Court Cases
PROPORTION OF ETHNICGROUPS REFERRED TO INS
1995 DENVERDRUG COURT CASES
1996 DENVERDRUG COURT CASES
% n % n
AngloBlackHispanic
1.8%<1%
44.8%
21
99
1.1%1.6%
40.5%
12
75
Changes in Drug ChargesThe distribution by type of drug charge changed between 1995 and 1996
(Table 33). There were about a third fewer heroin charges (16.9% in 1996
compared to 26% in 1995) and more cocaine/crack charges (67.4% in 1996compared to 59.9% in 1995). There were also more charges for marijuana
(8.1% in 1996 compared to 4.5% in 1995). It is difficult to explain these
important differences in the 1995 and 1996 samples. The decrease in heroin
cases could reflect an anomaly in either of the samples, or it could reflectdifferences in street-level drug activity, law enforcement practices or both. It
could also reflect INS deportation strategies and the possible removal of
organized heroin distribution activities. Finally, it could reflect seasonality:
the 1995-96 comparison includes all Drug Court cases convicted in January,February and March of each year.
Table 33. Comparison of Drug Charges

71
While Hispanics remainedthe ethnic group mostlikely to be involved inheroin, this percentagedecreased by almost halfbetween 1995 (47.1%)and 1996 (24.2%). Thisdecrease explains theoverall decline in heroincharges.
Denver Drug Court Cases 1995 and 1996
TYPE OF DRUG CHARGE
DENVER DRUG COURTALL CASES
Jan-March 1995
DENVER DRUG COURTALL CASES
Jan-March 1996
SIGNIFICANCE LEVELSbased on Chi Square (*)
% n % n
Cocaine/Crack 59.9 290 67.4 275 .020
Marijuana 4.5 22 8.1 33 .028
Hallucinogen 2.1 10 2.0 8 (Not Calculated)
Stimulant(Including amphetamine/methamphetamine)
5.4 26 3.7 15 (Not Calculated)
Depressant .6 3 .5 2 (Not Calculated)
Heroin 26.0 126 16.9 69 .001
Other 1.4 7 1.5 6 (Not Calculated)
(*) Significance levels represent the results of individual comparisons (not presented) of cocaine/crack by all other drugs, marijuana by all otherdrugs and heroin by all other drugs. Chi squares were not calculated for hallucinogens, stimulants, or depressants compared to other drugs dueto small n size.
Drug involvement (as measured by drug charge) was also examined in relation to demographics. Thisanalysis attempts to discern which demographic groups are responsible for the shift in the distribution
of drug charges between 1995 and 1996 Denver Drug Court. Table 34 below illustrates several
outstanding differences among demographic groups relating to drug involvement.
As in the comparison of 1993 and 1995 Denver drug charges (see Tables 15 and 16), demographicdifferences relating to type of drug involvement (as measured by drug charge) were evident in the 1996
Denver Drug Court data. Ethnic differences were the most apparent, as they were in that earlier
analysis. Cocaine/crack continued to be the drug of choice for blacks. While
Hispanics were charged with cocaine/crack over two-thirds of the time, theywere also the ethnic group where heroin charges appeared most frequently. A
comparison between Table 34 below (1996 Drug Court) and Table 35 below
(1995 Drug Court) shows that while Hispanics remained the ethnic group
most involved in heroin, this percentage decreased by almost half between1995 (47.1%) and 1996 (24.2%). This decrease explains the overall decline
in heroin charges evident in Table 34 below. Another interesting comparison
between 1995 and 1996 Denver Drug Court charges was the shift in female
preferences for heroin. Although the numbers of females using heroin wasquite small (and thus should be viewed with caution), the percentage of
females charged with heroin in 1996 (9.2%) was half that charged in 1995
(18.8%).

72
Table 34. 1996 Denver Drug CourtDemographic Differences in Drug Charge
DEMOGRAPHICDIFFERENCES
COCAINE/CRACK HEROIN OTHER (combinesmarijuana,
hallucinogen,stimulant,
depressant, &other)
ROW TOTALSPercentages across
3 drug types(Cocaine, Heroin, &
Other=100%)
SIGNIFICANCELEVEL
based on ChiSquare
N.S.=NotSignificant
% n % n % n % n
Male Female
67.567.1
22451
18.79.2
627
13.923.7
4618
100%100%
33276
.028
Anglo Black Hispanic
46.786.564.5
42109120
20.04.8
24.2
186
45
33.38.7
11.3
301121
100%100%100%
90126186
<.001
Ages<24 25-30 31-35 >35
69.068.175.062.4
78644588
15.013.810.023.4
17136
33
15.918.115.014.2
18179
20
100%100%100%100%
1139460
141
N.S.
Reside ContinuouslyMoved <3xMoved 4x or >Transient
70.773.682.650.7
82891935
11.213.28.7
40.6
13162
28
18.113.28.78.7
211626
100%100%100%100%
1161212369
<.001
<8th Grade EducSome HSHSGEDSome College or >
59.573.779.381.854.8
4487652740
24.312.78.56.1
20.5
181572
15
16.213.612.212.124.7
1216104
18
100%100%100%100%100%
74118823373
.008
Employed Full TimeUnemp/PT/Sporadic
65.970.3
87180
13.616.8
1843
20.512.9
2733
100%100%
132256
N.S.
As in the comparisons between 1993 and 1995 Denver drug cases, heroin use was more prevalent inindividuals who reported transience or minimal education (8th grade or less). However, these groups
were much smaller in 1996 Denver Drug Court compared to 1995.
Table 36 which follows shows that while a high percentage of heroin charges were referred to INS in
1996 (39%), this figure was lower than the percentage referred in the 1995 Drug Court sample(48.8%). Further, the relationship between heroin charges, INS referral and ethnicity were
intertwined. All those who were both charged with heroin and referred to INS were also Hispanic.

73
Table 35. Type of Drug Charged by Demographic Characteristics 1995 Denver Drug Court
DRUG CHARGE COCAINE/CRACK
HEROIN OTHER(combinesmarijuana,
hallucinogen,stimulant,
depressant, &other)
ROW TOTALSPercentages across
3 Drug Types(Cocaine, Heroin, &
Other=100%)
SIGNIFICANCELEVEL
based onChi SquareN.S.=NotSignificant
% n % n % n % n
Male Female
59.363.5
23654
27.418.8
10916
13.317.6
5315
100%100%
39885
N.S.
Anglo Black Hispanic
41.497.345.2
46142100
16.22.1
47.1
183
104
42.3.7
7.7
471
17
100%100%100%
111146221
<.001
Ages<24 25-30 31-35 >35
57.755.868.560.3
75726182
28.529.518.025.7
37381635
13.814.713.514.0
18191219
100%100%100%100%
13012989
136
N.S.
Reside ContinuouslyMoved <3xMove 4x or >Transient
76.863.580.037.3
76872041
12.115.312.057.3
12213
63
11.121.28.05.5
112926
100%100%100%100%
9913725
110
<.001
<8th Grade EducSome HSHSGEDSome College or >
35.474.261.574.164.0
3598404055
59.615.920.013.010.5
59211379
5.19.8
18.513.025.6
513127
22
100%100%100%100%100%
99132655486
<.001
Employed Full TimeUnemployed/PT/Sporadic
61.960.1
65212
15.228.9
16102
22.911.0
2439
100%100%
105353
<.001
Table 36. 1995 and 1996 Drug Court SamplesDrug Charge by Ethnicity and Referral to INS
DRUGCHARGE
ANGLO BLACK HISPANIC % OF DRUGTYPE
REFERREDTO INS
Referred to INS Referred to INS Referred to INS
#Yes # No #Yes # No #Yes # No
1995 DENVER DRUG COURT SAMPLE
Cocaine/Crack 2 44 1 141 33 67 12.5% (36)
Heroin 0 18 0 3 61 43 48.8% (61)
All Other Drugs 0 47 0 1 5 12 7.6% (05)
1996 DENVER DRUG COURT SAMPLE
Cocaine/Crack 1 41 1 108 39 80 15.2% (41)
Heroin 0 18 0 6 27 18 39% (27)
All Other Drugs 0 30 1 10 9 12 16% (10)

74
Changes in Placements
Table 37. Comparisons of Placements Denver Drug Court, 1995 and 1996
PLACEMENTS DENVER DRUG COURTJan-March 1995
DENVER DRUG COURTJan-March 1996
% n % n
Probation 61.5 276 56.2 208
Probation & Jail 7.8 35 4.9 18
ISP 5.3 24 12.7 47
Community Corrections 8.0 36 3.5 13
Prison 17.4 78 22.7 84
There were shifts in type of placement used in Drug Court between 1995 and 1996. The primaryplacement for Drug Court cases was probation; almost 75% received some type of probation in each
year (probation, probation and jail or ISP). However, a shift to more restrictive probation occurred
with the 1996 group: the percentage of individuals in ISP doubled (5.3% in 1995 to 12.7% in 1996).
Similarly, in 1996, more cases received a prison placement compared to a less restrictive communitycorrections placement. These shifts may reflect new judicial practices within the program. The shift
to a stricter probation placement may also be more in line with the Drug Court’s goal of closer
supervision. Experience may have shown a relationship between success and more intense supervision
for some individuals.
Changes in Sentence Length
Table 38. Comparison of Sentence LengthDenver Drug Court 1995 and 1996
SENTENCELENGTH
DENVER DRUG COURT CASES
DENVER DRUG COURTJan-Mar 1995
DENVER DRUG COURTJan-Mar 1996
% CHANGE
Average # of Months Community Corrections
56.7(37)
53.8(16)
(-5%)
Average # of MonthsProbation
32.3(336)
36.2(278)
+12 %
Average # of MonthsPrison
53.5(79)
63.6(84)
+19%
Average # of DaysJail
59.4(41)
43.0(46)
(-27%)

35 Denver Drug Court has an established “intermediate sanctions” policy, e.g, the first failed urinanalysis results in one day in jail,the second failed urinanalysis results in two days in jail.
75
The increase in heroincharges between 1993and 1995 was notsustained in the 1996data.
The trend toward longer sentence lengths for Drug Court cases noted earlier in the report continued asDrug Court progressed over time. Sentence lengths for both probation and prison were significantly
longer in 1996 compared to 1995. However, jail sentences were significantly shorter. This latter
phenomenon likely reflects the Court’s policy of providing immediate sanctions of short jail sentences
for individuals who do not follow through with conditions of their treatment, e.g., providing therequired number of urinalysis tests.35
SummarySignificant changes were found in case processing in Denver Drug Court between 1995 and 1996.
First, case processing times continue to be reduced. There were also differences in the types of drugs
charged between the two years, with significantly fewer charges for heroin and significantly more forcocaine/crack and marijuana. Demographically, the 1995 and 1996 groups were very similar with the
important exception of a significant increase in the proportion of individuals reporting full time
employment and residential stability. Thus, the decrease in the proportion of drug offenders reporting
full time employment and residential stability after the Drug Court was implemented (comparing1993 and 1995) was not sustained in the 1996 study group.
Also, the increase in heroin charges between 1993 and 1995 was not
sustained in the 1996 data. The shift away from heroin charges is related to
the fact that although similar percentages of Hispanics were seen in DrugCourt in 1995 and 1996, fewer Hispanics in 1996 faced heroin charges.
In 1996, Hispanics were still the ethnic group most likely to be referred to
INS, and heroin charges were still the drug charge most likely to receive a
referral to INS (although the percentage of referrals for heroin charges wassignificantly lower in 1996 compared to 1995). Ethnicity, drug charge and INS referral were linked as
they were in the 1995 analysis: every person in 1996 referred to INS for a heroin charge is of Hispanic
ethnicity.
The data suggest that sentencing practices that provided case oversight and sanctions became moreclearly identified as Drug Court policies became more established and developed through time, as
reflected by longer sentences to prison and probation, the Drug Court’s primary sanctions.

76

77
RESULTSSection 9: What Were the Outcomes for Drug CourtParticipants as Measured by Adherence to Treatment?
The following table describes how well participants were able to adhere to the level of supervision andtreatment required by the Drug Court program six months from the date of filing. Table 39 includes
only data on cases that were community eligible, i.e., not sentenced to prison. The measures on failure
to participate in urinanalysis (UA), no-shows for treatment, and imposition of jail days imposed by the
court for positive UA’s or no UA’s reflect failure as measured by lack of compliance with court ordersand treatment. The last measure, outcome score, represents a composite of indicators, both positive
and negative, that resulted in a change in the conditions of supervision and treatment. A (-1)
indicates at least one negative change while in supervision or treatment. A zero on the outcome score
indicates no change and may be considered one measure that an individual generally followed thecourse of treatment during the first six months after the filing date. Examples of negative changes
include a regression to more restrictive community placement, a revocation of probation, or increased
UA testing. An outcome score of 1 signifies at least one positive change in conditions of supervision
and treatment, such as time cut from sentence or decreased UA testing. It should be noted that thereare more possible negative than positive indicators in the score sheet. (The score sheet is part of the
data collection addendum used in 1995 and 1996 Drug Court data collection procedures and is
attached to this report.)
Table 39. 6 Month Outcomes: Adherence to TreatmentDenver Drug Court, 1995 and 1996 For Probation and Community Corrections Placements Only
NON-PRISON PLACEMENT DRUG COURT CASESJan-Mar 1995 and Jan-Mar 1996
CASES IN EACH OUTCOMECATEGORY
Cases with Jail Days Imposed For Positive UA’s orFailure To Participate in UA
YesNo
39%61%
253399
Cases with One or More Failures to Participate in UA
YesNo
56%44%
362289
Cases with No Shows YesNo
36%64%
231412
Cases with Positive UA’s YesNo
40%60%
262392
Outcome Score* -1 0 1
19%68%13%
12744682
* -1 = 1 or more negative change while in supervision or treatment. 0 = No change meaning “okay so far”. 1 = 1 or more positive changes reflect in a reduction in the restrictive elements of supervision and treatment.

78
In terms of overallbehaviors that wouldhave resulted in a changein the level of treatmentor supervision, however,only 19% of the groupexperienced failures inthis area, the remainderof the group (81%)experienced no change(indicates “OK so far!”)or had a positive changein level of treatment orsupervision.
The 1995 and 1996 combined Drug Court sample tended to have the mostdifficulty with participation in urinanalyses (UA) testing. Over half of the
drug cases in treatment (56%) had at least one instance of failing to
participate in UA testing. In terms of overall behaviors that would have
resulted in a change in the level of treatment or supervision, however, only19% of the group experienced failures in this area, the remainder of the group
(81%) experienced no change or had a positive change in level of treatment or
supervision. While longer term outcomes are unavailable for this analysis, the
data suggest four out of five Drug Court clients stay with treatment at leastthrough the six month time frame measured. Such stability may be
interpreted as a very good prognosis. Our ability to link these outcomes for
Drug Court is limited because we do not have this information for either the
1993 sample or a comparable control group.
Summary & RecommendationsDenver’s Drug Court seems to be meeting many original goals: shorter case
processing time, longer supervision/incarceration periods, and approximately 80% of the 1995 and
1996 samples were responding well to intervention six months into Drug Court supervision.
Additionally, the original drug charge was more frequently consistent with the conviction charge afterthe Drug Court commenced. Significantly, more drug cases were handled as a deferred judgment, or
Track One cases, after the Drug Court opened its doors.
Compared to pre-Drug Court cases in Denver, the Drug Court processed a greater proportion
individuals who were females, Hispanics (nearly half of these were INS referrals), poorly educated (8thgrade or less), and residentially unstable. For one (1995) of the three years (1993, 1995, 1996) for
which we have data, heroin cases increased significantly.
These findings have important implications for planning and implementing corrections programs. In
addition to drug treatment and intensive case management, it may be important to address ways toconnect individuals with resources that provide remedial education, vocational training and build on
community ties. Obviously, bilingual services should continue to be emphasized by Drug Court staff,
and coordination with local community corrections stakeholders could increase the range of placement
options available to the Judge. Special programming for women offenders should continue to beprioritized by policy makers and program planners since the female population, as a proportion of
criminal justice clientele, continues to grow, particularly in the area of drug crimes.
The Denver Drug Court systematically evaluates and provides intervention for cases under its
jurisdiction. Use of the Court’s threat of sanctions for noncompliance can provide powerful leverageto encourage abstinence in the face of addiction. The six-month review of offender outcomes is
positive for four of five Drug Court participants. More information is needed to determine if these

79
changes are long-lasting. As a follow-up to this study, the Office of Research and Statistics at theDivision of Criminal Justice will conduct a study of the rearrest rates of the samples analyzed for this
study.

80

81
STAKEHOLDER FEEDBACK
The Division of Criminal Justice is dedicated to quality and relevant research. This includes being
committed to having an open dialogue with the people and agencies being affected by our research. We hope that through this “conversation” with stakeholders we will ask better research questions and
provide better answers that accurately address the informational needs of our consumers.
We submitted this report for review to our stakeholders, and many of their comments and suggestions
were incorporated into the final product. We also indicated that their comments would be included asan addendum to the final report if they wished.
The following letters were submitted for inclusion with the final report.

82