Dendritic sodium spikes are required for long-term ... Lab/elife... · long-term potentiation at...
30
elifesciences.org RESEARCH ARTICLE Dendritic sodium spikes are required for long-term potentiation at distal synapses on hippocampal pyramidal neurons Yujin Kim 1,2† , Ching-Lung Hsu 1,2† , Mark S Cembrowski 1 , Brett D Mensh 1 , Nelson Spruston 1,2 * 1 Janelia Research Campus, Howard Hughes Medical Institute, Ashburn, United States; 2 Department of Neurobiology, Northwestern University, Evanston, United States Abstract Dendritic integration of synaptic inputs mediates rapid neural computation as well as longer-lasting plasticity. Several channel types can mediate dendritically initiated spikes (dSpikes), which may impact information processing and storage across multiple timescales; however, the roles of different channels in the rapid vs long-term effects of dSpikes are unknown. We show here that dSpikes mediated by Na v channels (blocked by a low concentration of TTX) are required for long- term potentiation (LTP) in the distal apical dendrites of hippocampal pyramidal neurons. Furthermore, imaging, simulations, and buffering experiments all support a model whereby fast Na v channel-mediated dSpikes (Na-dSpikes) contribute to LTP induction by promoting large, transient, localized increases in intracellular calcium concentration near the calcium-conducting pores of NMDAR and L-type Ca v channels. Thus, in addition to contributing to rapid neural processing, Na- dSpikes are likely to contribute to memory formation via their role in long-lasting synaptic plasticity. DOI: 10.7554/eLife.06414.001 Introduction Hebbian remodeling of neural circuits, encapsulated by the phrase ‘neurons that fire together wire together’, is the leading candidate mechanism for learning in the brain (Shatz, 1992; Cooper, 2005). Thus, the finding that synaptic plasticity often has properties compatible with Hebbian learning has been a powerful driver of experimental and theoretical studies of changes in synaptic weights. The simple idea is that coincident presynaptic and postsynaptic activity results in changes in synaptic strength such as long-term potentiation (LTP). Many in vitro studies support a model in which modifiable synapses detect presynaptic activity through glutamate binding to postsynaptic receptors and detect postsynaptic activity through depolarization, which relieves magnesium block of N-methyl-D-aspartate (NMDA) receptors (NMDARs) and activates voltage-gated calcium (Ca v ) channels. Both of these effects mediate postsynaptic calcium entry, which is believed to be a critical activator of the biochemical steps necessary for increases in synaptic strength (Madison et al., 1991; Bliss and Collingridge, 1993; Blackstone and Sheng, 2002; Cavazzini et al., 2005). Four decades of research have led to this general picture, but important questions about the events leading to the critical calcium entry remain unanswered. Three distinct ideas have been considered for the type of postsynaptic depolarization required to produce the calcium entry leading to Hebbian LTP (Williams et al., 2007): 1. Postsynaptic axo-somatic action potential firing is necessary, and this signal reaches synapses in the form of backpropagating action potentials (bAPs), 2. Postsynaptic axo-somatic action potential firing is not necessary; rather, localized passive synaptic depolarization is sufficient, 3. Postsynaptic axo-somatic action potential firing is not necessary and passive synaptic depolarization is not sufficient; rather, localized synaptic depolarization must activate dendritic nonlinearities, such as locally initiated dendritic spikes (dSpikes). *For correspondence: [email protected] † These authors contributed equally to this work Competing interests: The authors declare that no competing interests exist. Funding: See page 26 Received: 09 January 2015 Accepted: 05 August 2015 Published: 06 August 2015 Reviewing editor: Gary L Westbrook, Vollum Institute, United States Copyright Kim et al. This article is distributed under the terms of the Creative Commons Attribution License, which permits unrestricted use and redistribution provided that the original author and source are credited. Kim et al. eLife 2015;4:e06414. DOI: 10.7554/eLife.06414 1 of 30
Transcript of Dendritic sodium spikes are required for long-term ... Lab/elife... · long-term potentiation at...

elifesciences.org
RESEARCH ARTICLE
Dendritic sodium spikes are required forlong-term potentiation at distal synapseson hippocampal pyramidal neuronsYujin Kim1,2†, Ching-Lung Hsu1,2†, Mark S Cembrowski1, Brett D Mensh1,Nelson Spruston1,2*
1Janelia Research Campus, Howard Hughes Medical Institute, Ashburn, United States;2Department of Neurobiology, Northwestern University, Evanston, United States
Abstract Dendritic integration of synaptic inputs mediates rapid neural computation as well as
longer-lasting plasticity. Several channel types can mediate dendritically initiated spikes (dSpikes),
which may impact information processing and storage across multiple timescales; however, the roles
of different channels in the rapid vs long-term effects of dSpikes are unknown. We show here that
dSpikes mediated by Nav channels (blocked by a low concentration of TTX) are required for long-
term potentiation (LTP) in the distal apical dendrites of hippocampal pyramidal neurons.
Furthermore, imaging, simulations, and buffering experiments all support a model whereby fast Navchannel-mediated dSpikes (Na-dSpikes) contribute to LTP induction by promoting large, transient,
localized increases in intracellular calcium concentration near the calcium-conducting pores of
NMDAR and L-type Cav channels. Thus, in addition to contributing to rapid neural processing, Na-
dSpikes are likely to contribute to memory formation via their role in long-lasting synaptic plasticity.
DOI: 10.7554/eLife.06414.001
IntroductionHebbian remodeling of neural circuits, encapsulated by the phrase ‘neurons that fire together wire
together’, is the leading candidate mechanism for learning in the brain (Shatz, 1992; Cooper, 2005).
Thus, the finding that synaptic plasticity often has properties compatible with Hebbian learning has been
a powerful driver of experimental and theoretical studies of changes in synaptic weights. The simple idea
is that coincident presynaptic and postsynaptic activity results in changes in synaptic strength such as
long-term potentiation (LTP). Many in vitro studies support a model in which modifiable synapses detect
presynaptic activity through glutamate binding to postsynaptic receptors and detect postsynaptic
activity through depolarization, which relieves magnesium block of N-methyl-D-aspartate (NMDA)
receptors (NMDARs) and activates voltage-gated calcium (Cav) channels. Both of these effects mediate
postsynaptic calcium entry, which is believed to be a critical activator of the biochemical steps necessary
for increases in synaptic strength (Madison et al., 1991; Bliss and Collingridge, 1993; Blackstone and
Sheng, 2002; Cavazzini et al., 2005). Four decades of research have led to this general picture, but
important questions about the events leading to the critical calcium entry remain unanswered.
Three distinct ideas have been considered for the type of postsynaptic depolarization required to
produce the calcium entry leading to Hebbian LTP (Williams et al., 2007):
1. Postsynaptic axo-somatic action potential firing is necessary, and this signal reaches synapses in theform of backpropagating action potentials (bAPs),
2. Postsynaptic axo-somatic action potential firing is not necessary; rather, localized passive synapticdepolarization is sufficient,
3. Postsynaptic axo-somatic action potential firing is not necessary and passive synaptic depolarizationis not sufficient; rather, localized synaptic depolarization must activate dendritic nonlinearities, suchas locally initiated dendritic spikes (dSpikes).
*For correspondence:
†These authors contributed
equally to this work
Competing interests: The
authors declare that no
competing interests exist.
Funding: See page 26
Received: 09 January 2015
Accepted: 05 August 2015
Published: 06 August 2015
Reviewing editor: Gary L
Westbrook, Vollum Institute,
United States
Copyright Kim et al. This
article is distributed under the
terms of the Creative Commons
Attribution License, which
permits unrestricted use and
redistribution provided that the
original author and source are
credited.
Kim et al. eLife 2015;4:e06414. DOI: 10.7554/eLife.06414 1 of 30
At any given synapse at any moment in time, these three mechanisms of postsynaptic activity
detection are mutually exclusive. However, all three mechanisms may exist in the brain, for example,
in different cell types or even within the same cell at different synapses, different stages of
development, or possibly in response to different activation patterns at the same synapse. Such
heterogeneity would be consistent with the idea that LTP is not a single phenomenon, but rather
a collection of mechanisms that can produce a long-lasting increase in synaptic strength (Malenka
and Bear, 2004).
In each of the three cases above, the concerted action of multiple synapses is required—the so-
called ‘cooperativity’ requirement for LTP (Feldman, 2012)—but the patterns of synaptic activation
that result in LTP are quite different. In the first case, the synapses that drive action potential firing
could be located anywhere in the dendritic tree and plasticity would occur at all synapses that
experience significant depolarization as a result of the bAP. This is the most conventional
interpretation of Hebbian LTP. In the second and third conditions, synapses have to be co-localized
in the dendrites in order to depolarize each other sufficiently to produce Hebbian LTP. In these
conditions, the postsynaptic axon does not have to ‘fire’ at all; the third condition additionally requires
that the co-localized synapses produce enough depolarization to trigger a dSpike, which may occur
with or without axonal firing. Although these conditions may still be classified as ‘Hebbian LTP’,
because of the requirement for co-incident presynaptic and postsynaptic activation, the existence of
LTP under these conditions would imply that Hebbian-like LTP occurs at finer spatial scales than the
more cell-wide form that most current models employ. Thus, during behavior, neurons that fire may
undergo LTP, but even a neuron that is synaptically activated but axonally silent during a behavioral
event can be recruited to participate in the neural engram.
eLife digest When we explore somewhere new, we activate a region of the brain that processes
spatial information called the entorhinal cortex. This brain region stimulates the brain’s memory-
formation center, known as the hippocampus, which in turn forms a spatial memory of the new place.
The process of forming these memories involves strengthening nerve connections, including those
between the entorhinal cortex and the hippocampus.
Groups of neurons that produce synchronized electrical activity will naturally strengthen the nerve
connections between them. This led scientists to predict that synchronized electrical activity
between neurons in the entorhinal cortex and the hippocampus may contribute to the formation of
spatial memories.
Previous research revealed that hippocampal neurons produced short bursts of electrical activity
that are localized at specific sites along their branched nerve processes that extend out of the cell
body and are where inputs from other neurons are received. These types of localized electrical
activity have been associated with a strengthening of the nerve connections between the entorhinal
cortex and the hippocampal neurons. Ion channels that allow calcium to flow through these neurons’
cell membranes had been identified as a potential source of these local electrical activities, and
calcium is responsible for the strengthening of nerve connections. But it remained unclear whether
channels that allow only sodium ions to flow through might also be involved.
Kim, Hsu et al. have now investigated this question by devising a way to selectively block the
electrical activity produced by sodium ion channels on the branched nerve processes of hippocampal
neurons. Slices of rat brain were collected and an inhibitor that specifically affected the sodium
channels was delivered to the brain slices. Electrodes were used to stimulate the inputs from the
entorhinal cortex, and to monitor the resulting electrical activity in the hippocampal neurons.
Kim, Hsu et al. analyzed the results and reproduced them using computer simulations, which
showed that sodium ion channels are essential for triggering brief electrical events within the
individual branches of nerve processes. These local electrical events appeared to activate calcium
channels to produce highly concentrated, short-lived calcium signals that are necessary for
strengthening nerve connections. Future studies will determine whether local electrical activity
mediated by sodium channels is also involved in strengthening nerve connections between other
types of neurons, and how this mechanism affects the formation of memories.
DOI: 10.7554/eLife.06414.002
Kim et al. eLife 2015;4:e06414. DOI: 10.7554/eLife.06414 2 of 30
Research article Neuroscience
Interestingly, hippocampal place cells behave in a manner suggestive of a form of Hebbian LTP that
may not require postsynaptic action potential firing: many cells are silent when the animal first goes to
a new place, and then they are recruited to participate in the network representation of the spatial
map (Frank et al., 2004). This suggests that if synaptic plasticity contributes to reshaping the network
upon initial exposure to a new environment, it need not be conventional Hebbian plasticity, but rather
a modified form of Hebbian plasticity that does not require axonal firing, such as the second and third
conditions described above. Consistent with this idea, hippocampal neurons receive spatially tuned
synaptic inputs even when they are silent (Lee et al., 2012). Understanding whether and how such
inputs can drive synaptic plasticity will be an important step toward understanding how spatial
memories are formed in the hippocampus.
If axonal action potential firing is required for synaptic plasticity, memories can only be stored in
active neurons. On the other hand, if it is not required, memories can also be formed in silent neurons.
Furthermore, plasticity that is induced by dSpikes that remain localized to individual dendritic
branches has been proposed to enhance the memory-storing capacity of individual neurons (Poirazi
and Mel, 2001; Mehta, 2004; Wu and Mel, 2009). Collectively, these considerations underscore the
importance of understanding the dendritic events leading to the postsynaptic calcium entry necessary
for the induction of LTP.
At synapses from the perforant path (PP; which carries predominantly spatial information from
the entorhinal cortex) to the distal apical tuft of hippocampal CA1 pyramidal neurons, LTP requires
strong synaptic activation, and LTP induction can have a significant impact on the output of CA1
neurons (Colbert and Levy, 1993; Remondes and Schuman, 2002; Ahmed and Siegelbaum,
2009; Takahashi and Magee, 2009). In previous work, we showed that LTP at these synapses
does not require bAPs; rather, LTP is correlated with the initiation of dSpikes, which often do not
trigger action potential firing and bAPs (Golding and Spruston, 1998; Golding et al., 2002).
This pathway therefore offers an ideal opportunity to study the potential role of dSpikes in the
induction of LTP.
The hypothesis that dSpikes are a causal step in the induction of LTP has not been directly
tested, owing to the difficulty of blocking them selectively. Three types of dSpikes have been
described, which have been named according to the primary channel type supporting the
regenerative event: dendritic sodium spikes (Na-dSpikes) and dendritic calcium spikes (Ca-dSpikes)
are mediated primarily by voltage-gated sodium (Nav) channels and Cav channels, respectively,
while dendritic NMDA spikes (NMDA-dSpikes) are mediated primarily by NMDAR channels
(Schwartzkroin and Slawsky, 1977; Andreasen and Lambert, 1995; Schiller et al., 1997; Golding
et al., 1999; Larkum et al., 1999; Spruston, 2008; Larkum et al., 2009; Major et al., 2013).
NMDAR and Cav channels are known to contribute to the induction of LTP at PP-CA1 synapses
(Golding et al., 2002; Takahashi and Magee, 2009), but it is difficult to disentangle the
importance of the calcium permeability of these channels from their roles in mediating regenerative
dendritic voltage changes. Furthermore, the importance of dendritic Nav channels and Na-dSpikes
has not been addressed, mostly because these channels are essential for action potential firing in
presynaptic axons and terminals, thus making it difficult to block them without inhibiting synaptic
transmission.
One strategy to block postsynaptic Nav channels without affecting presynaptic Nav channels is to
use the intracellular blocker QX-314; however, this drug also blocks Cav channels, voltage-gated
potassium (Kv) channels and has effects on other channels and receptors, making the overall
consequences difficult to interpret (Nathan et al., 1990; Andrade, 1991; Oda et al., 1992; Lambert
and Wilson, 1993; Martin et al., 1993; Otis et al., 1993; Perkins and Wong, 1995; Talbot and
Sayer, 1996). As an alternative strategy, we used a relatively low concentration of bath-applied
tetrodotoxin (TTX; 20 nM) to achieve partial block of the Nav channels (Kaneda et al., 1989; Madeja,
2000), which we demonstrate is able to inhibit postsynaptic dSpikes mediated by Nav channels
without blocking presynaptic action potential firing or synaptic transmission. This strategy works
because the density of Nav channels is much lower in dendrites than in axons. As a result, the safety
factor for spike initiation is lower in dendrites, so partial block of Nav channels affects postsynaptic
(dendritic) dSpikes much more than presynaptic (axonal) action potentials (Mackenzie and Murphy,
1998). Using this strategy, we demonstrate that Na-dSpikes are necessary for the induction of LTP in
response to theta-burst stimulation (TBS) of the PP synapses in the apical tuft dendrites of CA1
pyramidal neurons, and we offer an explanation for why these spikes are an essential mechanism.
Kim et al. eLife 2015;4:e06414. DOI: 10.7554/eLife.06414 3 of 30
Research article Neuroscience

ResultsTo determine whether a low concentration of TTX (20 nM) could be used without interfering with
synaptic transmission over a range of stimulus intensities, we performed whole-cell recordings from CA1
pyramidal neurons in rat hippocampal slices while stimulating the PP (‘Materials and methods’) to
activate synapses in the distal apical tuft dendrites (henceforth ‘PP → CA1tuft’ synapses). We adjusted
stimulus intensity to yield single PP → CA1tuft excitatory postsynaptic potentials (EPSPs) of 3–10 mV at
the soma, which likely corresponds to activation of several tens of synapses onto the apical tuft
dendrites of the recorded neuron (Golding et al., 2005; Nicholson et al., 2006). We chose 20 nM TTX
(henceforth ‘low TTX’) because it was the highest concentration we could use without obviously
reducing the size of EPSPs. The IC50 of TTX on Nav channels has been estimated as 6–10 nM in
dissociated hippocampal neurons (Kaneda et al., 1989; Madeja, 2000), but it may be higher for slice
experiments due to limited drug penetration in brain slices. Single EPSPs in response to low-frequency
(single shock) stimulation were not affected by bath application of low TTX (control: 4.57 ± 0.36 mV, low
TTX: 5.02 ± 0.49 mV, n = 7; p > 0.05 by Student’s t-test; data not shown). We also tested the effects of
low TTX on the responses to low-frequency or high-frequency (5 stimuli at 100 Hz) activation of the PP,
while using localized application of a higher concentration of TTX (10 μM in the application pipette) to
the vicinity of the soma and proximal axons (‘Materials and methods’; Figure 1A) in order to prevent
somatic or axonal action potential initiation. Bath application of low TTX had no significant effect on PP
→ CA1tuft EPSPs in response to either type of stimulation, across a wide range of stimulus intensities
resulting in EPSPs from ∼3 mV (single shock) up to ∼27 mV (high-frequency burst; Figure 1B–G;
Figure 1—source data 1). These results suggest that excitatory synaptic transmission is not affected by
bath application of low TTX within the range of stimulus intensities and frequencies tested here.
Consistent with this result and with the notion of a high safety factor for action potential initiation in the
axon (Coombs et al., 1957; Mainen et al., 1995; Raastad and Shepherd, 2003; Clark et al., 2005;
Khaliq and Raman, 2006; Kole and Stuart, 2008; Hu and Jonas, 2014), low TTX did not block action
potential firing in response to somatic current injection, though it did raise the voltage threshold and
reduce action potential amplitude slightly, as expected from a reduction of Nav channel availability
(Figure 1—figure supplement 1A–C; Figure 1—source data 2; see alsoMackenzie and Murphy, 1998;
Magee and Carruth, 1999; Fan et al., 2005). In addition, we tested the effects of low TTX on action
potentials evoked by repeated bursts of antidromic stimulation of CA1 axons and found that low TTX only
affected antidromic action potential firing at low stimulus intensities. At high stimulus intensities,
antidromic spikes were not blocked by low TTX (Figure 1—figure supplement 1D,E; Figure 1—source
data 2). Together with the lack of effect of low TTX on synaptic responses, these data suggest that the
effects of low TTX on presynaptic action potential firing and glutamate release are minimal.
To analyze the effects of low TTX on dSpike initiation, we performed recordings from the
primary apical dendrite (n = 9; 200–320 μm from the soma, mean distance = 250 μm; about 50–80%
of the distance from the soma to the end of the apical tuft). Dendritic recording is necessary to
increase the probability of detecting dSpikes originating in the apical tuft, because their steep
attenuation makes them impossible to detect hundreds of microns away in somatic recordings. We
used a stimulus pattern known to cause dSpikes (Golding et al., 2002), which consisted of PP
stimulation in high-frequency bursts (5 stimuli at 100 Hz), repeated five times at theta frequency
(5 Hz; a ‘theta-burst stimulation’, TBS, consisting of 25 stimuli in total). Stimulus intensity was set to
evoke single PP → CA1tuft EPSPs of 4–10 mV recorded in the dendrites, approximately the same as
that required to produce single PP → CA1tuft EPSPs of 2–5 mV recorded at the soma (Golding
et al., 2005). This stimulus pattern is intended to mimic the theta rhythm observed both in the
hippocampus and in the entorhinal cortical neurons forming the PP (Buzsaki and Moser, 2013),
and is known to be an effective stimulus for induction of LTP in the hippocampus (Larson et al.,
1986; Phillips et al., 2008). A TBS is normally repeated multiple times to induce LTP, but in this
first series of experiments, we used a single TBS in the presence of low TTX followed by another
single TBS after washout of TTX. We used this order of drug application and avoided repeating
TBS in each condition in order to prevent the induction of LTP, which would confound the
comparison of responses in the presence and absence of TTX.
Consistent with previous results (Golding and Spruston, 1998; Golding et al., 2002; Losonczy
and Magee, 2006), we observed three types of regenerative dendritic responses: (1) bAPs, (2) large
dSpikes, and (3) small dSpikes (also known as ‘spikelets’). These three kinds of events were
Kim et al. eLife 2015;4:e06414. DOI: 10.7554/eLife.06414 4 of 30
Research article Neuroscience
distinguishable in most cases by their voltage amplitude, first temporal derivative of voltage (dV/dt)
and onset kinetics (Figure 2A,B; Figure 2—source data 1; ‘Materials and methods’). Large dSpikes
reflect dSpikes that have propagated actively from their initiation site to the recording site. However,
dSpikes can fall below threshold for active propagation (often because of large impedance drops at
branch points) and then propagate passively to the recording electrode, where they appear as small
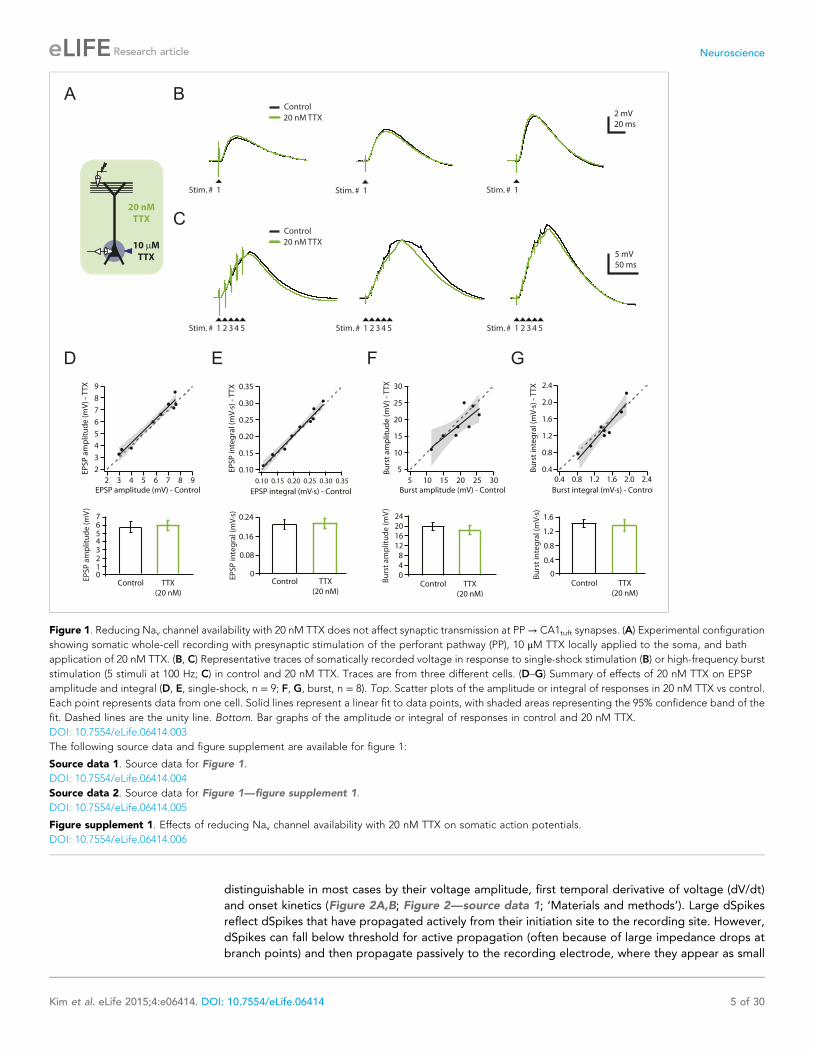
Figure 1. Reducing Nav channel availability with 20 nM TTX does not affect synaptic transmission at PP→ CA1tuft synapses. (A) Experimental configuration
showing somatic whole-cell recording with presynaptic stimulation of the perforant pathway (PP), 10 μM TTX locally applied to the soma, and bath
application of 20 nM TTX. (B, C) Representative traces of somatically recorded voltage in response to single-shock stimulation (B) or high-frequency burst
stimulation (5 stimuli at 100 Hz; C) in control and 20 nM TTX. Traces are from three different cells. (D–G) Summary of effects of 20 nM TTX on EPSP
amplitude and integral (D, E, single-shock, n = 9; F, G, burst, n = 8). Top. Scatter plots of the amplitude or integral of responses in 20 nM TTX vs control.
Each point represents data from one cell. Solid lines represent a linear fit to data points, with shaded areas representing the 95% confidence band of the
fit. Dashed lines are the unity line. Bottom. Bar graphs of the amplitude or integral of responses in control and 20 nM TTX.
DOI: 10.7554/eLife.06414.003
The following source data and figure supplement are available for figure 1:
Source data 1. Source data for Figure 1.
DOI: 10.7554/eLife.06414.004
Source data 2. Source data for Figure 1—figure supplement 1.
DOI: 10.7554/eLife.06414.005
Figure supplement 1. Effects of reducing Nav channel availability with 20 nM TTX on somatic action potentials.
DOI: 10.7554/eLife.06414.006
Kim et al. eLife 2015;4:e06414. DOI: 10.7554/eLife.06414 5 of 30
Research article Neuroscience
dSpikes (spikelets) (Golding and Spruston, 1998; Golding et al., 2002; Jarsky et al., 2005; Losonczy
and Magee, 2006; Katz et al., 2009). dSpikes that are generated far from the recording site may not
be visible at all. Observations of events with amplitudes in between those of large dSpikes and small
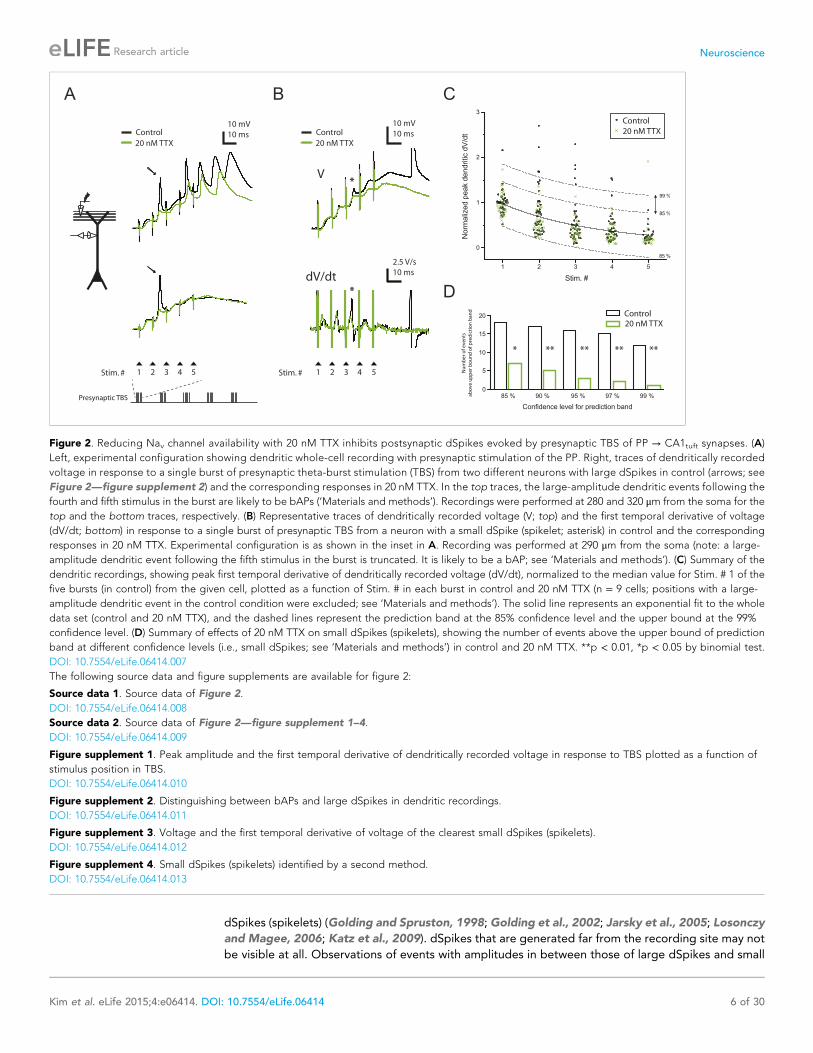
Figure 2. Reducing Nav channel availability with 20 nM TTX inhibits postsynaptic dSpikes evoked by presynaptic TBS of PP → CA1tuft synapses. (A)
Left, experimental configuration showing dendritic whole-cell recording with presynaptic stimulation of the PP. Right, traces of dendritically recorded
voltage in response to a single burst of presynaptic theta-burst stimulation (TBS) from two different neurons with large dSpikes in control (arrows; see
Figure 2—figure supplement 2) and the corresponding responses in 20 nM TTX. In the top traces, the large-amplitude dendritic events following the
fourth and fifth stimulus in the burst are likely to be bAPs (‘Materials and methods’). Recordings were performed at 280 and 320 μm from the soma for the
top and the bottom traces, respectively. (B) Representative traces of dendritically recorded voltage (V; top) and the first temporal derivative of voltage
(dV/dt; bottom) in response to a single burst of presynaptic TBS from a neuron with a small dSpike (spikelet; asterisk) in control and the corresponding
responses in 20 nM TTX. Experimental configuration is as shown in the inset in A. Recording was performed at 290 μm from the soma (note: a large-
amplitude dendritic event following the fifth stimulus in the burst is truncated. It is likely to be a bAP; see ‘Materials and methods’). (C) Summary of the
dendritic recordings, showing peak first temporal derivative of dendritically recorded voltage (dV/dt), normalized to the median value for Stim. # 1 of the
five bursts (in control) from the given cell, plotted as a function of Stim. # in each burst in control and 20 nM TTX (n = 9 cells; positions with a large-
amplitude dendritic event in the control condition were excluded; see ‘Materials and methods’). The solid line represents an exponential fit to the whole
data set (control and 20 nM TTX), and the dashed lines represent the prediction band at the 85% confidence level and the upper bound at the 99%
confidence level. (D) Summary of effects of 20 nM TTX on small dSpikes (spikelets), showing the number of events above the upper bound of prediction
band at different confidence levels (i.e., small dSpikes; see ‘Materials and methods’) in control and 20 nM TTX. **p < 0.01, *p < 0.05 by binomial test.
DOI: 10.7554/eLife.06414.007
The following source data and figure supplements are available for figure 2:
Source data 1. Source data of Figure 2.
DOI: 10.7554/eLife.06414.008
Source data 2. Source data of Figure 2—figure supplement 1–4.
DOI: 10.7554/eLife.06414.009
Figure supplement 1. Peak amplitude and the first temporal derivative of dendritically recorded voltage in response to TBS plotted as a function of
stimulus position in TBS.
DOI: 10.7554/eLife.06414.010
Figure supplement 2. Distinguishing between bAPs and large dSpikes in dendritic recordings.
DOI: 10.7554/eLife.06414.011
Figure supplement 3. Voltage and the first temporal derivative of voltage of the clearest small dSpikes (spikelets).
DOI: 10.7554/eLife.06414.012
Figure supplement 4. Small dSpikes (spikelets) identified by a second method.
DOI: 10.7554/eLife.06414.013
Kim et al. eLife 2015;4:e06414. DOI: 10.7554/eLife.06414 6 of 30
Research article Neuroscience

dSpikes (spikelets) are rare, because the transition from a large dSpike to a small dSpike occurs over
very short distances due to the large attenuation at branch points (Katz et al., 2009). Accordingly,
we observed a large gap in the distribution of event amplitudes, with no events having amplitudes
in the 30–40 mV range (Figure 2—figure supplement 1A; Figure 2—source data 2). Small
dSpikes (spikelets) were distinguishable from the cases without any regenerative events (i.e., EPSPs
only) because they had larger dV/dt values (Figure 2B and Figure 2—figure supplement 1B;
Figure 2—source data 2; see below and ‘Materials and methods’).
In the presence of low TTX, both the number and the amplitude of large-amplitude dendritic
events (i.e., bAPs and large dSpikes, all with amplitudes >40 mV; see ‘Materials and methods’) were
reduced (control: amplitude = 56.2 ± 1.8 mV, n = 39 events; low TTX: amplitude = 44.8 ± 1.7 mV,
n = 17 events; p < 10−4 by Student’s t-test). Although distinguishing between bAPs and large dSpikes
was only possible in some cases (Figure 2—figure supplement 2; Figure 2—source data 2; see
‘Materials and methods’), the two events that were the most clearly large dSpikes were reduced to
spikelets in response to the same stimulus in the presence of low TTX (Figure 2A).
Of the smaller events (i.e., <30 mV), some small dSpikes were relatively easy to identify in dendritic
recordings (e.g., Figure 2B), because they were the most extreme outliers in the distribution of event dV/
dt values. Other small dSpikes were more difficult to resolve because their attenuation from the site of
origin makes them barely distinguishable from the cases without regenerative events (i.e., EPSPs only).
Thus, rather than using a single definition for small dSpikes, we employed a range of definitions; then for
each definition we compared the control and low TTX conditions. In this way, we could determine whether
conclusions about the effects of low TTX on dSpikes were dependent on the definition used.
We varied the dV/dt criterion for small dSpikes from a relatively inclusive one (outside the 85%
prediction band of a fit to the distribution of all events normalized dV/dt in control and low TTX; Figure 2C;
see ‘Materials and methods’) to a more restrictive one (outside the 99% prediction band). We found that
application of low TTX dramatically reduced the number of small dSpikes defined by all confidence levels in
this range (Figure 2C,D; Figure 2—source data 1; see Figure 2—figure supplement 3 for all small
dSpikes identified by the 99% confidence level; Figure 2—source data 2). Similar results were obtained
using other methods for identifying small dSpikes (Figure 2—figure supplement 4; Figure 2—source
data 2; see ‘Materials and methods’). As both large dSpikes and small dSpikes (spikelets) reflect the
presence of dSpikes initiated in the tuft dendrites, and both were inhibited by low TTX, we conclude that
low TTX is an effective inhibitor of dSpikes generated in response to TBS of the PP.
Given the ability of low TTX to inhibit dendritically initiated spikes, we tested its effects on the induction
of LTP using TBS at PP → CA1tuft synapses (using stimulus intensities yielding single EPSPs of 2–5 mV in
somatic recordings). TBS was repeated three times (TBSx3) and was either paired with brief somatic
current injections (TBSx3+Current) to evoke action potential firing during each burst of presynaptic stimuli
(Figure 3A; Figure 3—source data 1) or delivered with somatic voltage clamp (TBSx3+SomaticVC) to
prevent somatic action potential firing (holding potential −68 to −70 mV; see ‘Materials and methods’).
The magnitude of PP → CA1tuft LTP was similar in these two conditions (Figure 3B–E; TBSx3+Current,potentiation ratio = 1.63 ± 0.16, n = 9; TBSx3+SomaticVC, potentiation ratio = 1.53 ± 0.07, n = 9; p = 1.00
by one-way ANOVA; Figure 3—source data 1), suggesting that action potential firing did not contribute
to LTP induction at these synapses (see also Golding et al., 2002). Under both conditions, PP → CA1tuftLTP was blocked completely in the presence of low TTX (Figure 3C–E; Figure 3—source data 1).
Because low TTX blocks both dSpikes and bAPs, it is conceivable that TTX inhibits LTP by blocking
either or both of these sources of postsynaptic depolarization. However, consistent with our previous
study (Golding et al., 2002), we showed here again that PP → CA1tuft LTP is not affected by blocking
bAPs. Thus, we attribute the effect of low TTX on this particular form of LTP to its effect on
Na-dSpikes. This is a surprising result, because of the brief duration of Na-dSpikes, compared to
Ca- or NMDA-dSpikes.
One possible explanation for the requirement of Na-dSpikes during PP → CA1tuft LTP induction is
that they are required to activate channels mediating synaptic calcium influx. We therefore sought to
determine which calcium-permeable channels are responsible for the underlying sources of calcium
influx. We previously showed that PP→ CA1tuft LTP was reduced ∼50% by blocking NMDARs, ∼50% by
blocking L-, T-, and R-type Cav channels, and almost completely by blocking NMDARs and Cav channels
together (Golding et al., 2002). We confirmed these results here and showed further that the effects of
Cav channel blockers were attributable to blocking L-type Cav channels (with 10 μM nimodipine), but not
blocking T-, R-, or other types of Cav channels (with 50 μM Ni2+; Figure 4; Figure 4—source data 1;
Kim et al. eLife 2015;4:e06414. DOI: 10.7554/eLife.06414 7 of 30
Research article Neuroscience
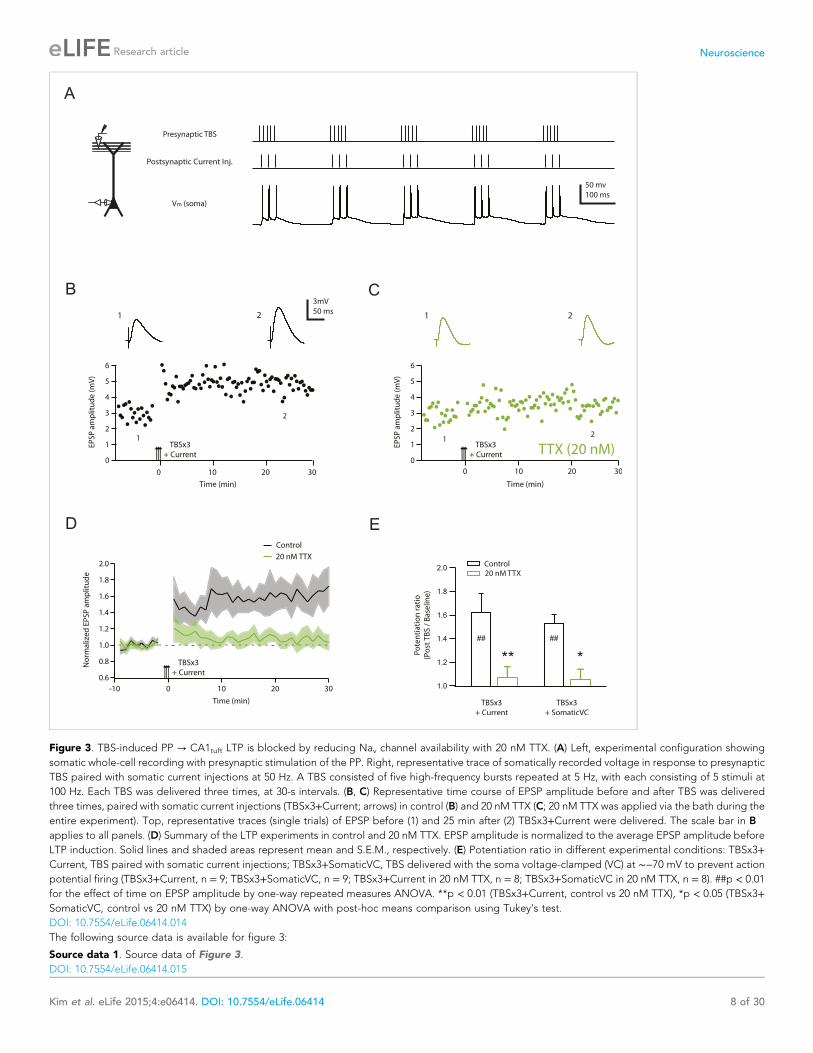
Figure 3. TBS-induced PP → CA1tuft LTP is blocked by reducing Nav channel availability with 20 nM TTX. (A) Left, experimental configuration showing
somatic whole-cell recording with presynaptic stimulation of the PP. Right, representative trace of somatically recorded voltage in response to presynaptic
TBS paired with somatic current injections at 50 Hz. A TBS consisted of five high-frequency bursts repeated at 5 Hz, with each consisting of 5 stimuli at
100 Hz. Each TBS was delivered three times, at 30-s intervals. (B, C) Representative time course of EPSP amplitude before and after TBS was delivered
three times, paired with somatic current injections (TBSx3+Current; arrows) in control (B) and 20 nM TTX (C; 20 nM TTX was applied via the bath during the
entire experiment). Top, representative traces (single trials) of EPSP before (1) and 25 min after (2) TBSx3+Current were delivered. The scale bar in B
applies to all panels. (D) Summary of the LTP experiments in control and 20 nM TTX. EPSP amplitude is normalized to the average EPSP amplitude before
LTP induction. Solid lines and shaded areas represent mean and S.E.M., respectively. (E) Potentiation ratio in different experimental conditions: TBSx3+Current, TBS paired with somatic current injections; TBSx3+SomaticVC, TBS delivered with the soma voltage-clamped (VC) at ∼−70 mV to prevent action
potential firing (TBSx3+Current, n = 9; TBSx3+SomaticVC, n = 9; TBSx3+Current in 20 nM TTX, n = 8; TBSx3+SomaticVC in 20 nM TTX, n = 8). ##p < 0.01
for the effect of time on EPSP amplitude by one-way repeated measures ANOVA. **p < 0.01 (TBSx3+Current, control vs 20 nM TTX), *p < 0.05 (TBSx3+SomaticVC, control vs 20 nM TTX) by one-way ANOVA with post-hoc means comparison using Tukey’s test.
DOI: 10.7554/eLife.06414.014
The following source data is available for figure 3:
Source data 1. Source data of Figure 3.
DOI: 10.7554/eLife.06414.015
Kim et al. eLife 2015;4:e06414. DOI: 10.7554/eLife.06414 8 of 30
Research article Neuroscience

Figure 4. NMDAR and L-Cav channels mediate TBS-induced LTP at PP → CA1tuft synapses. (A–D) Representative time course of EPSP amplitude before
and after TBSx3+Current was delivered (arrows) in 50 μM AP5 (A), 10 μM nimodipine (B), 50 μM AP5 and 10 μM nimodipine (C), or 50 μM Ni2+ (D). Drugs
were applied via the bath during the entire experiment. Top, representative traces (single trials) of EPSP before (1) and 25 min after (2) TBSx3+Current wasdelivered. The scale bar in A applies to all panels. (E) Summary of the LTP experiments in AP5, nimodipine (Nimo), AP5 and nimodipine (AP5+Nimo), and
Ni2+, shown along with the data in control and 20 nM TTX (Figure 3) for comparison. EPSP amplitude is normalized to the average EPSP amplitude before
LTP induction. Solid lines and shaded areas represent mean and S.E.M., respectively. (F) Potentiation ratio in different experimental conditions (Control,
n = 9; AP5, n = 11; Nimo, n = 9; AP5+Nimo, n = 11; Ni2+, n = 9; 20 nM TTX, n = 8). ##p < 0.01, #p < 0.05 for the effect of time on EPSP amplitude by one-
way repeated measures ANOVA. **p < 0.01, *p < 0.05 (all compared to control) by one-way ANOVA with post-hoc means comparison using Tukey’s test.
DOI: 10.7554/eLife.06414.016
The following source data and figure supplement are available for figure 4:
Source data 1. Source data of Figure 4.
DOI: 10.7554/eLife.06414.017
Figure 4. continued on next page
Kim et al. eLife 2015;4:e06414. DOI: 10.7554/eLife.06414 9 of 30
Research article Neuroscience

see also Remy and Spruston, 2007). Furthermore, 10 μM nimodipine had no effect on synaptic
responses, either before or after the induction of PP → CA1tuft LTP (Figure 4—figure supplement 1;
Figure 4—source data 2), suggesting that L-type Cav channels are involved in the induction rather than
the expression of LTP.
These results suggest that NMDAR and L-type Cav (L-Cav) channels are the two main sources of
calcium entry during LTP induction by TBS of PP → CA1tuft synapses. The observation that partial block
of Nav channels by low TTX blocked PP → CA1tuft LTP almost completely (Figure 3B–E) indicates that
Nav channel-mediated events are required to activate these two types of calcium-permeable channels,
and these events are unlikely to be bAPs, as we showed here and in our previous study (see above). We
therefore performed additional analyses on the dendritic recordings (described above) to determine
how low TTX affects membrane potential changes that can activate these channels.
As described above, low TTX blocked large and small dSpikes (Figure 2 and Figure 2—figure
supplement 4). In one of the two dendritic recordings where we observed inhibition of a clear large
dSpike by low TTX, we subsequently washed out TTX and applied 50 μM AP5, which did not block the
large dSpike (Figure 5A; Figure 5—source data 1). By contrast, low TTX had almost no effect on the
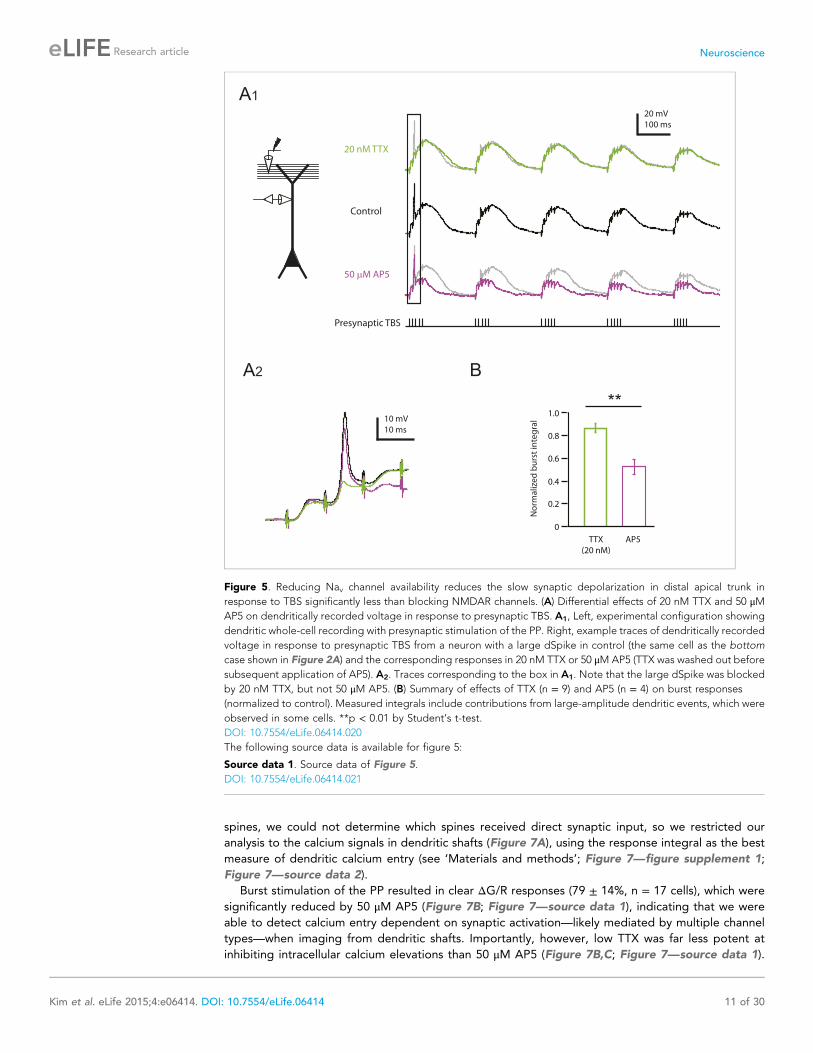
slow depolarization produced by each burst of PP→ CA1tuft EPSPs in response to TBS, whereas 50 μMAP5 had a much greater effect on the slow depolarization associated with each burst. This differential
effect of low TTX and 50 μM AP5 on the slow depolarization was confirmed in additional dendritic
recordings (n = 9; for four cases, data in TTX and AP5 were obtained from the same cell; Figure 5B;
Figure 5—source data 1). Because low TTX was a more potent inhibitor of PP → CA1tuft LTP than 50
μM AP5 (Figure 4F), these results suggest that the fast depolarization associated with Na-dSpikes is
more important for the induction of PP → CA1tuft LTP than the slow synaptic depolarization mediated
solely by EPSPs.
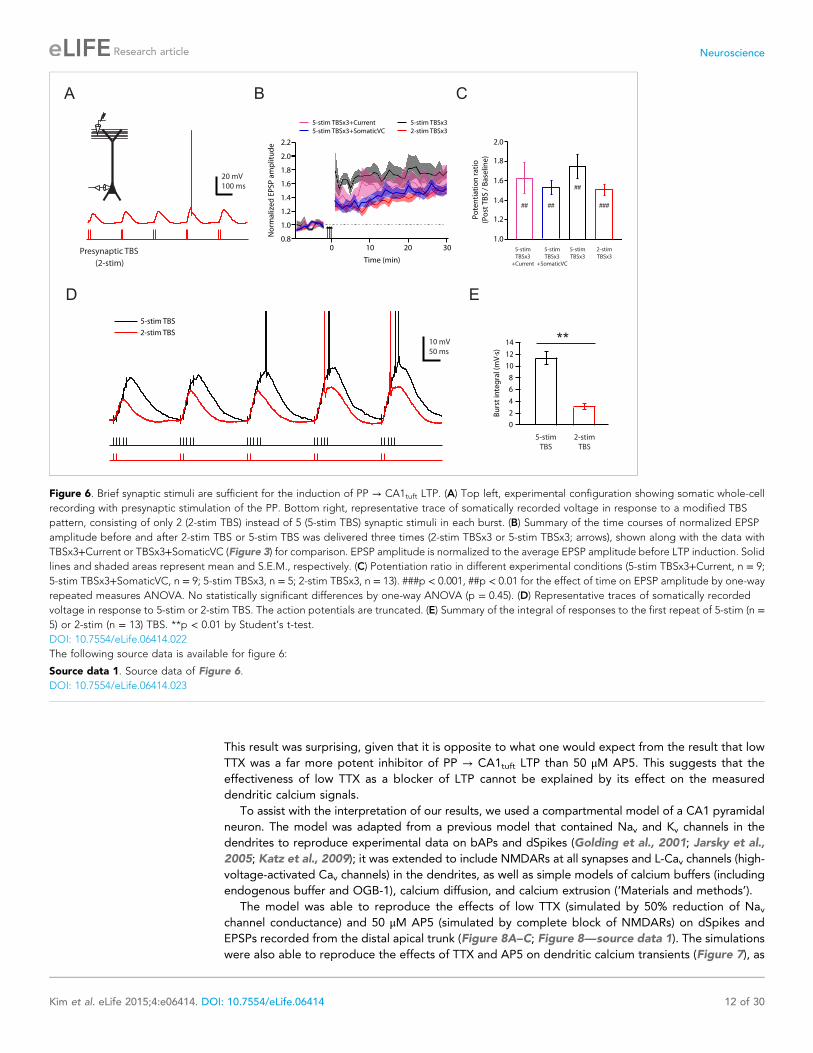
To test this conclusion further, we designed a stimulation protocol expected to have differential
effects on Na-dSpikes and slow synaptic depolarization. A modified TBS pattern consisting of only 2
stimuli in each burst (2-stim TBSx3, Figure 6A; Figure 6—source data 1) is expected to greatly
reduce the slow synaptic depolarization while preserving about 50% of Na-dSpikes (based on
Figure 2C). This 2-stim protocol induced LTP at PP → CA1tuft synapses of approximately the same
magnitude as various TBSx3 protocols consisting of 5 stimuli (5-stim) in each burst (Figure 6B,C;
Figure 6—source data 1). The 2-stim TBSx3 protocol yielded PP→ CA1tuft LTP of 82% of the average
LTP induced by all variants of the 5-stim TBSx3 protocol, despite a greatly reduced integral of the slow
depolarization (27% of that with 5-stim TBSx3; Figure 6D,E; Figure 6—source data 1).
Collectively, the results above indicate that low TTX blocks PP → CA1tuft LTP by inhibiting fast
Na-dSpikes, with minimal effect on the slow synaptic depolarization induced by each high-frequency burst
during TBS. We next turned our attention to investigating the calcium entry that links Na-dSpikes with the
induction of PP → CA1tuft LTP. Given that NMDAR and L-Cav channels are both voltage-dependent
sources of calcium entry, and they both contribute to PP → CA1tuft LTP (approximately equally, see
Figure 4F), the most parsimonious hypothesis is that Na-dSpikes are effective activators of calcium
entry via these pathways. Although LTP induction at these synapses may depend on the complex
spatiotemporal properties of calcium entry, the simplest scenario is that Na-dSpikes produce particularly
large calcium entry in synaptically activated portions of the tuft dendrites, which triggers LTP.
To test this idea, CA1 pyramidal neurons were filled with 100 μM Oregon Green 488 BAPTA-1
(OGB-1) and 50 μM Alexa Fluor 594 Hydrazide (AF-594) and imaged on a two-photon laser-scanning
microscope during stimulation of the PP with single burst of 5 stimuli at 100 Hz (‘Materials and
methods’). In these experiments, the soma was voltage-clamped at ∼ −70 mV in order to prevent
action potential firing, thus limiting detected calcium influx to that induced by synaptic events and
dendritically initiated spikes. For quantification of calcium signals, the calcium-induced change in
OGB-1 fluorescence was measured as a fraction of the baseline fluorescence of the calcium-insensitive
reference, AF-594 (ΔG/R; see ‘Materials and methods’). Although we could easily resolve dendritic
Figure 4. Continued
Source data 2. Source data of Figure 4—figure supplement 1.
DOI: 10.7554/eLife.06414.018
Figure supplement 1. L-Cav channels are not required for synaptic transmission before or after the induction of PP → CA1tuft LTP.
DOI: 10.7554/eLife.06414.019
Kim et al. eLife 2015;4:e06414. DOI: 10.7554/eLife.06414 10 of 30
Research article Neuroscience
spines, we could not determine which spines received direct synaptic input, so we restricted our
analysis to the calcium signals in dendritic shafts (Figure 7A), using the response integral as the best
measure of dendritic calcium entry (see ‘Materials and methods’; Figure 7—figure supplement 1;
Figure 7—source data 2).
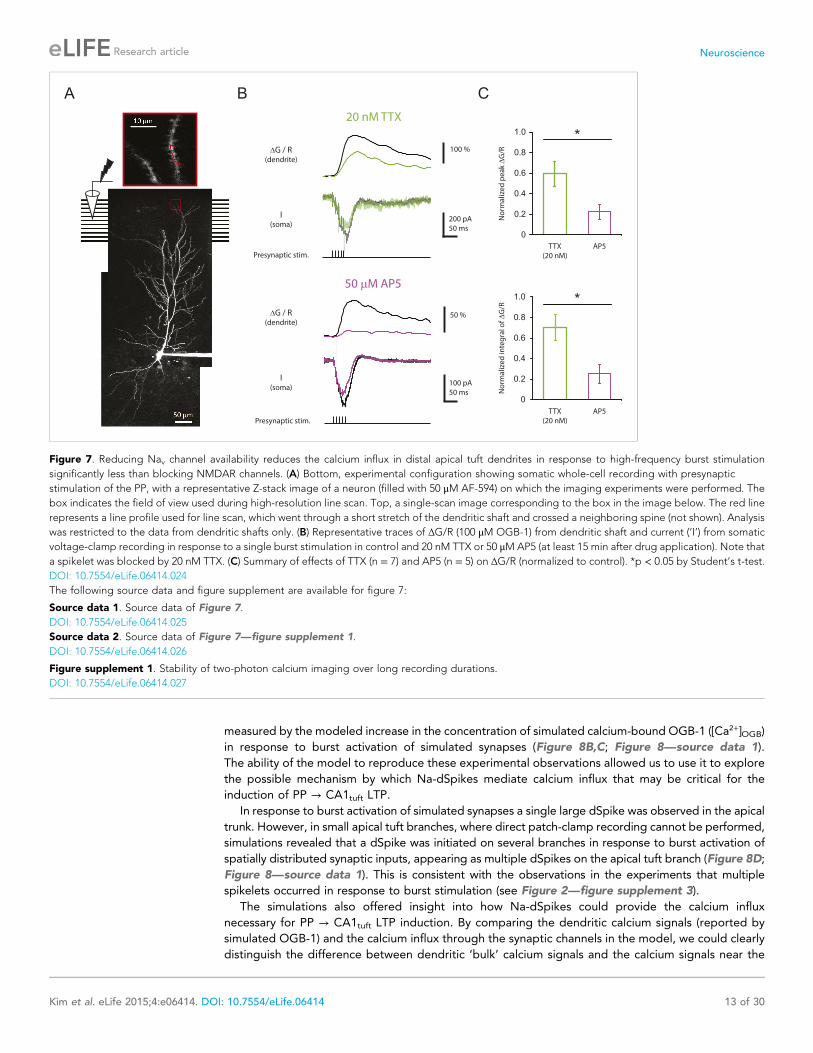
Burst stimulation of the PP resulted in clear ΔG/R responses (79 ± 14%, n = 17 cells), which were
significantly reduced by 50 μM AP5 (Figure 7B; Figure 7—source data 1), indicating that we were
able to detect calcium entry dependent on synaptic activation—likely mediated by multiple channel
types—when imaging from dendritic shafts. Importantly, however, low TTX was far less potent at
inhibiting intracellular calcium elevations than 50 μM AP5 (Figure 7B,C; Figure 7—source data 1).
Figure 5. Reducing Nav channel availability reduces the slow synaptic depolarization in distal apical trunk in
response to TBS significantly less than blocking NMDAR channels. (A) Differential effects of 20 nM TTX and 50 μMAP5 on dendritically recorded voltage in response to presynaptic TBS. A1, Left, experimental configuration showing
dendritic whole-cell recording with presynaptic stimulation of the PP. Right, example traces of dendritically recorded
voltage in response to presynaptic TBS from a neuron with a large dSpike in control (the same cell as the bottom
case shown in Figure 2A) and the corresponding responses in 20 nM TTX or 50 μM AP5 (TTX was washed out before
subsequent application of AP5). A2. Traces corresponding to the box in A1. Note that the large dSpike was blocked
by 20 nM TTX, but not 50 μM AP5. (B) Summary of effects of TTX (n = 9) and AP5 (n = 4) on burst responses
(normalized to control). Measured integrals include contributions from large-amplitude dendritic events, which were
observed in some cells. **p < 0.01 by Student’s t-test.
DOI: 10.7554/eLife.06414.020
The following source data is available for figure 5:
Source data 1. Source data of Figure 5.
DOI: 10.7554/eLife.06414.021
Kim et al. eLife 2015;4:e06414. DOI: 10.7554/eLife.06414 11 of 30
Research article Neuroscience
This result was surprising, given that it is opposite to what one would expect from the result that low
TTX was a far more potent inhibitor of PP → CA1tuft LTP than 50 μM AP5. This suggests that the
effectiveness of low TTX as a blocker of LTP cannot be explained by its effect on the measured
dendritic calcium signals.
To assist with the interpretation of our results, we used a compartmental model of a CA1 pyramidal
neuron. The model was adapted from a previous model that contained Nav and Kv channels in the
dendrites to reproduce experimental data on bAPs and dSpikes (Golding et al., 2001; Jarsky et al.,
2005; Katz et al., 2009); it was extended to include NMDARs at all synapses and L-Cav channels (high-
voltage-activated Cav channels) in the dendrites, as well as simple models of calcium buffers (including
endogenous buffer and OGB-1), calcium diffusion, and calcium extrusion (‘Materials and methods’).
The model was able to reproduce the effects of low TTX (simulated by 50% reduction of Navchannel conductance) and 50 μM AP5 (simulated by complete block of NMDARs) on dSpikes and
EPSPs recorded from the distal apical trunk (Figure 8A–C; Figure 8—source data 1). The simulations
were also able to reproduce the effects of TTX and AP5 on dendritic calcium transients (Figure 7), as
Figure 6. Brief synaptic stimuli are sufficient for the induction of PP → CA1tuft LTP. (A) Top left, experimental configuration showing somatic whole-cell
recording with presynaptic stimulation of the PP. Bottom right, representative trace of somatically recorded voltage in response to a modified TBS
pattern, consisting of only 2 (2-stim TBS) instead of 5 (5-stim TBS) synaptic stimuli in each burst. (B) Summary of the time courses of normalized EPSP
amplitude before and after 2-stim TBS or 5-stim TBS was delivered three times (2-stim TBSx3 or 5-stim TBSx3; arrows), shown along with the data with
TBSx3+Current or TBSx3+SomaticVC (Figure 3) for comparison. EPSP amplitude is normalized to the average EPSP amplitude before LTP induction. Solid
lines and shaded areas represent mean and S.E.M., respectively. (C) Potentiation ratio in different experimental conditions (5-stim TBSx3+Current, n = 9;
5-stim TBSx3+SomaticVC, n = 9; 5-stim TBSx3, n = 5; 2-stim TBSx3, n = 13). ###p < 0.001, ##p < 0.01 for the effect of time on EPSP amplitude by one-way
repeated measures ANOVA. No statistically significant differences by one-way ANOVA (p = 0.45). (D) Representative traces of somatically recorded
voltage in response to 5-stim or 2-stim TBS. The action potentials are truncated. (E) Summary of the integral of responses to the first repeat of 5-stim (n =5) or 2-stim (n = 13) TBS. **p < 0.01 by Student’s t-test.
DOI: 10.7554/eLife.06414.022
The following source data is available for figure 6:
Source data 1. Source data of Figure 6.
DOI: 10.7554/eLife.06414.023
Kim et al. eLife 2015;4:e06414. DOI: 10.7554/eLife.06414 12 of 30
Research article Neuroscience
measured by the modeled increase in the concentration of simulated calcium-bound OGB-1 ([Ca2+]OGB)
in response to burst activation of simulated synapses (Figure 8B,C; Figure 8—source data 1).
The ability of the model to reproduce these experimental observations allowed us to use it to explore
the possible mechanism by which Na-dSpikes mediate calcium influx that may be critical for the
induction of PP → CA1tuft LTP.
In response to burst activation of simulated synapses a single large dSpike was observed in the apical
trunk. However, in small apical tuft branches, where direct patch-clamp recording cannot be performed,
simulations revealed that a dSpike was initiated on several branches in response to burst activation of
spatially distributed synaptic inputs, appearing as multiple dSpikes on the apical tuft branch (Figure 8D;
Figure 8—source data 1). This is consistent with the observations in the experiments that multiple
spikelets occurred in response to burst stimulation (see Figure 2—figure supplement 3).
The simulations also offered insight into how Na-dSpikes could provide the calcium influx
necessary for PP → CA1tuft LTP induction. By comparing the dendritic calcium signals (reported by
simulated OGB-1) and the calcium influx through the synaptic channels in the model, we could clearly
distinguish the difference between dendritic ‘bulk’ calcium signals and the calcium signals near the
Figure 7. Reducing Nav channel availability reduces the calcium influx in distal apical tuft dendrites in response to high-frequency burst stimulation
significantly less than blocking NMDAR channels. (A) Bottom, experimental configuration showing somatic whole-cell recording with presynaptic
stimulation of the PP, with a representative Z-stack image of a neuron (filled with 50 μM AF-594) on which the imaging experiments were performed. The
box indicates the field of view used during high-resolution line scan. Top, a single-scan image corresponding to the box in the image below. The red line
represents a line profile used for line scan, which went through a short stretch of the dendritic shaft and crossed a neighboring spine (not shown). Analysis
was restricted to the data from dendritic shafts only. (B) Representative traces of ΔG/R (100 μM OGB-1) from dendritic shaft and current (‘I’) from somatic
voltage-clamp recording in response to a single burst stimulation in control and 20 nM TTX or 50 μM AP5 (at least 15 min after drug application). Note that
a spikelet was blocked by 20 nM TTX. (C) Summary of effects of TTX (n = 7) and AP5 (n = 5) on ΔG/R (normalized to control). *p < 0.05 by Student’s t-test.
DOI: 10.7554/eLife.06414.024
The following source data and figure supplement are available for figure 7:
Source data 1. Source data of Figure 7.
DOI: 10.7554/eLife.06414.025
Source data 2. Source data of Figure 7—figure supplement 1.
DOI: 10.7554/eLife.06414.026
Figure supplement 1. Stability of two-photon calcium imaging over long recording durations.
DOI: 10.7554/eLife.06414.027
Kim et al. eLife 2015;4:e06414. DOI: 10.7554/eLife.06414 13 of 30
Research article Neuroscience

Figure 8. Computational modeling reveals a large, rapid, Na-dSpike-mediated calcium current through NMDAR
and L-Cav channels. (A) Left, Z-stack image of a neuron (filled with 50 μM AF-594). Right, morphology of the model
neuron. Red dots indicate the locations of simulated synapses. Arrow indicates the imaged compartment with
a simulated synapse (blue dot) for the example shown in B and D. (B) Representative traces of simulated voltage
recorded from the distal apical trunk and concentration of calcium-bound OGB-1 ([Ca2+]OGB) recorded from
a compartment with a simulated synapse on the distal apical tuft (as indicated in A) in response to a single burst
Figure 8. continued on next page
Kim et al. eLife 2015;4:e06414. DOI: 10.7554/eLife.06414 14 of 30
Research article Neuroscience

mouth of channels. Simulations at the synapses revealed that the largest instantaneous calcium currents
(ICa) through NMDAR and L-Cav channels were mediated by locally generated Na-dSpikes, owing to
efficient relief of magnesium block of NMDAR channels and strong activation of L-Cav channels,
respectively (Figure 8D; Figure 8—source data 1). These simulations, combined with the experimental
results, suggest that a large, rapid, Na-dSpike-mediated component of calcium entry may produce
transient, localized increases in intracellular calcium concentration that are essential for the induction of
TBS-induced PP → CA1tuft LTP. To further test this model, we experimentally tested two predictions.
First, we posited that blocking L-Cav channels, which inhibits LTP by ∼50%, would have minimal
effect on measurements of bulk calcium entry in the distal apical dendrites, as indicated in our model
(Figure 8—figure supplement 1D–F; Figure 8—source data 2; see also Tsay et al., 2007). Indeed, we
found that 10 μM nimodipine did not have a significant effect on dendritic calcium responses during
burst stimulation of the PP (Figure 8—figure supplement 1A–C; Figure 8—source data 2). This result
is consistent with our hypothesis that L-Cav channels contribute to the induction of PP→ CA1tuft LTP by
mediating increases in localized calcium near the channel pores rather than in dendritic bulk calcium.
Second, we posited that LTP would be inhibited by chelating intracellular calcium, but only when the
buffering kinetics were fast enough to disrupt localized calcium signaling close to the channel pores (see
‘Discussion’). 1,2-Bis(2-aminophenoxy)ethane-N,N,N’,N’-tetraacetic acid (BAPTA) has a much faster
calcium binding kinetics than ethylene glycol-bis(2-aminoethylether)-N,N,N’,N’-tetraacetic acid (EGTA)
(Tsien, 1980), and we therefore tested this hypothesis by buffering cytoplasmic calcium elevations with
either a relatively low or high concentration of EGTA or BAPTA (Maravall et al., 2000; Henneberger
et al., 2010), while maintaining the basal calcium concentration at 50 nM by adding an appropriate
amount of CaCl2 (‘Materials and methods’). We predicted that only a high concentration of BAPTA should
buffer intracellular calcium increases rapidly and effectively enough to block PP→ CA1tuft LTP, and this was
indeed found to be the case (Figure 9; Figure 9—source data 1). These results suggest that NMDAR and
L-Cav channels contribute to the induction of TBS-induced PP → CA1tuft LTP by mediating calcium influx,
and are consistent with the hypothesis that it is the large, transient, localized increases in intracellular
calcium concentration mediated by Na-dSpikes that are critical for this form of LTP.
DiscussionOur strategy of partially blocking Nav channels with a low concentration of TTX was designed to test
the hypothesis that Na-dSpikes are important contributors to the postsynaptic depolarization
required for TBS-induced LTP of PP synapses in the distal tuft of CA1 pyramidal neurons. The results
Figure 8. Continued
stimulation in control and simulated 20 nM TTX or 50 μM AP5. (C) Summary of the simulations and a comparison
with the experiments in Figures 5, 7. The bar graphs show mean ± S.D. (normalized to control; S.D. was used to
emphasize the distribution and variability of the drug effects across different imaging locations). For normalized
peak amplitude, only the cell with a dSpike initiated presumably the closest to and actively propagating to
the recording electrode in our dendritic recordings (Figure 5A) is illustrated for comparison. For normalized
peak Δ[Ca2+]OGB and normalized integral of Δ[Ca2+]OGB, data were pooled from all the compartments on the
distal apical tuft (the number of compartments = 440), to mimic the experimental condition in which the imaging
locations were arbitrarily selected. (D) Representative traces of simulated voltage and instantaneous fractional
calcium current through NMDAR channels (ICa, NMDA) and L-Cav channels (ICa, L-Cav). Modeled voltages and
currents are from a compartment with a simulated synapse on the distal apical tuft (as indicated in A) in response
to a single burst stimulation in control and simulated 20 nM TTX or 50 μM AP5. Note the presence of a spikelet
(asterisk), which was due to a Na-dSpike initiated in a neighboring dendritic branch and failing to propagate
reliably to the recorded branch.
DOI: 10.7554/eLife.06414.028
The following source data and figure supplement are available for figure 8:
Source data 1. Source data of Figure 8.
DOI: 10.7554/eLife.06414.029
Source data 2. Source data of Figure 8—figure supplement 1.
DOI: 10.7554/eLife.06414.030
Figure supplement 1. Minimal effect of blocking L-Cav channels on the calcium influx in distal apical tuft dendrites is
consistent with the prediction of the model.
DOI: 10.7554/eLife.06414.031
Kim et al. eLife 2015;4:e06414. DOI: 10.7554/eLife.06414 15 of 30
Research article Neuroscience
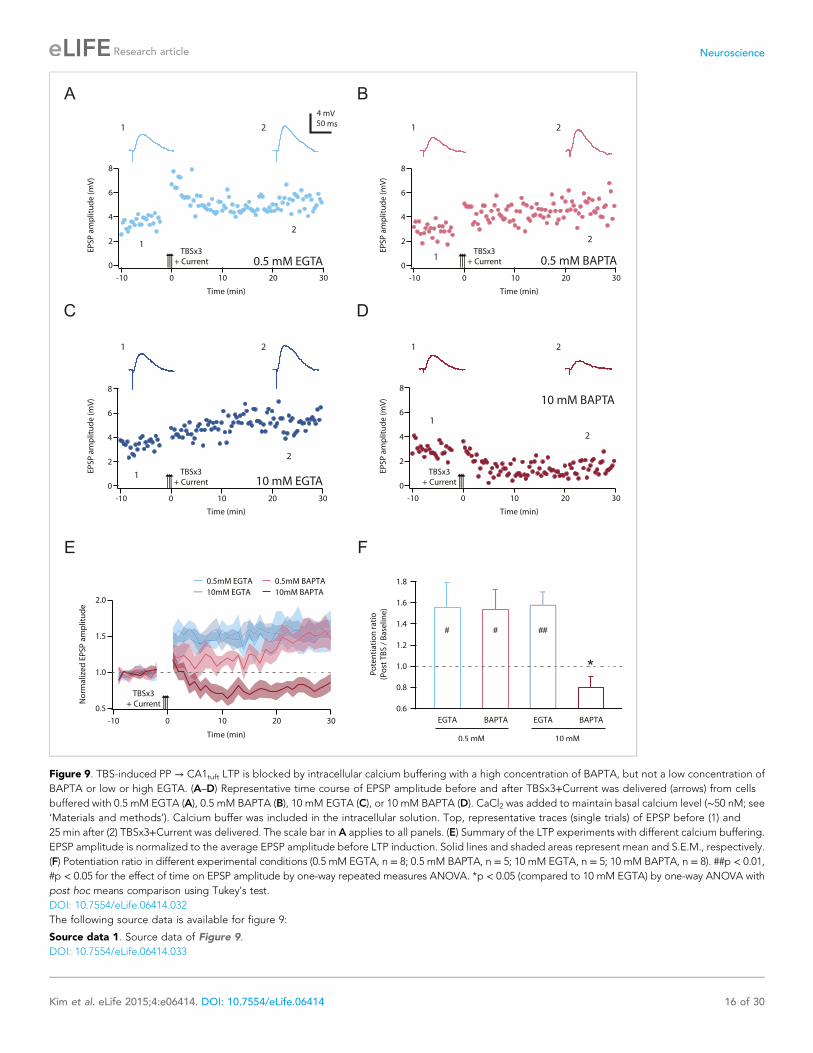
Figure 9. TBS-induced PP → CA1tuft LTP is blocked by intracellular calcium buffering with a high concentration of BAPTA, but not a low concentration of
BAPTA or low or high EGTA. (A–D) Representative time course of EPSP amplitude before and after TBSx3+Current was delivered (arrows) from cells
buffered with 0.5 mM EGTA (A), 0.5 mM BAPTA (B), 10 mM EGTA (C), or 10 mM BAPTA (D). CaCl2 was added to maintain basal calcium level (∼50 nM; see
‘Materials and methods’). Calcium buffer was included in the intracellular solution. Top, representative traces (single trials) of EPSP before (1) and
25 min after (2) TBSx3+Current was delivered. The scale bar in A applies to all panels. (E) Summary of the LTP experiments with different calcium buffering.
EPSP amplitude is normalized to the average EPSP amplitude before LTP induction. Solid lines and shaded areas represent mean and S.E.M., respectively.
(F) Potentiation ratio in different experimental conditions (0.5 mM EGTA, n = 8; 0.5 mM BAPTA, n = 5; 10 mM EGTA, n = 5; 10 mM BAPTA, n = 8). ##p < 0.01,
#p < 0.05 for the effect of time on EPSP amplitude by one-way repeated measures ANOVA. *p < 0.05 (compared to 10 mM EGTA) by one-way ANOVA with
post hoc means comparison using Tukey’s test.
DOI: 10.7554/eLife.06414.032
The following source data is available for figure 9:
Source data 1. Source data of Figure 9.
DOI: 10.7554/eLife.06414.033
Kim et al. eLife 2015;4:e06414. DOI: 10.7554/eLife.06414 16 of 30
Research article Neuroscience
support this hypothesis, as this manipulation resulted in block of PP → CA1tuft LTP. The completeness
of the block further suggests that Na-dSpikes are a critical component of the LTP induction process at
these synapses.
Key findings and interpretationOur results advance our understanding of the mechanisms underlying PP → CA1tuft LTP induction
in three important ways. First, whereas previous evidence for the role of dSpikes in the induction of
PP → CA1tuft LTP (Golding et al., 2002) was correlative (stimuli that evoked dSpikes also induced
LTP, while stimuli that failed to evoke dSpikes also failed to induce LTP), this work supports a more
direct causal link between the occurrence of dSpikes and the induction of PP → CA1tuft LTP.
Second, our results firmly establish a role for dendritic Nav channels in the induction of PP→CA1tuft LTP.
Previously observed correlations between dSpikes and PP → CA1tuft LTP (Golding et al., 2002) could not
discern whether the relevant dSpikes were mediated by Nav, Cav, or NMDAR channels. One possibility is
that these channels could be activated in concert and support relevant dendritic plateau potentials via
a ‘spike-chain mechanism’ (Schiller et al., 2000) to trigger PP → CA1tuft LTP, but our results suggest that
Na-dSpikes are the major contributors, and slow NMDAR-dependent synaptic depolarization is neither
sufficient nor necessary for LTP at these synapses (Figures 5, 6). Our evidence for the necessity of
Na-dSpikes in synaptic plasticity adds to the list of important functions of dendritic Nav channels, which also
includes contributions to synaptic integration leading to action potential initiation and a central role in
action potential backpropagation (Stuart and Sakmann, 1994; Golding et al., 2001; Larkum and Nevian,
2008; Spruston, 2008).
Third, our results provide insight into the mechanisms by which Na-dSpikes are coupled to the
induction of LTP through calcium influx at PP → CA1tuft synapses, as discussed in detail below. The
block of LTP only by the fast calcium chelator BAPTA strongly supports the hypothesis that the large,
localized increases in intracellular calcium concentration are necessary for the induction of PP→ CA1tuftLTP. This is in interesting contrast to the block of LTP also by the slow calcium chelator EGTA at the
more proximal Schaffer collateral synapses of CA1 pyramidal neurons (Lynch et al., 1983), which
suggests a different underlying mechanism for the calcium dependence of LTP at these synapses.
The most parsimonious explanation for our results is that the effective block of LTP by low TTX is
through the inhibition of Na-dSpikes per se; however, a few alternative interpretations should be
considered. For example, LTP induction could depend on a non-ionic mechanism directly coupled to
the conformational changes of Nav channels or an ionic mechanism mediated by sodium flux through
them (but little has been reported regarding these speculative mechanisms). Alternatively, during
synaptic activation, Nav channels may affect membrane potential and calcium entry in spines
independently of dSpikes (Araya et al., 2007; Bloodgood and Sabatini, 2007; note that blocking Navchannels enhanced synaptic calcium influx in Bloodgood and Sabatini, 2007). Finally, TTX may have
a presynaptic effect, as presynaptic sodium has been shown to regulate synaptic strength
constitutively at the Calyx of Held (Huang and Trussell, 2014). A few observations argue against
these possibilities, such as the lack of effect of low TTX on synaptic responses at PP → CA1tuftsynapses (Figure 1), the strong correlation between dSpikes and PP → CA1tuft LTP (Golding et al.,
2002) and the reduction in Na-dSpikes that accompanies the block of PP → CA1tuft LTP by low TTX
(Figures 2, 3). However, additional experiments would be required to test these alternative
possibilities directly.
Mechanisms for coupling Na-dSpikes to the induction ofPP → CA1tuft LTPThe finding that Na-dSpikes play such a critical role in the induction of PP → CA1tuft LTP is somewhat
surprising, given the brief duration of these Na-dSpikes compared to slow depolarization mediated by
EPSPs, Ca-dSpikes, or NMDA-dSpikes. The fact that simultaneously blocking NMDAR and L-Cavchannels eliminated PP → CA1tuft LTP (Golding et al., 2002; Remondes and Schuman, 2003; Ahmed
and Siegelbaum, 2009) suggests that Na-dSpikes contribute to the induction of PP → CA1tuft LTP by
increasing calcium influx through these channels. But how does this work, given that Na-dSpikes have
a brief duration and thus a limited contribution to the increase in ‘bulk’ calcium concentration (i.e., the
calcium measurable with the spatiotemporal resolution provided by imaging with calcium-sensitive
dyes) compared to slow synaptic depolarization?
Kim et al. eLife 2015;4:e06414. DOI: 10.7554/eLife.06414 17 of 30
Research article Neuroscience

A simple explanation, supported by our modeling (Figure 8) and the subsequent experiments
(Figure 9), is that the calcium influx during Na-dSpikes (via NMDAR and L-Cav channels) is vigorous
and brief, whereas the calcium influx during slow synaptic depolarization (via NMDAR channels) is
smaller, but longer lasting. Although the latter ultimately contributes more to the total amount of
calcium entry during a burst and comprises the vast majority of the bulk calcium measured with
dendritic calcium imaging, the vigorous and brief calcium entry during Na-dSpikes is more critical for
the induction of PP → CA1tuft LTP.
During TBS, Na-dSpikes produce the largest voltage excursions and maximize ICa through both
NMDAR and L-Cav channels (Figure 10). Activation of NMDAR channels is strongly voltage
dependent (through voltage-dependent magnesium block) as is activation of L-Cav channels (through
high-voltage-activated conformational changes). Thus, these calcium-permeable channels that we
implicate in PP → CA1tuft LTP are activated more by the Na-dSpike than by the slow synaptic
depolarization. The large ICa caused by the Na-dSpike produces a brief, high calcium concentration
near the mouth of the channels, which will quickly diffuse away and contribute modestly to the bulk
calcium concentration in the rest of the dendritic spine and shaft. On the other hand, most of the bulk
calcium is generated by the smaller, but longer-lasting flux of calcium through the NMDAR channels
activated during the slow synaptic depolarization. The calcium concentration near the mouth of the
channels is proportional to the instantaneous amplitude of ICa, while the bulk calcium concentration is
proportional to the time integral of ICa through the calcium-permeable channels (Augustine et al.,
2003; Eggermann et al., 2012; Tadross et al., 2013).
The efficacy of low TTX as a blocker of LTP by inhibiting Na-dSpikes could be explained by the
existence of a calcium sensor near the channels that triggers a series of LTP-inducing biochemical
events (Figure 10). The affinity and co-operativity of the calcium sensor would have to be matched to
BAMPA receptor
NMDA receptor L-Ca channelv
Na channelv
2+Ca sensor(required for LTP)
Na+
Na+
2+Ca
Na+
Na-dSpike
Na+ 2+Ca
A
Glutamate
3
3
2
2
1
1
4
4
Na+Na+
synapticcurrent
from otherspines
2 µA/cm2
0.5 pA
10 ms
15 mV
I Ca (NMDA)
I Ca (L-Cav)
Vm
*
synapticcurrent
from otherspines
Figure 10. Proposed model for the critical role of Na-dSpikes in the induction of PP → CA1tuft LTP. (A) Synaptic
membrane potential and calcium currents in response to a high-frequency burst activation of glutamatergic
synapses (re-plotted from Figure 8D). (1) AMPA-/NMDA-EPSP, (2) Na-dSpike, (3) ICa through NMDAR channels, (4)
ICa through L-Cav channels. Note also the presence of a spikelet (asterisk). (B) Schematic illustration of the events
leading to the induction of PP → CA1tuft LTP. Strong activation of PP → CA1tuft synapses results in EPSPs (1) and, on
some trials, subsequently leads to initiation of Na-dSpikes (2). The locally generated Na-dSpike mediates the largest
ICa through both NMDAR channels (3) and L-Cav channels (4), thus resulting in a high, localized calcium
concentration near the mouth of the channels (dark red), which activates a series of biochemical events necessary for
the induction of LTP. This intracellular calcium diffuses away, contributing only modestly to the ‘bulk’ calcium
concentration throughout the dendritic spine and shaft (pink), which is eventually removed from the cytoplasm by
pumps in the plasma membrane and in organelles such as the endoplasmic reticulum. In contrast, the smaller,
longer-lasting ICa through NMDAR channels generated during the slow synaptic depolarization produces a lower
localized calcium concentration near the channel pore, but contributes more to the bulk calcium concentration.
DOI: 10.7554/eLife.06414.034
Kim et al. eLife 2015;4:e06414. DOI: 10.7554/eLife.06414 18 of 30
Research article Neuroscience
the spatiotemporal features of the calcium concentration profiles near the mouths of NMDAR and
L-Cav channels in response to TBS. The affinity of the sensor would need to be relatively low, in order to
respond only to the high calcium concentration near the calcium-conducting pores during a large Na-
dSpike. As our model predicts a modest increase in peak ICa (proportional to local calcium
concentration) during a dSpike, relative to the slow synaptic depolarization, it is likely that the sensor
would also need high cooperativity in order to respond selectively during the dSpike. Importantly,
experimentally observed Hill coefficients are indeed high enough for this operation; for example,
assuming a Hill coefficient of 4, a modest dSpike-driven difference in peak ICa (∼twofold; Figure 8)
would increase calcium sensor activation from 20% to 80%. The identities of the calcium sensors and the
downstream biochemistry leading to LTP induction are the subjects of ongoing research (Amici et al.,
2009), but calmodulin may have the properties necessary to serve this function, namely low affinity,
rapid binding kinetics, and high cooperativity for calcium binding (Faas et al., 2011). Calmodulin has
been postulated to be the initial calcium sensor coupled to other key LTP-inducing molecules such as
calcium/calmodulin-dependent protein kinase II (Bradshaw et al., 2003; Lisman et al., 2012).
Alternatively, Na-dSpikes might couple activation of NMDAR or L-Cav channels to LTP via
mechanisms that operate independently of postsynaptic calcium influx or in concert with it. For
example, it is well known that the gating of L-Cav channels is coupled to muscle contraction
independently of calcium flux through the channels and that similar mechanisms may exist in neurons
(Kaczmarek, 2006). Indeed, activation of NMDARs in the absence of calcium influx through the
channels has been suggested to be sufficient for induction of long-term depression (LTD; Nabavi
et al., 2013; but see Babiec et al., 2014). In keeping with this possibility, we observed LTD in neurons
buffered with 10 mM BAPTA. However, the block of LTP by intracellular calcium buffering (Figure 9)
suggests that NMDAR and L-Cav channels contribute to the induction of PP → CA1tuft LTP by their
ionotropic rather than metabotropic functions. Moreover, high-frequency stimulation of PP →CA1tuft synapses has been shown to result in LTP expression mediated by functional upregulation
of presynaptic Cav channels (Ahmed and Siegelbaum, 2009), but the lack of effect of nimodipine
on synaptic responses after LTP induction (Figure 4—figure supplement 1) indicates that the
effect of nimodipine on TBS-induced PP → CA1tuft LTP cannot be explained by the block of
a presynaptic expression mechanism mediated by L-Cav channels. Nevertheless, we cannot rule
out a possible role of presynaptic NMDARs in LTP induction (Kunz et al., 2013).
The requirement for Na-dSpikes has interesting functional implications for PP → CA1tuft LTP. The
activation of multiple synapses on a single dendritic branch leads to initiation of a dSpike (Losonczy
and Magee, 2006), but dSpikes tend to fail at branch points (Spruston, 2008; Katz et al., 2009).
Thus, the spatial extent of a Na-dSpike-dependent LTP event may be restricted to a particular
dendritic branch, or even a segment of a branch containing the synapses that contribute to initiation
of a Na-dSpike. If true, such compartmentalization of plasticity (Losonczy et al., 2008; Makara et al.,
2009; Makino and Malinow, 2011) would have substantial implications for the granularity of
associations learned at the dendritic level, and consequently, the information-carrying capacity of
a pyramidal neuron, as information may be stored discretely in individual dendritic branches or
segments, rather than in an entire neuron (Poirazi and Mel, 2001; Mehta, 2004; Wu and Mel, 2009).
Comparison to other forms of LTPThere are many forms of LTP, so it is not clear how general the requirement for Na-dSpikes will prove
to be, even at the same synapses but with a different induction protocol. PP → CA1tuft LTP has also
been reported to occur in response to combined activation of the PP and the more proximal Schaffer
collaterals (SCs; Takahashi and Magee, 2009). In those experiments, dendritic Nav channels would be
critical because bAPs were necessary to trigger calcium plateau potentials (a form of Ca-/NMDA-
dSpike) that induced LTP. For this reason, it may prove difficult to disentangle the contributions of
dendritic regenerative events mediated primarily by dendritic Nav channels (such as Na-dSpikes and
bAPs) from dendritic regenerative events mediated by other channels (such as Ca- and NMDA-
dSpikes) to the induction of PP → CA1tuft LTP with this paradigm. Moreover, although NMDARs and
R-type Cav channels were shown to be important for this form of LTP (Takahashi and Magee, 2009),
the role of dendritic L-Cav channels is unclear. L-Cav channels were not required for plateau potentials,
but whether their activation by plateau potentials contributes to the induction of this form of PP →CA1tuft LTP has not been tested.
Kim et al. eLife 2015;4:e06414. DOI: 10.7554/eLife.06414 19 of 30
Research article Neuroscience
Given the remarkable capacity of the brain to store information, it is no surprise that there are many
different forms of LTP. Thus, we expect our findings generalize to some synapses but not others. For
example, LTP has been induced at SC synapses on CA1 pyramidal neurons using many different
protocols, such as those that produce synaptic depolarization alone, without bAPs or dSpikes
(Gustafsson et al., 1987; Isaac et al., 1995; Liao et al., 1995; Han and Heinemann, 2013). Another
interesting form of LTP at SC synapses depends on an instructive signal from coincident PP activation
(Dudman et al., 2007). This form of LTP does not depend on bAPs or dSpikes either, but is mediated
by endocannabinoid release from dendrites, induced by summation of EPSPs from both pathways,
which ultimately downregulates feedforward inhibition (Xu et al., 2012; Basu et al., 2013). At these
same SC synapses, other forms of LTP have been reported to depend on postsynaptic action potential
firing, presumably via bAPs (Magee and Johnston, 1997; Thomas et al., 1998; Wittenberg and
Wang, 2006; Buchanan and Mellor, 2007). Still other forms of LTP at SC synapses, however, are
correlated with the initiation of dSpikes (Remy and Spruston, 2007; Hardie and Spruston, 2009), but
it is unclear what role Na-dSpikes play, relative to Ca-dSpikes or NMDA-dSpikes.
At excitatory synapses on other cell types, LTP has been reported to result from a range of
postsynaptic mechanisms (Gordon et al., 2006; Holthoff et al., 2006; Kampa et al., 2007; Froemke
et al., 2010; Hsu et al., 2010, 2012; Brandalise and Gerber, 2014). Importantly, however, a recent
study demonstrated that rhythmic whisker stimulation induced LTP in somatosensory cortex, even
when the stimulus did not drive somatic action potential firing (Gambino et al., 2014). Thus, LTP can
occur in vivo, in response to naturalistic simulation, even in the absence of axo-somatic spiking.
Nevertheless, action potentials and bAPs are likely to be important for other forms of synaptic
plasticity. The diversity of LTP induction mechanisms is likely to contribute to the powerful learning
capacity of the brain.
A potential role for Na-dSpikes in cognition at multiple timescalesIn summary, the experiments presented here argue for a critical, causal role of dendritic Nav channels,
by triggering Na-dSpikes, in the induction of PP → CA1tuft LTP. With this conclusion, we have now
established possible functional roles for Na-dSpikes not only in the rapid, moment-to-moment
processing of internal and external information (by influencing synaptic integration; Golding and
Spruston, 1998; Jarsky et al., 2005; Losonczy and Magee, 2006; Katz et al., 2009), but also in the
long-term storage of this information (by a Na-dSpike-dependent form of LTP). Dendritic Navchannels were previously known to contribute to the cellular basis of memory by mediating forms of
LTP that require action potential backpropagation. In this case, the Hebbian plasticity rule—‘neurons
that fire together wire together’—is implemented by bAPs. Our results suggest that dendritic Navchannels can also contribute to memory formation via a critical role for Na-dSpikes in some forms of
LTP. Our view is that this form of LTP is Hebbian on a finer spatial scale, for which the rule can be
rephrased as ‘neurites that fire together wire together’. Dendritic Nav channels play a central role in
the cellular implementation of this rule, by determining which postsynaptic neurites fire.
Materials and methods
Slice preparationAll animal procedures were approved by the Animal Care and Use Committees at the HHMI Janelia
Research Campus and Northwestern University. 3- to 7-week-old male Wistar rats were decapitated
under deep isoflurane anesthesia, and the brain was transferred to an ice-cold dissection solution
containing (in mM): 110 Choline-Cl, 0.2 NaCl, 2.5 KCl, 1.25 NaH2PO4, 25 NaHCO3, 15 Dextrose, 2.4
Na-Pyruvate, 1.3 Na-Ascorbate, 0.5 CaCl2, 3 MgCl2 (pH 7.4, oxygenated with 95% CO2 and 5% O2).
300- to 350-μm thick, near-horizontal slices were sectioned using a vibrating tissue slicer (Vibratome
3000, The Vibratome Company, St. Louis, MO; or Leica VT 1200S, Leica Microsystems, Wetzlar,
Germany). CA3 and superficial layers of the entorhinal cortex were removed to limit polysynaptic
activation. The slices were transferred to a suspended mesh within a chamber filled with artificial
cerebrospinal fluid (ACSF) containing (in mM): 119 NaCl, 2.5 KCl, 1.25 NaH2PO4, 25 NaHCO3, 25
Dextrose, 2 CaCl2, 1 MgCl2 (3 Na-Pyruvate, 1 Na-Ascorbate were added when two-photon imaging
experiments were performed; pH 7.4, oxygenated with 95% CO2 and 5% O2). After 30 min of
incubation at 35˚C, the chamber was maintained at room temperature.
Kim et al. eLife 2015;4:e06414. DOI: 10.7554/eLife.06414 20 of 30
Research article Neuroscience
Whole-cell recording and stimulationAll recordings were performed using slices submerged in the recording chamber of an Axioskop 2 (Carl
Zeiss Microscopy, Jena, Germany) or SliceScope (Scientifica, East Sussex, UK) upright microscope
constantly perfused with oxygenated ACSF at 33–35˚C. SR-95531 (2 μM) and CGP 52432 (1 μM) were
added to block GABAA and GABAB receptors, respectively. Patch pipettes were pulled from thick-wall
borosilicate glass and fire polished, resulting in resistance of 3–5 MΩ and 7–9 MΩ for somatic
and dendritic recording, respectively, when filled with intracellular solution containing (in mM):
115 K-Gluconate, 20 KCl, 10 Na2-phosphocreatin, 10 HEPES, 4 Mg-ATP, 0.3 Na-GTP, and 0.1% biocytin.
When EGTA or BAPTA was included in the intracellular solution, the basal level of cytoplasmic
calcium concentration (∼50 nM for CA1 pyramidal neurons; Maravall et al., 2000; Henneberger et al.,
2010) was maintained by adding CaCl2 to the intracellular solution, calibrated based on the mass-action
reactions between calcium ion and the particular calcium chelator used (calculated with MaxChelator by
Chris Patton, http://web.stanford.edu/∼cpatton/webmaxc/webmaxcS.htm). The dissociation constant
(Kd) for Ca2+ at 33˚C with the ionic strength 0.16 N, pH 7.3 is 91.7 and 229 nM for EGTA and BAPTA,
respectively. The concentrations of calcium chelator and CaCl2 included are (in mM) 0.18 CaCl2 for
0.5 EGTA; 3.53 CaCl2 for 10 EGTA; 0.09 CaCl2 for 0.5 BAPTA; 1.79 CaCl2 for 10 BAPTA.
Dendritic recordings were obtained 200–320 μm away from the soma. Patch pipette series
resistance was always lower than 50 MΩ. Recordings were made using a Dagan BVC-700A amplifier
(Dagan Corporation, Minneapolis, MN). Data were low-pass filtered at 3 or 5 kHz and digitized at
50 kHz via an ITC18 digital-analog converter (HEKA Instruments Inc., Bellmore, NY) under control of
custom macros programmed in IGOR Pro (Wavemetrics, Lake Oswego, OR).
For synaptic stimulation, theta-glass or capillary micropipettes (∼40–50 μm in diameter) filled with
ACSF were used for bipolar or monopolar stimulation via a stimulus isolator (BSI-950, Dagan
Corporation; or Model 4AD, Getting Instruments, San Diego, CA), placed in stratum lacunosum-
moleculare (SLM) ∼200–300 μm away (usually toward subiculum) from the recorded neuron. For LTP
induction, stimulus intensities were set to give EPSP amplitudes of 2–5 mV in somatic recordings and
4–10 mV in dendritic recordings, consistent with approximately 50% attenuation of EPSPs between
the dendrite (200–300 μm from the soma) and the soma (Golding et al., 2005). For testing the effects
of 20 nM TTX on synaptic transmission (Figure 1), a larger range of stimulus intensities (giving EPSP
amplitudes of 3–10 mV in somatic recordings) was used. PP→ CA1tuft EPSPs were monitored every 20
s, and interleaved test pulses were used to monitor the recording quality (series resistance, bridge
balance, pipette capacitance compensation) and the input resistance of the cell throughout the
experiment. To induce PP → CA1tuft LTP, we used TBS, which consisted of five burst stimuli grouped
at 5 Hz, with each consisting of 5 synaptic stimuli at 100 Hz. This stimulus was repeated three times
(TBSx3), at 30-s intervals. Each TBS was delivered under one of the following three conditions:
(1) paired with brief (2 ms) somatic current injections at 50 Hz to evoke 3 action potentials during each
burst (TBSx3+Current), (2) with the soma voltage-clamped at −68 to −70 mV (TBSx3+SomaticVC), or
(3) alone (5-stim TBSx3). In most cases of somatic voltage clamp, the soma was clamped well enough
to prevent action potential firing in response to TBS; however, in three cases, escape spikes were
observed, so these experiments were rejected from the dataset.
For pharmacological experiments, PP → CA1tuft EPSP amplitude was monitored before and
10 min after bath application of drugs to confirm that synaptic transmission was unaffected. To block
NMDARs, the D-isomer of AP5 was used to maximize the effect (Watkins and Olverman, 1987;
Morris, 1989). Notably, 50 μM AP5 alone inhibited LTP as much as the combination of AP5 and
MK-801 used in our previous work (Golding et al., 2002; Remy and Spruston, 2007), suggesting that
the limited block of LTP by AP5 could not be attributed to glutamate competing away binding of AP5
to NMDARs. When EGTA or BAPTA was included in the intracellular solution, cells were dialyzed for
at least 20–25 min before the LTP induction protocol was applied.
For antidromic stimulation, bath application of CNQX (10 μM) and AP5 (50 μM) was used to block
ionotropic glutamate receptors (in addition to the GABA receptor blockers included in all
experiments), and a stimulating electrode (as described above) was placed in stratum oriens,
∼20–50 μm away from the recorded neuron. Several different stimulus intensities were used to trigger
action potentials antidromically.
In some experiments (Figure 1), 10 μM TTX was applied manually via pressure through a patch
pipette positioned near the soma. To limit TTX diffusion toward the apical dendrites, slices were
Kim et al. eLife 2015;4:e06414. DOI: 10.7554/eLife.06414 21 of 30
Research article Neuroscience

positioned to have bath flow directed from the apical dendrites toward the soma. During perisomatic
TTX application, EPSP amplitude was monitored and remained unchanged. In one experiment, action
potentials were not completely eliminated in response to burst stimulation, so it was excluded from
the analysis of burst responses (but not from the analysis of single-shock EPSPs).
Nickel chloride (Ni2+), SR-95531, 6-cyano-7-nitroquinoxaline-2,3-dione disodium salt hydrate
(CNQX), biocytin, sodium pyruvate, (+)-sodium L-ascorbate, phosphocreatine disodium, adenosine
5’-triphosphate magnesium (Mg-ATP), guanosine 5’-triphosphate sodium (Na-GTP), 4-(2-hydroxyethyl)
piperazine-1-ethanesulfonic acid (HEPES), potassium D-gluconate, dextrose, and choline chloride were
from Sigma–Aldrich (St. Louis, MO). Calcium chloride and magnesium chloride were from Fluka
(St. Louis, MO) or Sigma–Aldrich. D-(−)-2-amino-5-phosphonopentanoic acid (D-AP5), tetrodotoxin
citrate (TTX), nimodipine, CGP 52432, EGTA, and BAPTA were from Tocris Bioscience (Minneapolis,
MN). Sodium chloride, potassium chloride, sodium bicarbonate, and sodium phosphate monobasic
were from Fisher Scientific (Waltham, MA).
Two-photon calcium imagingCalcium imaging in distal tuft dendrites of CA1 pyramidal neurons was performed using
a galvanometer-based two-photon laser scanning system (Prairie Ultima; Prairie Technologies,
Middleton, WI) equipped with an epifluorescence microscope (BX61WI; Olympus, Tokyo, Japan) and
a water-immersion objective lens (40X, 0.8 NA; Olympus). Neurons were filled with 100 μM Oregon
Green 488 BAPTA-1, hexapotassium salt (OGB-1; Invitrogen, Waltham, MA) and 50 μM Alexa Fluor
594 Hydrazide (AF-594; Invitrogen, Waltham, MA). An ultrafast, Ti:Sapphire pulsed laser (Chameleon
Ultra; Coherent, Auburn, CA) was tuned to 880 nm to acquire reference images and 920 nm to
perform calcium imaging. Laser power was controlled with an electro-optical modulator (Model 350-80;
Conoptics, Danbury, CT). Line-scan imaging along dendritic shafts (typically 5–10 μm in length) and
across spines was performed using the Ultima scanner at 250–500 Hz with a dwell time of 10 μs, andfluorescence was collected by multi-alkali photomultiplier tubes (PMTs; Hamamatsu Photonics,
Hamamatsu City, Japan). Laser power was adjusted to ensure a good signal-to-noise ratio of the
fluorescence signal without photo-bleaching the dyes or photo-damaging the dendrites (see
below). In some experiments, multiple locations on several branches or longer stretches of the
branch (up to ∼35 μm) were imaged to determine the spatial profile of the calcium signals. All the
data acquisition and device controls were performed using BNC-2090 and BNC-2110 boards
(National Instruments, Austin, TX) with Prairie View and TriggerSync software (Prairie Technologies).
To achieve an equilibrium concentration of the dyes sufficient for calcium imaging in the distal
dendrites (distance from the soma: 312–673 μm; average = 411 ± 18 μm), cells were dialyzed for at
least 30 min before imaging commenced. Calcium signals were quantified as the increase in (green)
OGB-1 fluorescence from the baseline before stimulation (50–100 ms) divided by (red) AF-594
fluorescence (ΔG/R). This quantification is insensitive to small variations in basal calcium concentration
and independent of the volume of imaged structures (Sabatini et al., 2002). For calcium imaging,
single high-frequency burst stimulation (instead of full TBS) was applied to the PP with an interval of at
least 30–120 s; PP → CA1tuft EPSP amplitude was constantly monitored to determine the stability of
synaptic responses.
Consistent with previous theoretical and experimental studies (Helmchen et al., 1996; Sabatini
et al., 2002), control experiments showed that the integral of ΔG/R is a more stable measure of
calcium entry than peak ΔG/R (Figure 7—figure supplement 1; Figure 7—source data 2). Control
experiments suggested that dye saturation did not occur under our conditions (data not shown). The
largest peak ΔG/R achieved in the distal dendrites (∼250%, by pairing TBS with somatic current
injection to evoke bAPs) was well above the largest value observed in response to a single high-
frequency burst stimulation. Furthermore, the dye was not saturated by a single burst in general
because calcium responses were able to facilitate upon delivery of additional bursts in TBS with the ratio
ΔG/R (Max):ΔG/R (first burst) = 1.52 ± 0.31 (n = 4). Importantly, no correlation was observed between
normalized drug effects and the ΔG/R measure in control (data not shown), which would be expected
if dye saturation had resulted in an underestimate of pharmacological inhibition. The following
indications of phototoxicity were monitored carefully: basal fluorescence of both dyes and its ratio
(G0/R as a readout of basal calcium concentration; see Figure 7—figure supplement 1),
morphological changes of dendrites (swelling or fragmentation), long-lasting depolarization
Kim et al. eLife 2015;4:e06414. DOI: 10.7554/eLife.06414 22 of 30
Research article Neuroscience

following synaptic stimulation or current injection, and a sudden loss of calcium signals. Experiments
were terminated if any signs of photo-damage were observed. At the end of each experiment, the
path distance and the depth (usually 25–55 μm from the surface) of the imaging sites were
measured, and high-resolution Z-stack images were collected.
In initial experiments, we compared the effects of 20 nM TTX across different PP → CA1tuft LTP
induction protocols (see above), and found reduction of calcium signals in all conditions (data not
shown). However, during high-frequency burst stimulation of the PP, bAPs could contribute to calcium
signals in distal dendrites (data not shown). To focus on the calcium signaling mediated by dSpikes
rather than bAPs (which are not required for the induction of PP → CA1tuft LTP; Figure 3E; Golding
et al., 2002), we conducted calcium imaging with the soma voltage-clamped at ∼ −70 to −75 mV.
No escape spikes were observed under these conditions in this series of experiments.
Data analysisFor all recordings, the peak amplitude of events was measured as the difference between the resting
and peak membrane potentials. For somatic recordings, the apparent voltage threshold of action
potentials was measured as the voltage at which dV/dt crossed 40 V/s. In dendritic recordings, the
voltage responses after each synaptic stimulus position (Stim. #) could be divided into two
populations with non-overlapping amplitude distributions (Figure 2—figure supplement 1A). Large-
amplitude dendritic events (defined as those with the peak amplitude >40 mV) were presumed to
consist of both bAPs and large dSpikes. The apparent voltage threshold of large-amplitude dendritic
events was measured as the voltage at which the second temporal derivative of voltage d2V/dt2
crossed 7.5 mV/ms2. bAPs typically have a high apparent voltage threshold, because large dendritic
EPSPs are required for the axonal EPSPs to be large enough to reach the threshold for action potential
initiation after EPSP attenuation between the dendrites and the axon. In contrast, large dSpikes have
a lower apparent threshold, because they are initiated closer to the dendritic recording electrode.
bAPs and large dSpikes also differ in their onset kinetics, quantified as ‘initial phase slope’, which was
measured as the slope of a linear fit to the initial portion of the phase plot (dV/dt vs V; Figure 2—figure
supplement 2A). As dV/dt is proportional to membrane current, the initial phase slope can be
conceptualized as the apparent voltage sensitivity of membrane current. It is an apparent voltage
sensitivity because the source of the current (e.g., the Nav channels) and the membrane potential
responsible for the current are at a remote location, and therefore the observed voltage sensitivity does
not necessarily reflect the voltage dependence of the activation of the channels per se. In dendritic
recordings, actively propagating spikes initiated in the axon (i.e., bAPs) typically have a sharp ‘kink’ at their
onset, because they are initiated by axial current flowing from a remote location of spike initiation (i.e., the
axon), which precedes local dendritic Nav channel-mediated currents. The ‘kink’ is reflected as a large
initial phase slope (>3.5 ms-1), and thus a steep apparent voltage sensitivity of the membrane current,
because the axial current is driven by the voltage difference between the axon and the dendrite, thus
resulting in a current that is not driven by changes in the local dendritic depolarization and therefore does
not require activation of local channels. As a result of this sudden current, the onset of these
backpropagating spikes shows a kink in the time domain and a steep initial slope in the phase domain. In
contrast, large dSpikes have a more gradual onset, because they are initiated by local Nav channel-
mediated currents generated closer to the dendritic recording electrode, and therefore the voltage
sensitivity of the membrane current (as measured by initial phase slope) more accurately reflects the
voltage sensitivity of the Nav channels (Shu et al., 2007; Yu et al., 2008; Brette, 2013; Smith et al., 2013).
On the basis of these two criteria, some events could be identified as clear bAPs (high threshold
and large initial phase slope) or clear large dSpikes (low threshold and small initial phase slope), while
the other events were ambiguous (Figure 2—figure supplement 2; Figure 2—source data 2),
perhaps owing to complications such as coincident local dendritic depolarization (which may reduce
the initial phase slope of bAPs) or very distal locations of dSpike initiation (which may result in large
initial phase slope of propagating dSpikes). Three large-amplitude dendritic events with relatively
small initial phase slope but high threshold also had relatively broad halfwidth, suggesting a larger
contribution from Cav and/or NMDAR channels (Figure 2—figure supplement 2B; Figure 2—source
data 2).
Small dSpikes (spikelets) were identified as outliers in the distribution of peak dV/dt values
(stimulus positions with a large-amplitude dendritic event in the control condition were excluded for
Kim et al. eLife 2015;4:e06414. DOI: 10.7554/eLife.06414 23 of 30
Research article Neuroscience

this analysis) for each of the five stimulus positions (Stim. #) in each burst (Figure 2C). We observed
a trend toward decay of peak dV/dt in each burst as a function of stimulus position (Figure 2—figure
supplement 1B). Therefore, we normalized peak dV/dt to the median value for Stim. #1 in control
(i.e., of the five bursts in control from the given cell) and plotted normalized dV/dt as a function of
stimulus position in each burst in control and in the presence of 20 nM TTX. A fit of an exponential
decay function to the whole population of data (control and 20 nM TTX) was then performed. Small
dSpikes were identified as events that fell outside the prediction band of the fit; in this way, a single
criterion was applied to both experimental conditions (i.e., control and 20 nM TTX). Because there is
no perfectly objective way to determine which events should be called small dSpikes, we analyzed the
data for prediction bands at confidence levels ranging from 85% (least stringent; largest number of
small dSpikes) to 99% (most stringent; smallest number of small dSpikes). Two additional statistical
criteria (based on the median or standard deviation of normalized peak dV/dt for each stimulus
position; data not shown) and another approach applying a single ‘hard’ threshold (Figure 2—figure
supplement 4) for identifying small dSpikes were also used, and the qualitative results remained the
same.
For notched box plots (Figure 2—figure supplement 4A), the edges of notch were defined by the
95% confidence intervals of the median, the end points of whiskers as the largest and smallest values
that are within the range of (the 75th percentile + 1.5 × interquartile range) and (the 25th percentile −1.5 × interquartile range), and individual data points are those outside this range.
The potentiation ratio was calculated as the average EPSP amplitude 26–30 min after LTP induction
normalized by the average EPSP amplitude before induction.
Calcium and current signals were averaged over 3–6 trials, with a slight Gaussian smoothing
(standard deviation of the kernel = 0.064 ms), and the peak amplitude and integral (up to 800 ms after
stimulation) were measured. Special caution was taken to confirm that the smoothing reduced
random noise without changing the kinetics and amplitude of the original signals. Tissue
autofluorescence was determined to be negligible in the two-photon experiments, so no background
subtraction was carried out. The two-photon Z-stack images of neurons were generated by two-
dimensional projection of maximal AF-594 fluorescence intensity from three-dimensional Z-stacks.
All analyses were performed using IGOR Pro (Wavemetrics, Lake Oswego, OR), MATLAB (The
MathWorks, Natick, MA), ImageJ (National Institutes of Health, Bethesda, MD), and Microsoft Office
Excel (Microsoft, Redmond, WA).
In most cases (unless noted otherwise), data were presented as mean ± S.E.M. Significance of the
difference in normalized EPSP amplitude between experimental conditions was tested by one-way
ANOVA with post hoc multiple comparisons by Tukey’s method. Significance of LTP expression for
each experimental condition was tested by one-way repeated measures ANOVA. Significance of the
difference in number of events counted as small dSpikes (spikelets) between two experimental
conditions was tested using a binomial test; rejection of the null hypothesis suggests an unequal
likelihood of an event occurring above threshold between two conditions. All other comparisons
between two experimental groups/conditions were done with Student’s t-test. Statistical analyses
were performed using Prism (GraphPad Software, La Jolla, CA) and OriginPro (OriginLab
Corporation, Northampton, MA). All data presented in the figures has been deposited to our
laboratory website (www.janelia.org/lab/spruston-lab/resources) and figshare (Spruston et al., 2015).
Computational modelingSimulations were performed using a compartmental model based on the morphology reconstructed
from a rat CA1 pyramidal neuron (Golding et al., 2001). The passive and active properties of the model
were used the same as those used previously, which reproduced experimental data on bAPs and
dSpikes (Golding et al., 2001; Jarsky et al., 2005; Katz et al., 2009) with adaptations described below.
All simulations were performed using the NEURON simulation software (Hines and Carnevale, 1997)
with a fixed time step (dt = 0.025 ms). Code for the simulations has been deposited to our laboratory
website (www.janelia.org/lab/spruston-lab/resources) and the ModelDB database (Hsu et al., 2015).
The model included active conductances simulating the following channels: Nav channels, A-type
potassium (KA) channels, delayed-rectifier potassium (KDR) channels, and L-Cav channels. Properties
and distributions of KA and KDR channels were the same as previously stated (Golding et al., 2001;
Katz et al., 2009). The L-Cav channel model (Poirazi et al., 2003) was inserted into the apical tuft with
Kim et al. eLife 2015;4:e06414. DOI: 10.7554/eLife.06414 24 of 30
Research article Neuroscience
a uniform density gCa = 1.25 mS/cm2. The properties of the dendritic Nav channels, including slow
inactivation, were implemented using a model from Migliore et al., 1999. Inclusion of slow
inactivation improved the fit of the limited effect of 20 nM TTX on the dendritically recorded voltage
in response to single high-frequency burst stimulation (Figures 2A,B, 5). Following a recent study
(Lorincz and Nusser, 2010), in the apical dendritic tree a linearly decreasing gradient of Nav channel
density was implemented using the equation:
gNaðxÞ=gNa;soma +ΔgNa · x
where x is the distance from the soma (in μm), and gNa(x) is the Nav channel conductance at the
distance x; gNa,soma = 42 mS/cm2, ΔgNa =−0:025 (mS/cm2)/μm, and for the remaining compart-
ments, gNa =gNa;soma.
Synaptic stimulation was simulated as 150 simultaneous events distributed randomly across all of
the apical tuft branches. Spines were not explicitly modeled, but the associated surface area was
accounted for by decreasing specific membrane resistivity (Rm) and increasing specific membrane
capacitance (Cm) by a factor of 2 for compartments >100 μm from the soma. In additional simulations,
synapses simulated on explicitly modeled spines yielded qualitatively similar results. Every synapse
was taken to have α-amino-3-hydroxy-5-methyl-4-isoxazolepropionic acid (AMPA) receptor (AMPAR)
and NMDAR conductances (gAMPA = 0:18 nS, gNMDA =0:18 nS), and both were modeled as a difference
of two exponentially decaying functions with rise and decay time constants of 0.2 and 2 ms for
AMPARs (Katz et al., 2009) and 1 and 50 ms for NMDARs (Hestrin et al., 1990; Spruston et al.,
1995). The voltage-dependent magnesium (Mg2+) block of NMDARs was modeled as
gMg = ½1+0:2801 ·Mg2+ext ·expð−0:062 · ðV −10ÞÞ�−1 (Spruston et al., 1995; Maex and De Schutter,
1998) with the Mg2+ concentration in bath Mg2+ext =1 mM. The fractional calcium influx through
NMDAR channels was taken to be 10% of the total current (Schneggenburger et al., 1993;
Burnashev et al., 1995; Garaschuk et al., 1996). The temperature used in the model was 35˚C.
A calcium handling mechanism was implemented (Hines and Carnevale, 2000) which included
buffers (endogenous buffer and OGB-1), diffusion (radial and longitudinal), and extrusion (a pump).
The parameters of OGB-1 were as follows (Schmidt et al., 2003): diffusional mobility 0.3 μm2/ms,
calcium-binding forward rate constant 430 mM−1ms−1, backward rate constant 0.14 ms-1, and effective
concentration 0.05 mM. The endogenous buffer was immobile, and the parameters were as follows
(Yamada et al., 1989): calcium-binding forward rate constant 100 mM−1ms−1, backward rate constant
0.1 ms-1, and concentration 0.003 mM. The calcium extrusion by a calcium pump was modeled as
a two-step reaction with mass-action kinetics:
Ca2+in + pump ⇄ Ca2+ ×pump
Ca2+ ×pump ⇄ pump+Ca2+out
The forward and backward rate constants for the first step were 1 mM−1ms−1 and 0.005 ms-1,
and for the second step 1 ms-1 and 0.005 mM−1ms−1, respectively. The calcium pump density was
10−11 mol/cm2. With these calcium buffers and calcium pump, the free calcium concentration
([Ca2+]free) was in the linear operation range of OGB-1 (i.e., the dissociation constant), and the
kinetics of [Ca2+]OGB signals matched the imaging data.
To simulate bath application of 20 nM TTX, we reduced the conductance of Nav channels to 50% of
control, consistent with the previous observations of TTX efficacy on hippocampal neurons (Kaneda
et al., 1989; Madeja, 2000); to simulate bath application of 50 μM AP5 or 10 μM nimodipine, we
reduced the NMDAR or L-Cav channel conductance to zero. For all simulations, either a somatic
voltage clamp at −70 mV was simulated or gNa,soma and gNa,axon were set to be zero in order to mimic
the experimental paradigm in which axo-somatic action potential firing was prevented.
Although the model contains a large number of parameters, many of these values were constrained
by a wealth of available experimental data on CA1 pyramidal neurons (this study; Magee and
Johnston, 1995; Spruston et al., 1995; Helmchen et al., 1996; Hoffman et al., 1997; Golding et al.,
2001; Otmakhova et al., 2002; Sabatini et al., 2002; Katz at al., 2009; Bittner et al., 2012). As in all
modeling, some assumptions had to be made, so we were careful to test a range of parameter values.
Our conclusions were robust using several combinations of parameters. As always, however, we make
no claim that the model is ‘correct’ in an absolute sense. Its purpose is to demonstrate the plausibility
Kim et al. eLife 2015;4:e06414. DOI: 10.7554/eLife.06414 25 of 30
Research article Neuroscience
of our interpretation and the proposed model with parameter values constrained by those available in
the literature.
AcknowledgementsWe thank Mike Tadross and members of the Spruston lab for helpful discussions and Aaron Milstein,
Samuel Gale, and Mark Harnett for advice on programming and experiments.
Additional information
Funding
Funder Grant reference Author
Howard Hughes MedicalInstitute (HHMI)
Yujin Kim, Ching-Lung Hsu,Mark S Cembrowski, Brett DMensh, Nelson Spruston
National Institutes ofHealth (NIH)
NS035180 Nelson Spruston
National Institutes ofHealth (NIH)
NS046064 Nelson Spruston
National Science CouncilTaiwan
NSC98-2917-I-002-145
Ching-Lung Hsu
The funders had no role in study design, data collection and interpretation, or thedecision to submit the work for publication.
Author contributions
YK, C-LH, Conception and design, Acquisition of data, Analysis and interpretation of data, Drafting
or revising the article; MSC, Acquisition of data, Analysis and interpretation of data, Drafting or
revising the article; BDM, Analysis and interpretation of data, Drafting or revising the article; NS,
Conception and design, Analysis and interpretation of data, Drafting or revising the article
Ethics
Animal experimentation: All animal procedures were approved by the Animal Care and Use
Committees at the HHMI Janelia Research Campus and Northwestern University.
ReferencesAhmed MS, Siegelbaum SA. 2009. Recruitment of N-type Ca2+ channels during LTP enhances low release efficacyof hippocampal CA1 perforant path synapses. Neuron 63:372–385. doi: 10.1016/j.neuron.2009.07.013.
Amici M, Doherty A, Jo J, Jane D, Cho K, Collingridge G, Dargan S. 2009. Neuronal calcium sensors and synapticplasticity. Biochemical Society Transactions 37:1359–1363. doi: 10.1042/BST0371359.
Andrade R. 1991. Blockade of neurotransmitter-activated K+ conductance by QX-314 in the rat hippocampus.European Journal of Pharmacology 199:259–262. doi: 10.1016/0014-2999(91)90467-5.
Andreasen M, Lambert JD. 1995. Regenerative properties of pyramidal cell dendrites in area CA1 of the rathippocampus. The Journal of physiology 483:421–441. doi: 10.1113/jphysiol.1995.sp020595.
Araya R, Nikolenko V, Eisenthal KB, Yuste R. 2007. Sodium channels amplify spine potentials. Proceedings of theNational Academy of Sciences of the United States of America 104:12347–12352. doi: 10.1073/pnas.0705282104.
Augustine GJ, Santamaria F, Tanaka K. 2003. Local calcium signaling in neurons. Neuron 40:331–346. doi: 10.1016/S0896-6273(03)00639-1.
Babiec WE, Guglietta R, Jami SA, Morishita W, Malenka RC, O’Dell TJ. 2014. Ionotropic NMDA receptor signalingis required for the induction of long-term depression in the mouse hippocampal CA1 region. The Journal ofNeuroscience 34:5285–5290. doi: 10.1523/JNEUROSCI.5419-13.2014.
Basu J, Srinivas KV, Cheung SK, Taniguchi H, Huang ZJ, Siegelbaum SA. 2013. A cortico-hippocampal learning ruleshapes inhibitory microcircuit activity to enhance hippocampal information flow. Neuron 79:1208–1221. doi: 10.1016/j.neuron.2013.07.001.
Bittner KC, Andrasfalvy BK, Magee JC. 2012. Ion channel gradients in the apical tuft region of CA1 pyramidalneurons. PLOS ONE 7:e46652. doi: 10.1371/journal.pone.0046652.
Blackstone C, Sheng M. 2002. Postsynaptic calcium signaling microdomains in neurons. Frontiers in Bioscience 7:872–885. doi: 10.2741/blacksto.
Bliss TVP, Collingridge GL. 1993. A synaptic model of memory: long-term potentiation in the hippocampus.Nature361:31–39. doi: 10.1038/361031a0.
Kim et al. eLife 2015;4:e06414. DOI: 10.7554/eLife.06414 26 of 30
Research article Neuroscience

Bloodgood BL, Sabatini BL. 2007. Nonlinear regulation of unitary synaptic signals by CaV2.3 voltage-sensitivecalcium channels located in dendritic spines. Neuron 53:249–260. doi: 10.1016/j.neuron.2006.12.017.
Bradshaw JM, Kubota Y, Meyer T, Schulman H. 2003. An ultrasensitive Ca2+/calmodulin-dependent protein kinaseII-protein phosphatase 1 switch facilitates specificity in postsynaptic calcium signaling. Proceedings of theNational Academy of Sciences of the USA 100:10512–10517. doi: 10.1073/pnas.1932759100.
Brandalise F, Gerber U. 2014. Mossy fiber-evoked subthreshold responses induce timing-dependent plasticity athippocampal CA3 recurrent synapses. Proceedings of the National Academy of Sciences of the USA 111:4303–4308. doi: 10.1073/pnas.1317667111.
Brette R. 2013. Sharpness of spike initiation in neurons explained by compartmentalization. Plos ComputationalBiology 9:e1003338. doi: 10.1371/journal.pcbi.1003338.
Buchanan KA, Mellor JR. 2007. The development of synaptic plasticity induction rules and the requirement forpostsynaptic spikes in rat hippocampal CA1 pyramidal neurones. The Journal of Physiology 585:429–445. doi: 10.1113/jphysiol.2007.142984.
Burnashev N, Zhou Z, Neher E, Sakmann B. 1995. Fractional calcium currents through recombinant GluR channelsof the NMDA, AMPA and kainite receptor subtypes. The Journal of Physiology 485:403–418. doi: 10.1113/jphysiol.1995.sp020738.
Buzsaki G, Moser EI. 2013. Memory, navigation and theta rhythm in the hippocampal-entorhinal system. NatureNeuroscience 16:130–138. doi: 10.1038/nn.3304.
Cavazzini M, Bliss T, Emptage N. 2005. Ca2+ and synaptic plasticity. Cell Calcium 38:355–367. doi: 10.1016/j.ceca.2005.06.013.
Clark BA, Monsivais P, Branco T, London M, Hausser M. 2005. The site of action potential initiation in cerebellarPurkinje neurons. Nature Neuroscience 8:137–139. doi: 10.1038/nn1390.
Coombs JS, Curtis DR, Eccles JC. 1957. The generation of impulses in motoneurones. The Journal of Physiology139:232–249. doi: 10.1113/jphysiol.1957.sp005888.
Colbert CM, Levy WB. 1993. Long-term potentiation of perforant path synapses in hippocampal CA1 in vitro. BrainResearch 606:87–91. doi: 10.1016/0006-8993(93)91573-B.
Cooper SJ. 2005. Donald O. Hebb’s synapse and learning rule: a history and commentary. Neuroscience andBiobehavioral Reviews 28:851–874. doi: 10.1016/j.neubiorev.2004.09.009.
Dudman JT, Tsay D, Siegelbaum SA. 2007. A role for synaptic inputs at distal dendrites: instructive signals forhippocampal long-term plasticity. Neuron 56:866–879. doi: 10.1016/j.neuron.2007.10.020.
Eggermann E, Bucurenciu I, Goswami SP, Jonas P. 2012. Nanodomain coupling between Ca2+ channels andsensors of exocytosis at fast mammalian synapses. Nature Reviews. Neuroscience 13:7–21. doi: 10.1038/nrn3125.
Faas GC, Raghavachari S, Lisman JE, Mody I. 2011. Calmodulin as a direct detector of Ca2+ signals. NatureNeuroscience 14:301–304. doi: 10.1038/nn.2746.
Fan Y, Fricker D, Brager DH, Chen X, Lu HC, Chitwood RA, Johnston D. 2005. Activity-dependent decrease of excitabilityin rat hippocampal neurons through increases in Ih. Nature Neuroscience 8:1542–1551. doi: 10.1038/nn1568.
Feldman D. 2012. The spike-timing dependence of plasticity. Neuron 75:556–571. doi: 10.1016/j.neuron.2012.08.001.Frank LM, Stanley GB, Brown EN. 2004. Hippocampal plasticity across multiple days of exposure to novelenvironments. The Journal of Neuroscience 24:7681–7689. doi: 10.1523/JNEUROSCI.1958-04.2004.
Froemke RC, Letzkus JJ, Kampa BM, Hang GB, Stuart GJ. 2010. Dendritic synapse location and neocortical spike-timing dependent plasticity. Frontiers in Synaptic Neuroscience 2:1–14. doi: 10.3389/fnsyn.2010.00029.
Gambino F, Pages S, Kehayas V, Baptista D, Tatti R, Carleton A, Holtmaat A. 2014. Sensory-evoked LTP driven bydendritic plateau potentials in vivo. Nature 515:116–119. doi: 10.1038/nature13664.
Garaschuk O, Schneggenburger R, Schirra C, Tempia F, Konnerth A. 1996. Fractional Ca2+ currents throughsomatic and dendritic glutamate receptor channels of rat hippocampal CA1 pyramidal neurones. The Journal ofPhysiology 491:757–772. doi: 10.1113/jphysiol.1996.sp021255.
Golding NL, Jung H-Y, Mickus T, Spruston N. 1999. Dendritic calcium spike initiation and repolarization arecontrolled by distinct potassium channel subtypes in CA1 pyramidal neurons. The Journal of Neuroscience 19:8789–8798.
Golding NL, Spruston N. 1998. Dendritic sodium spikes are variable triggers of axonal action potentials inhippocampal CA1 pyramidal neurons. Neuron 21:1189–1200. doi: 10.1016/S0896-6273(00)80635-2.
Golding NL, Staff NP, Spruston N. 2002. Dendritic spikes as a mechanism for cooperative long-term potentiation.Nature 418:326–331. doi: 10.1038/nature00854.
Golding NL, Kath WL, Spruston N. 2001. Dichotomy of action-potential backpropagation in CA1 pyramidal neurondendrites. Journal of Neurophysiology 86:2998–3010.
Golding NL, Mickus TJ, Katz Y, Kath WL, Spruston N. 2005. Factors mediating powerful voltage attenuation alongCA1 pyramidal neuron dendrites. The Journal of physiology 568:69–82. doi: 10.1113/jphysiol.2005.086793.
Gordon U, Polsky A, Schiller J. 2006. Plasticity compartments in basal dendrites of neocortical pyramidal neurons.The Journal of Neuroscience 26:12717–12726. doi: 10.1523/JNEUROSCI.3502-06.2006.
Gustafsson B, Wigstrom H, Abraham WC, Huang Y-Y. 1987. Long-term potentiation in the hippocampus usingdepolarizing current pulses as the conditioning stimulus to single volley synaptic potentials. The Journal ofNeuroscience 7:774–780.
Han EB, Heinemann SF. 2013. Distal dendritic inputs control neuronal activity by heterosynaptic potentiation ofproximal inputs. The Journal of Neuroscience 33:1314–1325. doi: 10.1523/JNEUROSCI.3219-12.2013.
Hardie J, Spruston N. 2009. Synaptic depolarization is more effective than back-propagating action potentialsduring induction of associative long-term potentiation in hippocampal pyramidal neurons. The Journal ofNeuroscience 29:3233–3241. doi: 10.1523/JNEUROSCI.6000-08.2009.
Kim et al. eLife 2015;4:e06414. DOI: 10.7554/eLife.06414 27 of 30
Research article Neuroscience
Helmchen F, Imoto K, Sakmann B. 1996. Ca2+ buffering and action potential-evoked Ca2+ signaling in dendrites ofpyramidal neurons. Biophysical Journal 70:1069–1081. doi: 10.1016/S0006-3495(96)79653-4.
Henneberger C, Papouin T, Oliet SHR, Rusakov DA. 2010. Long-term potentiation depends on release of D-serinefrom astrocytes. Nature 463:232–236. doi: 10.1038/nature08673.
Hestrin S, Sah P, Nicoll RA. 1990. Mechanisms generating the time course of dual component excitatory synapticcurrents recorded in hippocampal slices. Neuron 5:247–253. doi: 10.1016/0896-6273(90)90162-9.
Hines ML, Carnevale NT. 2000. Expanding NEURON’s repertoire of mechanisms with NMODL. NeuralComputation 12:839–851. doi: 10.1162/089976600300015475.
Hines ML, Carnevale NT. 1997. The NEURON simulation environment. Neural Computation 9:1179–1209. doi: 10.1162/neco.1997.9.6.1179.
Hoffman DA, Magee JC, Colbert CM, Johnston D. 1997. K+ channel regulation of signal propagation in dendritesof hippocampal pyramidal neurons. Nature 387:869–875. doi: 10.1038/43119.
Holthoff K, Kovalchuk Y, Konnerth A. 2006. Dendritic spikes and activity-dependent synaptic plasticity. Cell andTissue Research 326:369–377. doi: 10.1007/s00441-006-0263-8.
Hsu C-L, Yang H-W, Yen C-T, Min M-Y. 2012. A requirement of low-threshold calcium spike for induction of spike-timing-dependent plasticity at corticothalamic synapses on relay neurons in the ventrobasal nucleus of ratthalamus. The Chinese Journal of Physiology 55:380–389. doi: 10.4077/CJP.2012.BAA047.
Hsu C-L, Yang H-W, Yen C-T, Min M-Y. 2010. Comparison of synaptic transmission and plasticity between sensoryand cortical synapses on relay neurons in the ventrobasal nucleus of the rat thalamus. The Journal of Physiology588:4347–4363. doi: 10.1113/jphysiol.2010.192864.
Hsu C-L, Cembrowski MS, Spruston N. 2015. CA1 pyramidal neuron: Dendritic Na+ spikes are required for LTP atdistal synapses. ModelDB 184054. https://senselab.med.yale.edu/modeldb/ShowModel.cshtml?model=184054.
Hu H, Jonas P. 2014. A supercritical density of Na+ channels ensures fast signaling in GABAergic interneuron axons.Nature Neuroscience 17:686–693. doi: 10.1038/nn.3678.
Huang H, Trussell LO. 2014. Presynaptic HCN channels regulate vesicular glutamate transport. Neuron 84:340–346. doi: 10.1016/j.neuron.2014.08.046.
Isaac JT, Nicoll RA, Malenka RC. 1995. Evidence for silent synapses: implications for the expression of LTP. Neuron15:427–434. doi: 10.1016/0896-6273(95)90046-2.
Jarsky T, Roxin A, Kath WL, Spruston N. 2005. Conditional dendritic spike propagation following distal synapticactivation of hippocampal CA1 pyramidal neurons. Nature Neuroscience 8:1667–1676. doi: 10.1038/nn1599.
Kaczmarek LK. 2006. Non-conducting functions of voltage-gated ion channels. Nature Reviews. Neuroscience 7:761–771. doi: 10.1038/nrn1988.
Kampa BM, Letzkus JJ, Stuart GJ. 2007. Dendritic mechanisms controlling spike-timing-dependent synapticplasticity. Trends in Neurosciences 30:456–463. doi: 10.1016/j.tins.2007.06.010.
Kaneda M, Oyama Y, Ikemoto Y, Akaike N. 1989. Blockade of the voltage-dependent sodium current in isolatedrat hippocampal neurons by tetrodotoxin and lidocaine. Brain Research 484:348–351. doi: 10.1016/0006-8993(89)90379-X.
Katz Y, Menon V, Nicholson DA, Geinisman Y, Kath WL, Spruston N. 2009. Synapse distribution suggests a two-stage model of dendritic integration in CA1 pyramidal neurons. Neuron 63:171–177. doi: 10.1016/j.neuron.2009.06.023.
Khaliq ZM, Raman IM. 2006. Relative contributions of axonal and somatic Na channels to action potential initiationin cerebellar Purkinje neurons. The Journal of Neuroscience 26:1935–1944. doi: 10.1523/JNEUROSCI.4664-05.2006.
Kole MH, Stuart GJ. 2008. Is action potential threshold lowest in the axon? Nature Neuroscience 11:1253–1255.doi: 10.1038/nn.2203.
Kunz PA, Roberts AC, Philpot BD. 2013. Presynaptic NMDA receptor mechanisms for enhancing spontaneousneurotransmitter release. The Journal of Neuroscience 33:7762–7769. doi: 10.1523/JNEUROSCI.2482-12.2013.
Lambert NA, Wilson WA. 1993. Discrimination of post- and presynaptic GABAB receptor-mediated responses bytetrahydroaminoacridine in area CA3 of the rat hippocampus. Journal of Neurophysiology 69:630–635.
Larkum ME, Zhu JJ, Sakmann B. 1999. A new cellular mechanism for coupling inputs arriving at different corticallayers. Nature 398:338–341. doi: 10.1038/18686.
Larkum ME, Nevian T. 2008. Synaptic clustering by dendritic signaling mechanisms. Current Opinion inNeurobiology 18:321–331. doi: 10.1016/j.conb.2008.08.013.
Larkum ME, Nevian T, Sandler M, Polsky A, Schiller J. 2009. Synaptic integration in tuft dendrites of layer 5pyramidal neurons: a new unifying principle. Science 325:756–760. doi: 10.1126/science.1171958.
Larson J, Wong D, Lynch G. 1986. Patterned stimulation at the theta frequency is optimal for the induction ofhippocampal long-term potentiation. Brain Research 368:347–350. doi: 10.1016/0006-8993(86)90579-2.
Lee D, Lin B-J, Lee AK. 2012. Hippocampal place fields emerge upon single-cell manipulation of excitability duringbehavior. Science 337:849–853. doi: 10.1126/science.1221489.
Liao D, Hessler NA, Malinow R. 1995. Activation of postsynaptically silent synapses during pairing-induced LTP inCA1 region of hippocampal slice. Nature 375:400–404. doi: 10.1038/375400a0.
Lisman J, Yasuda R, Raghavachari S. 2012. Mechanisms of CaMKII action in long-term potentiation. NatureReviews. Neuroscience 13:169–182. doi: 10.1038/nrn3192.
Lorincz A, Nusser Z. 2010. Molecular identity of dendritic voltage-gated sodium channels. Science 328:906–909.doi: 10.1126/science.1187958.
Losonczy A, Magee JC. 2006. Integrative properties of radial oblique dendrites in hippocampal CA1 pyramidalneurons. Neuron 50:291–307. doi: 10.1016/j.neuron.2006.03.016.
Kim et al. eLife 2015;4:e06414. DOI: 10.7554/eLife.06414 28 of 30
Research article Neuroscience
Losonczy A, Makara JK, Magee JC. 2008. Compartmentalized dendritic plasticity and input feature storage inneurons. Nature 452:436–441. doi: 10.1038/nature06725.
Lynch G, Larson J, Kelso S, Barrionuevo G, Schottler F. 1983. Intracellular injections of EGTA block induction ofhippocampal long-term potentiation. Nature 305:719–721. doi: 10.1038/305719a0.
Mackenzie PJ, Murphy TH. 1998. High safety factor for action potential conduction along axons but not dendritesof cultured hippocampal and cortical neurons. Journal of Neurophysiology 80:2089–2101.
Madeja M. 2000. Do neurons have a reserve of sodium channels for the generation of action potentials? A study onacutely isolated CA1 neurons from the guinea-pig hippocampus. The European Journal of Neuroscience 12:1–7.doi: 10.1046/j.1460-9568.2000.00871.x.
Madison DV, Malenka RC, Nicoll RA. 1991. Mechanisms underlying long-term potentiation of synaptictransmission. Annual Review of Neuroscience 14:379–397. doi: 10.1146/annurev.ne.14.030191.002115.
Maex R, De Shutter E. 1998. Synchronization of golgi and granule cell firing in a detailed network model of thecerebellar granule cell layer. Journal of Neurophysiology 80:2521–2537.
Magee JC, Johnston D. 1997. A synaptically controlled, associative signal for Hebbian plasticity in hippocampalneurons. Science 275:209–213. doi: 10.1126/science.275.5297.209.
Magee JC, Johnston D. 1995. Characterization of single voltage-gated Na+ and Ca2+ channels in apical dendritesof rat CA1 pyramidal neurons. The Journal of physiology 487:67–90. doi: 10.1113/jphysiol.1995.sp020862.
Magee JC, Carruth M. 1999. Dendritic voltage-gated ion channels regulate the action potential firing mode ofhippocampal CA1 pyramidal neurons. Journal of Neurophysiology 82:1895–1901.
Mainen ZF, Joerges J, Huguenard JR, Sejnowski TJ. 1995. A model of spike initiation in neocortical pyramidalneurons. Neuron 15:1427–1439. doi: 10.1016/0896-6273(95)90020-9.
Major G, Larkum ME, Schiller J. 2013. Active properties of neocortical pyramidal neuron dendrites. Annual Reviewof Neuroscience 36:1–24. doi: 10.1146/annurev-neuro-062111-150343.
Makara JK, Losonczy A, Wen Q, Magee JC. 2009. Experience-dependent compartmentalized dendritic plasticity inrat hippocampal CA1 pyramidal neurons. Nature Neuroscience 12:1485–1487. doi: 10.1038/nn.2428.
Makino H, Malinow R. 2011. Compartmentalized versus global synaptic plasticity on dendrites controlled byexperience. Neuron 72:1001–1011. doi: 10.1016/j.neuron.2011.09.036.
Malenka RC, Bear MF. 2004. LTP and LTD: an embarrassment of riches. Neuron 30:5–21. doi: 10.1016/j.neuron.2004.09.012.
Maravall M, Mainen ZF, Sabatini BL, Svoboda K. 2000. Estimating intracellular calcium concentrations andbuffering without wavelength ratioing. Biophysical Journal 78:2655–2667. doi: 10.1016/S0006-3495(00)76809-3.
Martin C, Ashley R, Shoshan-Barmatz V. 1993. The effect of local anaesthetics on the ryanodine receptor/Ca2+
release channel of brain microsomal membranes. FEBS Letters 328:77–81. doi: 10.1016/0014-5793(93)80969-2.Mehta MR. 2004. Cooperative LTP can map memory sequences on dendritic branches. Trends in Neurosciences27:69–72. doi: 10.1016/j.tins.2003.12.004.
Migliore M, Hoffman DA, Magee JC, Johnston D. 1999. Role of an A-type K+ conductance in the back-propagationof action potentials in the dendrites of hippocampal pyramidal neurons. Journal of Computational Neuroscience7:5–15. doi: 10.1023/A:1008906225285.
Morris RG. 1989. Synaptic plasticity and learning: selective impairment of learning rats and blockade of long-termpotentiation in vivo by the N-methyl-D-aspartate receptor antagonist AP5. The Journal of Neuroscience 9:3040–3057.
Nabavi S, Kessels HW, Alfonso S, Aow J, Fox R, Malinow R. 2013. Metabotropic NMDA receptor function isrequired for NMDA receptor-dependent long-term depression. Proceedings of the National Academy ofSciences of the USA 110:4027–4032. doi: 10.1073/pnas.1219454110.
Nathan T, Jensen MS, Lambert JDC. 1990. The slow inhibitory postsynaptic potential in rat hippocampal CA1neurones is blocked by intracellular injection of QX-314. Neuroscience Letters 110:309–313. doi: 10.1016/0304-3940(90)90865-7.
Nicholson DA, Trana R, Katz Y, Kath WL, Spruston N, Geinisman Y. 2006. Distance-dependent differences insynapse number and AMPA receptor expression in hippocampal CA1 pyramidal neurons. Neuron 50:431–442.
Oda M, Yoshida A, Ikemoto Y. 1992. Blockade by local anaesthetics of the single Ca2+-activated K+ channel in rathippocampal neurones. British Journal of Pharmacology 105:63–70. doi: 10.1111/j.1476-5381.1992.tb14211.x.
Otis TS, De Koninck Y, Mody I. 1993. Characterization of synaptically elicited GABAB responses using patch-clamprecordings in rat hippocampal slices. The Journal of Physiology 463:391–407. doi: 10.1113/jphysiol.1993.sp019600.
Otmakhova NA, Otmakhov N, Lisman JE. 2002. Pathway-specific properties of AMPA and NMDA-mediatedtransmission in CA1 hippocampal pyramidal cells. The Journal of Neuroscience 22:1199–1207.
Perkins KL, Wong RK. 1995. Intracellular QX-314 blocks the hyperpolarization-activated inward current Iq inhippocampal CA1 pyramidal cells. Journal of Neurophysiology 73:911–915.
Phillips KG, Hardingham NR, Fox K. 2008. Postsynaptic action potentials are required for nitric-oxide-dependentlong-term potentiation in CA1 neurons of adult GluR1 knock-out and wild-type mice. The Journal ofNeuroscience 28:14031–14041. doi: 10.1523/JNEUROSCI.3984-08.2008.
Poirazi P, Brannon T, Mel BW. 2003. Arithmetic of subthreshold synaptic summation in a model CA1 pyramidalcell. Neuron 37:977–987. doi: 10.1016/S0896-6273(03)00148-X.
Poirazi P, Mel BW. 2001. Impact of active dendrites and structural plasticity on the memory capacity of neuraltissue. Neuron 29:779–796. doi: 10.1016/S0896-6273(01)00252-5.
Raastad M, Shepherd GM. 2003. Single-axon action potentials in the rat hippocampal cortex. The Journal ofPhysiology 548:745–752. doi: 10.1113/jphysiol.2002.032706.
Kim et al. eLife 2015;4:e06414. DOI: 10.7554/eLife.06414 29 of 30
Research article Neuroscience
Remondes M, Schuman EM. 2002. Direct cortical input modulates plasticity and spiking in CA1 pyramidal neurons.Nature 416:736–740. doi: 10.1038/416736a.
Remondes M, Schuman EM. 2003. Molecular mechanisms contributing to long-lasting synaptic plasticity at thetemporoammonic–CA1 synapse. Learning & Memory 10:247–252. doi: 10.1101/lm.59103.
Remy S, Csicsvari J, Beck H. 2009. Activity-dependent control of neuronal output by local and global dendriticspike attenuation. Neuron 61:906–916. doi: 10.1016/j.neuron.2009.01.032.
Sabatini BL, Oertner TG, Svoboda K. 2002. The life cycle of Ca2+ ions in dendritic spines. Neuron 33:439–452.doi: 10.1016/S0896-6273(02)00573-1.
Schiller J, Schiller Y, Stuart GJ, Sakmann B. 1997. Calcium action potentials restricted to distal apical dendrites ofrat neocortical pyramidal neurons. The Journal of Physiology 505:605–616. doi: 10.1111/j.1469-7793.1997.605ba.x.
Schiller J, Major G, Koester HJ, Schiller Y. 2000. NMDA spikes in the basal dendrites of cortical pyramidal neurons.Nature 404:285–289. doi: 10.1038/35005094.
Schmidt H, Stiefel KM, Racay P, Schwaller B, Eilers J. 2003. Mutational analysis of dendritic Ca2+ kinetics in rodentPurkinje cells: role of parvalbumin and calbindin D28k. The Journal of Physiology 551:13–32. doi: 10.1113/jphysiol.2002.035824.
Schneggenburger R, Zhou Z, Konnerth A, Neher E. 1993. Fractional contribution of calcium to the cation currentthrough glutamate receptor channels. Neuron 11:133–143. doi: 10.1016/0896-6273(93)90277-X.
Schwartzkroin PA, Slawsky M. 1977. Probable calcium spikes in hippocampal neurons. Brain Research 135:157–161. doi: 10.1016/0006-8993(77)91060-5.
Shu Y, Duque A, Yu Y, Haider B, McCormick DA. 2007. Properties of action-potential initiation in neocorticalpyramidal cells: evidence from whole cell axon recordings. Journal of Neurophysiology 97:746–760. doi: 10.1152/jn.00922.2006.
Shatz CJ. 1992. The developing brain. Scientific American 267:60–67. doi: 10.1038/scientificamerican0992-60.Smith SL, Smith IT, Branco T, Hausser M. 2013. Dendritic spikes enhance stimulus selectivity in cortical neurons invivo. Nature 503:115–120. doi: 10.1038/nature12600.
Spruston N, Jonas P, Sakmann B. 1995. Dendritic glutamate receptor channels in rat hippocampal CA3 and CA1pyramidal neurons. The Journal of Physiology 482:325–352. doi: 10.1113/jphysiol.1995.sp020521.
Spruston N. 2008. Pyramidal neurons: dendritic structure and synaptic integration. Nature Reviews. Neuroscience9:206–221. doi: 10.1038/nrn2286.
Spruston N, Kim Y, Hsu C-L, Cembrowski MS, Mensh BD. 2015. Dendritic sodium spikes are required for long-termpotentiation at distal synapses on hippocampal pyramidal neurons: Source data for all figures. figshare. http://dx.doi.org/10.6084/m9.figshare.1536518.
Stuart GJ, Sakmann B. 1994. Active propagation of somatic action potentials into neocortical pyramidal celldendrites. Nature 367:69–72. doi: 10.1038/367069a0.
Tadross MR, Tsien RW, Yue DT. 2013. Ca2+ channel nanodomains boost local Ca2+ amplitude. Proceedings of theNational Academy of Sciences of the USA 110:15794–15799. doi: 10.1073/pnas.1313898110.
Takahashi H, Magee JC. 2009. Pathway interactions and synaptic plasticity in the dendritic tuft regions of CA1pyramidal neurons. Neuron 62:102–111. doi: 10.1016/j.neuron.2009.03.007.
Talbot MJ, Sayer RJ. 1996. Intracellular QX-314 inhibits calcium currents in hippocampal CA1 pyramidal neurons.Journal of Neurophysiology 76:2120–2124.
Thomas MJ, Watabe AM, Moody TD, Makhinson M, O’Dell TJ. 1998. Postsynaptic complex spike bursting enablesthe induction of LTP by theta frequency synaptic stimulation. The Journal of Neuroscience 18:7118–7126.
Tsay D, Dudman JT, Siegelbaum SA. 2007. HCN1 channels constrain synaptically evoked Ca2+ spikes in distaldendrites of CA1 pyramidal neurons. Neuron 56:1076–1089. doi: 10.1016/j.neuron.2007.11.015.
Tsien RY. 1980. New calcium indicators and buffers with high selectivity against magnesium and protons: design,synthesis, and properties of prototype structures. Biochemistry 19:2396–2404. doi: 10.1021/bi00552a018.
Watkins JC, Olverman HO. 1987. Agonists and antagonists for excitatory amino acid receptors. Trends inNeurosciences 10:265–272. doi: 10.1016/0166-2236(87)90171-8.
Williams SR, Wozny C, Mitchell SJ. 2007. The back and forth of dendritic plasticity. Neuron 56:947–953. doi: 10.1016/j.neuron.2007.12.004.
Wittenberg GM, Wang SS. 2006. Malleability of spike-timing-dependent plasticity at the CA3-CA1 synapse. TheJournal of Neuroscience 26:6610–6617. doi: 10.1523/JNEUROSCI.5388-05.2006.
Wu XE, Mel BW. 2009. Capacity-enhancing synaptic learning rules in a medial temporal lobe online learningmodel. Neuron 62:31–41. doi: 10.1016/j.neuron.2009.02.021.
Xu J-Y, Zhang J, Chen C. 2012. Long-lasting potentiation of hippocampal synaptic transmission by direct corticalinput is mediated via endocannabinoids. The Journal of Physiology 590:2305–2315. doi: 10.1113/jphysiol.2011.223511.
YamadaW, Koch C, Adams P. 1989. Multiple channels and calcium dynamics. In: Koch C, Segev I, editors.Methodsin Neuronal Modeling. Cambridge, MA: MIT Press. p. 97–l33.
Yu Y, Shu Y, McCormick DA. 2008. Cortical action potential backpropagation explains spike threshold variabilityand rapid-onset kinetics. The Journal of Neuroscience 28:7260–7272. doi: 10.1523/JNEUROSCI.1613-08.2008.
Kim et al. eLife 2015;4:e06414. DOI: 10.7554/eLife.06414 30 of 30
Research article Neuroscience