Demand and Supply Chapter 3. Chapter 3 OVERVIEW Basis for Demand Market Demand Function Demand...
33
Demand and Supply Demand and Supply Chapter 3 Chapter 3
-
Upload
clyde-harrison -
Category
Documents
-
view
287 -
download
9
Transcript of Demand and Supply Chapter 3. Chapter 3 OVERVIEW Basis for Demand Market Demand Function Demand...

Demand and Supply Demand and Supply
Chapter 3Chapter 3
Chapter 3Chapter 3OVERVIEWOVERVIEW
Basis for Demand Market Demand Function Demand Curve Basis For Supply Market Supply Function Supply Curve Market Equilibrium
Chapter 3Chapter 3KEY CONCEPTSKEY CONCEPTS
demand direct demand utility derived demand demand function demand curve change in the quantity
demanded shift in demand Supply
supply function supply curve change in the quantity
supplied shift in supply equilibrium market equilibrium price surplus shortage comparative statics
analysis
Demand
The Demand Curve is the relationship between the price of a good or service and the quantity demanded by consumers of the good or service.
The Law of Demand P Qd
We work with equations because they are easier to work with they are becoming increasingly popular for managerial purposescomputers have simplified the process of estimation
Demand Curve Demand Curve Determination
Demand curve shows price and quantity relation holding everything else constant.
Change in Quantity Demanded Quantity demanded falls if price rises. Quantity demanded rises if price falls.
Role of Non-Price Variables Change in non-price variables will define a
new demand curve.
Relation Between the Demand Curve and Demand Function
Movements Along Demand Curve A rise in price causes upward movement
along a given demand curve. A price decline causes downward movement
along a given demand curve. Demand Curve Shifts
Demand increases if a non-price change allows more to be sold at every price.
Demand decreases if a non-price change causes less to be sold at every price.
Basis for Demand
Direct Demand Demand is the quantity customers are willing
to buy under current market conditions. Direct demand is demand for consumption.
Derived Demand Derived demand is input demand. Firms demand inputs that can be profitably
employed.
Determinants of Demand
Demand is determined by Price – movements along the demand curve prices of related goods – shifts the demand curve
Income - shifts the demand curve Advertising – shifts the demand curve
Taste and preferences of buyers - shifts demand
Price expectations, population, ect.
Industry Demand Versus Firm Demand
Industry demand is subject to general economic conditions.
• Cyclical factors• Systemic factors• Political decisions
Firm demand is determined by • economic conditions and competition.
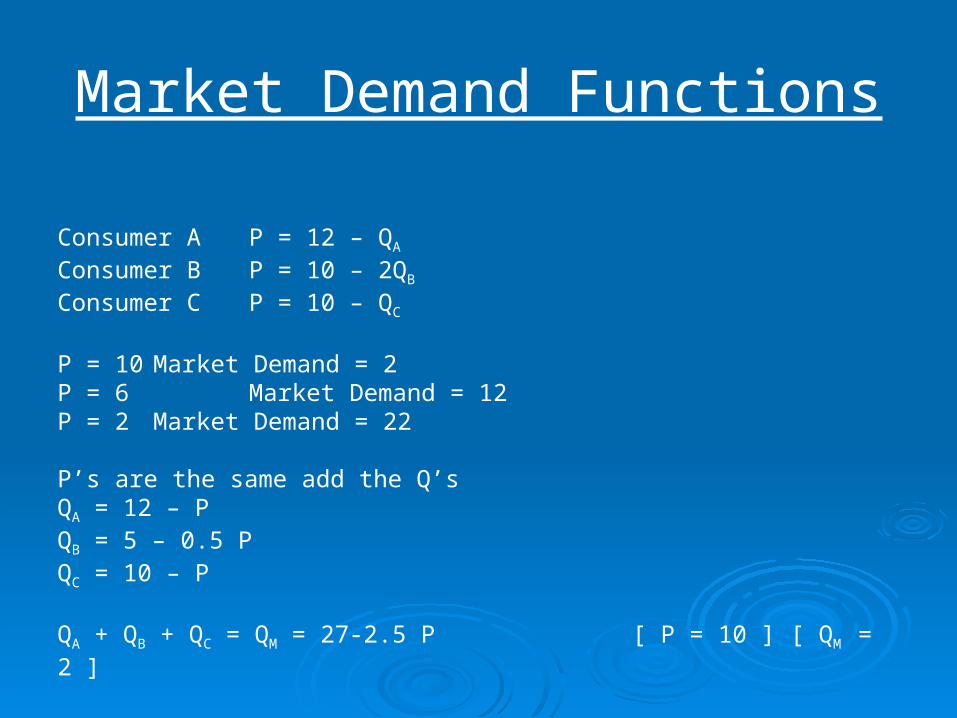
Market Demand Functions
Consumer A P = 12 – QA
Consumer B P = 10 – 2QB
Consumer C P = 10 – QC
P = 10 Market Demand = 2P = 6 Market Demand = 12P = 2 Market Demand = 22
P’s are the same add the Q’s QA = 12 – PQB = 5 – 0.5 PQC = 10 – P QA + QB + QC = QM = 27-2.5 P [ P = 10 ] [ QM = 2 ]
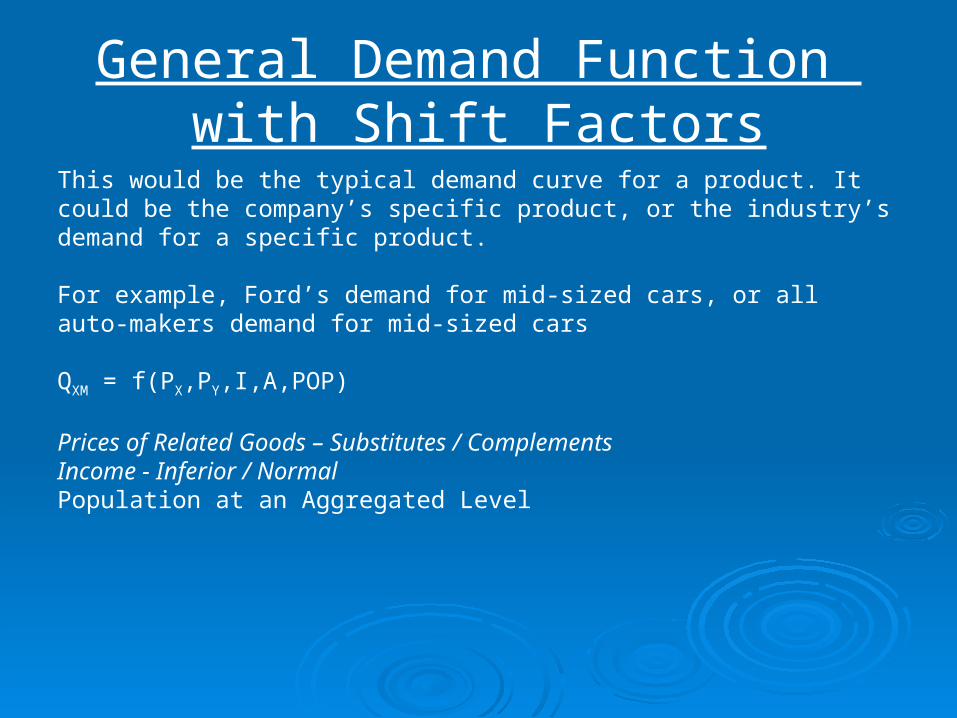
General Demand Function with Shift Factors
This would be the typical demand curve for a product. It could be the company’s specific product, or the industry’s demand for a specific product.
For example, Ford’s demand for mid-sized cars, or all auto-makers demand for mid-sized cars
QXM = f(PX,PY,I,A,POP)
Prices of Related Goods – Substitutes / ComplementsIncome - Inferior / NormalPopulation at an Aggregated Level
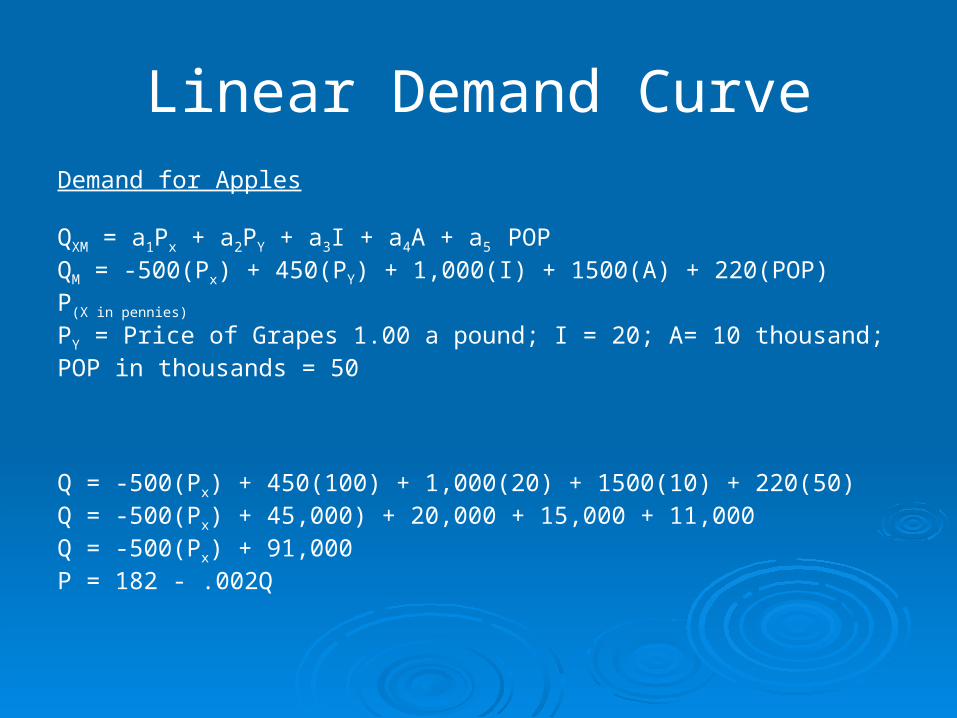
Linear Demand CurveDemand for Apples
QXM = a1Px + a2PY + a3I + a4A + a5 POPQM = -500(Px) + 450(PY) + 1,000(I) + 1500(A) + 220(POP)P(X in pennies) PY = Price of Grapes 1.00 a pound; I = 20; A= 10 thousand;POP in thousands = 50
Q = -500(Px) + 450(100) + 1,000(20) + 1500(10) + 220(50)Q = -500(Px) + 45,000) + 20,000 + 15,000 + 11,000Q = -500(Px) + 91,000P = 182 - .002Q
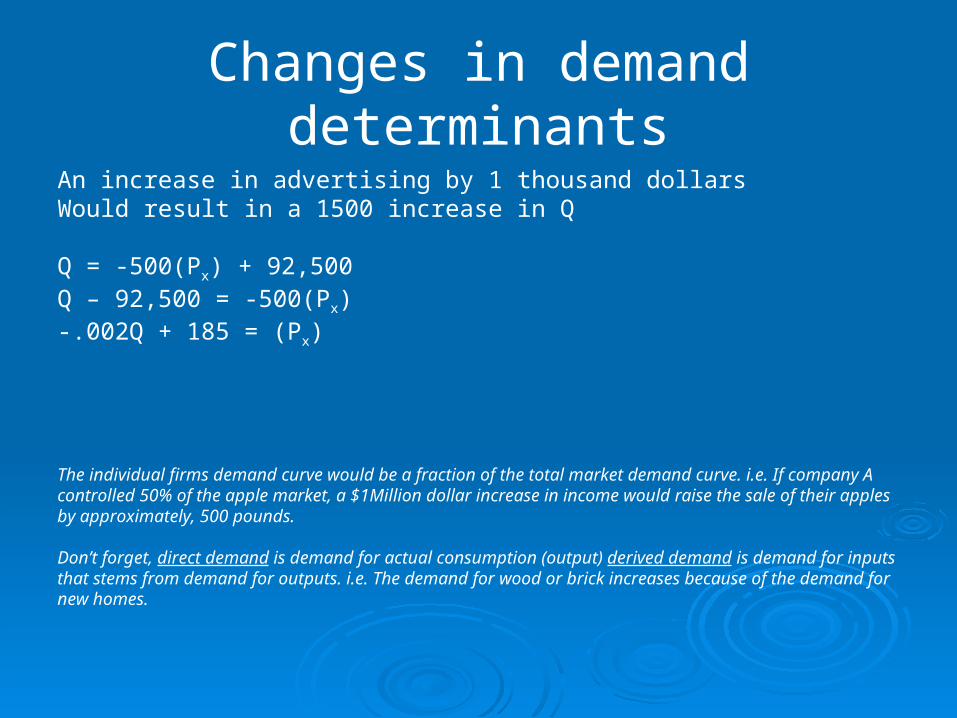
Changes in demand determinants
An increase in advertising by 1 thousand dollarsWould result in a 1500 increase in Q
Q = -500(Px) + 92,500Q – 92,500 = -500(Px)-.002Q + 185 = (Px)
The individual firms demand curve would be a fraction of the total market demand curve. i.e. If company A controlled 50% of the apple market, a $1Million dollar increase in income would raise the sale of their apples by approximately, 500 pounds.
Don’t forget, direct demand is demand for actual consumption (output) derived demand is demand for inputs that stems from demand for outputs. i.e. The demand for wood or brick increases because of the demand for new homes.
Basis For Supply Firms Offer Supply To Make Profits
When prices rise, firms boost the quantity supplied.
When prices fall, firms cut the quantity supplied.
Everything That Affects Marginal Production Costs Affects Supply If MC falls, supply rises. If MC rises, supply falls.
Market Supply Function
Determinants of Supply Supply is determined by price, prices of
other goods, technology, and so on. Industry Supply Versus Firm Supply
Firm supply is determined by economic conditions and competition.
Industry supply is the sum of firm supply.
Supply
© 2009, 2006 South-Western, a © 2009, 2006 South-Western, a part of Cengage Learningpart of Cengage Learning
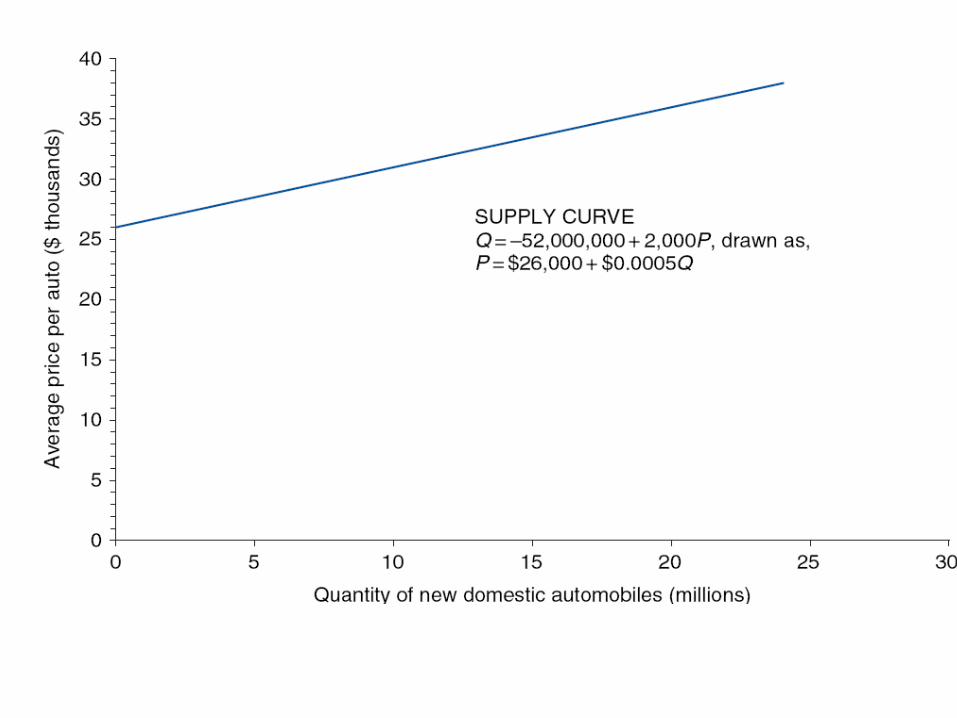
The supply curve is from a firm’s perspective.
How much will the firm supply of product X at a given PX?
Supply Curve Supply Curve Determination
Supply curve shows price and quantity relation holding everything else constant.
The Price-quantity Supplied Relation A rise in price will increase the quantity
supplied. A fall in price will decrease the quantity
supplied. Along a supply curve, all non-price
variables are held constant
Relation Between Supply Curve and Supply Function
Movements Along Supply Curve A rise in price causes upward movement along a
given supply curve. A price decline causes downward movement along a
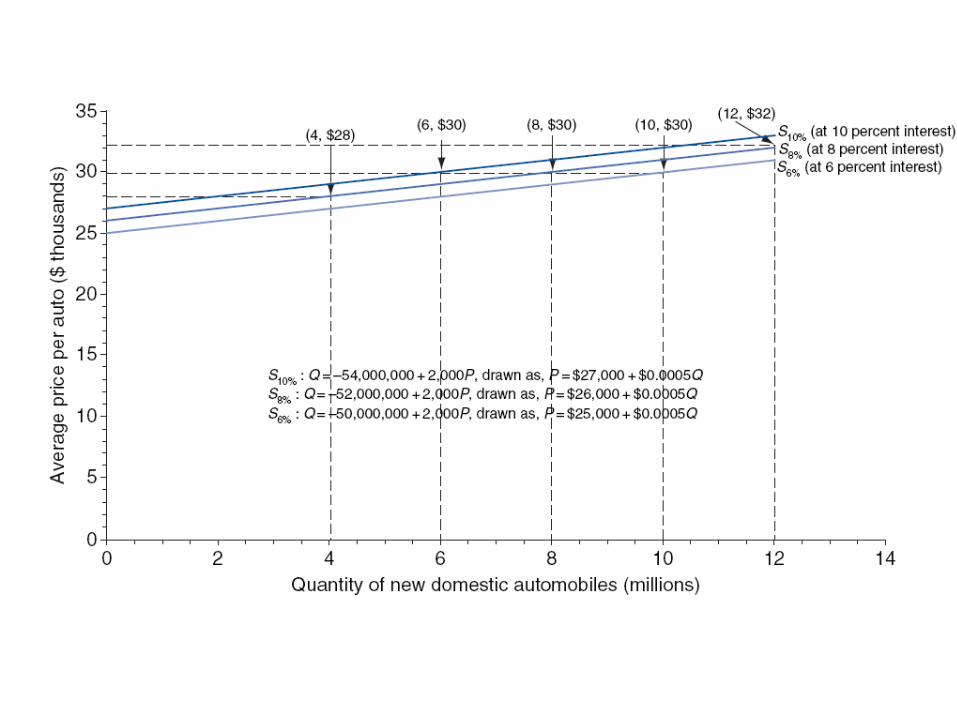
given supply curve. Supply Curve Shifts
Supply increases if a non-price change allows more to profitably produced and sold.
Supply decreases if a non-price change causes less to be profitably produced and sold.
Supply Determinants Anything that affects the cost of doing business
will impact the firm’s decision to supply. Labor costs Materials costs Overhead Advertising Productivity Technology Taxes
Also, changes in the number of suppliers.
Market Supply Curve
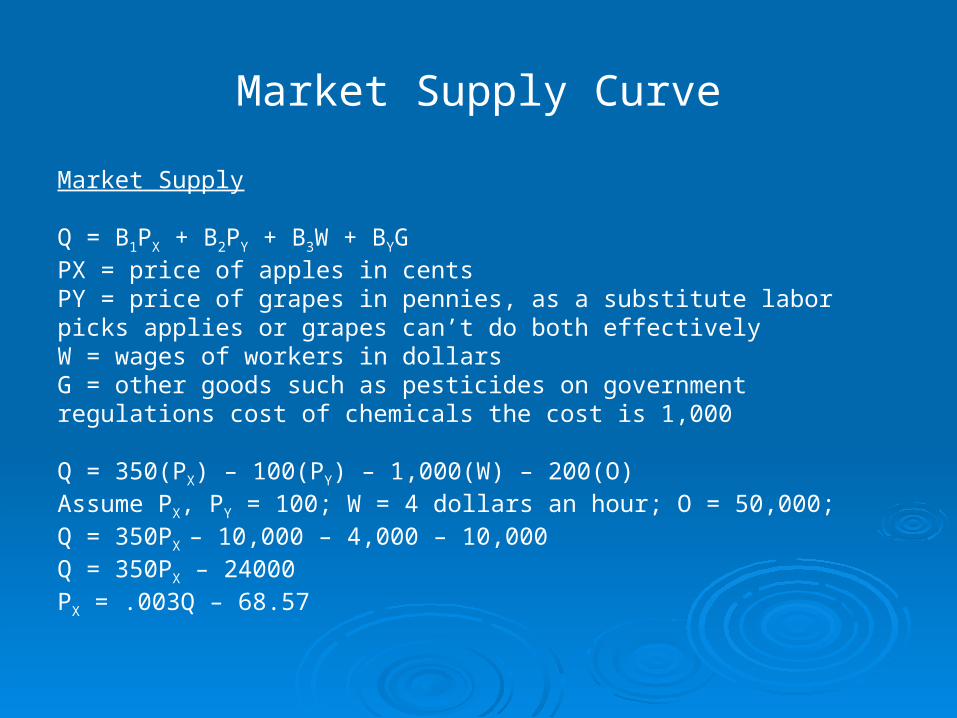
Market Supply
Q = B1PX + B2PY + B3W + BYGPX = price of apples in centsPY = price of grapes in pennies, as a substitute labor picks applies or grapes can’t do both effectivelyW = wages of workers in dollarsG = other goods such as pesticides on government regulations cost of chemicals the cost is 1,000 Q = 350(PX) – 100(PY) – 1,000(W) – 200(O)Assume PX, PY = 100; W = 4 dollars an hour; O = 50,000;Q = 350PX – 10,000 – 4,000 – 10,000Q = 350PX – 24000PX = .003Q – 68.57
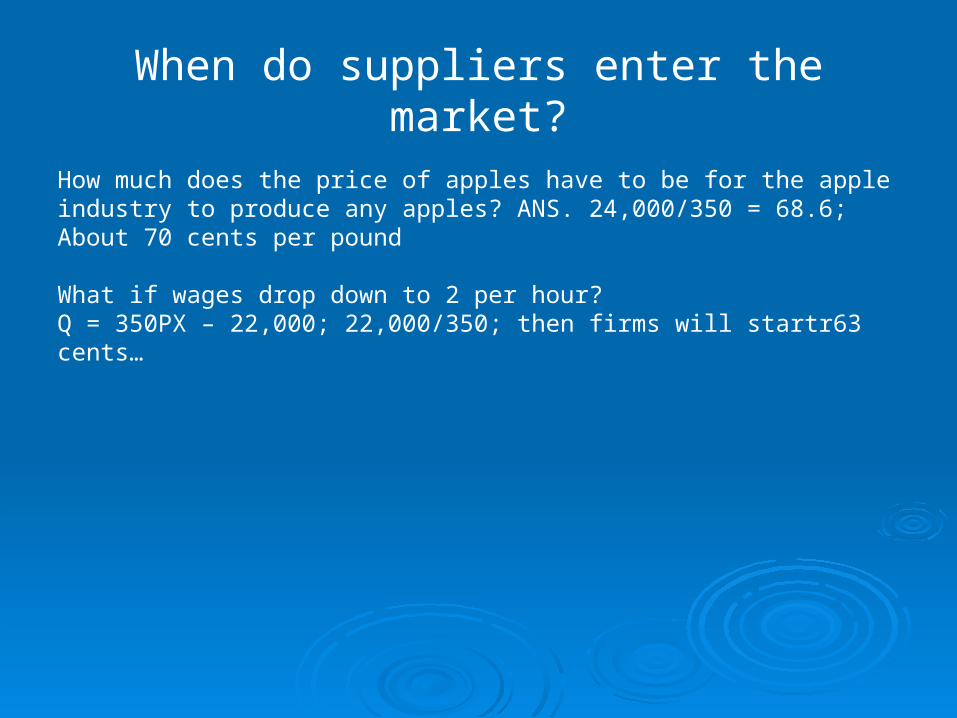
When do suppliers enter the market?
How much does the price of apples have to be for the apple industry to produce any apples? ANS. 24,000/350 = 68.6; About 70 cents per pound What if wages drop down to 2 per hour? Q = 350PX – 22,000; 22,000/350; then firms will startr63 cents…
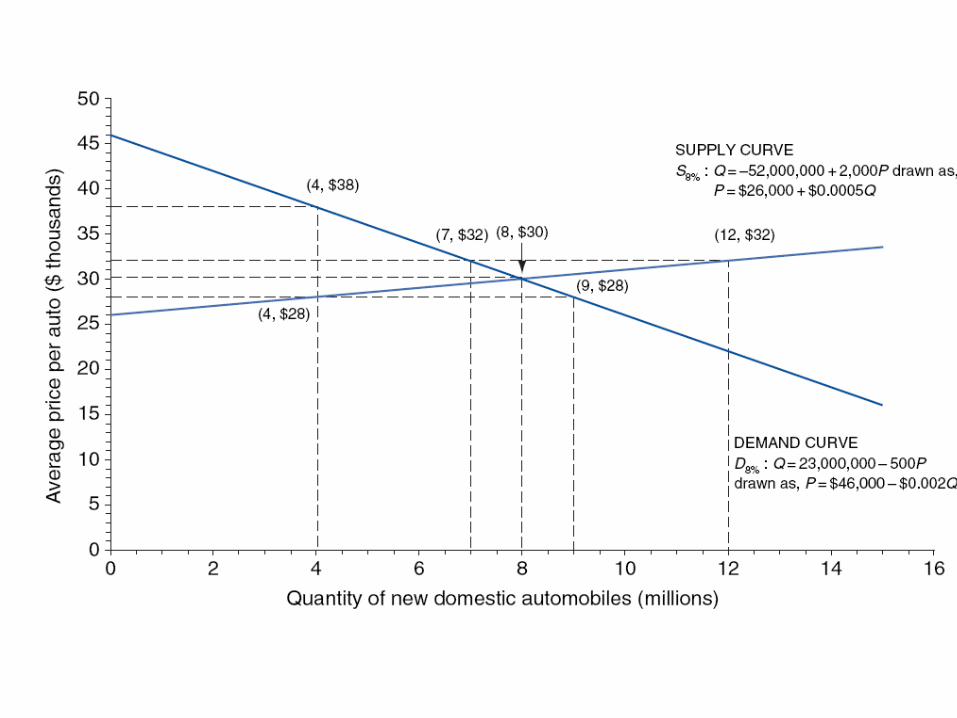
Market Equilibrium
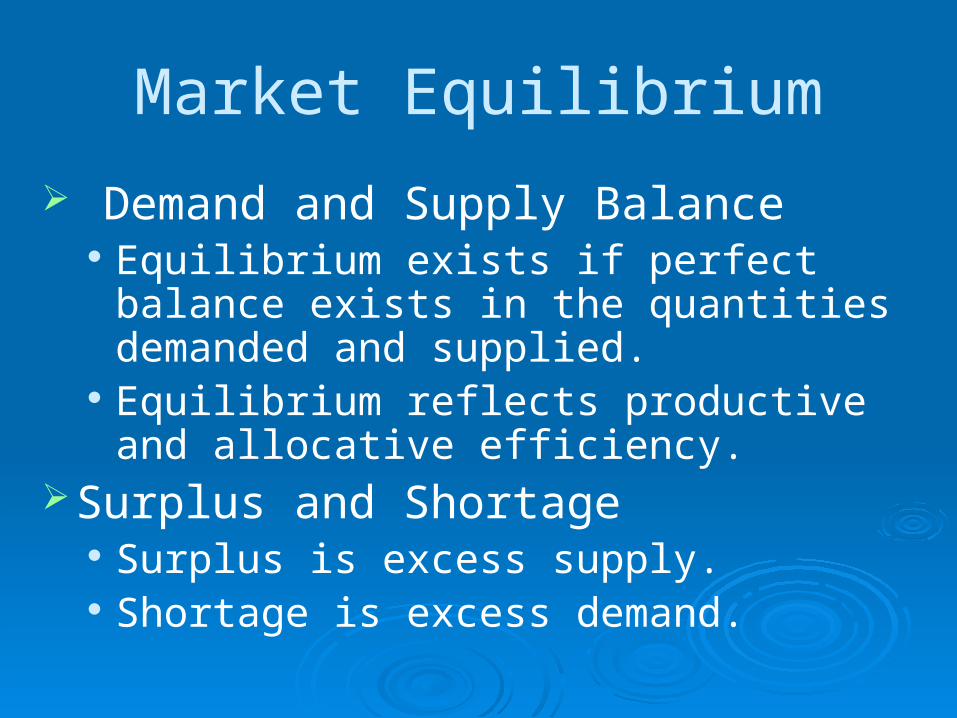
Demand and Supply Balance Equilibrium exists if perfect balance exists
in the quantities demanded and supplied. Equilibrium reflects productive and
allocative efficiency. Surplus and Shortage
Surplus is excess supply. Shortage is excess demand.

Market Equilibrium
Using the demand curve from slide 12 and the supply curve from slide 20. 350PX – 24,000 = -500PX + 91,000PX = 135.3 or $1.35 per pound… At a price of Q $1 what is the amount of the supply? Change the shift factors of either supply or demand.
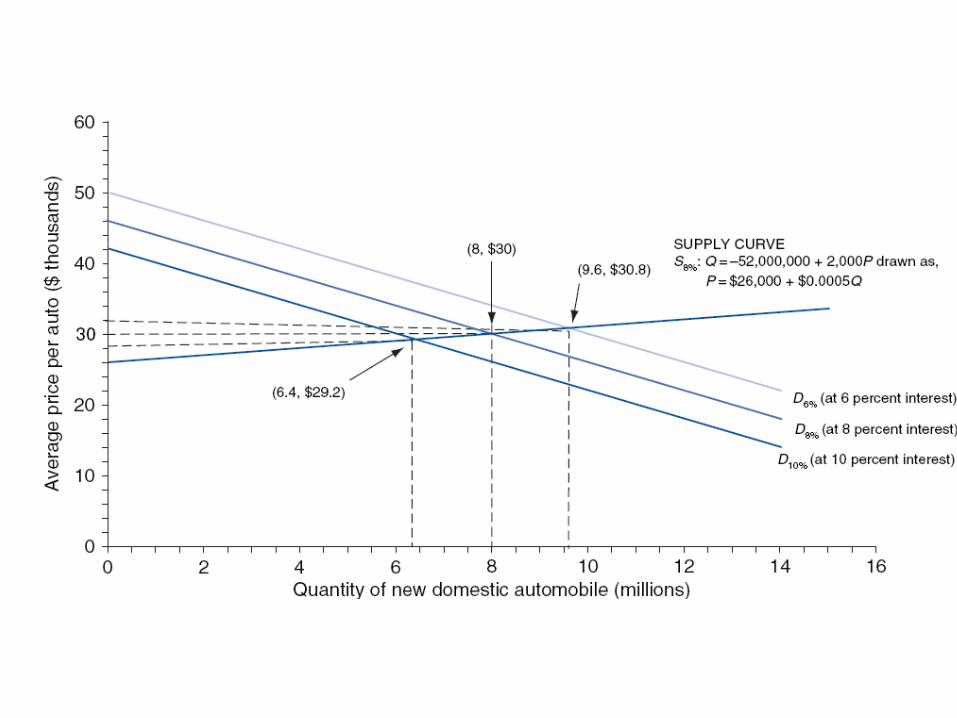
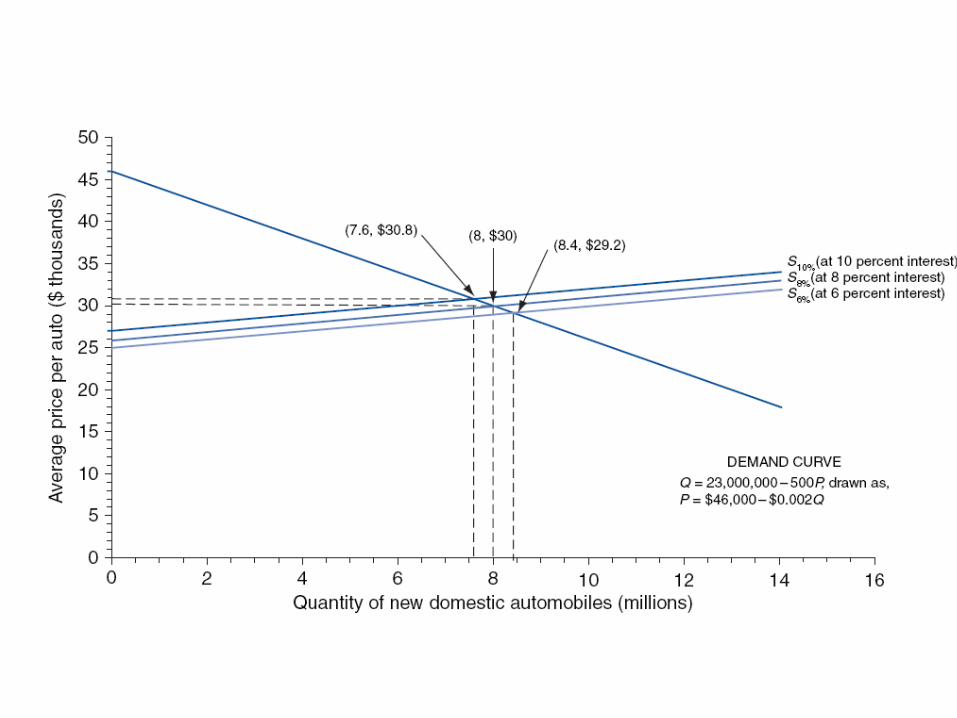
The Market for Autos
Demand Shifts in the demand curve
Supply Shifts in the supply curve
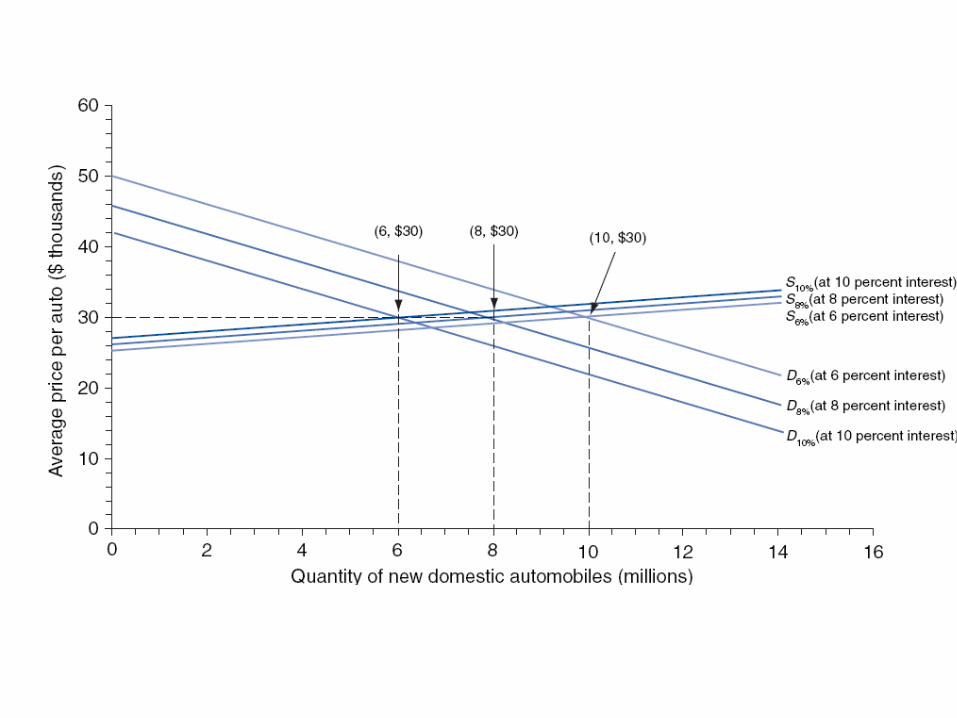
Equilibrium Changes in market equilibrium
Comparative Statics
Changes in Equilibrium Equilibrium exists when there is no economic
incentive for change in demand or supply. Changing demand or supply affects
equilibrium. Comparative Statics
Study of how equilibrium changes with changing demand or supply.
Change continues until a new equilibrium is established.
© 2009, 2006 South-Western, a part of Cengage Learning
© 2009, 2006 South-Western, a part of Cengage Learning