Deltek Vision Reports - The Fitzgerald Group,...
54
Deltek Vision Reports Deltek Systems, Inc. Vision Main Office: 100 CambridgePark Drive Fifth Floor Cambridge, MA 02140 TEL: 800/836-1600 FAX: 617/876-2973 Deltek Headquarters: 13880 Dulles Corner Lane Herndon VA 20171 TEL: 703/734-8606 FAX: 703/734-1146 www.deltek.com I am going to write some more
Transcript of Deltek Vision Reports - The Fitzgerald Group,...

Deltek Vision Reports
Deltek Systems, Inc.Vision Main Office:
100 CambridgePark DriveFifth Floor
Cambridge, MA 02140TEL: 800/836-1600FAX: 617/876-2973
Deltek Headquarters:13880 Dulles Corner Lane
Herndon VA 20171TEL: 703/734-8606FAX: 703/734-1146
www.deltek.comI am going to write some more


C o n t e n t s
1 W e l c o m e2 O v e r v i e w
Vision Reports Overview . . . . . . . . . . . . . . . . . . . . . . . . . . . . . . . . 4The Vision Dashboard and Reports . . . . . . . . . . . . . . . . . . . . . . . . 5
3 C R M R e p o r t s
Marketing Campaign List . . . . . . . . . . . . . . . . . . . . . . . . . . . . . . . . 8Opportunity Forecast . . . . . . . . . . . . . . . . . . . . . . . . . . . . . . . . . . . 9Client Summary (Page 1) . . . . . . . . . . . . . . . . . . . . . . . . . . . . . . . 10Client Summary (Page 2) . . . . . . . . . . . . . . . . . . . . . . . . . . . . . . . 11Opportunity List . . . . . . . . . . . . . . . . . . . . . . . . . . . . . . . . . . . . . . 12Project History . . . . . . . . . . . . . . . . . . . . . . . . . . . . . . . . . . . . . . . 13Resume . . . . . . . . . . . . . . . . . . . . . . . . . . . . . . . . . . . . . . . . . . . . 14
4 P r o j e c t R e p o r t s
Project Progress . . . . . . . . . . . . . . . . . . . . . . . . . . . . . . . . . . . . . . 16Project Summary . . . . . . . . . . . . . . . . . . . . . . . . . . . . . . . . . . . . . 17Project Detail . . . . . . . . . . . . . . . . . . . . . . . . . . . . . . . . . . . . . . . . 18Project Review . . . . . . . . . . . . . . . . . . . . . . . . . . . . . . . . . . . . . . . 19Office Earnings . . . . . . . . . . . . . . . . . . . . . . . . . . . . . . . . . . . . . . . 20Timesheet. . . . . . . . . . . . . . . . . . . . . . . . . . . . . . . . . . . . . . . . . . . 21
5 P l a n n i n g R e p o r t s
Planning Chart . . . . . . . . . . . . . . . . . . . . . . . . . . . . . . . . . . . . . . . 26Revenue Forecast . . . . . . . . . . . . . . . . . . . . . . . . . . . . . . . . . . . . 2712 Month Utilization Alert Report . . . . . . . . . . . . . . . . . . . . . . . . . 28Project Planning Performance . . . . . . . . . . . . . . . . . . . . . . . . . . . 29Project Planning Form (Summary Tab) . . . . . . . . . . . . . . . . . . . . 30Project Planning Form (Analysis Tab) . . . . . . . . . . . . . . . . . . . . . 31Time Analysis . . . . . . . . . . . . . . . . . . . . . . . . . . . . . . . . . . . . . . . . 32
6 B i l l i n g R e p o r t s
Unbilled Detail Report. . . . . . . . . . . . . . . . . . . . . . . . . . . . . . . . . . 34Invoice for Time and Materials Contract . . . . . . . . . . . . . . . . . . . . 35Invoice for Fee-Based Project . . . . . . . . . . . . . . . . . . . . . . . . . . . 36Invoice For Fee-Based Project with Phases. . . . . . . . . . . . . . . . . 37Billing Transfer Posting Log . . . . . . . . . . . . . . . . . . . . . . . . . . . . . 38
Deltek Systems, Inc. Contents-i

C o n t e n t s
7 A c c o u n t i n g R e p o r t sBalance Sheet . . . . . . . . . . . . . . . . . . . . . . . . . . . . . . . . . . . . . . . 40Income Statement . . . . . . . . . . . . . . . . . . . . . . . . . . . . . . . . . . . . 41Account Analysis . . . . . . . . . . . . . . . . . . . . . . . . . . . . . . . . . . . . . 42Aged Accounts Receivable. . . . . . . . . . . . . . . . . . . . . . . . . . . . . . 43Accounts Payable Voucher Schedule . . . . . . . . . . . . . . . . . . . . . 44
A p p e n d i x : L i s t o f R e p o r t s 4 5
Contents-ii Deltek Systems, Inc.

Deltek Vision Report
1
W e l c o m es 1-1
Welcome to the Deltek Vision Reports book.
This book provides a cross-section of sample Vision reports, to help you understand the depth and flexibility of the Vision reporting application.
The reports shown in this book are only a handful of samples displaying the various ways in which you can view your company’s data. With an understanding of the Vision reporting capabilities, you can create views of your data tailored to meet your needs.

1-2 Deltek Systems, Inc.

Vision Reports
2
O v e r v i e wIn this section Vision Reports Overview The Vision Dashboard and Reports
2-3

Vision Reports Overview
Deltek Vision includes a flexible, Web-based interactive reporting environment that is scalable to meet the needs of the most demanding reporting requirements. While Vision includes more than 200 standard reports that cover all components of the application — from key financial metrics and project analysis to opportunity tracking and resource utilization — each of these reports can be tailored to meet your specific needs.
Vision's interactive reporting model provides end users with an easy-to-use environment for configuring, previewing, printing, and e-mailing reports. Users have access to a wide variety of formatting options, allowing them to open existing reports and to create their own versions that can be personal favorites or shared with others in the firm. Vision Reporting provides options for:
• Filtering• Grouping• Selecting columns • Controlling fonts • Formatting fields• Including graphs and charts• Adding user-defined calculated fields
• Exporting and e-mailing reports in Adobe® PDF, Microsoft® Excel, and Microsoft® Word format
With Vision's flexible reporting framework, users are empowered to create the reports they need in effective, graphically appealing formats.
2-4 Deltek Systems, Inc.

The Vision Dashboard and Reports
any link in rts
t to launch eport.
tandard ar, to the ccess
The Vision Dashboard and Reports
The Vision dashboard is a graphical entry point to your company’s data — a portal within your corporate environment. Combining the Vision dashboard with tailored reports that are dynamically updated provides users with the information they need to stay informed and keep processes and projects moving forward.
The Vision dashboard includes report dashparts that allow users to display any number of live reports within their dashboard. From the minute they log on to Vision, they have the latest information at their fingertips. Report options can be set to automatically filter content based on the user that is logged on to Vision. For example, a single project report can be displayed on all project managers' dashboards throughout the firm. The report, however, is dynamically filtered to show only the projects relevant to each manager.
In addition, reports displayed within the dashboard provide drill-down capability to more detailed information. A user may see a trend and want to drill down into the actual opportunities driving that trend. A project manager
Click onthe Repodashparthe full r
The Alerts dashpart provides links to remind the logged on user of activites or events, such as calendar events, project tasks to be assigned or approved, or the need to submit timesheets, expenses, and project budgets.
Here is an example of a Vision dashboard displaying Key Financial Metrics, such as year-to-date revenue, and other sdashparts, such as Contacts and Alerts. Vision dashboards can be tailored for each user, from the dashparts that appename, location and size of each dashpart. Content, such as which reports or projects display, is based on each user’s arights. This example also shows a Reports dashpart, from which you can quickly view any Vision report.
Vision Reports 2-5

may see low profitability on a project and wish to drill down into the expense and labor detail to understand why.
Vision's dashboard also offers a key metrics dashboard component that provides access to data such as year-to-date revenue, expense, and profit, to help you make better, timelier decisions. These and other dynamic dashboard components give the right people in your firm the information they need to make decisions that align with business goals.
2-6 Deltek Systems, Inc.

Vision Repor
3
C R M R e p o r t sIn this section Marketing Campaign List Opportunity Forecast Client Summary Opportunity List Project History or CRM Project Summary Resume
ts 3-7

CR
M R
eports
3-8D
eltek System
s, Inc.
ort can be grouped ety of ways using ive report options. mple is grouped aign Type.
aign type, budget versus nalyze the campaign activity
Marketing Campaign List
You can add a chart to this report to help to graphically analyze campaign statistics.
This repin a varithe intuitThis exaby Camp
The Marketing Campaigns List report allows you to review and analyze marketing campaigns, including status by campactual costs, opportunities and projects generated from the campaign, response rates, and more. You can monitor and aas well as the effectiveness of your marketing programs.

Vision Reports
3-9
Opportunity Forecast
Opportunity Forecast The Opportunity Forecast allows you to review probability estimates and predicted revenue numbers for opportunities your firm is pursuing. You can specify that the predicted revenue be allocated on the estimated start date or end date, or spread proportionally across a time span that you specify.
Revenue can be allocated and projected across a timescale based on the estimated start and end dates for the opportunities you are pursuing.

CRM Reports
Client Summary (Page 1)The Client Summary report consolidates all of the background information, demographics, contacts, activity, and other information related to your clients and prospects into a single useful report.
3-10 Deltek Systems, Inc.

Client Summary (Page 2)
Client Summary (Page 2)
This report includes both the current and past projects for the company as well as opportunities your firm may be pursuing.
Vision Reports 3-11
CR
M R
eports
3-12D
eltek System
s, Inc.
ue by probability, stage, estimated ue.
ple is y the
ty stage rt of revenue e various
lt to suit
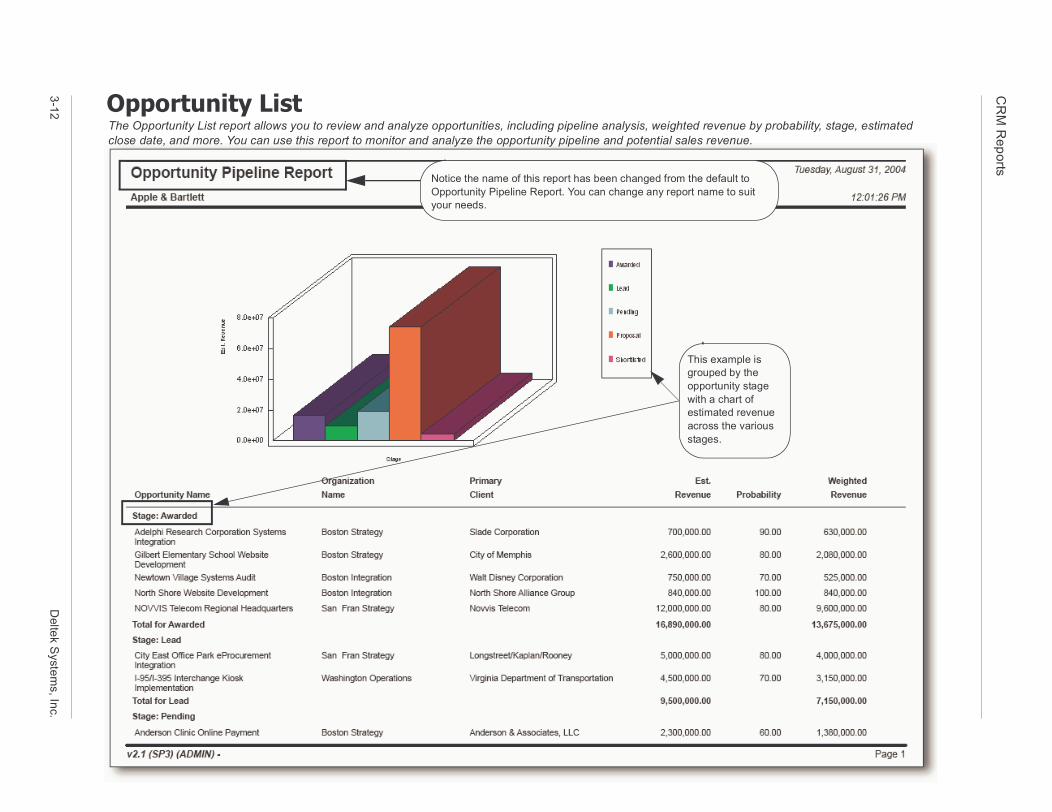
Opportunity ListThe Opportunity List report allows you to review and analyze opportunities, including pipeline analysis, weighted revenclose date, and more. You can use this report to monitor and analyze the opportunity pipeline and potential sales reven
This examgrouped bopportuniwith a chaestimatedacross thstages.
Notice the name of this report has been changed from the defauOpportunity Pipeline Report. You can change any report name toyour needs.

Project History
Project History The Project History report, or CRM Project Summary, offers all of a project’s basic resource and contact information in one easy-to-read report. Find information about the employees assigned to the project, project contacts, planned events and meetings, and date and cost information.
Vision Reports 3-13

CRM Reports
Resume
Education Master of Science, Computer Science, MIT, 1989 Bachelor of Science, Computer Science, Penn State University, 1982 Licenses Microsoft Certified Network Engineer Affiliations American Computer Society / 3/10/1998 / Washington Chapter Secretary 1999
Johnson & Johnson ERP Integration. Partner-in-Charge responsible for all aspects of the project including; planning, design and budgeting. Novvis helped J&J to develop an ERP strategy to bring greater efficiency to their global operations. The system provided suppliers and distributors with greater auditing and tracking capabilities while providing J&J management with the process controls they were lacking.
Washington Laboratories CRM Integration. Project Manager responsible for ensuring that this project be completed on time and within budget. The project involved designing and developing a new CRM system to integrate with their existing ERP system. The new CRM system was designed to capture all customer interactions and transactions, from lead development through final invoicing and analysis.
Lorium Pharmaceutical ERP Integration. Partner-in-Charge responsible for conceptual design and project management through the design phase of the project. The project involved integrating the firm's existing ERP system with their supply operations worldwide. For the first time in the company's history, sales, distribution, and manufacturing were all integrated. The project yielded a 250% return on investment.
J&J Research Center Automation. Partner-in-Charge responsible for the review of the conceptual design and overall project oversight. This 120,000-square-foot research center will serve as a prototype design for other facilities to be constructed nationwide. Novvis was contracted to automate all of the operational facilities for the facility, including security and mechanical systems.
Smith Kline Enterprise Solutions. Partner-in-Charge responsible for overseeing all aspects of this critical process automation and systems integration project. While performing a systems audit for this major pharmaceutical company, Novvis learned that the existing information systems were outdated and disconnected, its legacy system did not allow for real-time access to information, and its administrative processes needed to be more efficient. A team of experienced Novvis consultants re-engineered all of the firms business processes and systems to support the new structure.
John Anderson, MCSEProject Manager
John Anderson has extensive experience in all aspects of computer system design, including software design, network installation, and system integration. He also has extensive experience in all aspects of computer lab facilities. His experience encompasses a wide range of project types including, health care, pharmaceutical, retail, financial, and various government agencies.
Vision allows you to create templates in your favorite word processor or desktop publishing application that format the information to your firm's unique requirements.
Vision's Resume-by-Query feature allows you to quickly build targeted resumes based on the employee's most recent and relevant experience.
3-14 Deltek Systems, Inc.

Vision Repor
4
P r o j e c t R e p o r t sIn this section Project Progress Project Summary Project Detail Project Review Form Office Earnings Timesheet
ts 4-15

Project R
eports
4-16D
eltek System
s, Inc.
ect. By comparing labor and expense
otal Labor line offers a comparison of job-to-date and costs to budgeted and costs.
Project ProgressThe Project Progress report is one of Vision's primary project management tools, providing key data about a single projbudgets with actual performance, this report shows you where to take action to avoid overruns.
The Total Overhead lines provide a view of the total cost of doing business after indirect costs have been distributed.
The Tquick hourshours

Vision Reports
4-17
Project Summ
ary
cing project, you see total labor, ject managers use this report to
Project SummaryThe Project Summary report compares job-to-date expenditures to budgeted amounts. For each regular, revenue-produoverhead, total direct expenses, and total reimbursable expenses, compared to the project's budget. Principals and proanalyze how projects are performing against budget, and to monitor percent completes.
Hyperlinks enabled within the report allow you to drill-down and veiw transaction detail. This capability is available throughout Vision reporting.

Project Reports
Project DetailThe Project Detail report displays current period or job-to-date labor and expense transaction detail for each project. This report provides you with information on labor distribution, billing assistance, and project cost records.
The Labor section of the report shows which employees have charged time to a given project during any given time period that you specify.
This report also allows you to view the original point of entry for a transaction. You can view details such as the type of transaction and the date it was first entered into Vision.
4-18 Deltek Systems, Inc.

Vision Reports
4-19
Project R
eview
Click on a hyperlinked amount from the Project Review form and Vision displays the detail behind that amount.
Project ReviewThe Project Review form is an online snapshot displaying overall project performance.
Project R
eports
4-20D
eltek System
s, Inc.
and project managers use the rnings report for a high-level of financial activity for revenue- projects. This report includes ear-to-date, and job-to-date totals e, spent, and profit/loss, as well as -date totals, including revenue, nd accounts receivable.
Office Earnings
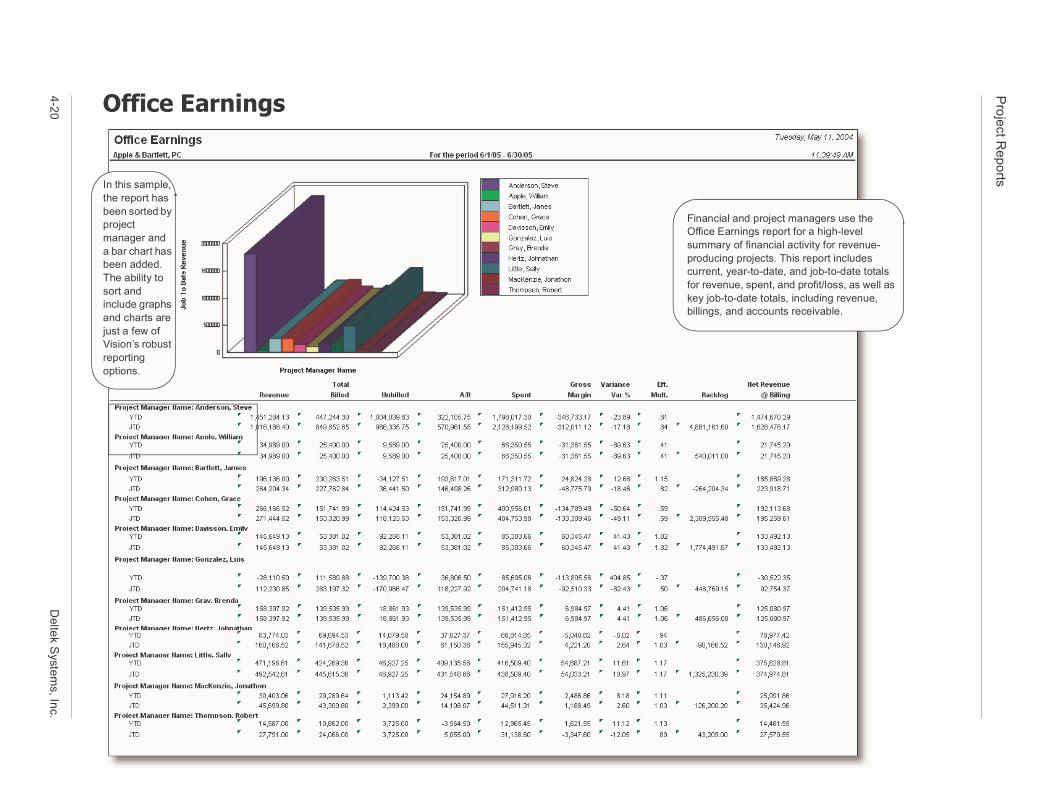
In this sample, the report has been sorted by project manager and a bar chart has been added. The ability to sort and include graphs and charts are just a few of Vision’s robust reporting options.
Financial Office Easummaryproducingcurrent, yfor revenukey job-tobillings, a

Vision Reports
4-21
Timesheet
the firm need to manage the company, tilization forecasting.
Use Vision’s Quick Find feature to quickly retrieve timesheets. You type in a portion of an employee name, and Vision returns a list of matching results from which you can choose. The Quick Find feature is available from all Vision applications.
Timesheet More than simply a record of time, Vision's Time and Expense entry drives key information that managers and others inincluding labor reporting, time analysis, real-time reporting of labor costs associated with project plans, invoicing, and u
The timesheet displays hourly totals (regular and overtime) by row, by day, and for the entire labor period.

Project Reports
4-22 Deltek Systems, Inc.

Vision Repor
5
P l a n n i n g R e p o r t sIn this section Planning Chart Revenue Forecast 12 Month Utilization Alert Report Project Planning Performance Project Planning Form (Summary Tab) Project Planning Form (Analysis Tab) Time Analysis
ts 5-25

Planning R
eports
5-26D
eltek System
s, Inc.
ts versus actual results to identify urs and costs to analyze task
Planning ChartThis report displays a numeric and visual analysis of the comparison between planned and baseline labor hours and cosfuture performance improvements. Project managers often use this report to compare planned and baseline to actual hoefforts or trends, and to confirm percent complete.
This simple three-line graph allows you to compare your baseline budget with your planned and actual amounts to provide you with key trend analysis.
Revenue Forecast
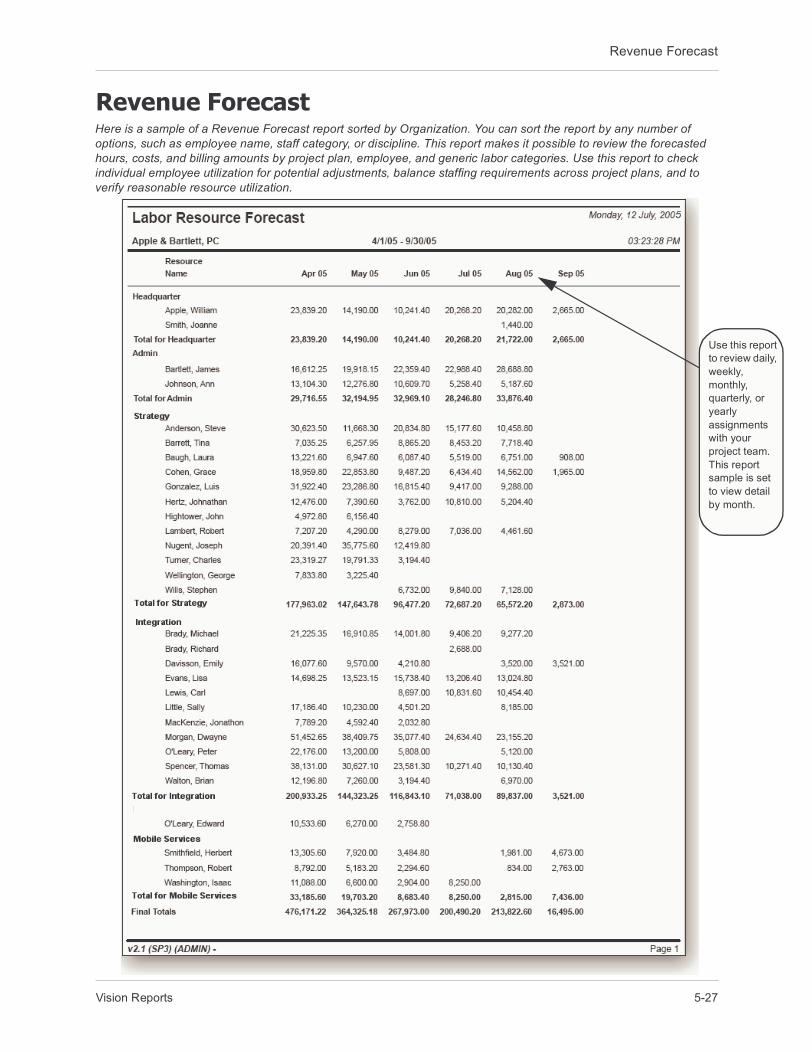
his report iew daily, ly, hly, erly, or y nments your ct team. report le is set w detail onth.
Revenue Forecast
Use tto revweekmontquartyearlassigwith projeThis sampto vieby m
Here is a sample of a Revenue Forecast report sorted by Organization. You can sort the report by any number of options, such as employee name, staff category, or discipline. This report makes it possible to review the forecasted hours, costs, and billing amounts by project plan, employee, and generic labor categories. Use this report to check individual employee utilization for potential adjustments, balance staffing requirements across project plans, and to verify reasonable resource utilization.
Vision Reports 5-27

Planning R
eports
5-28D
eltek System
s, Inc.
nagers use this report to review plan daily/ial adjustments. Team leaders, discipline across project plans and to verify
Based on ultilization parameters you define, you can quickly determine whether an employee is being under utlized (UNDER), over utilized (OVER), or is meeting expectations (OK).
12 Month Utilization Alert ReportThis report reviews the plan forecasts and displays a label signaling the over or under utilization of resources. Project maweekly/monthly/quarterly/yearly assignments with the project team and to check individual employee utilization for potentdirectors, resource managers and executive management review this report by resource to balance staffing requirementsreasonable resource utilization.

Project Planning Performance
ing
Project Planning Performance
This report provides a nice combination of budget and forecast information along with the project schedule.
Use the Project Planning Performance report to review project plan schedules and all aspects of plan performance includhistory, forecasts, hours, costs, and profitability.
Vision Reports 5-29

Planning Reports
ate
t he
is d
Project Planning Form (Summary Tab)
When you upda project plan, budget and cosinformation in tCost Summaryand Billing Summary gridsrecalculated andisplayed.
Use the Summary tab of Project Planning to get a quick overview of all billing, cost, revenue, and multiplier information about your plan.
5-30 Deltek Systems, Inc.

Project Planning Form (Analysis Tab)
Project Planning Form (Analysis Tab)The Analysis tab is a combination of user-entered fields, formulas, and results from the Labor, Expenses, and Consultants tabs. This data provides a quick overview of the plan's anticipated performance in the following areas: cost-based profit amount and profit percent, cost-based markup, billing-based variance and variance percent, and percent complete.
Vision Reports 5-31
Planning Reports
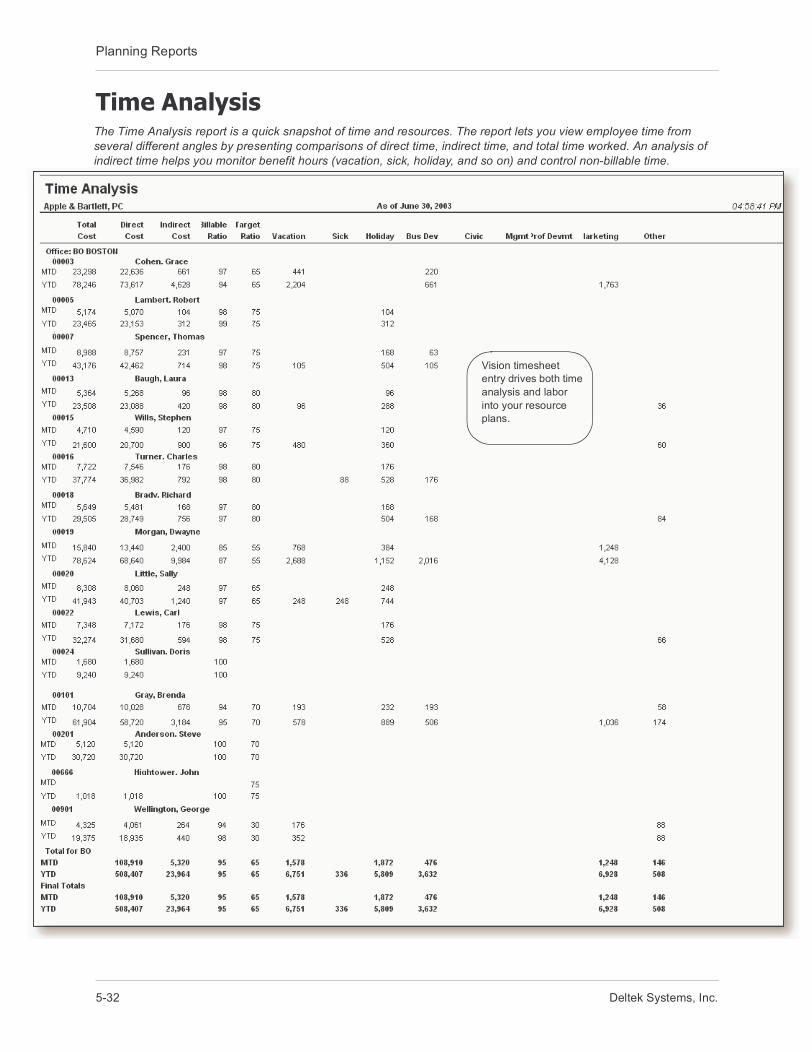
Time AnalysisThe Time Analysis report is a quick snapshot of time and resources. The report lets you view employee time from several different angles by presenting comparisons of direct time, indirect time, and total time worked. An analysis of indirect time helps you monitor benefit hours (vacation, sick, holiday, and so on) and control non-billable time.
Vision timesheet entry drives both time analysis and labor into your resource plans.
5-32 Deltek Systems, Inc.

Vision Repor
6
B i l l i n g R e p o r t sIn this section Unbilled Detail Report Invoice for Time and Materials Contract Invoice for Fee-Based Project Invoice For Fee-Based Project with Phases Billing Transfer Posting Log
ts 6-33

Billing R
eports
6-34D
eltek System
s, Inc.
t to help you prepare your invoice
Unbilled Detail ReportThe Unbilled Detail and Aging report shows transactions posted but not yet billed as of the date you specify. Use this reporreview, and to guide you in the process of editing data before creating final invoices.This report shows the billing status of each transaction: B-BillableH-HeldW-Written-off

Invoice for Time and Materials Contract
Invoice for Time and Materials Contract Invoices can be generated in batches or individually. Managers can work with the Interactive Billing application, which provides the flexibility needed to prepare invoices that make the client’s review of their bills as easy as possible. Here is an example of an invoice for a time and materials contract.
You can tailor invoice footers to include important information such as aged accounts receivable or payment terms.
This invoice uses the default invoice layout. In addition to the default, Vision also includes an intuitive Invoice Template Editor that allows you to easily create new invoice formats for specific client or project requirements.
Vision Reports 6-35

Billing Reports
Invoice for Fee-Based ProjectHere is an example of an invoice for a fee-based project. There are a variety of ways to calculate project-related fees. Some available methods include Percent Complete, Fixed Amount, and Percent Complete by Phase.
6-36 Deltek Systems, Inc.

Invoice For Fee-Based Project with Phases
Invoice For Fee-Based Project with PhasesHere is an example of an invoice for a fee-based project that is broken down into phases.
Vision Reports 6-37

Vision Reports
6-38
Billing Transfer P
osting Log
Billing Transfer Posting LogWhen you make changes to Vision at the time of billing, Vision updates other related areas in the application, such as the General Ledger. The Billing Transfer Posting Log shows you how projects and the General Ledger are affected by changes made in the Billing application at the time of billing.

Vision Repor
7
A c c o u n t i n g R e p o r t sIn this section Balance Sheet Income Statement Account Analysis Accounts Receivable Aged Accounts Payable Voucher Schedule
ts 7-39

Accounting Reports
Balance SheetThis standard accounting report shows the distribution of your firm's assets, liabilities, and net worth as of the current date. The Balance Sheet includes totals for assets, liabilities, and net worth, as well as a total for liabilities plus net worth.
7-40 Deltek Systems, Inc.

Income Statement
n
d
ll
de p
he the
ry-
Income Statement
As with other Vision reports, the Income Statement provides the ability to click oa hyperlinked amount to viewthe detail behinthe amount.
This report provides a detailed statement of your revenue and expense account balances for the current period and year-to-date. Vision uses these balances to calculate the firm's current period and year-to-date operating profit/loss, which appears at the bottom of the report.
Some detail has been removed from each sectionof this sample toallow all of the sections of the Income Statement to be displayed.
The Income Statement, and aVision financial statements, incluthe ability to roll-udata to display information at thecorporate level, tdepartment level,practice level, or whatever summaleve meets your needs.
Vision Reports 7-41

Accounting R
eports
7-42D
eltek System
s, Inc.
it is
This report provides an audit trail back to the original transaction entered into Vision, providing details such as the type of transaction and the entry date.
Account AnalysisThe Account Analysis provides a detailed analysis of the activity in each General Ledger account. It provides a clear audtrail for each transaction, can present current period transaction detail and cumulative year-to-date transaction detail, andthe General Ledger component of your firm’s official book of records. Separate reports may be produced for each organization within your company.
The Account Analysis lists each transaction by type, for example AP for accounts payable and EX foremployee expense.

Aged Accounts Receivable
Aged Accounts ReceivableFor each project, this report lists all outstanding invoices and groups them according to how long they have been outstanding. This report can help organize the collection process and improve cash flow.
Vision Reports 7-43

Accounting Reports
Accounts Payable Voucher ScheduleThe report prepares a projected payment schedule for outstanding vouchers. Aging for each voucher is also included.
7-44 Deltek Systems, Inc.

The following is a list of all standard reports included with Deltek Vision. This booklet provides a sample of some of these reports, using a sampling of available reporting options. All Vision reports can be tailored (using report options) to create a view of your project and financial data that best meets your needs.
L i s t o f R e p o r t s
Account Analysis — The General Ledger Account Analysis provides a detailed view of all General Ledger activity during the current accounting period. Since this report provides both closing balances and transaction detail, it serves as an audit trail of your General Ledger activity. See sample on page 7-42.
Accrued Time — The Accrued Time report gives you up-to-date information about benefit hours, such as vacation time.You can use this report to review how much time each employee has earned and taken during the current benefit year. You can also review information about each employee’s benefit hour balances.
AR Aged — The AR Aged report is used by project managers to analyze your firm’s accounts receivable. For each project, the report shows the balance due, the length of time the receivables have been outstanding, and when the last cash receipt was posted. You have the option of including a detail line for each invoice sent for the project. See sample on page 7-43.
AR Comments — The AR Comments report lists comments entered for outstanding invoices via the AR Comments dialog in the Accounts Receivable application.
AR Ledger — The AR Ledger report lets you review your firm’s billing history. For each project, phase, or task, the report shows each invoice generated and all payments received. The report also shows you the average collection period for all paid invoices.
AR Statement — The AR Statement is the statement that you send to a client.You determine the aging periods you want to appear in the statement, as well as the statement date and grace period. You can also display a comment on the statement.
Balance Sheet — This standard accounting report shows the distribution of your firm’s assets, liabilities, and net worth as of the current date. The Balance Sheet includes totals for assets, liabilities, and net worth, as well as a total for liabilities plus net worth. See sample on page 7-40.
Billing Terms List — The Billing Terms List shows all the billing terms defined for each project, including labor, expense, consultant, unit, fee, add-on, and interest/miscellaneous billing terms.
Budget Worksheet — The Budget Worksheet report shows labor and expense budget information you established, and Vision calculated, for the Project Budget Worksheet.
Cash Flow Forecast — The Cash Flow Forecast report forecasts projected cash amounts based on budget amounts in the General Ledger budget, for future periods. By analyzing the inflow and outflow of cash on the Cash Flow Forecast report, you can explain changes in cash during a given accounting period. You can also use this report to determine if sufficient funds are available from financing activities, show funds generated from all sources, and show how these funds are applied. For example, analyzing the Cash Flow Forecast report will tell you if there is enough cash to pay supplier’s bills and also pay bank loans, interest, and dividends.
Cash Journal — The Cash Journal lists every cash receipt and disbursement posted during the current accounting period or year-to-date for each bank code you select.
Cash Requirements — The Cash Requirements report contains all vouchers with balances and to be paid amounts currently in Vision.
Deltek Systems, Inc. List of Reports-45

L i s t o f R e p o r t s
Cash Requirements Bank Summary — The Cash Requirements Bank Summary presents, for each bank code that has amounts posted during the current period, a total amount for all vouchers. You can also run the report for a single bank code.
Check Register — The Check Register is used to view the checks processed during the current period. This report lists checks created through: cash disbursements, payroll (if your firm is using the Vision Payroll application), employee advance and expense processing, accounts payable disbursements, and accounts payable payment processing.
Client Avery 5161 — The Client Avery 5161 report consists of client mailing labels that you can print using Avery 5161 labels (three labels across a page). Addresses for active clients are included in the report.
Client List — The Client List is a display of all clients in the current database.
Client Summary — The Client Summary report includes all fields in the Client Info Center, including user-defined fields, grouped into default sections. You may also create user-defined sections if you like. See sample on page 3-10 through page 3-11.
Consultant Ledger — The Consultant Ledger report details information about consultant invoices on a project-by-project basis.
Contact Avery 5160 — The Contact Avery 5160 report consists of mailing labels that you can print using the Avery 5160 labels (three labels across a page). You can include client contacts, vendor contacts, or both.
Contact Avery 5161 — The Contact Avery 5161report consists of mailing labels that you can print using the Avery 5161 labels (two labels across a page). You can include client contacts, vendor contacts, or both.
Contact List — The Contact List is a display of all contacts in the current database.
Contact Summary — The Contact Summary report includes all fields in the Contact Info Center, including user-defined fields, grouped into default sections. You may also create user-defined sections if you like.
CRM Employee Summary — The CRM Employee Summary report includes all fields in the Employee Info Center, including user-defined fields, grouped into default sections. You may also create user-defined sections if you like.
CRM Project Summary — The CRM Project Summary report includes data from the current database for all project-related fields in the Info Center, including user-defined fields, grouped into default sections. You may also create user-defined sections if you like.
CRM Vendor Summary — The CRM Vendor Summary report includes all fields in the Vendor Info Center, including user-defined fields, grouped into default sections. You may also create user-defined sections if you like.
Employee Labor Detail — The Employee Labor Detail report shows how employees use their time, by showing the projects and tasks to which employees have posted labor. This report is available only if your firm is using the Vision Billing application.
Employee Ledger — The Employee Ledger report provides a complete record of employee expense activity. For each employee, the report shows all expenses reported and all advances and repayments made, for a specific period or range of periods.
Employee List — The Employee List shows all of the data currently available from employee records. You can use this information to verify the information entered through the Employee Info Center.
List of Reports-46 Deltek Systems, Inc.

L i s t o f R e p o r t s
Employee Payroll List — The Employee Payroll List shows all of the data currently in your employee payroll database. You use this report to review the data entered through the Employee Info Center and the cumulative postings that result from Payroll Processing.
Expense Detail — The Expense Detail report is used by project managers to see transaction detail for all of the expenses associated with a project, phase, or task.
Expense Summary — Project managers can use the Expense Summary report to compare actuals to budgeted amounts, by account. This report presents a subset of expense data from the Project Summary report, broken out by account number. If your firm is using the Vision Planning application, you can use the options on the Budget tab to specify whether Vision draws budget data from plans or from projects.
Form 940 Worksheet — The Form 940 Worksheet provides data that you need to fill out the IRS Form 940, Employer's Annual Federal Unemployment (FUTA) Tax Return.
Form 941 Worksheet — The Form 941 Worksheet provides most of the information you need to fill out the IRS Form 941, Employer’s Quarterly Federal Unemployment Tax Return.
Income Statement — The Income Statement provides a detailed statement of your revenue and expense account balances for the current period and year-to-date. Vision uses these balances to calculate the firm’s current period and year-to-date operating profit/loss, which appear at the bottom of the report. See sample on page 7-41.
Invoice Register — The Invoice Register is used to view the invoices posted during the current period through Invoice transaction entry or through the Billing system.
Key Financial Metrics — The Key Financial Metrics report makes it possible for you to see, in one place, key performance indicators for your firm's business. Chief financial officers and project managers may want to use the Key Financial Metrics report to review key statistics such as year-to-date revenue, expenses, and profit, effective multipliers, and the percentage of opportunities won out of those opened.
Labor Cross Charge — The Labor Cross Charge report is designed to track labor swaps between organizations for those firms using the Organization application. This report shows each labor transaction that results when an employee from one organization (profit center) works on a project belonging to another organization. This report is available to only those who have purchased the Vision Organization application.
Labor Detail — The Labor Detail report displays labor information, including the regular, overtime, and total number of hours worked for each employee, labor code, task, phase, and project. If your security level lets you see labor amounts, the report also displays both regular and overtime amounts.
Labor Plan Charts — The Labor Plan Charts report displays a numeric and visual analysis of the comparison between planned and baseline labor hours and costs versus actual results to identify future performance improvements. For each plan included on the Labor Plan Charts report, Vision displays bar graphs representing: planned labor hours, cost amounts, or billing amounts; actual labor hours, cost amounts, or billing amounts; baseline labor hours, cost amounts, or billing amounts.
Labor Plan Summary — The Labor Plan Summary report is used to compare planned and baseline hours against EAC (estimate at completion) hours. This comparison is used to analyze the plan's percent complete status. On the Date Basis tab, you specify the date Vision should use in calculating ETC (estimate-to-completion) and JTD (job-to-date) numbers.
Deltek Systems, Inc. List of Reports-47
L i s t o f R e p o r t s
Labor Resource Actuals — Use the Labor Resource Actuals report to review actual labor hours for projects. You might do this to analyze past performance, to develop more accurate estimates for upcoming plans/opportunities, or to improve performance on similar projects in the future.
Labor Resource Forecast — The Labor Resource Forecast makes it possible to review the forecasted hours, costs, and billing amounts by project plan, employee, and generic labor categories. See samples on page 5-27 and page 5-28.
Labor Resource Planned/Actuals — The Labor Resource Planned/Actuals report is used to review both planned and actual labor hours for projects. You might do this to determine if the project is on target, to understand the reasons why or why not, and to improve performance on similar projects in the future.
Labor Summary — The Labor Summary report is used by project managers to compare actuals to budget amounts, by labor code. The Labor Summary report presents a subset of labor data from the Project Summary report, broken out by labor code. If your firm is using the Vision Planning application, you can use the options on the Budget tab to specify whether Vision draws budget data from plans or from projects.
Lead Avery 5160 — This report consists of mailing labels that you can print using the Avery 5160 labels (three labels across a page).
Lead Avery 5161 — The Lead Avery 5161 report consists of mailing labels that you can print using the Avery 5161 labels (two labels across a page).
Lead List — The Lead List is a display of all leads in the current database. Use it to see information such as the lead's rating (level of interest), source, and status.
Lead Summary — The Lead Summary report includes all fields in the Lead Info Center, including user-defined fields, grouped into default sections. You may also create user-defined sections if you like.
Marketing Campaign List — The Marketing Campaign List is a full display of all marketing campaigns in the current database. Use it to compare the campaign budget to actual costs or to see information such as the target audience and type of campaign. See sample on page 3-8.
Marketing Campaign Summary — The Marketing Campaign Summary report includes all fields in the Marketing Campaigns Info Center, including user-defined fields, grouped into default sections. You may also create user-defined sections if you like.
Missing Billing Terms List — The Missing Billing Terms List shows all of your projects that have no billing terms.
Office Earnings — The Office Earnings report is used by financial and project managers to view a high-level summary of financial activity for revenue-producing projects. The Office Earnings report includes current, year-to-date, and job-to-date totals for revenue, spent, and profit/loss, as well as key job-to-date totals, including revenue, billings, and accounts receivable. See sample on page 4-20.
Opportunity Forecast — The Opportunity Forecast report is used to review probability estimates and predicted revenue numbers for opportunities your firm is pursuing. You can specify that the predicted revenue be allocated on the estimated start date or end date, or spread proportionally across a time span that you specify. See sample on page 3-9.
Opportunity List — The Opportunity List is a display of all opportunities in the current database. See sample on page 3-12.
List of Reports-48 Deltek Systems, Inc.

L i s t o f R e p o r t s
Opportunity Summary — The Opportunity Summary report includes all fields in the Opportunity Info Center, including user-defined fields, grouped into default sections. You may also create user-defined sections if you like.
Overhead Allocation — The Overhead Allocation report shows the allocation of overhead, either through proration or assignment, to all regular projects as of the last time overhead allocation was run. The YTD Overhead column on this report should tie to the total indirect expenses on your Income Statement.
Payroll Labor Detail report — The Payroll Labor Detail report shows how employees use their time. It shows the projects and tasks to which employees have posted labor.
Profit Planning Monitor — The Profit Planning Monitor lets you monitor corporate budgets. It lists each revenue and expense account. For each account, it shows the budgeted and actual amounts for the current period and year-to-date. It also shows totals for actual and budgeted revenue and expense and calculates actual and budgeted profit/loss.
Project Detail — The Project Detail report displays current period or job-to-date labor and expense transaction detail for each project. See sample on page 4-18.
Project List — The Project List report presents data for each project (and its phases and tasks, if any) in the current database.
Project Planning Analysis — The Project Planning Analysis report makes it easy for you to compare actuals (job-to-date) to your original plan.
Project Planning List — The Project Planning List is simply a reference list of project plans. You can search by project manager, organization, principal, or client.
Project Planning Performance — The Project Planning Performance report is used to review project plan schedules and all aspects of plan performance including history, forecasts, hours, costs, and profitability. See sample on page 5-29.
Project Planning Schedule — The Project Planning Schedule report presents project plan schedules in Gantt Chart format, by the different task (WBS) levels set up in the plan.
Project Planning Task Dependency — In the Project Planning application, you can establish Finish-to-Start relationships between the tasks in a plan. When you do this, you're indicating that a given task, the predecessor, must be completed before work on its successor can begin.
Project Progress — The Project Progress report is one of Vision's primary project management tools for providing key data about a single project. By comparing labor and expense budgets with actual performance, this report shows you where to take action to avoid overruns. See sample on page 4-16.
Project Summary — The Project Summary report compares job-to-date expenditures to budgeted amounts. For each regular, revenue-producing project, you see total labor, overhead, total direct expenses, and total reimbursable expenses, compared to the project's budget. Principals and project managers use this report to analyze how projects are performing against budget, and to monitor percent completes. You typically generate this report after a labor or expense posting. See sample page 4-17.
Sales List — The Sales List report lets you review all sales and associated taxes that occurred during a specific period, a range of periods, a range of dates, or on a year-to-date basis.
Deltek Systems, Inc. List of Reports-49

L i s t o f R e p o r t s
State/Local Income Tax Worksheet — The State/Local Income Tax Worksheet supplies you with most of the information you need to fill out your state’s quarterly income tax form. The state form, which often corresponds to Form 941, Employer’s Quarterly Federal Tax Return, reports: gross wages that your firm paid to employees during the previous quarter; 401(k) and 125/Cafeteria withholdings; state or local income tax withheld.
State Unemployment Insurance Worksheet — The State Unemployment Insurance Worksheet supplies you with the data you need to fill out your State Unemployment Insurance (SUI) report. The actual name of the form that you use to submit this information varies from state to state. For example, it is the Employer’s Quarterly Contribution Report for Massachusetts, and the DE-3, Quarterly Contribution Return in California. Some states do not have an SUI form, so you may not need to print the State Unemployment Insurance Worksheet.
Tax Analysis — The Tax Analysis report lets you review purchases, sales, and associated taxes. You can also use it to review tax related entries for employee expenses. You can list transactions that occurred during a specific period, a range of periods, a range of dates, or for the year to date.
Text Library List — The Text Library List report presents just the name and description for each text library record in the Text Library Info Center. If you want to see additional data, use the Text Library Summary report.
Text Library Summary — The Text Library Summary report includes data from the current database for all text library records. You may also create user-defined sections if you like.
Time Analysis — The Time Analysis report lets you view employee time from several different angles by presenting comparisons of direct time,
indirect time, and total time worked. An analysis of indirect time helps you monitor benefit hours (vacation, sick, holiday, and so on) and control non-billable time. See sample page 5-32.
Trial Balance — The Trial Balance includes the opening and closing balances for each of your General Ledger accounts as well as the total debits and credits for the accounts. You can use this report to verify that your debits equal your credits.
Unbilled Detail and Aging — The Unbilled Detail and Aging report shows the transactions posted but not yet billed as of the date specified in the Bill-thru date or Bill-thru period field. The report name toggles between "Unbilled Detail and Aging" and "Unbilled Detail," depending upon whether you specify any aging column(s) for the report. The timing of the report relative to accepting final bills determines the report's contents. See sample on page 6-34.
Unbilled Summary — For each project, phase, and task included in the report, the Unbilled Summary shows billable, written-off, and held amounts for labor, consultants, expenses, and units. You can also see a total of what has been billed, job-to-date, for the project, phases, and tasks.
Unposted Labor — The Unposted Labor report is used to review: all timesheet data in unposted transaction entry files (indicated by the code DE on the report); all Time & Expense timesheets that are in progress or submitted, but not posted (indicated by a code of TK on the report).
Vendor List — The Vendor List is a full display of all vendors in the current database.
Vendor Summary — For each vendor, the Vendor Summary provides: data from the vendor record, such as number, name, address, organization, and whether a 1099 form is required; address information, including multiple addresses for a single vendor; billed and paid
List of Reports-50 Deltek Systems, Inc.

L i s t o f R e p o r t s
amounts for the current period, year to date, and vendor to date; accounting information such as the vendor's payment terms and discount codes.
Voucher Ledger — The Voucher Ledger provides you with historical information for all vouchers. Payments, adjustments, and voids made against each voucher in Vision are displayed.
Voucher Schedule — The Voucher Schedule provides a projected payment schedule for outstanding vouchers. It shows each of your outstanding Accounts Payable vouchers, when the voucher is scheduled for payment, and how long it will remain unpaid. The Voucher Schedule report compares the aging date to the invoice date, payment date, or voucher date to determine the aging timeframe. The amounts on this report should be equal to the amounts on your Balance Sheet (in your liability accounts). See sample on page 7-44.
Vouchers by Project — The Vouchers by Project report prints all voucher information, organized by project and task. This report lists the scheduled payment date and amount for the vendor as well as the total balance left on the voucher.
Withholdings by Category — The Withholdings by Category report provides you with current, quarter-to-date, and year-to-date amounts for each withholding category in your database. For each withholding category, Vision breaks out the withholding amounts by employee and then lists the totals for each category.
Deltek Systems, Inc. List of Reports-51
While every attempt has been made to ensure that the information in this document is accurate and complete, some typographical or technical errors may exist. Deltek Systems, Inc. cannot accept responsibility for any kind of loss resulting from the use of this publication.
This page shows the original publication date. The information contained in this publication is subject to change without notice. Any improvements or changes to either the product or the book will be documented in subsequent updates.
This publication contains proprietary information which is protected by copyright. All rights are reserved. No part of this document may be electronically reproduced or transmitted in any form or by any means, electronic or mechanical, or translated into another language, without the prior written consent of Deltek Systems, Inc.
This edition published September 2004.
© Deltek Systems, Inc., 2002-2004.
Unpublished-rights reserved under the copyright laws of the United States.
VisionReports_online_PS_9_16_04