Deliberative structures and their impact on voting ...
59
Deliberative structures and their impact on voting behavior under social conflict * Jordi Brandts † Leonie Gerhards ‡ Lydia Mechtenberg § February 19, 2018 Abstract Inequalities in democracies are multi-faceted. They not only incorporate differ- ences in economic opportunities, but also differences in access to information and social influence. In a lab experiment, we study the interaction of these inequalities to provide a better understanding of socio-political tensions in modern societies. We identify the tragedy of the elite, the dilemma that privileged access to information about a fundamental state that mediates political conflict creates lying incentives for the better informed. In our experiment, an electorate consists of two groups, one informed and one uninformed about an uncertain state of the world. Incen- tives depend on this state. Before voting the two groups can communicate. We study four different communication protocols which vary the access to communica- tion channels of the two groups and are meant to represent societies with different degrees of openness. We hypothesize that the deliberative structures affect group identities, preferences, and voting. Our observed outcomes largely coincide with those predicted by our theoretical analysis. Keywords : Communication, Social Conflict, Inequality JEL codes : C92, D91 * We would like to thank seminar participants at University of Konstanz, GATE Lyon and Erasmus University Rotterdam as well as participants of the Workshop on Microeconomics at Leuphana University L¨ uneburg 2016, the 10th Maastricht Behavioral and Experimental Economics Symposium, the EWEBE in Bologna 2017, the TIBER 2017 Symposium on Psychology and Economics at Tilburg University and the UECE Game Theory Lisbon Meetings 2017 for their helpful comments and useful suggestions. The authors gratefully acknowledge financial support from the Spanish Ministry of Economics and Competi- tiveness through Grant: ECO2017-88130 and through the Severo Ochoa Program for Centers of Excellence in R&D (SEV2015-0563), the Generalitat de Catalunya (Grant: 2017 SGR 1136) and the Antoni Serra Ramoneda (UAB – Catalunya Caixa) Research Chair as well as from the Graduate School of the Faculty of Business, Economics and Social Sciences, Universit¨ at Hamburg. † Corresponding author: Institut d’An` alisi Econ` omica (CSIC) and Barcelona GSE, Campus UAB, 08193 Bellaterra (Barcelona), Spain. Fax: +34 93 580 1452. Tel.: +34 93 580 6612. Email: [email protected] ‡ Department of Economics, Universit¨ at Hamburg, Von-Melle-Park 5, 20146-Hamburg, Germany. Tel.: +49 40 42838 5573. Email: [email protected] § Department of Economics, Universit¨ at Hamburg, Von-Melle-Park 5, 20146-Hamburg, Germany. Tel.: +49 40 42838 9484. Email: [email protected] 1
Transcript of Deliberative structures and their impact on voting ...

Deliberative structures and their impact on votingbehavior under social conflict∗
Jordi Brandts† Leonie Gerhards‡ Lydia Mechtenberg§
February 19, 2018
Abstract
Inequalities in democracies are multi-faceted. They not only incorporate differ-ences in economic opportunities, but also differences in access to information andsocial influence. In a lab experiment, we study the interaction of these inequalitiesto provide a better understanding of socio-political tensions in modern societies. Weidentify the tragedy of the elite, the dilemma that privileged access to informationabout a fundamental state that mediates political conflict creates lying incentivesfor the better informed. In our experiment, an electorate consists of two groups,one informed and one uninformed about an uncertain state of the world. Incen-tives depend on this state. Before voting the two groups can communicate. Westudy four different communication protocols which vary the access to communica-tion channels of the two groups and are meant to represent societies with differentdegrees of openness. We hypothesize that the deliberative structures affect groupidentities, preferences, and voting. Our observed outcomes largely coincide withthose predicted by our theoretical analysis.Keywords: Communication, Social Conflict, InequalityJEL codes: C92, D91
∗We would like to thank seminar participants at University of Konstanz, GATE Lyon and ErasmusUniversity Rotterdam as well as participants of the Workshop on Microeconomics at Leuphana UniversityLuneburg 2016, the 10th Maastricht Behavioral and Experimental Economics Symposium, the EWEBEin Bologna 2017, the TIBER 2017 Symposium on Psychology and Economics at Tilburg University andthe UECE Game Theory Lisbon Meetings 2017 for their helpful comments and useful suggestions. Theauthors gratefully acknowledge financial support from the Spanish Ministry of Economics and Competi-tiveness through Grant: ECO2017-88130 and through the Severo Ochoa Program for Centers of Excellencein R&D (SEV2015-0563), the Generalitat de Catalunya (Grant: 2017 SGR 1136) and the Antoni SerraRamoneda (UAB – Catalunya Caixa) Research Chair as well as from the Graduate School of the Facultyof Business, Economics and Social Sciences, Universitat Hamburg.†Corresponding author: Institut d’Analisi Economica (CSIC) and Barcelona GSE, Campus UAB,
08193 Bellaterra (Barcelona), Spain. Fax: +34 93 580 1452. Tel.: +34 93 580 6612. Email:[email protected]‡Department of Economics, Universitat Hamburg, Von-Melle-Park 5, 20146-Hamburg, Germany. Tel.:
+49 40 42838 5573. Email: [email protected]§Department of Economics, Universitat Hamburg, Von-Melle-Park 5, 20146-Hamburg, Germany. Tel.:
+49 40 42838 9484. Email: [email protected]
1

1 Introduction
Inequality in democracies does not only involve differences in economic opportunities,
but also differences in access to information about the workings of society, as well as
different levels of social influence through different access to communication channels. A
sound analysis of how these inequalities interact and potentially even reinforce each other
is essential for a better understanding of some of the current socio-political tensions in
modern societies. In this paper we present the results from a lab experiment based on a
voting game that sheds light on these interactions.
We study an environment which represents a society split into two distinct groups
that differ along various dimensions. The state of the world is uncertain and while the
members of one of the groups have some information about the state of the world, the
members of the other group are uninformed. In both states of the world the same set
of policies can be implemented, which lead to different distributions of material payoffs
between the groups. In one state of the world the two groups have conflicting material
interests, whereas in the other state their material interests are aligned. Hence, there
is a state in which a consensus should be easy to reach and another state which leads
to potential political conflict. The collective choice of policy is determined through a
vote in which all individuals from both groups can participate. Before the vote takes
place the individuals of both groups can communicate with each other under protocols or
deliberative structures that differ in hierarchy between the informed and the uninformed.
Our focus is on how such different deliberative structures affect preferences, information
aggregation and transmission, voting behavior and outcomes.
Our motivation stems primarily from political situations in democracies in which the
information about prevailing economic conditions is often unequally distributed between
social groups (Borgonovi et al. (2010), Pande (2011) and Sapienza and Zingales (2013)).
In particular, in cases where the informed and the uninformed parts of the society have
different interests, efficient outcomes may be hard to reach, because the problems of
information aggregation and transmission interact with the conflict between social groups.
Information about the state of the world transmitted by the informed to the uninformed
may not be truthful or may be suspected not to be. All this may lead to society’s inefficient
use of information and to social conflict.
We propose that different deliberative structures trigger distinct preferences of the
members of the two groups in the spirit of the notion of state-dependent preferences
introduced by Bowles and Polanıa-Reyes (2012). State-dependence arises because actions
are motivated by a heterogeneous repertoire of preferences the salience of which depends
on the nature of the decision situation (p. 373). The general idea is that preferences often
depend on some specific features surrounding the act of choice which are salient to the
2

decision-makers involved.1 In our case we propose that different deliberative structures
affect group identities and hence players’ preferences.
In our experiments the two groups have different payoffs and receive different infor-
mation, so that there are two fundamental asymmetries between them. We use different
colors to refer to the two groups, white for the informed and blue for the uninformed.2
Given these differences we study how group identity is affected by the different delib-
erative structures. We vary the audience that players of each color can address at the
communication stage. Our hypothesis is that these variations lead to two different group
identities of the two groups, being either color-group identity or voting-group identity, i.e.
the group that includes both color groups.
We study four deliberative structures in four distinct experimental treatments. In our
baseline treatment, NoChat, there is no communication between participants. The other
three deliberative structures model different degrees of openness of a society. In the first
of the deliberative structures we study, called Deliberation, the two groups are on equal
foot and communication is unrestricted. All members of both groups can freely chat with
each other. Specifically, each individual can write messages that are seen by all other
participants and read the messages written by all other participants. With this structure
we want to represent the ideal situation of an open society where all members of a society
participate under equal conditions in the exchange of ideas that takes place before voting.
In the two other structures we incorporate into the modeling the unequal access of
different social groups to the public communication process in actual democracies. In
the deliberative structure called TopDown only the informed group has access to public
communication channels. In this case all members of the informed group can write mes-
sages that are seen by all other participants, whereas all the members of the uninformed
group can read all the messages written by all participants in the informed group, but can
themselves not write any messages. Those who are better informed are also those who
dominate the communication process. Nevertheless in TopDown the content of whites’
communication is transparent. The society is integrated and all its members know what
is being said at all times. By contrast, in TopDownClosed, there is an additional element
of segregation in the communication process which gives the informed group an additional
advantage. In this structure, there are two stages. First, all members of the informed
group can freely communicate with each other without the uninformed being able to read
these messages. The second stage is like TopDown above, i.e. all members of the in-
formed group can write messages that are seen by all other participants, whereas all the
members of the uninformed group can read all the messages written by all participants
1Bowles and Polanıa-Reyes (2012) focus on how the presence of monetary incentives triggers differentpreferences.
2The experiment was conducted in Germany, where “white” and “blue” (collar) do not have the samesocial connotation as in the English-speaking world.
3

in the informed group, but can themselves not write any messages.
Democracy at its best involves more than just decision making through voting. It also
requires a process of interaction between all members of a society, without exclusion, in
which different societal options are discussed. When this process takes place under ideal
conditions it is often referred to as deliberation. Through a pure deliberation process
people can become more willing to come to adopt the identity of the group as a whole
(Dawes et al. (1990), Orbell et al. (1988), Dryzek and List (2003)).
However, if communication before voting takes place under restrictive conditions then
the outcome may be that the members of one or more of the social groups involved in
the process simply stick to the identity of their own group in which all individuals have
the same interest. The first circumstance that may matter for what identity is adopted is
whether a group has access to addressing the other group or is prevented from doing so
and, hence, has a mere passive role. If a group is subordinated to others in such a way it
may be less inclined to take the interests of the society as a whole into account. Second,
it may also be of consequence whether members of a group have to directly address those
of the other group or can first communicate among each other in a private secluded way.
Separate communication between groups has been hypothesized to lead to polarization
in opinions (Sunstein (2009), Benoıt and Dubra (2014)). We formalize these ideas in
the Theoretical Appendix B. Equilibrium analysis of the resulting game provides us with
predictions guiding the empirical analysis of our experimental data.
The implications of these ideas are as follows: In NoChat, the treatment without any
communication, both groups simply have their default identity, which is the identity of
their own group (color-group identity). In Deliberation both groups have the identity of
the society as a whole (voting-group identity), since in the communication process they
both address the society, i.e. the voting group as a whole. In TopDown the uninformed
group has a color-group identity again, since it has merely a passive role in communication.
By contrast the informed group has a voting-group identity, since its members are still
in a position in which they directly address the society as a whole and, hence, take the
interests of all members of society into account. Finally, in TopDownClosed both groups
have a color-group identity for the following reasons: For the uninformed the situation is
the same as in TopDown: they are fully passive and hence have their default identity. For
the informed we conjecture that they also adopt the identity of their own group, since
they communicate privately among themselves before addressing the society as a whole,
a circumstance that makes them focus exclusively on the interests of their own group.
We predict that communication and voting behavior is based on the adopted group
identity. In a group with voting-group identity, individuals have efficiency preferences and
maximize the expected material payoffs of the entire society. In a group with color-group
identity, individuals only maximize the expected material payoffs of their own group.
4

Therefore, according to our prediction efficiency is highest in Deliberation, second-highest
in TopDown and lowest in TopDownClosed and NoChat.
Researchers in political science have devoted much attention to issues of deliberation,
see in particular Cohen (1989), Gutmann and Thompson (1996), Habermas (2015) and
Landwehr (2010). Myers and Mendelberg (2013) give an overview of work on political
deliberation and Karpowitz and Mendelberg (2011) survey the experimental literature in
political science on the topic.
Previous experimental work has found evidence in favor of communication affecting
group identity. Chen and Li (2009) report on an experiment in which they study the
effects of induced group identity in an environment with an ingroup and an outgroup.
They find that participants are more altruistic towards members of an ingroup and that
chat communication within the ingroup leads to stronger ingroup favoritism. In the related
experiment of Chen and Chen (2011) participants play a coordination game with either
an ingroup or an outgroup. In one of the treatments the coordination game is preceded by
a problem-solving task designed to enhance group identity in which participants can chat
with each other. They find that stronger communication – more words, more content –
has a positive effect on the ingroup and a negative effect on the outgroup. Robalo et al.
(2017) also induce ingroup bias in an experiment related to political issues without using
communication. They group people according to the results of a personality questionnaire
and find that political participation is higher when ingroup bias is stronger. In our case,
groups are distinguished by asymmetric payoffs and access to information.
Without the focus on group identities, pre-vote communication has already been stud-
ied in the extensive literature on voting, recently surveyed in Palfrey (2016). For instance,
the results in Guarnaschelli et al. (2000) and Goeree and Yariv (2011) document that pre-
play communication of either a straw-vote or unrestricted chat communication lead to an
increase in the efficiency of the voting outcome. By contrast, Buechel and Mechtenberg
(2017) show that pre-vote communication in social networks can lower efficiency even in
a common-interest setting.
Palfrey and Pogorelskiy (forthcoming) study the effects of two different communication
protocols on voter turnout in an experiment with individuals belonging to two competing
parties and costly voting. The issue of voter turnout is quite different from our focus,
but the distinction between public communication (all voters exchange messages through
a computer chat) and party communication (messages are only exchanged within each
party) is related to our distinction between different deliberative structures. Their result
is that both types of communication favor the majority party.
Pronin and Woon (2017) study how the social benefits of deliberation are robust to
the existence of private communication between parts of the society, prior to a public
discussion. In a setting in which a group of players has to allocate a fixed budget between
5

themselves and a public good they find that allowing for private messages before the
public discussion leads to the under-provision of the public good. Again, the particular
issue they study is very different from ours, but the communication protocol they study
is related to our TopDownClosed treatment.
Although our main motivation stems from the political realm, our analysis can also
be related to the effects of institutionalized communication protocols in organizational
economics (Ambrus et al., 2013). For example, Brandts and Cooper (2007) compare the
effects on coordination of various communication protocols between a manager and work-
ers. Brandts and Cooper (2015) study how different communication protocols between a
central manager and two branches of an organization affect its efficiency.
Our novel contribution to the literature reviewed above is that we simultaneously
study (1) how two groups solve a state-dependent conflict of interest, (2) how efficiently
they aggregate information on that state held by one of the groups, and (3) how both
conflict solution and information aggregation are affected by communication protocols
that shape group identity.
The rest of the paper is organized as follows. Section 2 presents the experimental
design and procedures. Section 3 contains our hypotheses. Sections 4 and 5 contain
our results; and in section 6 we summarize and relate the phenomena we observe in the
laboratory to some naturally occurring social issues.
2 Experimental design
The game Consider the following voting game: Six players form a voting group, con-
sisting of three white players and three blue players. These players vote on a policy from
a set of three alternatives (A, B, and C). The implemented policy determines state-
dependent payoffs that may differ by color. At the beginning of the game, nature draws
the state of the world, which is either X or Y with equal probability. Then, nature
randomly draws an informative private signal on the state of the world for each white
player. These signals are conditionally independent and true with probability p = 0.7.
Blue players do not receive any signal.
Subsequently, a communication stage starts. We consider three alternative deliberative
structures (communication protocols): (i) Whites and blues can publicly communicate
with each other; (ii) the whites but not the blues can send (public) messages; and (iii)
the whites can first communicate with each other unobserved by the blues and then send
public messages that are also received by the blues. Hence, moving from (i) to (ii),
the whites get gradually more control over the communication process. In the first step
(moving from (i) to (ii)), the additional, protocol-based asymmetry between the colors
is purely behavioral; in the second step (moving to (iii)), it becomes strategic since (iii),
6

other than the other two protocols, allows the whites to send different messages to their
own and the other color. On all communication stages, messages are sent simultaneously,
and sending an empty message is possible for all senders.
Table 1: Payoffs for blue and white players, conditional of the state of the world andimplemented policies
State X State Y
Policy Whites Blues Policy Whites Blues
A 20 20 A 10 0
B 0 0 B 20 10
C 0 10 C 0 20
Finally, the voting stage starts. Each individual chooses whether to vote for one of
the three policies A, B, and C, or to abstain. Voting is costless. The final policy is
implemented according to the plurality rule (i.e., the final policy is the one that got most
votes); and ties are resolved randomly.
The state of the world interacts with the implemented policy in generating final payoffs,
as displayed in Table 1. Given the chosen payoffs, state X can be considered the good
state of the world, Y the bad state: On the one hand, the efficient policy in X, policy
A, yields a larger total payoff than the efficient policy B in Y (3× 20 + 3× 20 = 120 vs.
3×20+3×10 = 90); on the other hand, the efficient policy in X leads to a fair allocation
of payoffs (both white and blue players earn 20), while the efficient policy in Y generates
a payoff inequity (20 for white players, 10 for blue players).
In the good state X, whites and blues would agree on the most preferred policy: Both
would like to implement policy A. This is, however, not true in the bad state Y : While
the whites would prefer B to be chosen, the blues would prefer C instead. Hence, the two
color types have a state-dependent conflict. This conflict in state Y is particularly sharp
since, in the eyes of the whites, C is the worst of all options. The efficient policy choice
would be A in state X and B in state Y and is hence both state-dependent and in line
with the preferences of the whites.
We chose this design for two reasons. First, we want to model an understudied infor-
mational asymmetry that is often observed in reality: Only one group (the whites) has
information on whether or not their material interests conflict with those of the other
group (the blues). Second, we wanted to rule out a trade-off between efficient information
aggregation and efficient policy-choice. Though interesting in itself, such a trade-off is
not what we want to study in this paper. Our game is designed to study a combined
information-transmission and collective-choice problem if only one part of the collective
7

has information about whether the choice is to be made in a common-interest situation
or in the presence of group conflict.
The state-dependent conflict gives the white players an incentive to lie about the state
of the world, if, given the majority of signals, they expect the bad state of the world Y . In
this case, truthfully reporting the majority signal (i.e., the signal received by the majority
of whites) would lead selfish blue players to vote for C. The whites would vote for B,
which ultimately generates a tie between policies B and C yielding each white player an
expected payoff of 12× 20 + 1
2× 0 = 10. If, however, the whites successfully lied about
the state of the world such that the blues expected the good state X and hence vote for
A, the whites would expect to earn 12× 10 + 1
2× 20 = 15 if they themselves chose their
optimal policy B. Obviously, and as shown in Appendix B, successful lies cannot be part
of an equilibrium here – instead, communication would become meaningless (”babbling”).
Stretching the political interpretation of the game a bit, this dilemma could be called the
tragedy of the elite: If those who do not belong to it do not internalize its interests but
only care for their own, the elite has an incentive to use its informational advantage to
manipulate the less-well informed away from the conflict. But if the elite does so, trust
and hence information aggregation break down and the conflict sharpens.
Experimental treatments We conducted four experimental treatments as depicted
in Table 2.3 The treatments Deliberation, TopDown, and TopDownClosed implement the
above game with communication stage (i), (ii), and (iii), respectively. Communication
is implemented as computerized free-style chat. In Deliberation and TopDown, the chat
lasted for two minutes. In TopDownClosed, both the first (private) chat among the whites
and the second (public) chat lasted for one minute each.4 We decided to exogenously re-
strict the duration of the chat stage in order to keep the total duration of the experimental
sessions comparable within and across treatments.
Treatment NoChat implements the above game without the communication stage.
However, directly after the information stage, our subjects in NoChat have the opportu-
nity to take private notes in a computer window that looks exactly like the chat window
in the other treatments. We thus tightly control the task- and time-structure of all treat-
ments.
We asked our subjects to focus their communication (in NoChat their notes) on the
voting decision at hand. Apart from that we did not impose any restrictions on their
3Translated instructions to all treatments are included in Supplementary online material C4From the post-experimental feedback that we received from the subjects and the analysis of the
chat contents, we are confident that our time constraint on the chat is not binding. Moreover, in acomparable experimental setup, Goeree and Yariv (2011) observe that an unconstrained pre-vote chatbetween privately informed voters lasted only for 26 +/- 11 seconds on average. We hence conjecturethat a chat duration of two minutes gives our subjects sufficient time to share the whites’ information(or lies) as well as to deliberate on the policy to be chosen.
8

Table 2: Implemented deliberative structures across treatments
White players Blue players
write read write readNoChat − − − −Deliberation X X X XTopDown X X − XTopDownClosed X/X X/X − −/XIn TopDownClosed the first entry refers to the private chat among
the whites, the second entry relates to the subsequent public chat.
writing. All subjects received IDs that indicated their color type (white or blue) and a
number between 1 and 3 (for instance, ”Blue 2”). These IDs were randomly assigned
in the beginning of every round such that subjects were not able to recognize and track
individuals throughout the different rounds.
Procedures Overall, we conducted 20 sessions with 468 subjects in total, half of them
assumed the roles of white, the other half the roles of blue players. In NoChat and
Deliberation we ran five sessions each, all of them comprising 24 subjects. In TopDown and
TopDownClosed we ran four sessions with 24 subjects and one session with 18 subjects,
each. Sessions lasted for 20 rounds. Subjects were randomly assigned their color (white
or blue) at the beginning of the session and kept it throughout the 20 rounds of the
experiment. The groups, however, were randomly re-matched at the beginning of each
round (stranger matching).
We used z-tree developed by Fischbacher (2007) to computerize our treatments and
the recruiting software hroot developed by Bock et al. (2014) to randomly assign subjects
to treatments. The experiment was run with student subjects from various study back-
grounds at the WISO-laboratory of Hamburg University. During the sessions payments
were expressed in experimental currency points which were exchanged to Euros at a rate
of 1 Euro = 3 Points at the end of the experiment. Average earnings for the 120 minutes
sessions amounted to 23.28 Euro (s.d. 4.73), including a 10 Euro show-up fee (minimum
earnings = 10 Euro, maximum earnings = 30 Euro).
For the three communication treatments we analyzed the chat content following the
procedures of Brandts and Cooper (2007).
3 Hypotheses
We analyze the games of our four treatments in Appendix B. There, we characterize
the (plausible) equilibria and formally derive our theoretical predictions. The intuition,
however, is quite simple: Our hypotheses are based on the idea that the deliberative
9

structure affects players’ social preferences, as argued by various empirical and theoretical
studies in the recent literature in the political science. As presented in the introduction,
we adopt the idea from normative deliberation theories that individuals internalize the
interests of those whom they have to convince in the course of deliberation. In our
setting, this means that any player maximizes the sum of expected payoffs of himself
and all players whom he can address during the chat. Put differently, we assume that
players have efficiency preferences that are restricted to their respective audiences on
the communication stage. In addition, we assume that when there is more than one
communication stage (as in TopDownClosed), it is the audience of the first communication
stage that determines players’ preferences.
In our equilibrium analysis in Appendix B, we argue that the following type of voting
strategy of the two colors is (1) efficient and (2) part of an equilibrium if both colors have
a voting-group identity, i.e., efficiency preferences that concern the entire voting group:
The whites truthfully communicate their signals to all other players, regardless of their
color; and players vote in such a way that a plurality of votes is for A if the majority
of signals indicate that the state is X and for B if the majority of signals indicate that
the state is Y. Note that such a type of strategy implements a compromise: If state Y,
the state of color-conflicting interests, is more likely than X, the blues refrain from voting
for their best choice C and vote for their second-best choice B instead, which is efficient.
Note that given this behavior of the blues, the whites have no incentive to lie to them
about the state.
However, if the blues have a color-group identity, i.e., if preferences of the blues are not
efficiency-oriented towards the total voting group but restricted to the material interests
of their own color, then the efficient strategies break down and other types of voting
strategies become equilibria. In particular, blues who only care for their own color prefer
C over B if the conflict state Y is more likely than X. Hence, since C is the worst choice
for the whites and inefficient under any signal distribution, the whites have the incentive
to lie to the blues if they can, making them believe that the state is X rather than Y
and that therefore, A is the blues’ best choice, rather than C. But if the whites lie, their
messages will not be believed in equilibrium, and the blues will be even more motivated
to vote for C, which is the policy that benefits them most in expectation if information
about the true state is absent.
In the face of this dilemma, we argue that the communication structure matters since
it affects both the preferences of the colors and the incentive of the whites to lie about the
true state. Based on our equilibrium analysis in Appendix B, Table 3 summarizes how
our four different treatments (i.e., communication structures) affect (1) the preferences
of the blues, (2) the possibility of information aggregation, and (3) the incentive of the
whites to lie to the blues. For better understanding, note that the whites, even if they
10

want to lie to the blues, also always want to truthfully inform the other whites about
which signal they got. In Appendix B, we argue that the second motive dominates the
first so that the whites will not lie to the blues if this implies lying to the other whites.
Table 3: Preferences for efficiency and their impact on information aggregation
Efficiency preferences of the... Informationaggregation is
possible
Equilibrium incentivesof the whites to lie to
the bluesWhites Blues
NoChat X no no –
Deliberation X X X no
TopDown X no X no
TopDownClosed X no (X) XX indicates for each of the treatments if, in equilibrium, (i) the whites andblues assume a voting-group identity and hence have efficiency preferences,(ii) whether information aggregation is possible and (iii) if the whites havean incentive to lie to the blues. Note that in TopDownClosed, in equilibriuminformation aggregation is only possible in the private chat, but not in thepublic chat.
Based on our equilibrium analysis in Appendix B, our hypotheses below consider the
following possible voting outcomes: A/A (all votes placed by whites/blues are for policy
A), A/C (the whites vote for A and the blues for C), B/B (all votes placed by whites/blues
are for policy B), and B/C (the whites vote for B and the blues for C). We call the voting
outcomes in which the blues vote for C a conflict outcome.5
Based on Propositions 1, 2, 3, and 4 (see Appendix B) that pertain to behavior in
NoChat, Deliberation, TopDown and TopDownClosed, we predict to observe the following
voting outcomes: Voting strategies per treatment are as presented in Table 46; and the
comparative statics across treatments are as summarized in hypotheses 1-4. The latter
are tested in Section refsec:testinghypotheses.
Hypothesis 1a (Voting outcomes given majority signal X) Given majority signal
X, the efficient outcome A/A is realized more often in Deliberation and TopDown than in
TopDownClosed and NoChat. Conversely, conflict outcome A/C is realized more often in
TopDownClosed and NoChat than in Deliberation and TopDown.5Other voting outcomes that are not part of any equilibrium might empirically occur, too. One salient
example would be B/A under majority signal Y: The whites, though informed that Y is likely to pertain,successfully convince the blues that X pertains, so that, while they themselves vote for B, the blues votefor A, which is better than C for the whites. This is no equilibrium (since in equilibrium, lies wouldnot be believed), but though not predicting such outcomes, we do not exclude them from the empiricalanalysis.
6In our predictions we consider only equilibria without abstentions. This has been corroborated bythe data. In Appendix B, we also derive equilibria with abstention.
11

Table 4: Whites’ and blues’ predicted voting decisions, by treatment and majority signal
State of the world: X State of the world: Y
Whites Blues Whites Blues
NoChatA C A or B C
DeliberationA A B B
TopDownA A B C
TopDownClosedA C B C
Hypothesis 1b (Voting outcomes given majority signal Y) Given majority signal
Y, the efficient outcome B/B is realized more often in Deliberation than in any other
treatment. Conflict outcome B/C, conversely, is realized more often in TopDown and
TopDownClosed than in Deliberation.
Hypothesis 2a (Whites’ voting decisions) Given majority signal X, the whites’ propen-
sity to vote for the efficient policy A does not differ across the four treatments. Given
majority signal Y, the whites’ propensity to vote for the efficient policy B is lowest in
NoChat and does not differ across the communication treatments.
Hypothesis 2b (Blues’ voting decisions) Given majority signal X, the blues’ propen-
sity to vote for the efficient policy A is higher in Deliberation and TopDown than in Top-
DownClosed and NoChat. Given majority signal Y, the blues’ propensity to vote for the
efficient policy B is higher in Deliberation than in any of the other treatments.
Hypothesis 3a (Whites’ lying) In Deliberation and TopDown the whites are more of-
ten truthful than in TopDownClosed.
Hypothesis 3b (Blues’ trustfulness) In TopDownClosed the blues condition their votes
less on the majority message sent by the whites than in any of the other communication
treatments.
Hypothesis 4 (Efficiency ranking) The sum of all players’ payoffs is largest in De-
liberation, second-largest in TopDown, third-largest in TopDownClosed and lowest in
NoChat.
12

Our hypotheses summarize predictions on the equilibria and their efficiency in our
one-shot voting game under the assumption borrowed from political science that delib-
erative structures affect group identities and hence preferences. Note that Appendix B
also contains standard economic predictions (which predict no treatment differences be-
tween NoChat, Deliberation and TopDown and only one minor difference between these
treatments and TopDownClosed).
We test our hypotheses 1 – 4 in experimental treatments with stranger matching, as
usual when implementing one-shot games in the lab. However, stranger matching still
allows for dynamics, in particular learning, not only of the game itself, but also, and
maybe most importantly, about typical types of behavior of other players. Hence, we
empirically analyze these dynamics, too.
4 Hypotheses testing
4.1 Voting outcomes at the group level
We start by testing our hypotheses on realized voting outcomes conditional on the ma-
jority signal, that is, the signal received by the majority of whites (Hypotheses 1a and
1b). In Table 5 we present the incidences of the following voting outcomes that we intro-
duced in Section 3 above: A/A, B/B, A/C and B/C. Here, A/A and B/B refer to voting
outcomes in which all six voting group members either vote for A or B, depending on the
majority signal. A/C and B/C describe voting outcomes in which the three blues vote
for C and the three whites either for A or B, respectively. We expect A/C to only occur
if the majority signal is X and B/C only if the majority signal is Y. Besides these voting
outcomes, we also consider the so called “Split-whites” outcome in which all blues vote
for C and all whites follow their individual signal (vote for A if the own signal is X, vote
for B if it is Y).7
Table 5 displays the distribution of the voting outcomes of interest across treatments
and majority signals. Grey cells indicate the predicted equilibrium outcomes as derived in
Appendix B, figures printed in bold highlight observed modal voting outcomes. Besides
the precise equilibrium outcomes, we also present information about voting outcomes
in which at most one of the blue and/or one of the white players deviated from the
equilibrium strategy. We call these realizations “almost” realizations.
Consider, first, the left part of the table. At first glance, Hypothesis 1a is mostly con-
firmed. This observation is corroborated by the logit regressions presented in Table 6, in
which we regress the respective voting outcomes on treatment dummies and additionally
7See Appendix B for a more detailed description of the voting outcomes that we expect to result fromequilibrium play.
13

Table 5: Voting outcomes at the group level – Conditional on the received majority signal
Majority signal: X Majority signal: Y
NoChat Deliberation TopDown TopDownClosed NoChat Deliberation TopDown TopDownClosed
A/A 0 0.386 0.201 0.143 0 0.059 0 0.021Almost A/A 0.038 0.284 0.358 0.328 0.018 0.059 0.055 0.105(Almost) A/A 0.038 0.670 0.559 0.471 0.018 0.119 0.055 0.126
A/C outcome 0.338 0.121 0.106 0.159 0.295 0.103 0.114 0.052of this: Split-whites 0.184 0.023 0.011 0.037 - - - -Almost A/C outcome 0.513 0.181 0.307 0.339 0.476 0.086 0.095 0.126(Almost) A/C outcome 0.850 0.302 0.413 0.497 0.771 0.189 0.209 0.178
B/B 0 0 0 0 0 0.086 0.005 0.005Almost B/B 0 0.005 0 0.005 0 0.124 0.065 0.058(Almost) B/B 0 0.005 0 0.005 0 0.211 0.070 0.063
B/C outcome 0 0 0 0 0.012 0.216 0.313 0.283of this: Split-whites - - - - 0.006 0.092 0.164 0.152Almost B/C outcome 0.013 0 0.006 0 0.090 0.238 0.328 0.257(Almost) B/C outcome 0.013 0 0.006 0 0.102 0.454 0.642 0.539
Split-whites 0.269 0.023 0.017 0.037 0.030 0.108 0.174 0.168
Other 0.098 0.023 0.022 0.026 0.108 0.027 0.025 0.094
Observations 234 215 179 189 166 185 201 191
In “Almost” outcomes at most one player per color group deviates from the respective outcome. Grey cells indicateequilibrium outcomes, figures printed in bold highlight the observed modal voting outcomes for the respective treatmentand signal combination. Split-whites is also an equilibrium outcome, see Appendix B; however, since it includes abstention,it does not belong to the predicted outcomes.
control for period effects. In all regressions, NoChat serves as baseline treatment. Addi-
tional results from Wald tests on treatment differences are presented in the bottom part
of the table. Model (1) reveals that given majority signal X, A/A is significantly more
frequently realized in Deliberation and TopDown than in the other two treatments, as
predicted. Analogously, Model (2) indicates that the “conflict outcome” A/C is realized
significantly more often in NoChat than in Deliberation and TopDown, again as predicted.
However, different from what Hypothesis 1a predicts, we do not find a significant differ-
ence in A/C realizations between TopDownClosed and Deliberation as well as TopDown,
respectively (see the insignificant Wald tests presented in the lower part of the table).
Next, we turn to our test of Hypothesis 1b. The descriptive statistics presented in
the right part of Table 5 and the regression analysis in Model (3) from Table 6 reveal
that, given majority signal Y, B/B is more frequently realized in Deliberation than in any
other treatment, just as predicted. However, in contrast to what we expected, B/C is
not significantly less often realized in Deliberation than in TopDown or TopDownClosed
(see Model (4)). On the contrary, B/C is the modal outcome in Deliberation. Overall,
Hypothesis 1b is hence only partly confirmed.
We will provide explanations for the deviations from our Hypotheses 1a and 1b, that
is, the relatively large number of conflict outcomes in all communication treatments, in
Section 4.4 and Section 4.5 below, when we discuss the blues’ voting and the whites’ lying
behavior.
Finally, we turn to Figure 1, which presents the evolution of voting outcomes over the
14

Table 6: Voting outcomes
Majority signal: X Majority signal: Y
(1) (2) (3) (4)A/A A/C B/B B/C
Deliberation 18.966∗∗∗ −1.417∗∗∗ 16.835∗∗∗ 3.182∗∗∗
(D) (0.539) (0.448) (0.726) (0.944)
TopDown 17.791∗∗∗ −1.554∗∗∗ 13.909∗∗∗ 3.678∗∗∗
(TD) (0.453) (0.489) (1.036) (0.924)
TopDownClosed 17.262∗∗∗ −1.048∗∗∗ 14.029∗∗∗ 3.512∗∗∗
(TDC) (0.623) (0.300) (1.043) (0.904)
Period −0.178∗∗∗ 0.076∗∗∗ −0.480∗∗∗ 0.044∗∗
(0.033) (0.020) (0.083) (0.018)
Constant −17.606∗∗∗ −1.460∗∗∗ −16.519∗∗∗ −4.930∗∗∗
(0.493) (0.324) (0.566) (0.949)
Wald test results for comparison of treatment coefficients (p values):
D vs. TD 0.024 0.797 0.002 0.142TD vs. TDC 0.010 0.231 0.921 0.403D vs. TDC 0.000 0.326 0.005 0.248
Pseudo R2 0.305 0.086 0.454 0.112Number of clusters 20 20 20 20Observations 817 817 743 743
Pooled logit regressions. Dependent variable: Realization of the respectivevoting outcome. Standard errors are clustered at the session level and givenin parentheses: ∗ p<0.10, ∗∗ p<0.05, ∗∗∗ p<0.01. NoChat serves as baselinetreatment in all regressions.
20 periods. As evident, the incidences of conflict outcomes (A/C and B/C ) increases in
all 4 treatments. This observation is corroborated by the significant Period coefficients
in the regressions from Table 6 as well as summary statistics presented in Table C.1 and
Table C.2 (see Supplementary online material C). In particular in the communication
treatments, after an initial phase of high cooperation and low conflict, the opportunity
to chat does not lead to sustainable coordination on the efficient A/A (B/B) outcome in
case the received majority signal is X (Y). Instead, if the majority signal indicates state
X, more and more often A/C is realized in later rounds. If the majority signal indicates
Y, we increasingly often observe the B/C outcome. The effectiveness of deliberative
democracy hence seems to deteriorate over time. We will come back to this phenomenon
in Section 4.4.
4.2 Whites’ voting decisions
The logit regression results presented in Table 7 reveal that the whites’ propensity to vote
for the efficient policy A does not differ significantly between Deliberation, TopDown, and
TopDownClosed (see Model (1) and the respective Wald test results). This is in line with
our Hypothesis 2a. However, contrary to our prediction, the whites’ propensity to vote
for A after majority signal X is significantly higher in the communication treatments than
in NoChat.
15

Figure 1: Voting outcomes depending on the majority signal that the whites receive
16

A similar picture emerges when we consider the whites’ voting behavior given majority
signal Y. As predicted by Hypothesis 2a, the whites’ propensity to vote for the efficient
policy B is not significantly different across the communication treatments. It is, however,
significantly higher in these treatments compared to NoChat (see Model (5) and the
respective Wald test results), again as predicted.
Table 7: Individual voting decisions of the whites
Majority signal: X Majority message: X Majority signal: Y Majority message: Y
(1) (2) (3) (4) (5) (6) (7) (8)A vote B vote A vote B vote A vote B vote A vote B vote
Deliberation 2.050∗∗∗ −2.030∗∗∗ 0.813 −0.655 −1.853∗∗∗ 1.840∗∗∗ −0.371 0.315(D) (0.541) (0.546) (0.860) (0.905) (0.256) (0.259) (0.339) (0.339)
TopDown 1.391∗ −1.544∗ −2.090∗∗∗ 2.102∗∗∗
(TD) (0.737) (0.809) (0.297) (0.303)
TopDownClosed 2.440∗∗∗ −2.424∗∗∗ −1.720∗∗ 1.850∗∗ −1.986∗∗∗ 1.974∗∗∗ −0.491 0.465(TDC) (0.554) (0.557) (0.832) (0.893) (0.328) (0.328) (0.611) (0.596)
Period 0.062∗∗ −0.066∗∗∗ −0.039∗∗ 0.037∗∗ 0.050∗∗∗ −0.051∗∗∗ 0.021 −0.024∗
(0.025) (0.023) (0.015) (0.016) (0.012) (0.013) (0.013) (0.014)
Constant 1.711∗∗∗ −1.695∗∗∗ 4.198∗∗∗ −4.323∗∗∗ 0.620∗∗∗ −0.616∗∗∗ −1.626∗∗∗ 1.663∗∗∗
(0.258) (0.252) (0.672) (0.761) (0.190) (0.200) (0.315) (0.322)
Wald test results for comparison of treatment coefficients (p values):
D vs. TDC 0.595 0.593 0.001 0.001 0.669 0.660 0.845 0.801D vs. TD 0.459 0.609 0.397 0.344TD vs. TDC 0.237 0.353 0.764 0.707
Pseudo R2 0.115 0.119 0.121 0.123 0.124 0.124 0.009 0.009Number of clusters 20 20 15 15 20 20 15 15Observations 2451 2451 2112 2112 2229 2229 1278 1278
Pooled logit regressions. Dependent variable: Decision to vote for the respective policy. Standard errors are clustered at thesession level and given in parentheses: ∗ p<0.10, ∗∗ p<0.05, ∗∗∗ p<0.01. NoChat serves as baseline treatment in regressions(1), (2), (5) and (6). TopDown is the baseline in the other regressions.
4.3 Blues’ voting decisions
In Table 8 we study the blue players’ voting decisions in more detail in logit regressions
that are analogous to the ones that we considered in Table 7. Model (1) reveals that
given majority signal X, the blues vote more often for the efficient policy A in Deliberation
and TopDown than in TopDownClosed and NoChat, as predicted in Hypothesis 2b. All
observed treatment differences in the blues’ propensity to vote for A are significant. The
only exception is the difference between TopDown and TopDownClosed, which goes into
the right direction, but is just not significant.
If we focus on those rounds in which the majority signal is Y (Model (5)), we observe
that the blues’ propensity to vote for the efficient policy B, along with the whites, is
significantly higher in Deliberation than in TopDown, TopDownClosed and NoChat. This
confirms our statement made in Hypothesis 2b. The same is true if we restrict our
attention to those rounds in which the whites (truthfully) report majority message Y (see
the regression results and corresponding Wald tests from Model (7)).
17

Table 8: Individual voting decisions of the blues
Majority signal: X Majority message: X Majority signal: Y Majority message: Y
(1) (2) (3) (4) (5) (6) (7) (8)A vote C vote A vote C vote B vote C vote B vote C vote
Deliberation 2.688∗∗∗ −2.016∗∗∗ 0.418 −0.429 2.227∗∗∗ −0.780∗ 0.717∗∗∗ −0.646∗∗
(D) (0.260) (0.398) (0.280) (0.298) (0.406) (0.468) (0.247) (0.272)
TopDown 2.237∗∗∗ −1.533∗∗∗ 1.726∗∗∗ −0.096(TD) (0.279) (0.400) (0.327) (0.422)
TopDownClosed 1.892∗∗∗ −1.273∗∗∗ −0.297 0.238 1.174∗∗∗ −0.559 0.002 −0.081(TDC) (0.223) (0.355) (0.219) (0.221) (0.399) (0.404) (0.179) (0.188)
Period −0.085∗∗∗ 0.086∗∗∗ −0.097∗∗∗ 0.104∗∗∗ −0.109∗∗∗ 0.067∗∗∗ −0.105∗∗∗ 0.094∗∗∗
(0.013) (0.013) (0.013) (0.011) (0.023) (0.014) (0.025) (0.023)
Constant −1.144∗∗∗ 0.366 1.189∗∗∗ −1.330∗∗∗ −2.430∗∗∗ 0.664∗ −0.640∗∗∗ 0.503∗∗∗
(0.218) (0.335) (0.246) (0.245) (0.328) (0.356) (0.196) (0.190)
Wald test results for comparison of treatment coefficients (p values):
D vs. TDC 0.000 0.000 0.002 0.005 0.002 0.414 0.014 0.053D vs. TD 0.081 0.075 0.048 0.024TD vs. TDC 0.106 0.208 0.023 0.010
Pseudo R2 0.169 0.120 0.065 0.069 0.115 0.041 0.072 0.059Number of clusters 20 20 15 15 20 20 15 15Observations 2451 2451 2112 2112 2229 2229 1278 1278
Pooled Logit regressions. Dependent variable: Decision to vote for the respective policy. Standard errors are clusteredat the session level and given in parentheses: ∗ p<0.10, ∗∗ p<0.05, ∗∗∗ p<0.01. NoChat serves as baseline treatment inregressions (1), (2), (5) and (6). TopDown is the baseline in the other regressions.
4.4 Which factors can explain the blues’ voting decisions?
Next, we analyze the reasons for which the blues vote for C, in conflict with the whites.
For this, we consider the content and tone of the chat messages that were sent in the
communication treatments and study how these affect the blues’ propensity (not) to vote
in accordance with the whites’ wishes.8 These and the remaining test results are presented
in Table 9.
Consider, first, the left part of the table in which we focus on those rounds in which
the whites report majority message X. These are the rounds in which the whites either
truthfully reveal their majority signal or lie to make the blues believe that situation
X prevails. In logit regressions Model (1) and (2) we regress the blues’ propensity to vote
for A and C, respectively, on treatment dummies for Deliberation and TopDownClosed
(TopDown serves as baseline treatment in these regressions), a dummy variable that
indicates if the reported majority message in the previous round was inconsistent with
the actual state of the world (“Potential lie”), and two further dummies that capture
the tone of the whites’ messages (respectful and disrespectful language). Moreover, we
8In our analysis we focus on frequently observed chat classifications. A full list of the dimensions inwhich the chat messages were coded can be found in the Supplementary online material C. Two researchassistants coded the chat messages independently from each other (we refer to them as Coder #1 andCoder #2). In the regressions presented in this paper, we rely on the work done by Coder #1. Theresults remain largely unchanged when we use the codings of Coder #2 instead. The results are availablefrom the authors upon request.
18

include four additional dummy variables that capture whether the whites mention the
experimental environment as justification of their behavior (“our signals are not 100%
correct” and similar statements) and attempt to appeal to the blues’ public spirit. Lastly,
we add a control variable for the round of play. As evident from the significant period
coefficient, voting for A (voting for C) is on average more likely in earlier rounds (in later
rounds). Moreover, voting for A (voting for C) is significantly less likely (more likely)
if the reported majority message in the previous round was inconsistent with the actual
state of the world (“Potential lie”) and if the whites treated the blues disrespectfully.
Whites referring to the experimental environment in order to justify their behavior, like
the inbuilt probability of wrong signals, or whites mentioning the group’s “joint welfare”
have no significant effects on the blues’ voting decisions.
Table 9: Communication treatments: Individual voting decisions of the blues
Majority message: X Majority message: Y
(1) (2) (3) (4)A vote C vote B vote C vote
Deliberation 0.528∗ −0.555∗ 0.971∗∗∗ −0.823∗∗∗
(D) (0.277) (0.290) (0.313) (0.305)
TopDownClosed −0.298 0.213 −0.037 −0.044(TDC) (0.205) (0.213) (0.209) (0.203)
Potential lie in previous period −0.224∗∗ 0.289∗∗∗ −0.089 0.146(0.102) (0.100) (0.255) (0.189)
Respectful whites 0.079 −0.085 0.554∗∗∗ −0.587∗∗∗
(0.134) (0.136) (0.201) (0.179)
Disrespectful whites −0.583∗∗∗ 0.596∗∗∗ −1.149∗∗∗ 0.914∗∗∗
(0.143) (0.143) (0.326) (0.338)
Whites mention experimental 0.037 −0.033 −0.156 0.269environment as information (0.079) (0.080) (0.261) (0.196)
Whites mention experimental 0.102 −0.117 −0.241 0.002environment to justify their behavior (0.194) (0.191) (0.275) (0.268)
Whites mention the public spirit 0.081 −0.080 0.059 −0.042(0.157) (0.146) (0.181) (0.177)
Whites mention whites’ and 0.071 −0.083 0.229 −0.022blues’ joint payoffs (0.157) (0.143) (0.216) (0.272)
Period −0.088∗∗∗ 0.092∗∗∗ −0.089∗∗∗ 0.079∗∗∗
(0.014) (0.013) (0.026) (0.022)
Constant 1.110∗∗∗ −1.227∗∗∗ −0.754∗∗∗ 0.564∗∗∗
(0.261) (0.267) (0.235) (0.208)
Wald test results for comparison of treatment coefficients (p values):
D vs. TDC 0.001 0.001 0.008 0.018
Pseudo R2 0.061 0.065 0.082 0.068Number of clusters 15 15 15 15Observations 2001 2001 1230 1230
Pooled Logit regressions. Dependent variable: Decision to vote for the respective pol-icy. Standard errors are clustered at the session level and given in parentheses: ∗ p<0.10,∗∗ p<0.05, ∗∗∗ p<0.01. TopDown serves as baseline treatment in all regressions. All chatcontent categories that were recorded in at least 15% of the whites’ chat messages (exceptspecific voting recommendations) are included as explanatory variables.
Next we turn to those rounds in which the whites report majority message Y. It is
19

common knowledge that this majority message is not a lie, since, given the monetary
payoffs, the whites have no incentive to make the blues believe that situation Y prevails if
in fact they believe that it is situation X. For this analysis we regress the blues’ propensity
to vote for B (Model (3)) and C (Model (4)) on the same explanatory variables as in Models
(1) and (2). As evident, if the reported majority message is Y, voting for B (voting for
C) does not depend on the perceived correctness of the previous state of the world (see
the insignificant coefficient of “Potential lie”). Voting for B (voting for C) is on average
less likely (more likely) if the whites treat the blues disrespectfully. Treating the blues
respectfully has the opposite effect, potentially reinforcing the general positive effect of
telling the truth to the blues. Whites referring to the experimental environment in order
to justify their behavior or mentioning the joint welfare have no significant effects on the
blues’ voting decisions. Lastly, also in case the majority message is Y, voting for B (voting
for C) is on average more likely in earlier rounds (in later rounds).
To summarize our findings: If the reported majority message is X, the blues vote for
C more often when they suspect having been lied to in the previous round and when
being treated disrespectfully. This behavior could be considered both an indication for
the blue players’ general distrust in the reported message or a desire for revenge or spite-
fulness. Suspecting having been lied to in the previous round has less of an effect on the
blues’ voting decisions if the reported majority message is Y. The impact of disrespectful
language is, however, still sizable.
4.5 The whites’ lying behavior
In Table 10, we present summary statistics on the white players’ decision to lie about
their signals. Since the whites only have an incentive to lie conditional on the majority
signal indicating state Y (to make the blues rather vote for policy A instead of C), we
focus our analysis on decision rounds in which the majority signal is Y . We hence define
lying as the group of white players reporting majority message X (that is, at least two
of the whites report an X) if, in fact, their majority signal was Y. This means that we
consider only pivotal lies.
Table 10: Lying behavior
NoChat Deliberation TopDown TopDownClosed
Lying and not reporting if majority signal is Y (% of white groups)
Majority message 6= majority signal – 22.16 11.44 35.08Silent whites – 0 0 12.04
Total number of voting groups – 185 201 191
Considering the mere descriptive statistics, the figures in Table 10 suggest that the
whites are least truthful in TopDownClosed, as predicted by Hypothesis 3a (frequency of
20

lies in Deliberation: 22.16%, in TopDown: 11.44% and in TopDownClosed : 35.08%). We
corroborate the significance of the treatment differences in an additional OLS regression.
In the specification presented in Table 11 we regress the dummy variable for a white
sub-group reporting majority message Y on a dummy that takes value 1 if the whites’
majority signal is Y (and 0 otherwise), dummies for treatments Deliberation and Top-
Down and interaction terms between the majority signal and treatment dummies. As
evident from the coefficient “Majority signal: Y”, the correlation between observed ma-
jority signal and reported majority message is relatively large and highly significant in
TopDownClosed, which serves as baseline treatment in the regression. This observation
could, for instance, be explained by a general lying aversion in the sense of Gneezy et al.
(forthcoming). However, more importantly, the correlations between observed majority
signal and reported majority message are even stronger in Deliberation and TopDown,
as indicated by the respective positive and significant interaction terms. We can hence
confirm our respective Hypothesis 3a.
Table 11: Received and reported states of the world
Majority message: Y
Majority signal: Y 0.596∗∗∗
(0.089)
Deliberation −0.001(0.007)
Deliberation × Majority signal: Y 0.178∗
(0.099)
TopDown 0.000(0.007)
TopDown × Majority signal: Y 0.284∗∗
(0.097)
Constant 0.005(0.005)
R2 0.640Number of clusters 15Observations 1130
Pooled OLS regressions. Dependent variable: Reported majority signal: Y.Standard errors are clustered at the session level and given in parentheses:∗ p<0.10, ∗∗ p<0.05, ∗∗∗ p<0.01. Note that the TopDownClosed treatmentserves as baseline treatment.
Moreover, Model (3) from Table 7 reveals that the whites lie and subsequently vote
strategically more often in in TopDownClosed than in the other communication treat-
ments. More precisely, we find that if the whites report majority message X, they choose
policy B more often in TopDownClosed than in the other communication treatments.
This suggests that they use the initial private chat phase to aggregate their signals and
to coordinate on lying to the blues in the subsequent public chat phase. If the whites do
not lie about the state of the world, that is, if they report majority message Y, voting
does not differ significantly across the communication treatments (see Model (7)).
Next, we study how the whites’ propensity to lie and the blue players’ trustfulness
21

evolve over time. Figure 2 shows the respective graphs separately for the three communi-
cation treatments. In all three graphs, the solid blue line indicates the fraction of groups
in which the reported majority message X turns out to be wrong. This outcome can
either obtain if the whites report a majority message which does not coincide with their
majority signal – we label these incidences “pivotal lies” and graphically present them
as dashed lines – or it can obtain as a result of the noisy signal structure – remember,
each of the three signals per group is only true with 70% probability. These latter cases
are labeled as “wrongly informed whites” and are graphically presented as dotted lines.
In Deliberation we are able to directly record the blues’ trustfulness from the content of
their chat messages. Whenever at least one of the blues voices suspicion that the whites
do not report the state of the world truthfully, we count this as an incidence of distrust,
represented as a solid yellow line.9 In TopDownClosed, finally, there is quite a substantial
fraction of white sub-groups who do not report any signal to their fellow blues in the
public chat at all (12.04% on average). We represent these incidences as a solid red line
in the respective graph.10
Consider, first, Deliberation. Observationally, there seems to be a positive correlation
between “Potential lie” – that is, instances in which the reported majority signal proves
to be wrong – and blue players’ mentioning of distrust in the public chat. In fact, a large
part of these potential lies only result from majority signals that turn out to be wrong.
Nevertheless, over time, the blues’ trust seems to deteriorate.
Next, we turn to TopDown. Interestingly, we do not record any pivotal lies in any
of the first 9 rounds in this treatment. Also in later rounds we observe on average more
instances of unintentionally falsely reported majority messages than true lies. As already
discussed above, in this treatment, the whites lie only very rarely: on average only 11.44%
of the groups that receive majority signal Y lie about the state of the world.
Finally, in TopDownClosed, in all rounds except in rounds 6 and 9, we observe that
at least one of the white sub-groups that received majority message Y lies to their fellow
blues. Moreover, in all rounds, except in 5, 9, 10 and 13, at least one of the white
sub-groups does not report any signals to the blues at all. As discussed above, this is
the treatment in which the whites report their signals least truthfully, on average. This
is in line with our predictions, although the treatment difference is much smaller than
predicted.
The question remains why the whites lie to the blues and – considering that they do so
also in the public chat in Deliberation and TopDown – why they do it even at the expense
9As before, we rely on Coder #1’s codings of distrust in the figures that are presented in the paper.Similar results apply if we rely on Coder #2’s codings. These are available from the authors upon request.
10Note that to create the blue lines in Figure 2, we consider all groups in which the majority messageis either “X” or empty. The yellow line is based on all groups, irrespective of the group’s individualreported majority message and the red line, finally, is based on all groups in which the whites receivedmajority signal Y.
22

Figure 2: Lies and suspected lies in the public chats over rounds
23

of lying to their fellow whites. The regression specifications in Table 12 attempt to shed
light on this question. In the reported logit regressions we regress the individual white
players’ decisions to lie on all chat content categories that were recorded in at least 15%
of the blues’ chat massages in Deliberation11 as well as a dummy that takes the value 1
if all blue players that a white player was matched to in the previous round voted for
C then, a variable capturing the number of convinced blues (that is, the number of blue
players who voted for A following a lie) in the previous round and a variable capturing
the rounds.
Model (1) considers only the Deliberation treatment. As evident, the whites’ propen-
sity to report a wrong majority message (report X instead of Y) increases if they encoun-
tered at least one blue player who recommended voting for C and if all blue players voted
for C in the previous round. If, however, a blue recommended voting for B in the previ-
ous round, the whites’ propensity to lie decreases on average. Also, the more successful
a lie was in the previous round (measured as number of convinced blues), the higher is a
white’s propensity to lie again.
When considering all communication treatments (see Model (2)), we can only condition
on blue players’ voting decisions in previous rounds since they have no opportunity to raise
their voice in TopDown and TopDownClosed. Nevertheless, we observe similar behavioral
patterns: The whites’ propensity to lie increases in the number of blue players who voted
for A following a lie in the previous round and it increases if all blue players voted for C
in the previous round.
4.6 The blues’ trustfulness
Lastly, we set out to test our Hypothesis 3b, stating that the blues condition their votes
less on the majority message sent by the whites in TopDownClosed than in any of the
other communication treatments. For this we consider the regression results presented in
Table 8.
Models (3) and (4) in Table 8 reveal that – when considering those rounds in which the
whites report majority message X – the blues choose policy A (instead of C) significantly
more often in Deliberation than in TopDownClosed. The treatment difference between
TopDown and TopDownClosed goes into the same direction, too. It is, however, not
statistically significant.
We can hence only partly validate Hypothesis 3b: The blue players are more trusting
in Deliberation than in TopDownClosed, but they do not trust more in TopDown than
in TopDownClosed. We call this phenomenon flat (dis-)trust. Considering the regression
outcomes from Model (4), we find that flat (dis-)trust translates into non-significant treat-
11As recorded by Coder #1. Similar results apply if we consider Coder #2’s codings and are availablefrom the authors upon request.
24

Table 12: Communication treatments: Lying decisions of the whites, conditional on re-ceiving signal Y
Only Deliberation treatment All communication treatments
(1) (2)
Suspicious blue in previous period −0.322(0.288)
Blue recommended voting 0.376for A in previous period (0.266)
Blue recommended voting −0.489∗
for B in previous period (0.264)
Blue recommended voting 0.633∗∗
for C in previous period (0.291)
Disrespectful blue in previous period −0.097(0.313)
All blues voted for C in previous period 0.394∗∗∗ 0.275∗
(0.054) (0.166)
# convinced blues in previous lie 0.359∗∗∗ 0.458∗∗∗
(0.115) (0.094)
Period 0.035∗∗ 0.077∗∗∗
(0.016) (0.014)
Constant −2.232∗∗∗ −2.679∗∗∗
(0.438) (0.287)
Pseudo R2 0.052 0.039Number of clusters 5 15Observations 545 1555
Pooled Logit regressions. Dependent variable: Decision to lie. Standard errors are clustered at the sessionlevel and given in parentheses: ∗ p<0.10, ∗∗ p<0.05, ∗∗∗ p<0.01. In Model (1) all chat content categoriesthat were recorded in at least 15% of the blues’ chat messages are included as explanatory variables. Thevariable # convinced blues in previous lie only takes into account falsely stated majority messages (=lies)that happened in the preceding period.
25

ment differences in the blues’ average propensity to vote for C in Deliberation, TopDown
and TopDownClosed and hence the lack of treatment differences in conflict outcome B/C
across the three communication treatments.
4.7 Earnings and efficiency
Table A.1 in Appendix A summarizes the predicted and actual (expected) joint earnings
that are realized by the voting and color groups, respectively. Comparing average joint
earnings – our measure of efficiency – between the communication treatments we find
that they are highest in Deliberation (80.98) and lowest in TopDownClosed (78.28), with
TopDown (79.21) in between. However, the Wald test results from Model (1) presented
in the bottom part of Table A.2 in Appendix A reveal that none of the communication-
treatment comparisons in (individual) earnings is statistically significant.
The earnings of the whites in the different treatments exhibit a similar pattern as the
joint earnings. That is, the whites’ earnings in the communication treatments are ordered
just as the joint earnings. Moreover, all communication treatments yield significantly
higher earnings to the whites than NoChat, a finding that is corroborated by the significant
coefficients of Model (2) from Table A.2, in which NoChat serves as baseline treatment.
By contrast, the pattern of the blues’ earnings is quite different from that of joint
earnings. As indicated by the negative and partly significant coefficients in Model (3)
from Table A.2, the blues do not profit from communication compared to NoChat and
even do worse in TopDown and TopDownClosed. Blues’ earnings in the three communi-
cation treatments are ordered just as the joint earnings. The only significant difference
is, however, only observed between Deliberation and TopDownClosed.
In summary, the efficiency gains from communication go entirely to the whites. Blues’
earnings are unaffected or even decrease. Nevertheless, Deliberation is still the socially
most desirable treatment since in it the whites gain significantly and the blues are not
hurt.
5 Summary and conclusion
We use a lab experiment to shed light on what we consider an important socio-economic
issue: The difficulty of reaching an efficient outcome in a democratic environment in
which two social groups with different material interests have also different information
and different access to communication channels.
We study a setting without communication, NoChat, as well as three ‘deliberative
structures ’: (1) Deliberation, meant to represent an open society where both groups – the
informed whites and the uninformed blues – have equal access to communication channels,
(2) Top Down, a setting in which the whites dominate the communication channels and (3)
26

TopDownClosed, an environment in which the members of the white group can coordinate
on how to communicate.
The modal outcomes we observe largely coincide with those predicted by our theoret-
ical analysis that incorporates ideas from political science on how deliberative structures
affect group identities and hence preferences. First, without any communication pos-
sibilities, the uninformed vote for their preferred policy given their ignorance and the
members of the informed group vote according to their individual information, given that
they have no way of aggregating it. Second, in the three communication treatments,
voting outcomes at the group level are largely as predicted.
There are, however, important deviations. In Deliberation and TopDown, blues’ devi-
ations from their predicted voting patterns are sizeable. The largest discrepancy with our
predictions is that, when in Deliberation the conflict state of the world occurs, the blues
go much more frequently for the conflict than predicted. Also, in TopDownClosed whites
lie considerably less than predicted.
Compared with the setting without any communication between groups, we find that
communication leads to efficiency gains. Deliberation yields most efficient outcomes and
TopDownClosed yields least efficient outcomes, as predicted. However, for all three de-
liberative structures most efficiency gains go to the whites, not only, as predicted, for
Deliberation. Hence, our findings suggest that all types of societal communication ulti-
mately serve the elite, not only those that explicitly give voice to – and hence appease –
the less-well informed.
Studying dynamics to explain these deviations from our predictions, we find that the
interaction between deliberative structures and identity is not the only relevant factor.
Interestingly, potential lies interact with the dynamics of our experimental setting in a
way that affects outcomes. Given the information structure of our environment, it is
both possible that the whites lie to the blues and also that whites seem to lie, although
they do not. Blues detect a potential lie when at the end of a period they find out
that there is a discrepancy between what the whites told them about the state of the
world and the true state of the world. A potential lie naturally increases political conflict
between whites and blues. The dynamics of the chat and voting behavior in Deliberation
reveal the existence of a vicious circle: A blue recommends an egoistic vote to the other
blues. In reaction, more whites tend to lie to the blues in the next round. This tends
to increase the discrepancy between announced and ex-post observed state of the world.
In reaction, more blues recommend the egoistic vote to the other blues. The good news
is that unrestricted communication also allows for a virtuous circle that, although less
prevalent than the vicious circle, also occurred in Deliberation: A blue recommends the
efficient, not the egoistic vote, to the other blues; the whites tend to lie less in the next
round, and the blues are less likely to observe a potential lie. Hence, they tend to be more
27

trustful and recommend the efficient vote again.
However, the emotional connotation of communication content is also relevant. In
particular, whites’ use of disrespectful language increases conflict. Our results here point
to a phenomenon that we may call ‘the curse of unrestricted communication’. In an
adversarial situation, the unrestricted back and forth communication that is possible in
the Deliberation treatment may lead to an escalation in animosity.
We believe that the phenomena we observe are relevant beyond our simple labora-
tory experiment. First, in unequal societies free communication between social groups
increases efficiency but can deteriorate due to the use of adversarial language. If, on top,
the informed group controls the communication process things can be even worse, because
a group with a purely passive role in public communication loses sight of society’s general
interests and becomes particularistic. Second, in modern democracies the advice pertain-
ing to policy options given by experts and the more educated to the society at large is
often ignored by the less informed members of society. This occurs out of a combination
of (flat) distrust vis-a-vis those who are seen as privileged and the experience that expert
knowledge is often less than perfect, so that expert advice that is ex post incorrect is not
infrequent. Third, the fluency of communication that is made possible through digital
media has of course many virtues. However, the immediacy and anonymity of commu-
nication that is now possible often leads to aggressiveness and disrespect between social
groups, which can make it difficult to reach a large societal consensus on important issues.
28

A Appendix
Table A.1: Rankings over predicted and realized earnings
Efficiency White players’ earnings Blue players’ earnings
Predicted meantotal payoffs
Empirical outcomePredicted meanpayoffs
Empirical outcomePredicted meanpayoffs
Empirical outcome
D (85.56) D (80.98, 28.53) D (50.28) D (42.16, 15.65) TD (42.78) NC (39.33, 12.52)
TD (81.30) TD (79.21, 27.06) TD (38.52) TD (41.42, 15.36) TDC (40.14) D (38.83, 12.53)]
TDC (65.28) TDC (78.28, 27.41) TDC (25.14) TDC (41.04, 14.67) NC (37.5) TD (37.79, 11.13)
NC (60) NC (70.77, 33.26) NC (22.5) NC (31.44, 19.11) D (35.28) TDC (37.25, 12.39)
Note that the numbers in columns labeled “empirical outcomes” are average expected round earnings and their respectivestandard deviations. They are calculated based on the players’ types (white or blue), the signals that the computer reportedto the whites, the conditional probabilities of the states of the world (each signal is true with 70% probability) and theactual votes in a given period. In case of a voting tie, the expected earnings are based on the probabilities with which thepolicies are implemented ( 1
3in case there is a tie between three policies, 1
2in case there is a tie between two policies).
29

Table A.2: Expected round earnings – across treatments
(1) (2) (3) (4)All Players Whites Blues All Players
Deliberation 1.702∗∗∗ 3.572∗∗∗ −0.168 −0.168(0.448) (1.024) (0.283) (0.283)
TopDown 1.407∗∗∗ 3.327∗∗∗ −0.512∗∗ −0.512∗∗
(0.408) (0.953) (0.226) (0.226)
TopDownClosed 1.252∗∗ 3.199∗∗∗ −0.694∗∗ −0.694∗∗
(0.442) (0.938) (0.285) (0.285)
White player −2.629∗∗
(1.034)
Deliberation × White player 3.740∗∗∗
(1.207)
TopDown × White player 3.839∗∗∗
(1.118)
TopDownClosed × White player 3.893∗∗∗
(1.068)
Constant 11.795∗∗∗ 10.481∗∗∗ 13.110∗∗∗ 13.110∗∗∗
(0.370) (0.877) (0.197) (0.197)
Wald-test results for comparison of treatment coefficients (p values):
Deliberation vs. TopDown 0.347 0.709 0.154TopDown vs. TopDownClosed 0.607 0.800 0.446Deliberation vs. TopDownClosed 0.213 0.557 0.085
R2 0.018 0.069 0.005 0.047Number of clusters 20 20 20 20Observations 9360 4680 4680 9360
Pooled OLS regressions. Dependent variable: Expected earnings (in points), conditional onreceived signals. Standard errors are clustered at the session level and given in parentheses:∗ p<0.10, ∗∗ p<0.05, ∗∗∗ p<0.01. NoChat serves as baseline treatment in all regressions.
30
B Theoretical appendix
B.1 The game
There are two states of the world, X and Y , and six players that form a group G, with
three yellow and three blue players forming two respective subgroups, Gy and Gb. A
player’s color is publicly observable. The players have to choose a policy P from three
alternative policies , A, B, and C, by a vote. Policies generate state-dependent payoffs
that may differ across colors. These payoffs are depicted in Table 1. Nature draws the
state of the world ω, which is either X or Y with equal probability, at the beginning of
the game. Afterwards, nature randomly draws an informative private signal si ∈ {x, y}on the state of the world for each yellow player i and sends an empty signal si = ∅ to the
blue players. Informative signals are conditionally independent and true with probability
p := {si = x | ω = X} = 0.7. The subsequent collective policy choice has two stages,
the communication stage and the voting stage, in treatments Deliberation, TopDown and
TopDownClosed. Treatment NoChat has no communication stage.
The voting stage is identical across treatments and is structured as follows: All six
players simultaneously and individually place a vote for A, B, or C, or abstain. The
winning alternative is determined by the plurality rule, i.e., the alternative with the most
votes is implemented. If there is a tie, the winning alternative is chosen randomly, with
equal probability of both alternatives. In the end, payoffs from the winning alternative
are realized, given the true state of the word.
In all treatments with communication stage, this stage is structured as follows: There
is a set of senders S ⊇ Gw and a set of receivers R(Gτ ) to which players in the subgroup
Gτ , τ ∈ {w, b}, can send messages. Let M denote the set of all messages that can be
constructed in the common language spoken by the six players, including the empty set.
Then, any player i ∈ Gτ ⊆ S sends a message mi ∈ M to R(Gτ ). In Deliberation,
S = G = R(Gw) = R(Gb), i.e., communication is public and involves everyone as both
sender and receiver. In particular, the whites may reveal their signal to the entire group
of six (or lie or be silent about it), and both the whites and the blues may recommend a
specific voting profile for the group. TopDown differs from Deliberation in that S = Gw,
R(Gw) = G, and R(Gb) = ∅. Thus, blues are no longer senders, but messages are
still received by everyone. In TopDownClosed, by contrast, S = Gw = R on the first
communication stage, i.e., the blues are entirely excluded from the communication on
that stage, and the whites send messages to the subgroup of white players only. On the
second communication stage in TopDownClosed, the whites can talk to the entire group;
hence, R = G.
31

B.2 Preferences
According to our main hypothesis MH, a player’s expected utility is the expected sum
of his own payoff and the payoffs of his receivers on the - first - communication stage.
Hence, players have treatment-dependent preferences that can be described as follows.
Let R1 (Gτ ) denote the set of receivers of individuals in Gτ on the first communication
stage in the game (which is also the final communication stage in all treatments except
TopDownClosed). Let πi (ω, P ) denote the final payoff of player i, given the state of the
world ω and the chosen policy P . Moreover, let qi (ω | m, si) denote player i’s posterior
belief about how likely state of the world ω is, given the sent messages m and his own
signal si; let σP (v) ∈{
0, 12, 1}
denote the probability of P being the winning policy, given
the voting profile v; and let z (P ) ∈ {1, 2, 3} be an index of the policy and z (ω) ∈ {1, 2}an index of the state of the world. Hence, we can define the utility function as follows:
ui (v) =2∑
z(ω)=1
qi (ω | m, si)3∑
z(P )=1
σPz(P )(v | ω)
πi (ω, Pz(P )
)+
∑j∈R1(Gτ )i∈Gτ
πj(ω, Pz(P )
) .
B.3 Equilibrium concept
We are solving the game for all Perfect Bayesian Nash equilibria in pure strategies that
fulfill the following selection criteria.
Definition 1 (WU) Any equilibrium is in weakly undominated strategies.
Definition 2 (DT) Players exhibit dominant truthtelling: If there exists a truthtelling
equilibrium, no babbling equilibrium is played; i.e., if there exists an equilibrium in which
all whites reveal their signal on the / a communication stage, no equilibrium is played in
which not all whites reveal their signal on that stage.
Definition 3 (SCT) Players exhibit same-color trust: If the message of a player i
to the entire group contradicts a message he has sent to players of his own color only,
players of the same color as i believe the message that i has sent to them and disbelieve
the message he has sent to the entire group.
Definition 4 (MC) Players exhibit minimal coordination in the following sense: For
any τ ∈ {w, b}, players i ∈ Gτ who move at the same information set I and hence know
that they have identical beliefs qi (ω | I) = q coordinate on sending the same message and /
or voting for the same policy such that they maximize their (joint and individual) expected
utility, given the strategies of the other voters.
32

Definition 5 (LS) Whites exhibit literal speaking: They send the message ”x” if they
want to indicate that their signal was ”x”, and they send the message ”x” if they want to
indicate that their signal was ”y”.
Definition 6 (CORS) All players exhibit conditioning on revealed signals: They
may condition their strategies on the signals that are revealed by the messages but do not
use messages as coordination devices otherwise.
Criterion WU excludes equilibria in which selfish whites vote for policy C. Criterion
DT is typical for the cheap-talk literature and selects the equilibrium with the highest
degree of information transmission. Criterion SCT exludes equilibria in TopDownClosed
in which the whites cannot lie to the blues without changing the beliefs of the other whites,
too. (Note that such equilibria would be extremely implausible since in TopDownClosed,
the whites can even tell each other that they intend to lie to the blues.) Criterion MC
restricts attention to equilibria in which the blues coordinate on the same voting strategy
(since the blues always have the same information). Moreover, MC guarantees that in
any truthtelling equilibrium (in which the whites, too, have the same information) the
whites also coordinate on the same voting strategy. Criterion LS reduces the syntax of
the language in which signals are communicated to a binary set and hence simplifies (the
proofs in) equilibrium description. CORS restricts the function of communication as a
coordination device to what is implied by MC and allows us to focus on information
aggregation rather than pure (uninformed) coordination. The resulting effect of CORS
is to restrict the number of outcome equivalent equilibria that differ in stragey profiles.
B.4 Equilibria in Deliberation
Since in Deliberation both the whites and the blues send messages to the entire group,
they fully internalize group utility, i.e., they have efficiency preferences. Hence, their
(joint) utility is
uDi (v) =2∑
z(ω)=1
qi (ω | m, si)3∑
z(P )=1
σPz(P )(v | ω)
(πi(ω, Pz(P )
)+∑j∈G
πj(ω, Pz(P )
))= qi (X | m, si) (σA (v | X) 120 + σC (v | X) 30) +
+ qi (Y | m, si) (σA (v | Y ) 30 + σB (v | Y ) 90 + σC (v | Y ) 60) .
Consider a candidate equilibrium in which the whites truthfully reveal their signals to
the public. In such an equilibrium, all players have the same information and hence then
same belief about ω: qi (ω | m, si) = q (ω | m)∀i, ω. Hence, MC applies to both whites
33

and blues: Whites coordinate on the same vote and blues coordinate on the same vote,
maximizing the expected group payoff, given the strategy of the other color. Strategies
of the whites may condition on the private signal or on the messages. Note that under
truthtelling, the state of the world that is more likely than the other is indicated both by
the signal that is received most often (i.e., twice or even three times) and by the message
that is sent most often. Hereafter, we will call this signal and message the majority signal
and the majority message.
Definition 7 An equilibrium is efficient if and only if A is the winning policy whenever
the majority signal is X and B is the winning policy otherwise.
Proposition 1 (i) There is a set of truthtelling equilibria in Deliberation that fulfill
the selection criteria. They have the following properties: (a) The whites reveal their
signals. The whites vote for A if the majority message indicates X and for B other-
wise, and the blues abstain (LTED: ”let the experts decide”). If (off equilibrium) there
is no majority message, then arbitrary off-equilibrium beliefs about the unrevealed signal
and voting profiles consistent with these beliefs can be assumed. (b) The whites reveal
their signals. Everyone votes for A if the majority message indicates X and votes for
B otherwise (A/B). If (off equilibrium) there is no majority message, then arbitrary off-
equilibrium beliefs about the unrevealed signal and voting profiles consistent with these
beliefs can be assumed. (ii) These equilibria are outcome equivalent in the sense that A
is the winning policy if the majority signal indicates X, and B is the winning policy oth-
erwise. (iii) Hence, both types of truthtelling equilibria are efficient. (iv) These equilibria
are the unique pure-strategy equilibria in Deliberation that fulfill all selection criteria.
Proof. We first show that the voting profiles described in (a) and (b) are efficient equi-
libria of the continuation game on the voting stage, given truthtelling. We then show
that truthtelling is an equilibrium strategy of the whites, given the voting profiles in (a)
and (b). Finally, we prove (i), i.e., that the two equilibria are the only truthtelling equi-
libria that fulfill our selection criteria. Consider (a) and (b). Due to truthtelling, the
majority message always equals the majority signal. Hence, LTED and AB are efficient.
Efficiency preferences imply that no-one has a deviation incentive. Thus, the voting pro-
files in (a) and (b) are equilibria of the continuation game on the voting stage. Consider
now the communication stage preceding the voting stage with LTED. If a white deviates
from telling the truth in that he lies about his signal, then he either does not change
the majority message, hence leaving the voting outcome unchanged, too, or he changes
the majority message and hence moves the voting outcome away from efficiency. Thus,
no white wants to deviate to lying. Now consider a deviation to silence. Again, this
34

either changes nothing or moves the voting outcome away from efficiency, depending on
the off-equilibrium voting strategies. Hence, again, the whites do not want to deviate.
The same kind of argument holds true for the communication stage that precedes a vot-
ing profile described in (b). Thus, in Deliberation there exist truthtelling equilibria with
voting profiles as described in (a) and (b). Parts (ii) and (iii) follow directly.
It now remains to show that these two sets of equilibria defined above contain the
only truthtelling equilibria in Deliberation that fulfill our selection criteria. Note first that
CORS excludes equilibria in which strategies condition on messages without conditioning
on beliefs. Furthermore, note that under truthtelling, MC applies both to the whites and
the blues. If the whites have revealed their signals and the blues abstain, then MC and
efficiency preferences imply that the whites coordinate on voting for A or B, depending
on the majority message. If the whites do this, and if they have revealed their signals,
then MC and efficiency preferences imply that the blues coordinate on a strategy that
never distorts the voting outcome away from efficiency. Hence, in this case the only two
voting profiles of the blues that fulfill MC are abstention and voting along with the whites.
Finally, note that DT excludes equilibria with partial truthtelling. Hence, CORS, MC,
DT, and efficiency preferences pin down all truthtelling equilibria in Deliberation to the
ones that are characterized in (a) and (b). Part (iv) follows directly from this and DT.
From Proposition 1, the following outcome-related result can be derived:
Result 1: In Deliberation, (a) the whites truthfully reveal their signal; and (b) if the
majority signal indicates X, all votes that are placed are for A (A/A); whereas (c) if the
majority signal indicates Y, all votes that are placed are for B (B/B).
B.5 Equilibria in TopDown
In TopDown, the whites can still address the entire group on the communication stage,
but the blues are no longer senders. Hence, the whites still have efficiency preferences, but
the blues become self-interested. Still, the blues have the same information, so MC still
applies to them: qi (ω | m) = q (ω | m) ∀i ∈ Gb. Moreover, note that payoffs are perfectly
aligned across players of the same color; thus we can define πi(ω, Pz(P )
):= πb
(ω, Pz(P )
)∀ i ∈ Gb. Hence, in TopDown a player i has utility uTDi as follows:
uTDi = uDi (v) if i ∈ Gw,
uTDi =2∑
z(ω)=1
q (ω | m)3∑
z(P )=1
σPz(P )(v | ω) πb
(ω, Pz(P )
)if i ∈ Gb.
35

Consider truthtelling equilibria.
Proposition 2 (i) There is a set of truthtelling equilibria in TopDown that fulfill the
selection criteria. They have the following properties: The whites reveal their signals. If
the majority message indicates X, then (a) all vote for A, (b) all whites vote for A and all
blues abstain, or (c) all whites abstain and all blues vote for A. If the majority message
indicates Y, then the whites vote for A and the blues for C (A/BC). If (off equilibrium)
there is no majority message, we restrict off-equilibrium beliefs as follows: If there is a
one-shot deviation of one white player to being silent and the remaining revealed signals
contradict each other(i.e., there is no majority message), then the blues have a belief
q (X | m) < 23. Then in all voting profiles consistent with off-equilibrium beliefs after
such a deviation, the blues vote for C. (ii) These equilibria are outcome equivalent: They
generate winning policy A if the majority signal is X and a tie between B and C if the
majority signal is Y. (iii) These equilibria are inefficient. (iv) These equilibria are the
unique pure-strategy equilibria that fulfill all selection criteria.
Proof. We first show that with truthtelling of the whites on the communication stage,
voting profiles with the properties described in (i) are equilibria of the continuation game.
Second, we show that then, truthtelling must be part of the equilibrium. Part (ii) directly
follows from part (i); and (iii) directly follows from (ii) and the definition of efficient
equilibrium.
Assume now truthtelling of the whites, and consider the blues first. For q (ω | m) < 23,
policy C is strictly better for a blue player than the other policies, otherwise, policy A is
better than the other policies. If x is the majority message, we have q (ω | m) ≥ 0.7 > 23,
and if y is the majority message, we have q (ω | m) ≤ 0.3 < 13. Thus, if x is the majority
message, then A is better for any blue player than (a tie with) any other policy; and if
y is the majority message, then (a tie with) C is better for any blue player than (a tie
with) any other policy. Then, MC implies that all blues vote for A or abstain if x is the
majority message and vote for C otherwise. If there is no majority message (i.e., there
are only two messages that contradict each other), then the off-equilibrium belief of the
blues, q (ω | m) < 23, and MC imply that all blues vote for C.
Consider now the whites on the voting stage. Remember that they have efficiency
preferences. If the majority message is x, then any white prefers A over all other policies.
MC then implies that all whites coordinate on an action that makes A the winning
policy; i.e., voting for A, or, (only) if the blues vote for A, abstention. If the majority
message is y, then any white anticipates the three blue votes for C but prefers B over
all other policies himself. Hence, he also prefers a tie between B and C over C or any
other tie with C. Thus, MC implies that all whites vote for B. If there is no majority
message, i.e., if there are only two messages that contradict each other, then any off-
36

equilibrium belief about the unrevealed signal and any consistent voting strategy of the
whites can be assumed. Note that regardless of the voting strategy of the whites after such
a deviation, the resulting efficiency level (group payoff) cannot exceed the level implied
by the equilibrium strategies (because strategies cannot improve upon conditioning on
the full information about all signals). Thus far, we have shown that under truthtelling,
voting profiles with the properties described in (a), (b), and (c) are equilibria of the
continuation game on the voting stage.
Consider now the communication stage. We check the incentive of an arbitrary white
player i to deviate to a lie or to being silent about his signal. Consider now a white
who has received a signal si. If he lies or is silent about si, then he is either not pivotal,
the other two messages being m−i = (y, y) or m−i = (x, x), in which case the deviation
does not change anything. Or i is pivotal, in which case the other two whites have
contradicting signals and si is the majority signal. Then, i’s efficiency preferences imply
that he cannot do better than revealing his signal. Thus, there is no deviation incentive
on the communication stage.
We now proceed to proving (i) by showing that all truthtelling equilibria in TopDown
have the properties that are described in (a), (b), and (c). Note first that CORS excludes
equilibria in which strategies condition on messages without conditioning on beliefs. Sec-
ond, under truthtelling, MC applies to both colors. Hence, under truthtelling each color
will coordinate on an action that maximizes the probability of the policy preferred by this
color, given the strategy of the other color and the common beliefs about the state of the
world. But then, (a), (b), and (c) describe all voting profiles under truthtelling. More-
over, DT excludes partial truthtelling and babbling equilibria. Thus, MC, CORS, and
DT restrict all pure-strategy equilibria in TopDown to the set described in Proposition
2, which proves part (iv).
From Proposition 2, the following outcome-related result can be derived:
Result 2: In TopDown, (a) the whites truthfully reveal their signal; and (b) if the
majority signal indicates X, all votes that are placed are for A (A/A); whereas (c) if the
majority signal indicates Y, the whites vote for B and the blues for C (B/C).
B.6 Equilibria in TopDownClosed
In TopDownClosed, our main hypothesis MH implies that the whites do not have efficiency
preferences any longer but maximize the joint payoffs of their own color group instead
(color-group identity). Note that this is equivalent to being selfish since payoffs are
perfectly aligned between individuals of the same color. Importantly, WU implies that
selfish whites never vote for C, since they prefer any possible outcome of the vote over C,
37

regardless of their beliefs about the state of the world, so that voting for C is a weakly
dominated strategy for selfish whites. The blues, too, are selfish, as in TopDown.
Consider now potential equilibria in which the whites truthfully reveal their signals
to each other on the first communication stage. Note that in such equilibria, the whites
have identical beliefs on the voting stage, so that MC applies to them. Note that MC
always applies to the blues, regardless of whether they are told the true signals or not.
Proposition 3 (i) There is a set of equilibria in TopDownClosed that fulfill the selec-
tion criteria. They have the following properties: The whites reveal their signals to each
other, but babble to the blues. The whites vote for A if the majority message indicates
X and for B otherwise, and the blues vote for C (AC/BC). If (off equilibrium) there is
no majority message on the first communication stage, arbitrary off-equilibrium beliefs of
the whites and white votes consistent with these beliefs can be assumed; but the blues (un-
observant of the deviation) are restricted to keep their prior beliefs and hence to vote for
C. (ii) These equilibria are inefficient. (iii) These equilibria are the unique pure-strategy
equilibria that fulfill all selection criteria.
Proof. We first show that given truthtelling on the first communication stage, there can
be no truthtelling on the second communication stage. We then show existence of the
AC-BC equilibria as characterized in (i). Part (ii) - inefficiency - directly follows from (i)
and the definition of efficiency. Finally, we will prove (iii).
Assume now that the whites truthfully reveal their signals to each other on the com-
munication stage. Assume for the sake of argument that there is also truthtelling on
the second communication stage. Consider now a situation in which the majority signal
indicates Y , but there has been one signal indicating X. On the voting stage, both the
whites and the blues hence believe that the state of the world is Y with probability 0.7.
But then, their preferences and MC imply that the whites vote for B and the blues for
C. Under truthtelling, the whites’ expected utility is 0.3× 0 + 0.7(
12× 20 + 1
2× 0)
= 7.
If, by contrast, one of the whites who have received the signal indicating Y deviates to
a lie, saying that his signal indicates X, the beliefs of the whites will not change since
this is precluded by SCT, but the blues will believe that the state of the world is X with
probability 0.7. Then, MC and the players’ preferences imply that the whites will still
vote for B and the blues will vote for A. For the whites, this yields an expected utility of
0.3
(1
2× 20 +
1
2× 0
)+ 0.7
(1
2× 10 +
1
2× 20
)= 13. 5.
Thus, the lie strictly increases the expected utility of the whites. Consider now a white
i whose signal was si = Y . This white is pivotal on the second communication stage in
the sense that his message determines the majority message sent to the blues (since the
38
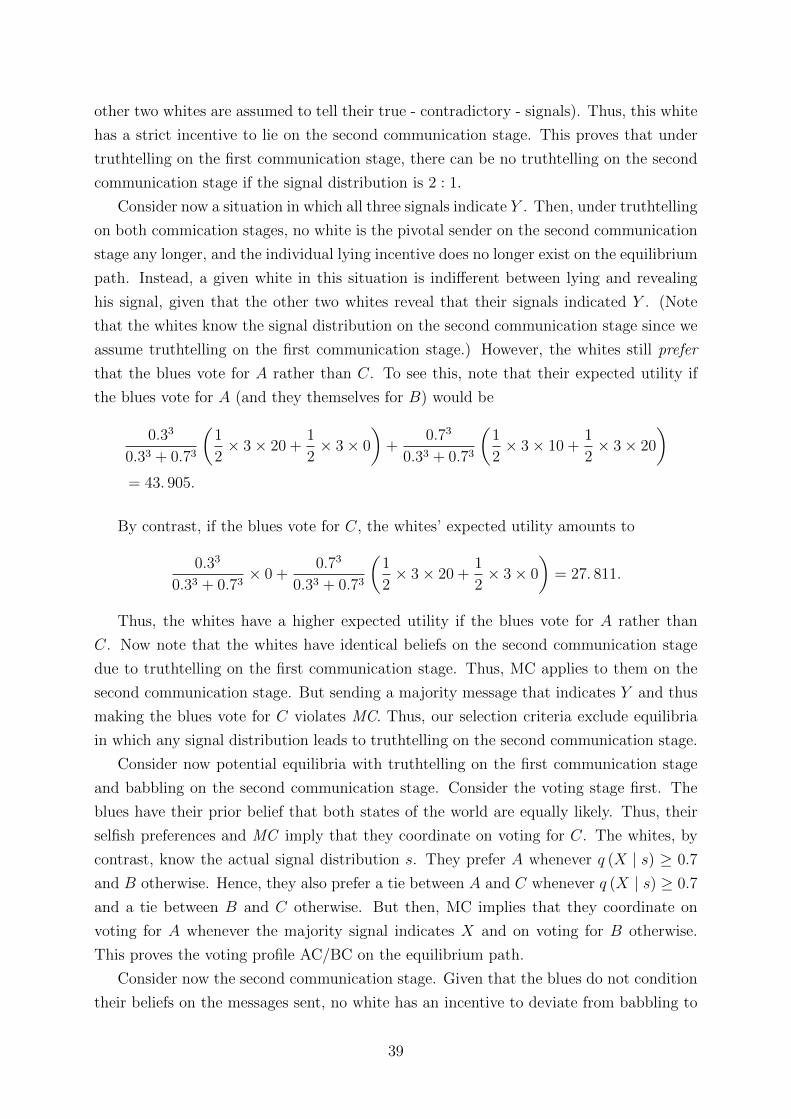
other two whites are assumed to tell their true - contradictory - signals). Thus, this white
has a strict incentive to lie on the second communication stage. This proves that under
truthtelling on the first communication stage, there can be no truthtelling on the second
communication stage if the signal distribution is 2 : 1.
Consider now a situation in which all three signals indicate Y . Then, under truthtelling
on both commication stages, no white is the pivotal sender on the second communication
stage any longer, and the individual lying incentive does no longer exist on the equilibrium
path. Instead, a given white in this situation is indifferent between lying and revealing
his signal, given that the other two whites reveal that their signals indicated Y . (Note
that the whites know the signal distribution on the second communication stage since we
assume truthtelling on the first communication stage.) However, the whites still prefer
that the blues vote for A rather than C. To see this, note that their expected utility if
the blues vote for A (and they themselves for B) would be
0.33
0.33 + 0.73
(1
2× 3× 20 +
1
2× 3× 0
)+
0.73
0.33 + 0.73
(1
2× 3× 10 +
1
2× 3× 20
)= 43. 905.
By contrast, if the blues vote for C, the whites’ expected utility amounts to
0.33
0.33 + 0.73× 0 +
0.73
0.33 + 0.73
(1
2× 3× 20 +
1
2× 3× 0
)= 27. 811.
Thus, the whites have a higher expected utility if the blues vote for A rather than
C. Now note that the whites have identical beliefs on the second communication stage
due to truthtelling on the first communication stage. Thus, MC applies to them on the
second communication stage. But sending a majority message that indicates Y and thus
making the blues vote for C violates MC. Thus, our selection criteria exclude equilibria
in which any signal distribution leads to truthtelling on the second communication stage.
Consider now potential equilibria with truthtelling on the first communication stage
and babbling on the second communication stage. Consider the voting stage first. The
blues have their prior belief that both states of the world are equally likely. Thus, their
selfish preferences and MC imply that they coordinate on voting for C. The whites, by
contrast, know the actual signal distribution s. They prefer A whenever q (X | s) ≥ 0.7
and B otherwise. Hence, they also prefer a tie between A and C whenever q (X | s) ≥ 0.7
and a tie between B and C otherwise. But then, MC implies that they coordinate on
voting for A whenever the majority signal indicates X and on voting for B otherwise.
This proves the voting profile AC/BC on the equilibrium path.
Consider now the second communication stage. Given that the blues do not condition
their beliefs on the messages sent, no white has an incentive to deviate from babbling to
39

conditioning his message on his signal. Note that this also holds true off equilibrium, i.e.,
after a deviation of a white / some whites on the first communication stage.
Now consider the first communication stage. Given that the whites believe each other,
no white has an incentive to deviate to being silent or to lying. To see this, note that
such a deviation would either change nothing or would distort the beliefs of the other two
whites away from the true signal distribution. This distortion, in its turn, would either
change nothing or distort the votes of the other two whites away from the voting profile
that maximizes the whites’ expected utility, given that the blues vote for C. Note that
the blues cannot observe any deviation on the first communication stage. Hence, they
cannot respond to such a deviation and will vote for C after it, too.
This proves parts (i) and (iii) of Proposition 3. Part (ii) is trivial.
From Proposition 3, the following outcome-related result can be derived:
Result 3: In TopDownClosed, (a) the whites truthfully reveal their signals to each
other but babble to the blues, and (b) if the majority signal indicates X, the whites vote for
A but the blues for C (A/C), whereas (c) if the majority signal indicates Y, the whites
vote for B and the blues still for C (B/C).
B.7 Equilibria in NoChat
In the NoChat treatment, there is no possibility to communicate. Therefore, both colors
become self-interested and maximize the utility of their own color. Moreover, only the
blues (know that they) have the same information set, namely their prior belief that the
two states of the world are equally likely. The whites, however, have private independent
information on the true state. Hence, MC applies to the blues but not to the whites.
Proposition 4 (i) There is a set of equilibria in NoChat that fulfill the selection
criteria. They have the following properties: The blues vote for C, and (a) the whites vote
for A (A/C), or (b) the whites vote for B (B/C), or the whites vote for A if their signal
indicates X and for B otherwise (split-whites). (ii) These equilibria are inefficient.
Proof. Since MC applies to the blues, we only have equilibria in which the blues coor-
dinate on the same vote. Since the blues are self-interested in NoChat, votes other than
C are weakly dominated for them. Hence, MC and WU restrict the analysis to equilibria
in which the blues vote for C. The whites are self-interested, too. Given that the blues
vote for C, each white will minimize the probability of the implementation of C (since C
provides strictly lower expected payoffs than any other policy for a self-interested white,
regardless of his signal). Voting for C is hence weakly dominated for the whites. Thus,
WU exludes equilibria in which some whites, too, vote for C. Consider now an arbitrary
40

white i. If the two other whites vote for the same policy (that is not C), then i′s best
response is to vote for this policy, too, in order to decrease the probability of C from 1 to
0.5. Hence, AC and BC are equilibria. If, now, the two other whites vote for the policy
indicated by their signal (A if the signal indicates X and B otherwise), the best response
of i is to vote in line with his signal, too. To see this, note that this strategy maximizes
the probability of hitting the vote of the other two whites if they voted for the same
policy, and hence minimizes the probability of C. Thus, split-whites is an equilibrium,
too. Note that self-interest, MC (for the blues) and WU (for both colors) exlude other
possible equilibria. This proves (i). Part (ii) follows from the definition of efficiency.
Proposition 4 implies the following outcome-related result:
Result 4: In NoChat, the blues vote for C, regardless of the majority signal; and the
whites vote for A or B or according to their signal (resulting in outcome A/C or B/C).
Excluding all equilibrium outcomes with abstention, results 1-4 imply our testable
hypotheses 1-4 in Section 3 of the paper. In these hypotheses, we focus on the treatment
comparisons, i.e., on the comparative statics, rather than on point predictions.
B.8 Predictions with standard preferences
Standard preferences would imply that all players are selfish maximizers of their own
expected payoff. Due to our design, this is equivalent to assuming a color-group identity
for both colors in all treatments. Hence, the predictions for treatments NoChat and
TopDownClosed would not change if we assumed standard preferences.
By contrast, our predictions for Deliberation and TopDown would change: As is easy to
show, there would not be any truthtelling equilibria but only babbling equilibria in these
two treatments since each white would have an incentive to lie to the blues and report
”x” even if her signal indicated ”y”. We omit the proof, but a crucial point in the proof
is that selfish whites prefer A/A over B/C even under majority signal Y. Accordingly, if
players were selfish, the predictions for Deliberation and TopDown would coincide with
those for NoChat.
41

C Supplementary online material
Additional tables
Table C.1: Voting outcomes at the group level over time – Conditional on the receivedmajority signal – First 10 rounds
Majority signal: X Majority signal: Y
NC D TD TDC NC D TD TDC
A/C outcome 0.303 0.058 0.047 0.076 0.128 0.052 0.106 0.020
of this: split-whites 0.197 0.019 0.012 0.022 - - - -
Almost A/C outcome 0.516 0.087 0.233 0.228 0.513 0.042 0.058 0.122
(Almost) A/C outcome 0.820 0.144 0.279 0.304 0.641 0.094 0.163 0.143
B/C outcome 0 0 0 0 0.026 0.240 0.279 0.194
of this: split-whites - - - - 0.013 0.115 0.154 0.082
(Almost) B/C outcome 0.016 0 0 0 0.179 0.479 0.654 0.469
Split-whites 0.279 0.019 0.012 0.022 0.051 0.135 0.173 0.092
LTED 0 0 0 0 0 0 0 0
Almost LTED 0.025 0 0 0 0.013 0 0 0.010
(Almost) LTED 0.025 0 0 0 0.013 0 0 0.010
A/A 0 0.548 0.337 0.228 0 0.063 0 0.020
Almost all A 0.041 0.250 0.349 0.424 0.038 0.042 0.038 0.133
(Almost) all A 0.041 0.798 0.686 0.652 0.038 0.104 0.038 0.153
B/B 0 0 0 0 0 0.167 0.010 0.010
Almost all B 0 0.010 0 0.011 0 0.125 0.115 0.102
(Almost) all B 0 0.010 0 0.011 0 0.292 0.125 0.112
Other 0.098 0.048 0.035 0.033 0.128 0.031 0.019 0.112
Treatment names are abbreviated with NC (NoChat), D (Deliberation), TD (TopDown) and TDC(TopDownClosed). In “Almost” outcomes at most one player per color group deviates from therespective outcome. LTED refers to the “Let the experts decide equilibrium”. Figures printed in boldhighlight the observed modal voting outcomes for the respective treatment and signal combination.
42

Table C.2: Voting outcomes at the group level over time – Conditional on the receivedmajority signal – Last 10 rounds
Majority signal: X Majority signal: Y
NC D TD TDC NC D TD TDC
A/C outcome 0.375 0.180 0.161 0.237 0.443 0.157 0.124 0.086
of this: split-whites 0.170 0.027 0.011 0.052 - - - -
Almost A/C outcome 0.509 0.270 0.376 0.443 0.443 0.135 0.134 0.129
(Almost) A/C outcome 0.884 0.450 0.538 0.680 0.886 0.292 0.258 0.215
B/C outcome 0 0 0 0 0 0.191 0.351 0.376
of this: split-whites - - - - 0 0.067 0.175 0.226
Almost B/C outcome 0.009 0 0.011 0 0.034 0.236 0.278 0.237
(Almost) B/C outcome 0.009 0 0.011 0 0.034 0.427 0.629 0.613
Split-whites 0.259 0.027 0.022 0.052 0.011 0.079 0.175 0.247
LTED 0 0 0 0 0 0 0 0
Almost LTED 0.018 0 0 0 0.023 0 0 0
(Almost) LTED 0.018 0 0 0 0.023 0 0 0
A/A 0 0.234 0.075 0.062 0 0.056 0 0.022
Almost all A 0.036 0.315 0.366 0.237 0 0.079 0.072 0.075
(Almost) all A 0.036 0.550 0.441 0.299 0 0.135 0.072 0.097
B/B 0 0 0 0 0 0 0 0
Almost all B 0 0 0 0 0 0.124 0.010 0.011
(Almost) all B 0 0 0 0 0 0.124 0.010 0.011
Other 0.054 0 0.011 0.021 0.057 0.022 0.031 0.065
Treatment names are abbreviated with NC (NoChat), D (Deliberation), TD (TopDown) and TDC(TopDownClosed). In “Almost” outcomes at most one player per color group deviates from therespective outcome. LTED refers to the “Let the experts decide equilibrium”. Figures printed in boldhighlight the observed modal voting outcomes for the respective treatment and signal combination.
43

Chat dimensions
Dimension 1 – General classification of chats
Table C.3: Rater 1: Fraction of groups in which the whites...
Deliberation TopDown TopDownClosed
... stress the public spirit 0.22 0.22 0.23
... stress the interests of the own color group 0.11 0.12 0.01
... suspect lying 0.03 0.01 0.01
... stress trust 0.01 0.01 0.02
... mention circumstances as justification for behavior 0.22 0.14 0.10
... mention circumstances as information 0.27 0.28 0.21
... stress hope or optimism 0.07 0.13 0.10
Table C.4: Rater 1: Fraction of groups in which the blues...
Deliberation
... stress the public spirit 0.09
... stress the interests of the own color group 0.13
... suspect lying 0.16
... stress trust 0.03
... mention circumstances as justification for behavior 0.13
... mention circumstances as information 0.23
... stress hope or optimism 0.04
44

Table C.5: Rater 2: Fraction of groups in which the whites...
Deliberation TopDown TopDownClosed
... stress the public spirit 0.25 0.24 0.27
... stress the interests of the own color group 0.08 0.03 0.00
... suspect lying 0.02 0.00 0.00
... stress trust 0.02 0.00 0.02
... mention circumstances as justification for behavior 0.13 0.16 0.03
... mention circumstances as information 0.16 0.18 0.07
... stress hope or optimism 0.07 0.16 0.03
Table C.6: Rater 2: Fraction of groups in which the blues...
Deliberation
... stress the public spirit 0.16
... stress the interests of the own color group 0.11
... suspect lying 0.18
... stress trust 0.05
... mention circumstances as justification for behavior 0.12
... mention circumstances as information 0.13
... stress hope or optimism 0.07
45
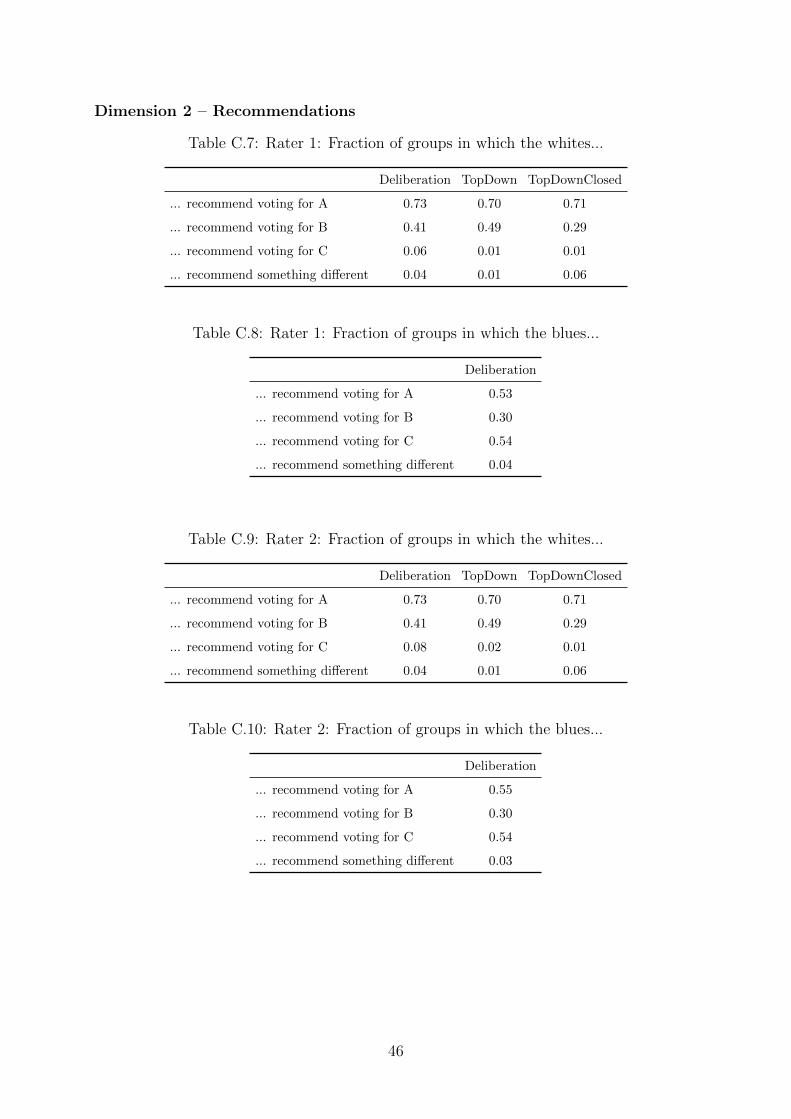
Dimension 2 – Recommendations
Table C.7: Rater 1: Fraction of groups in which the whites...
Deliberation TopDown TopDownClosed
... recommend voting for A 0.73 0.70 0.71
... recommend voting for B 0.41 0.49 0.29
... recommend voting for C 0.06 0.01 0.01
... recommend something different 0.04 0.01 0.06
Table C.8: Rater 1: Fraction of groups in which the blues...
Deliberation
... recommend voting for A 0.53
... recommend voting for B 0.30
... recommend voting for C 0.54
... recommend something different 0.04
Table C.9: Rater 2: Fraction of groups in which the whites...
Deliberation TopDown TopDownClosed
... recommend voting for A 0.73 0.70 0.71
... recommend voting for B 0.41 0.49 0.29
... recommend voting for C 0.08 0.02 0.01
... recommend something different 0.04 0.01 0.06
Table C.10: Rater 2: Fraction of groups in which the blues...
Deliberation
... recommend voting for A 0.55
... recommend voting for B 0.30
... recommend voting for C 0.54
... recommend something different 0.03
46

Dimension 3 – Addressees
Table C.11: Rater 1: Fraction of groups in which the whites...
Deliberation TopDown TopDownClosed
... address the speech to all 1.00 1.00 1.00
... address their speech to their own color group only 0.28 0.22 0.01
... address their speech to the other color group only 0.34 0.19 0.14
... directly address a speech to s.o. from own color group 0.13 0.14 0.06
... directly address a speech to s.o. from other color group 0.18 0.00 0.00
Table C.12: Rater 1: Fraction of groups in which the blues...
Deliberation
... address the speech to all 0.99
... address their speech to their own color group only 0.37
... address their speech to the other color group only 0.38
... directly address a speech to s.o. from own color group 0.15
... directly address a speech to s.o. from other color group 0.21
Table C.13: Rater 2: Fraction of groups in which the whites...
Deliberation TopDown TopDownClosed
... address the speech to all 1.00 1.00 1.00
... address their speech to their own color group only 0.20 0.01 0.00
... address their speech to the other color group only 0.22 0.06 0.03
... directly address a speech to s.o. from own color group 0.09 0.04 0.02
... directly address a speech to s.o. from other color group 0.11 0.01 0.00
Table C.14: Rater 2: Fraction of groups in which the blues...
Deliberation
... address the speech to all 0.99
... address the speech to their own color group only 0.29
... address the speech to the other color group only 0.18
... directly address a speech to s.o. from own color group 0.09
... directly address a speech to s.o. from other color group 0.11
47

Dimension 4 – Showing respect
Table C.15: Rater 1: Fraction of groups in which the whites...
Deliberation TopDown TopDownClosed
... show respect 0.17 0.17 0.15
... behave disrespectfully 0.31 0.14 0.04
... behave neutrally 1.00 1.00 1.00
Table C.16: Rater 1: Fraction of groups in which the blues...
Deliberation
... show respect 0.13
... behave disrespectfully 0.28
... behave neutrally 1.00
Table C.17: Rater 2: Fraction of groups in which the whites...
Deliberation TopDown TopDownClosed
... show respect 0.06 0.01 0.03
... behave disrespectfully 0.31 0.02 0.01
... behave neutrally 1.00 1.00 1.00
Table C.18: Rater 2: Fraction of groups in which the blues...
Deliberation
... show respect 0.06
... behave disrespectfully 0.27
... behave neutrally 1.00
48

Dimension 5 – Specific recommendations I
Table C.19: Rater 1: Fraction of groups in which the whites...
Deliberation TopDown TopDownClosed
... recommend LTED 0.00 0.00 0.00
... recommend A/C 0.02 0.00 0.00
... recommend All A 0.72 0.69 0.54
... recommend All B 0.40 0.46 0.26
... recommend All C 0.05 0.01 0.01
... recommend voting acc. to majority signal 0.14 0.14 0.43
... do not give any such recommendation 0.04 0.01 0.06
Table C.20: Rater 1: Fraction of groups in which the blues...
Deliberation
... recommend LTED 0.00
... recommend A/C 0.07
... recommend All A 0.52
... recommend All B 0.27
... recommend All C 0.53
... recommend voting acc. to maj. signal 0.06
... do not give any such recommendation 0.03
49

Table C.21: Rater 2: Fraction of groups in which the whites...
Deliberation TopDown TopDownClosed
... recommend LTED 0.00 0.00 0.00
... recommend A/C 0.02 0.00 0.00
... recommend All A 0.70 0.70 0.71
... recommend All B 0.40 0.49 0.29
... recommend All C 0.06 0.02 0.01
... recommend voting acc. to majority signal 0.03 0.00 0.00
... do not give any such recommendation 0.05 0.01 0.06
Table C.22: Rater 2: Fraction of groups in which the blues...
Deliberation
... recommend LTED 0.00
... recommend A/C 0.06
... recommend All A 0.52
... recommend All B 0.29
... recommend All C 0.47
... recommend voting acc. to majority signal 0.01
... do not give any such recommendation 0.05
50

Dimension 6 – Specific recommendations II
Table C.23: Rater 1: Fraction of groups in which the whites give recommendations toboth color groups...
Deliberation TopDown TopDownClosed
..., not mentioning signals or abstentions 0.95 0.98 0.75
..., mentioning signals, but not abstentions 0.08 0.14 0.43
..., not mentioning signals, but abstentions 0.01 0.00 0.01
... do not give any such recommendation 0.04 0.01 0.06
Table C.24: Rater 1: Fraction of groups in which the blues give recommendations to bothcolor groups...
Deliberation
..., not mentioning signals or abstentions 0.93
..., mentioning signals, but not abstentions 0.03
..., not mentioning signals, but abstentions 0.01
... do not give any such recommendation 0.06
Table C.25: Rater 2: Fraction of groups in which the whites give recommendations toboth color groups...
Deliberation TopDown TopDownClosed
..., not mentioning signals or abstentions 0.94 0.86 0.85
..., mentioning signals, but not abstentions 0.16 0.42 0.17
..., not mentioning signals, but abstentions 0.00 0.00 0.00
... do not give any such recommendation 0.05 0.01 0.06
Table C.26: Rater 2: Fraction of groups in which the blues give recommendations to bothcolor groups...
Deliberation
..., not mentioning signals or abstentions 0.94
..., mentioning signals, but not abstentions 0.08
..., not mentioning signals, but abstentions 0.00
... do not give any such recommendation 0.05
51

Dimension 7 – Inter-group fairness and efficiency
Table C.27: Rater 1: Fraction of groups in which the whites...
Deliberation TopDown TopDownClosed
... mention relative payoffs (W vs. B) 0.10 0.09 0.09
... mention joint payoffs (W + B) 0.19 0.20 0.13
Table C.28: Rater 1: Fraction of groups in which the blues...
Deliberation
... mention relative payoffs (W vs. B) 0.11
... mention joint payoffs (W + B) 0.04
Table C.29: Rater 2: Fraction of groups in which the whites...
Deliberation TopDown TopDownClosed
... mention relative payoffs (W vs. B) 0.08 0.10 0.03
... mention joint payoffs (W + B) 0.13 0.23 0.26
Table C.30: Rater 2: Fraction of groups in which the blues...
Deliberation
... mention relative payoffs (W vs. B) 0.09
... mention joint payoffs (W + B) 0.04
52

1
Welcome to today’s experiment!
You are taking part in a decision situation and it is possible for you to earn some money. The
amount of money that you are able to win depends on your decisions and on the decisions of the
other participants that are assigned to you. Moreover, it is influenced by the role that is randomly
allocated to you. After having finished the experiment, we would like to ask you to fill in a short
questionnaire.
Please note that from now on and throughout the experiment it is not allowed to communicate
unless the computer explicitly asks you to do so. If you have any questions, please raise your hand
out of your cubicle. One of the experimenters will come to you then. Throughout the experiment, it
is forbidden to use mobile phones, smartphones, tablets or the like. Any violation of the rules leads
to exclusion from the experiment and payment. All decisions are made anonymously, i.e. none of
the participants learns about the identity of the others. Also the payment will be made
anonymously at the end of the experiment.
Instructions
1. What’s it about – An overview
[NoChat: ] This experiment is about making a decision within a group between three different
options A, B and C by way of vote.
[Deliberation / TopDown / TopDownClosed: ] This experiment is about making a decision within a
group between three different options A, B and C through communication and by way of vote.
A group consists of three „white“ and three „blue“ members. Your payment depends on the
decision that the group makes regarding the possible options. It depends, first, on the fact which of
the options will be implemented. Second, it is determined by the role you are assigned to – the
“white” one or the “blue” one. And third, it also depends on the situation that occurs – this can be
either X or Y. The graph below, comprising two tables, shows how many points a white and blue
group member can earn given the three options and depending the situation that occurs – X (left
table) or Y (right table).
Situation X Situation Y
White members Blue members White members Blue members
Op
tio
ns
A 20 20
O
pti
on
s
A 10 0
B 0 0 B 20 10
C 0 10 C 0 20
Translated instructions

2
The following applies for situation X: If option A is implemented, the white members and the blue
members earn 20 points; if option B is implemented none of the members earns anything. If option
C is implemented, the white members do not earn anything and the blue members earn 10 points.
The analogue applies for situation Y: If option A is implemented, the white members earn 10 points
and the blue members do not earn anything; if option B is implemented, the white members earn
20 points and the blue members earn 10 points. If option C is implemented, the white members do
not earn anything and the blue members earn 20 points.
The situation is not directly observable, but is selected randomly by the computer; both situations X
and Y are equally likely i.e. they will be realized with a probability of 50%. The situation that is
chosen by the computer is valid for the entire group; i.e. the payments for the white members as
well as for the blue members are determined by either the left table or the right table. Thus, one
could also say that the computer selects randomly one out of the two tables for the entire group,
whereby both tables are equally likely.
Besides the partly different payments, there is also another difference between the white members
and the blue members within a group: Each white member receives independent information by
the computer on whether situation X or situation Y occurs. This information is true with a 70%
probability (i.e. it is true in 70 out of 100 cases and wrong in 30 out of 100 cases). Thus, as this
information does not always have to be true, it is possible that not all three white members receive
the same information by the computer. The blue members do not receive any information by the
computer.
[NoChat: ] In order to make a decision between the three options, the group goes through a two-
stage process. On the first stage, all group members can take notes in order to sort out their
thoughts. On the second stage the voting will be carried out. The option with the most votes will be
implemented.
[Deliberation: ] In order to make a decision between the three options, the group goes through a
two-stage process. On the first stage, all group members can chat together. On the second stage
the voting will be carried out. The option with the most votes will be implemented.
[TopDown: ] In order to make a decision between the three options, the group goes through a two-
stage process. On the first stage, all white group members can chat together and send messages to
the entire group. The blue members can read these messages, but they cannot actively take part in
chatting. On the second stage the voting will be carried out. The option with the most votes will be
implemented.
[TopDownClosed: ] In order to make a decision between the three options, the group goes through
a three-stage process. On the first stage, all white group members can chat together. The blue
members cannot read these messages. On the second stage, all white group members can chat
together and send messages to the entire group. The blue members can read these messages, but

3
they cannot actively take part in chatting. On the third stage the voting will be carried out. The
option with the most votes will be implemented.
The experiment comprises 20 rounds.
In the following, the experiment will be explained in detail:
1. The allocation of the roles
At the beginning of the experiment, the computer randomly assigns every participant either the
role of a white member or that of a blue member. The roles remain constant throughout the
whole experiment, i.e. one’s own role will not change between rounds. Instead, in each round the
group constellation will be re-determined: In each round the computer randomly allocates the
participants to groups of six, consisting of three white members and three blue members.
In the following the course of an (arbitrary) round will be described. The experiment consists of 20
rounds. The payments in any given round only depend on what happens in that round – they are
independent of former rounds. The situation that occurs in a given round is likewise independent
of the situations that have occurred in former rounds.
2. Course of a round
At the beginning of each round, the computer randomly assigns the whites and the blues to
groups of six, consisting of three white members and three blue members. Then each white
member receives information by the computer on whether situation X or Y prevails, i.e. if the left
or right table is correct. This information is true with a 70% probability. The blue members do not
get any information.
[NoChat: ] Then a “note”-window opens where you can write down notes. Please use the window
only for taking notes regarding things that are relevant for the experiment. The window will
disappear after two minutes. You will see in the top right corner how much time you have left.
[Deliberation: ] Then a “chat”- window opens where all group members, the white and the blue
members, can chat together. The computer randomly assigns everyone who enters a message a
number that will be shown at the beginning of the message sent together with the role (white or
blue). A possible pseudonym is for example „Blue 1“. Please note: The pseudonyms are only valid
for this round. With the help of these pseudonyms you can address each other and keep track of
which messages are sent from the same person during the chat. Throughout the chat you can try to
influence the voting decisions of the others. Please only use this chat for exchanging views on
things that are relevant for the experiment. It is not allowed to uncover one’s own identity or the
identity of other group members. The chat window will disappear after two minutes. You will see in
the top right corner how much time you have left.
[TopDown: ] Then a “chat”- window opens where the white group members can chat together and
send messages to the entire group. The blue members can read these messages, but they cannot

4
actively take part in chatting. The computer randomly assigns all white members who enter a
message a number that will be shown at the beginning of the messages sent. A possible pseudonym
is for example „White 1“.Please note: The pseudonyms are only valid for this round. With the help
of these pseudonyms you can address each other and keep track of which messages are sent from
the same person during the chat. Throughout the chat you can try to influence the voting decisions
by the others. Please only use this chat for exchanging views on things that are relevant for the
experiment. It is not allowed to uncover one’s own identity or the identity of other group members.
The chat window will disappear after two minutes. You will see in the top right corner how much
time you have left.
[TopDownClosed: ] Then a “chat”- window opens for the white group members where they can
chat together. The blue members cannot read these messages. They have to wait for the
experiment to proceed. Subsequently, another chat window opens where the white group
members can chat together and send messages to the entire group. The blue members can read
these messages, but they cannot actively take part in chatting. In both chats, the computer assigns
all white members who enter a message randomly a number that will be shown at the beginning of
the messages sent. A possible pseudonym is for example „White 1“. Please notice: The pseudonyms
are only valid for this round. With the help of these pseudonyms you can address each other and
keep track of which messages are sent from the same person during the chat. Throughout the chat
you can try to influence the voting decisions by the others. Please only use this chat for exchanging
views on things that are relevant for the experiment. It is not allowed to uncover one’s own identity
or the identity of other group members. Each of these chat windows will disappear after one
minute. You will see in the top right corner how much time you have left.
[NoChat: ] In the next step there is a secret vote over the three options. That means each group
member can vote anonymously either for A or B or C or abstain from voting. Ultimately, the
computer implements the option with the most votes. (In case of parity of votes the computer
randomly chooses between the options with the most votes. Also in case that all group members
abstain from voting, the computer randomly chooses one of the three options.)
[Deliberation / TopDown: ] After the chat there is a secret vote over the three options. That means,
each group member can vote anonymously either for A or B or C or abstain from voting. Ultimately,
the computer implements the option with the most votes. (In case of parity of votes the computer
randomly chooses between the options with the most votes. Also in case that all group members
abstain from voting, the computer randomly chooses one of the three options.)
[TopDownClosed: ] After the second chat there is a secret vote over the three options. That means,
each group member can vote either for A or B or C or abstain from voting. Ultimately, the computer
implements the option with the most votes. (In case of parity of votes the computer randomly
chooses between the options with the most votes. Also in case that all group members abstain
from voting, the computer chooses one of the three options.)

5
Then all group members are informed about the option that has been elected and they learn about
the distribution of votes, i.e. how many votes option A has received, how many votes option B has
received, how many votes option C has received and how many abstentions there have been.
Moreover, the computer screen informs each group member about the situation that has occurred
and how many points he or she has earned in the given round.
3. Total payment for the experiment
At the end of the experiment the computer will randomly, and independently from each other,
selected three rounds. All rounds are equally likely. The payments that you have earned in these
selected rounds will be summed up and converted into EURO with the exchange rate 1 EURO = 3
POINTS. Your total earnings from the experiment consist of the resulting amount plus the show-up
fee of 10 EURO.

References
Ambrus, A., Azevedo, E. M., Kamada, Y., 2013. Hierarchical cheap talk. Theoretical Economics
8 (1), 233–261.
Benoıt, J.-P., Dubra, J., 2014. A theory of rational attitude polarization. Working Paper, Social
Science Research Network.
Bock, O., Baetge, I., Nicklisch, A., 2014. hroot: Hamburg registration and organization online
tool. European Economic Review 71, 117–120.
Borgonovi, F., d’Hombres, B., Hoskins, B., 2010. Voter turnout, information acquisition and
education: Evidence from 15 european countries. The BE Journal of Economic Analysis &
Policy 10 (1).
Bowles, S., Polanıa-Reyes, S., 2012. Economic incentives and social preferences: substitutes or
complements? Journal of Economic Literature 50 (2), 368–425.
Brandts, J., Cooper, D. J., 2007. It’s what you say, not what you pay: An experimental study of
manager-employee relationships in overcoming coordination failure. Journal of the European
Economic Association 5 (6), 1223–1268.
Brandts, J., Cooper, D. J., 2015. Centralized vs. decentralized management: An experimental
study. Tech. rep., Barcelona GSE Working Paper: 903.
Buechel, B., Mechtenberg, L., 2017. The swing voter’s curse in social networks. Working Paper.
Chen, R., Chen, Y., 2011. The potential of social identity for equilibrium selection. The American
Economic Review 101 (6), 2562–2589.
Chen, Y., Li, S. X., 2009. Group identity and social preferences. The American Economic Review
99 (1), 431–457.
Cohen, J., 1989. The good polity. Oxford: Blackwell, Ch. Deliberation and democratic legiti-
macy, pp. 67–92.
Dawes, R. M., Van de Kragt, A. J., Orbell, J. M., 1990. Beyond self-Interest. The University of
Chicago Press, Ch. Cooperation for the benefit of us: Not me, or my conscience, pp. 97–110.
Dryzek, J. S., List, C., 2003. Social choice theory and deliberative democracy: a reconciliation.
British Journal of Political Science 33 (1), 1–28.
Fischbacher, U., 2007. z-tree: Zurich toolbox for ready-made economic experiments. Experimen-
tal economics 10 (2), 171–178.
Gneezy, U., Kajackaite, A., Sobel, J., forthcoming. Lying aversion and the size of the lie. Amer-
ican Economic Review.
58

Goeree, J. K., Yariv, L., 2011. An experimental study of collective deliberation. Econometrica
79 (3), 893–921.
Guarnaschelli, S., McKelvey, R. D., Palfrey, T. R., 2000. An experimental study of jury decision
rules. American Political Science Review 94 (2), 407–423.
Gutmann, A., Thompson, D., 1996. Democracy and disagreement: Why moral conflict cannot
be avoided in politics, and what can be done about it. Cambridge, MA: Harvard University
Press.
Habermas, J., 2015. Between facts and norms: Contributions to a discourse theory of law and
democracy. Cambridge, MA: MIT Press.
Karpowitz, C. F., Mendelberg, T., 2011. Cambridge Handbook of Experimental Political Science.
Cambridge University Press Cambridge, Ch. An experimental approach to citizen deliberation,
pp. 258–272.
Landwehr, C., 2010. Discourse and coordination: Modes of interaction and their roles in political
decision-making. Journal of Political Philosophy 18 (1), 101–122.
Myers, C. D., Mendelberg, T., 2013. Oxford handbook of political psychology. Oxford University
Press, Ch. Political deliberation, pp. 699–734.
Orbell, J. M., Van de Kragt, A. J., Dawes, R. M., 1988. Explaining discussion-induced cooper-
ation. Journal of Personality and Social Psychology 54 (5), 811.
Palfrey, T. R., 2016. Handbook of experimental economics. Vol. 2. Princeton University Press,
Ch. Experiments in political economy, pp. 347–434.
Palfrey, T. R., Pogorelskiy, K., forthcoming. Communication among voters benefits the majority
party. Economic Journal.
Pande, R., 2011. Can informed voters enforce better governance? experiments in low-income
democracies. Annual Review of Economics 3, 215–237.
Pronin, K., Woon, J., 2017. Public deliberation, private communication, and collective choice.
Working Paper.
Robalo, P., Schram, A., Sonnemans, J., 2017. Other-regarding preferences, in-group bias and
political participation: An experiment. Journal of Economic Psychology 62, 130–154.
Sapienza, P., Zingales, L., 2013. Economic experts versus average americans. American Economic
Review 103 (3), 636–42.
Sunstein, C. R., 2009. Going to extremes: How like minds unite and divide. Oxford University
Press.
59