Delays in Fibrinolytic Administration for Acute ST-Segment Elevation Myocardial Infarction: Results...
18
Delays in Fibrinolytic Administration for Acute ST-Segment Elevation Myocardial Infarction: Results from the Acute Coronary Treatment and Interventions Outcomes Network Registry – Get With the Guidelines (ACTION Registry®-GWTG TM ) Seth Glickman, MD 1 ; Charles Cairns, MD 1 ; Anita Chen, MS 2 ; Christopher Granger, MD 2 ; Christopher Cannon, MD 3 ; Elizabeth Fraulo, MS 2 ; Eric Peterson, MD, MPH 2 , Matthew Roe, MD 2 1. Department of Emergency Medicine, University of North Carolina-Chapel Hill 2. Duke University Medical Center, Durham, NC 3. Brigham and Women’s Hospital, Boston, MA ,
-
Upload
justina-bryan -
Category
Documents
-
view
220 -
download
4
Transcript of Delays in Fibrinolytic Administration for Acute ST-Segment Elevation Myocardial Infarction: Results...

Delays in Fibrinolytic Administration for Acute ST-Segment Elevation Myocardial
Infarction: Results from the Acute Coronary Treatment and Interventions Outcomes Network Registry – Get With
the Guidelines (ACTION Registry®-GWTGTM)
Seth Glickman, MD1; Charles Cairns, MD1; Anita Chen, MS2; Christopher Granger, MD2; Christopher Cannon, MD3; Elizabeth Fraulo, MS2; Eric Peterson,
MD, MPH2, Matthew Roe, MD2
1. Department of Emergency Medicine, University of North Carolina-Chapel Hill
2. Duke University Medical Center, Durham, NC3. Brigham and Women’s Hospital, Boston, MA
,

Disclosures
• Robert Wood Johnson Foundation Physician Faculty Scholar Award (Glickman PI)
• American Heart Association PRT Outcomes Research Center Project Grant (Glickman, Granger, Co PIs)
• NCDR-American College of Cardiology

Background
• Reperfusion therapy STEMI reduces mortality in a time-dependent manner – PCI– Fibrinolytic therapy
• 2007 AHA/ACC STEMI Guidelines– “STEMI patients presenting to a hospital without PCI
capability and who cannot be transferred to undergo PCI within 90 minutes should be treated with fibrinolytic therapy within 30 minutes as a systems goal”
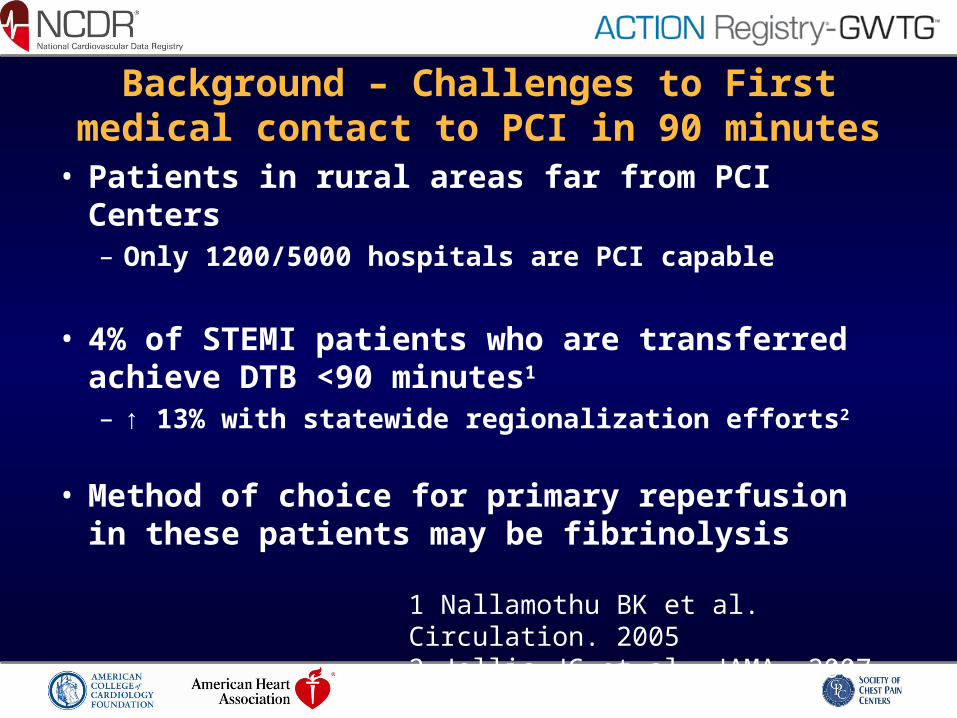
Background – Challenges to First medical contact to PCI in 90 minutes
• Patients in rural areas far from PCI Centers– Only 1200/5000 hospitals are PCI capable
• 4% of STEMI patients who are transferred achieve DTB <90 minutes1
– ↑ 13% with statewide regionalization efforts2
• Method of choice for primary reperfusion in these patients may be fibrinolysis
1 Nallamothu BK et al. Circulation. 20052 Jollis JG et al. JAMA. 2007

Objectives
• Assess the performance of fibrinolytic therapy within the 30 minute guideline in contemporary practice
• Evaluate patient characteristics associated with the timeliness of fibrinolysis
• Determine association of DTN times with patient outcomes

Methods – Study population
• ACTION –GWTG Registry
• January 2007-June 200830,193 patients with STEMI at 286 hospitals
• Fibrinoytic therapy - 3,219 STEMI patients in 178 hospitals

Methods – Variables• Co-variates
– Patient demographics (age, race, gender)– Medical history– Clinical characteristics on presentation
• Outcomes– Time to fibrinolysis– In-hospital events
• Mortality
• Composite outcome – Mortality, stroke, cardiogenic shock

Methods – Statistical analysis
• Association of patient factors and time to fibrinolysis– Linear generalized estimating equations (GEE)
• Association of time to fibrinolysis and outcomes– GEE model

Demographics Presentation characteristics
Age (year), median, IQR 59.0 (51.0-68.0) Clinical symptoms
Gender, male 2358 (73.3) Signs of CHF 299 (9.3)
Race, white 2804 (87.1) Heart rate >100 bpm 392 (12.2)
Insurance status, private 1835 (57.0) Systolic BP <90 mmHg 173 (5.4)
Body mass index (kg/m2) 28.3 (25.3-32.2) Transported by EMS 988 (30.7)
Medical history Hospital characteristics
Hypertension 1823 (56.6) Non-PCI (versus PCI) 2872 (89.2)
Diabetes mellitus 614 (19.1) Region
Current/recent smoker 1512 (47.0) West 432 (13.4)
Dyslipidemia 1545 (48.0) Northeast 298 (9.3)
Prior MI 589 (18.3) Midwest 1041 (32.2)
South 1448 (45.0)
Patient Characteristics (n=3,219)

Results – Distribution of DTN times
Median DTN 34.0 minutes (IQR 22.0 - 54.0)1,432/3,219, 44.5% met the ACC/AHA guideline ≤ 30 minutes

Variable Adjusted
Estimate*
95% CI
(Lower)
95% CI
(Upper)
p-value:
(Individual)
p-value:
(Global)
Patient demographics
Women (vs. men)
Age (year)
17.8 11.9 24.1 <.0001
55 to 64 (vs. <55) -0.3 -5.6 5.3 0.9086 0.0434
65 to 74 (vs. <55) -1.1 -8.6 7.1 0.7875
≥75 (vs. <55) 12.0 1.8 23.2 0.0200
White (vs. other race) -6.7 -14.2 1.4 0.1039
Presentation features
Transported by EMS -19.3 -24.5 -13.7 <.0001
Systolic blood pressure <90 mmHg -10.8 -19.4 -1.3 0.0263
Time or presentation
Weekday, evening (vs. Weekday, day) 4.0 -3.1 11.7 0.2756 0.0156
Weekday, night (vs. Weekday, day) 12.0 3.8 20.9 0.0036
Weekend, day (vs. Weekday, day) 1.1 -8.0 11.3 0.8181
Weekend, evening (vs. Weekday, day) 2.8 -6.3 12.7 0.5605
Weekend, night (vs. Weekday, day) 13.4 3.0 24.8 0.0104

Outcome Outcome (%) Adjusted OR
(95% CI)
p-value
Death 3.1% vs 4.4% 0.79 (0.50-1.25) 0.3126
Death /shock /stroke 6.2% vs 8.8% 0.74 (0.56-0.98) 0.0356
Association of DTN time and Outcomes: ≤30 minutes versus >30 minutes

Potential Limitations• Selection bias (voluntary registry)
– Underestimates treatment delays
• Observational study– Unmeasured confounders
• Physician experience and treatment preferences• Systems factors
• Sicker patients = longer treatment delays– Yet patients in shock treated as quickly

Conclusions
• Timely fibrinolytic therapy associated with better outcomes
• DTN time < 30 min seen < one-half patients– Delays in women, elderly, and after-hours presentations
• Efforts to optimize STEMI care, including regional systems, should focus on shortening reperfusion times for patients who receive primary fibrinolysis as well as those who receive primary PCI

Back up slides

Potential reasons for treatment delays• Delay in diagnosis
– Atypical signs and symptoms
– Door to ECG times, minutes• Women, median 9 (IQR 4 to 14)• Men, median 5 (IQR 2 to 12)
• System factors at small, rural hospitals– Training of emergency providers (board certification)
– Variation in protocols – e.g. CXR, cardiology consultation
• Patient factors– Variation in provider and patient risk preferences

Variable Level Median 25th % 75th% p-value
Presentation characteristics
Systolic BP (mmHg) ≥90 mmHg 34.0 22.0 54.0 0.1622
<90 mmHg 31.0 23.0 46.0
Transported by No 36.0 24.0 57.0 <.0001
Yes 28.0 19.0 45.0
Time of Presentation Weekday, day 32.0 21.0 52.0 0.0077
Weekday, evening 33.0 22.0 52.0
Weekday, night 36.0 25.0 58.0
Weekend, day 33.0 22.5 45.5
Weekend, evening 33.0 21.5 57.0
Weekend, night 35.0 25.0 57.0
Hospital characteristics
Region West 36.0 23.5 60.0 0.0005
Northeast 35.0 23.0 54.0
Midwest 35.0 24.0 55.0
South 32.0 21.0 51.0
Type of hospital PCI 27.0 17.0 52.0 <.0001
Non-PCI 35.0 23.0 54.0

Variable Median 25th
Percentile
75th
Percentile
p-value
(Global)
Patient characteristics
Age (year) <55 31.0 21.0 50.0 <.0001
55-64 33.0 22.0 51.0
65-74 35.0 24.0 55.0
≥75 41.0 25.0 67.0
Gender Male 32.0 21.0 50.0 <.0001
Female 38.0 25.0 61.5
Race Caucasian 34.0 22.0 53.0 0.8096
Black 34.0 21.0 66.0
Asian 32.0 14.0 57.0
Hispanic 34.5 21.0 52.0
Other 35.0 21.0 60.0


](https://static.fdocuments.net/doc/165x107/5556ced7d8b42abb428b5615/acute-myocardial-infarction-final2.jpg)