Degradation Behaviour of Polyester/Nano-Locust Bean Pods ...
13
Kasim & al. / Mor. J. Chem. 3 N°4 (2015) 778-790 778 Degradation Behaviour of Polyester/Nano-Locust Bean Pods Ash (LBPA) composite A. Kasim 1 , M. Abdulwahab 2 , B.O. Araoye 3* Department of Metallurgical and Materials Engineering, Ahmadu Bello University, Zaria, Nigeria *Corresponding author. E-mail :[email protected] 1 , [email protected] 2 , [email protected] 3* Received 10 Jul 2015, Revised 03 Oct 2015, Accepted 01 Nov 2015 Abstract An assessment of the degradation characteristics of LBPA reinforced polyester composite after soil burial was investigated. Nano-LBPA was prepared using a Sol - gel technique. The composite were subjected to soil burial test; the role of this test was to study the degradability, effect of microorganism present in the soil and moisture absorption on the mechanical properties of the composites. Impact, tensile, hardness and flexural properties of the composites were determined before and after soil burial tests for 30, 60 and 90days. Water absorption of the composite was studied for 24hours and their weight loss evaluated. The percentage drop in impact, tensile, flexural and hardness values after 90days exposure were approximately 42%, 34%, 65% and 23% respectively. Tensile modulus decreased approximately up to 57% and flexural modulus decreased approximately up to 41% after 90days. It was generally observed that the weight loss and percentage moisture absorption increases with increase filler loading. Keywords: Nanosized LBPA, Soil burial, Properties 1. Introduction In recent years, there has been an environmental awareness that focused the attention of using natural fibres/particulates as reinforcements for polymeric matrix due to their degradable advantages. Today, lignocellulosic waste such as kenaf fibre, rice straw, banana stem, etc. have been used as fillers in composite materials for diverse applications such as automobile industry as interior parts, flooring, doors, fence panels, and outdoor structures [1,6]. Certain drawbacks, such as incompatible with the hydrophobic polymer matrix, the inclination to form aggregates during processing, and poor resistance to moisture absorption, cut back significantly the mechanical properties of the natural fibres reinforced composite materials [15]. Bio-materials as reinforcing fillers in plastics, in lieu of the previously used inorganic substances and synthetic fibres, offer a major benefit in terms of environmental protection [24]. As society begins to realize the importance of using renewable bio-products that are good to the environment, the focal point is beginning to
Transcript of Degradation Behaviour of Polyester/Nano-Locust Bean Pods ...
Kasim & al. / Mor. J. Chem. 3 N°4 (2015) 778-790
778
Degradation Behaviour of Polyester/Nano-Locust Bean Pods Ash (LBPA)
composite
A. Kasim1, M. Abdulwahab
2, B.O. Araoye
3*
Department of Metallurgical and Materials Engineering, Ahmadu Bello University, Zaria, Nigeria
*Corresponding author. E-mail :[email protected], [email protected]
3*
Received 10 Jul 2015, Revised 03 Oct 2015, Accepted 01 Nov 2015
Abstract
An assessment of the degradation characteristics of LBPA reinforced polyester composite after soil burial was
investigated. Nano-LBPA was prepared using a Sol - gel technique. The composite were subjected to soil burial
test; the role of this test was to study the degradability, effect of microorganism present in the soil and moisture
absorption on the mechanical properties of the composites. Impact, tensile, hardness and flexural properties of
the composites were determined before and after soil burial tests for 30, 60 and 90days. Water absorption of the
composite was studied for 24hours and their weight loss evaluated. The percentage drop in impact, tensile,
flexural and hardness values after 90days exposure were approximately 42%, 34%, 65% and 23% respectively.
Tensile modulus decreased approximately up to 57% and flexural modulus decreased approximately up to 41%
after 90days. It was generally observed that the weight loss and percentage moisture absorption increases with
increase filler loading.
Keywords: Nanosized LBPA, Soil burial, Properties
1. Introduction
In recent years, there has been an environmental awareness that focused the attention of using natural
fibres/particulates as reinforcements for polymeric matrix due to their degradable advantages. Today,
lignocellulosic waste such as kenaf fibre, rice straw, banana stem, etc. have been used as fillers in composite
materials for diverse applications such as automobile industry as interior parts, flooring, doors, fence panels,
and outdoor structures [1,6]. Certain drawbacks, such as incompatible with the hydrophobic polymer matrix, the
inclination to form aggregates during processing, and poor resistance to moisture absorption, cut back
significantly the mechanical properties of the natural fibres reinforced composite materials [15].
Bio-materials as reinforcing fillers in plastics, in lieu of the previously used inorganic substances and synthetic
fibres, offer a major benefit in terms of environmental protection [24]. As society begins to realize the
importance of using renewable bio-products that are good to the environment, the focal point is beginning to

Kasim & al. / Mor. J. Chem. 3 N°4 (2015) 778-790
779
turn back to agricultural materials [14]. Agricultural wastes have recently been researched into in great extent
to: reduce the problem of waste disposal, produce much more inexpensive material, increase the role of waste
textiles and gain use of a more usable material with small or no processing at low production price. In this work,
soil buried locust bean pod ash (LBPA) nanoparticle reinforce polyester composite was studied to examine the
biodegradability of the composite.
2. Experimental procedure
2.1 Materials
The materials used in this research include: Locust bean pods ash (Pakia biglobosa) particulates, unsaturated
polyester resin, HCl, NaOH, ethanol, Cobalt accelerator and methyl-ethyl ketone catalyst.
2.2 Nanoparticles preparation
The locust bean pods (Pakia biglobosa) were sourced locally, washed to remove dirt and sun dried. The pods
were ground and then ash at 6000C for 2hours. The nano-LBPA particles were produced by the Sol - gel
technique. The produced ash was mixed with 2.5M NaOH solution, boiled for 3hours at 900C with constant
stirring. The particles were then filtered and mixed thoroughly with 2% HCl solution; refluxing of the mixture,
followed for 4hours at 900C; the particles removed, filtered, washed with distilled water and dried. The particles
were then heated in a heat-treatment furnace at 6000C for 5hours.
2.3 Composite preparations
To develop the composite, polyester resin was first thoroughly mixed with the cobalt accelerator (10%) and
methyl-ethyl ketone catalyst (10%). Releasing agent was used inside the mould cavity to ease the removal of the
composite after solidification. The polyester resin was mixed with and without reinforcement, after addition of
the accelerator and catalyst. The nano-LBPA were varied at 3wt% to 12wt% (at intervals of 3wt%) to produce
the polyester/nano-LBPA composite. After proper stirring, the homogenous mixture was poured into the mould
and left at room temperature until it settled. After cooling and solidification, it was removed from the mould,
cured by heating in an oven at 700C for 2hours and then cooled in still air.
2.4 Degradability test
Degradability test of the synthesized composite was conducted to assess the influence of soil burial on the
samples. The samples were prepared according to the required test sizes of tensile, hardness, impact and
flexural. There were then buried in the soil (at a depth of 20cm) for 30, 60 and 90days after which they were
removed at intervals of 30 days and their properties evaluated using the tests discussed below; their weight loss
was also computed.
2.5 Mechanical testing
(a) Impact Test: The impact energy test of the composite samples was determined using a Charpy impact
testing machine. The procedure used is in accordance with that recommended by ASTM 256 and the impact
strength calculated.

Kasim & al. / Mor. J. Chem. 3 N°4 (2015) 778-790
780
(b) Tensile Test: The test was performed in accordance with standard procedure specified in ASTM D638
using the Hounsfield Tensometer. The tensile strength and tensile modulus was calculated using
𝜎 = 𝐹
𝐴 (1)
𝜖 = 𝜎
𝐸 (2)
Where 𝜎 is the tensile stress, F = load (N), A is cross-sectional area of the sample, 𝜖 is the tensile modulus and
E is the tensile strain.
(c) Flexural Test: The Flexural tests were conducted to determine the flexural properties of the composite. The
Samples were subjected to bending by supporting them at both ends and a midpoint load applied until fracture
as recommended in ASTM D790. The flexural strength(𝜎𝑓) was calculated using
𝜎𝑓 = 3𝐹𝐿
2𝑏𝑑 2 (3)
Where F is the load (N), L is the length of the support span (mm), b is the specimen width (mm), and d is the
specimen thickness (mm). The flexural modulus(𝐸𝑓) was calculated using
𝐸𝑓 = 𝐹𝐿3
4𝑏𝐻 3𝑑 (4)
Where H is height, d is deflection and other parameter remains as above.
(d) Hardness Test: The Hardness tests of the samples were carried out using a Rockwell hardness testing
machine on F scale (HRF). The test was carried out in accordance with the procedure described by ASTM
D785. Minor load of 10kgF was applied followed by the major of 60KgF. The hardness value of each sample,
digitally displayed, was recorded.
2.6 Water absorption test
Water absorption of the composites was determined using the procedure recommended by ASTM D570. The
samples were weighed (W1) before immersion in distilled water and after 24hour, they were removed, cleaned
and dried with blotting paper and final weight (W2) recorded.
% Moisture Content = 𝑊2− 𝑊1
𝑊1 × 100 (5)
2.7 Weight loss evaluation
The test samples used were weighed before (initial weight, W0) and after (final weight, Wt) degradation and the
percentage weight loss evaluated using the equation below:-
% Weight loss = 𝑊0− 𝑊𝑡
𝑊0 × 100 (6)
2.8 Surface morphology analysis
The fracture surface of the test samples and the synthesized Locust Bean Pod Ash (LBPA) Nano-sized particles
were studied using Scanning electron Microscope (SEM – model: Phenom ProX).
3. Results and Discussion
3.1 Results
Kasim & al. / Mor. J. Chem. 3 N°4 (2015) 778-790
781
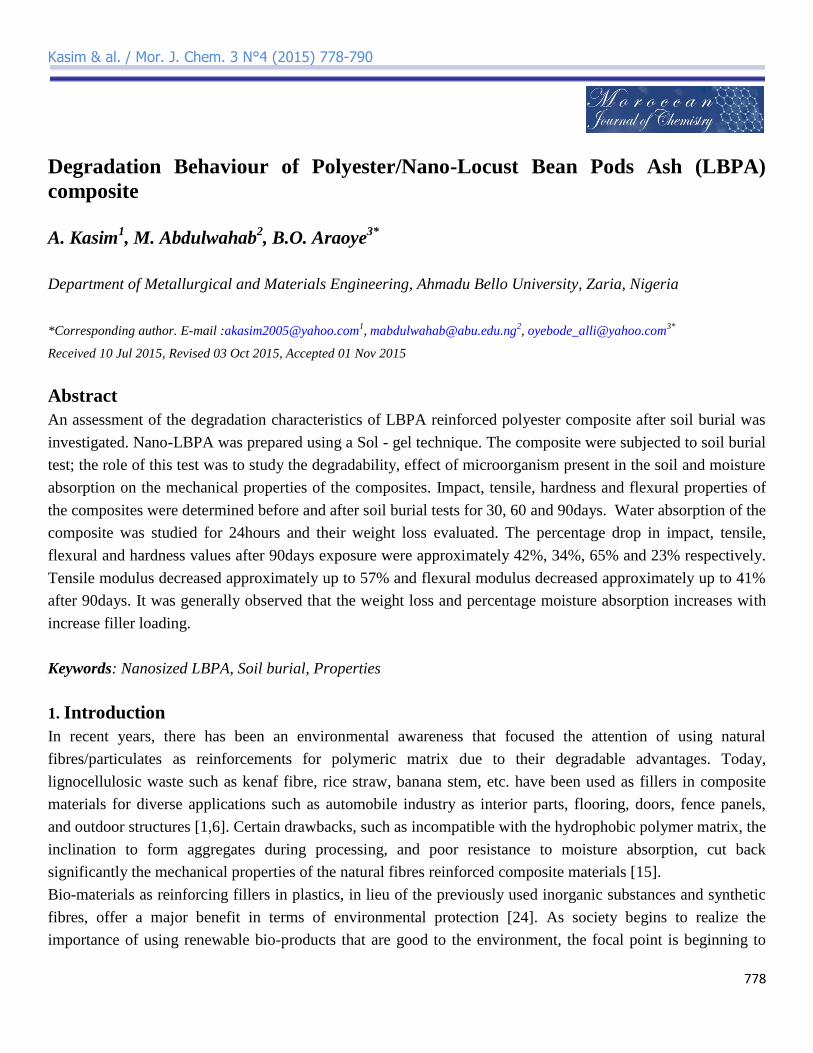
Figure 1 and 2 shows the impact strength profile of the soil buried and non-degraded polyester/Nano-LBPA
composite samples. While Figures 3–12 depicts the tensile strength/modulus, flexural strength/modulus and
hardness of the non-degraded and degraded (soil buried) polyester/Nano-LBPA composite samples. Figures 13–
17 indicates the percentage water absorption and percentage weight loss of the mechanical tests (impact, tensile,
flexural and hardness) samples. While Figure 18 shows the micrograph of the synthesized nanoparticles
developed from LBPA particle. In Figures 19 and 20, the micrographs of the fracture surface after soil burial
degradation and water absorption test samples were presented.
3.2 Discussion
3.2.1 Impact strength
In Figure 1, the impact strength value decreased from 40 J/m (at 0%LBPA) after 30days to a value of 23 J/m (at
12%LBPA); approximately 42% reduction after 90days. The addition of LBPA enhanced the biodegradability
of the polyester, mainly because of the increased polymer surface created after LBPA consumption by
microorganisms. This agrees with a report elsewhere [11, 23]. Equally, there was also an observed increase in
impact strength value at 3%LBPA and 6%LBPA for the entire period of exposure as evident from Figure 1, this
could be due to the fact that high amount of water caused swelling of the particles, which could fill the gaps
between the particle and the polyester matrix and eventually lead to an increase in the mechanical properties of
the composite (impact test samples). The impact strength of the non-degraded composite samples were found to
increase with increase percentage reinforcement (at 0%LBPA to 12%LBPA) – approximately 18%, but
6%LBPA was noted to exhibit the highest impact strength value (Figure 2). This might also be due to increased
0
10
20
30
40
50
60
70
0 3 6 9 12
Imp
act
Str
ength
(J/m
)
% Composition of LBPA
90days
60days
30days
0
5
10
15
20
25
30
35
40
45
50
0 3 6 9 12
Imp
act
Str
ength
(J/m
)
% Composition of LBPA
Figure 2: Impact strength profile of non-degraded
polyester/Nanosized LBPA composite.
Figure 1: Impact strength profile of soil buried
polyester/Nanosized LBPA composite for 30, 60
and 90 days.

Kasim & al. / Mor. J. Chem. 3 N°4 (2015) 778-790
782
polymer-filler interaction as attested by [10, 22 in 18]. However, there was a general decrease in impact strength
values of the composite samples with increase in LBPA addition after degradation. This indicates that the
degradation of LBPA is faster than that of polyester matrix; this might be because the LBPA materials were
easily attacked by microorganisms as established [3, 11].
3.2.2 Tensile Properties
0
5
10
15
20
25
30
35
0 3 6 9 12
Ten
sile
str
ength
(M
Pa)
% Composition of LBPA
90days
60days
30days
0
0,05
0,1
0,15
0,2
0,25
0,3
0,35
0,4
0 3 6 9 12
Ten
sile
mod
ulu
s (G
Pa)
% Composition of LBPA
90days
60days
30days
0
1
2
3
4
5
6
7
8
0 3 6 9 12
Ten
sile
Str
ength
(M
Pa)
% Composition of LBPA
0
0,01
0,02
0,03
0,04
0,05
0,06
0,07
0,08
0 3 6 9 12Ten
sile
mod
ulu
s (G
Pa)
% Composition of LBPA
Figure 5: Tensile strength profile of non-
degraded polyester/Nanosized LBPA
composite.
Figure 6: Tensile modulus profile of non-
degraded polyester/Nanosized LBPA composite.
Figure 3: Tensile strength profile of soil
buried polyester/Nanosized LBPA composite
for 30, 60 and 90 days.
Figure 4: Tensile modulus profile of soil buried
polyester/Nanosized LBPA composite for 30, 60 and
90 days.
Kasim & al. / Mor. J. Chem. 3 N°4 (2015) 778-790
783
Figures 3 and 4 illustrate the effect of soil burial on the tensile properties of polyester/Nanosized LBPA
composites. At 12%LBPA, the least tensile strength value of 9 MPa was obtained after 60days exposure to soil
(Figure 3). From the same Figure, it is obvious that the tensile strength of the composite samples dropped from
32 MPa to 21 MPa (at 0%LBPA), approximately 34% reduction, with tensile modulus found to decrease
approximately up to 57% after the exposure period (i.e. 30–90days). This indicated that the samples
continuously degrade with an increase in the exposure time and also the microorganisms consumed the LBPA
and create pores in the matrix, leading to its higher water absorption and low mechanical properties as
established [16]. The presence of voids might also be a contributing factor for the drop in tensile strength [7, 8,
19]. General reduction was observed in the tensile modulus value of the degraded samples. The drop in modulus
was found to be approximately 77% over the exposure period at 0%LBPA to 12%LBPA for 30–90days (Figure
4). Some fluctuations were observed in increased tensile strength values at 3% LBPA and 6% LBPA for the
entire period of exposure to soil. This indicated that there was some degree of interactions between the particle
and the polymer matrix of the composite which might be responsible for the anomalous increase in tensile
strength value. This agrees with earlier reports [22]. The tensile strength and modulus of non-degraded samples
exhibit enhanced properties; with an increase in their value as the percentage particulate reinforcement increases
(Figure 5 and 6). This might be due to increase surface area that is possible from fine particles compared to
large ones as reported elsewhere [17]. Some exceptional cases were noted at 3%LBPA (tensile strength) and
9%LBPA (modulus of elasticity) which exhibit a decrease in property probably due to poor interfacial adhesion
between the matrix and reinforcement as established earlier [1]. However, the effect of water absorption due to
soil burial might be responsible for the changes in mechanical properties of the polyester–Nan-LBPA
composites. These changes might have occurred due to property and structural changes in the matrix phase,
reinforcement and the interface between them as established [19].
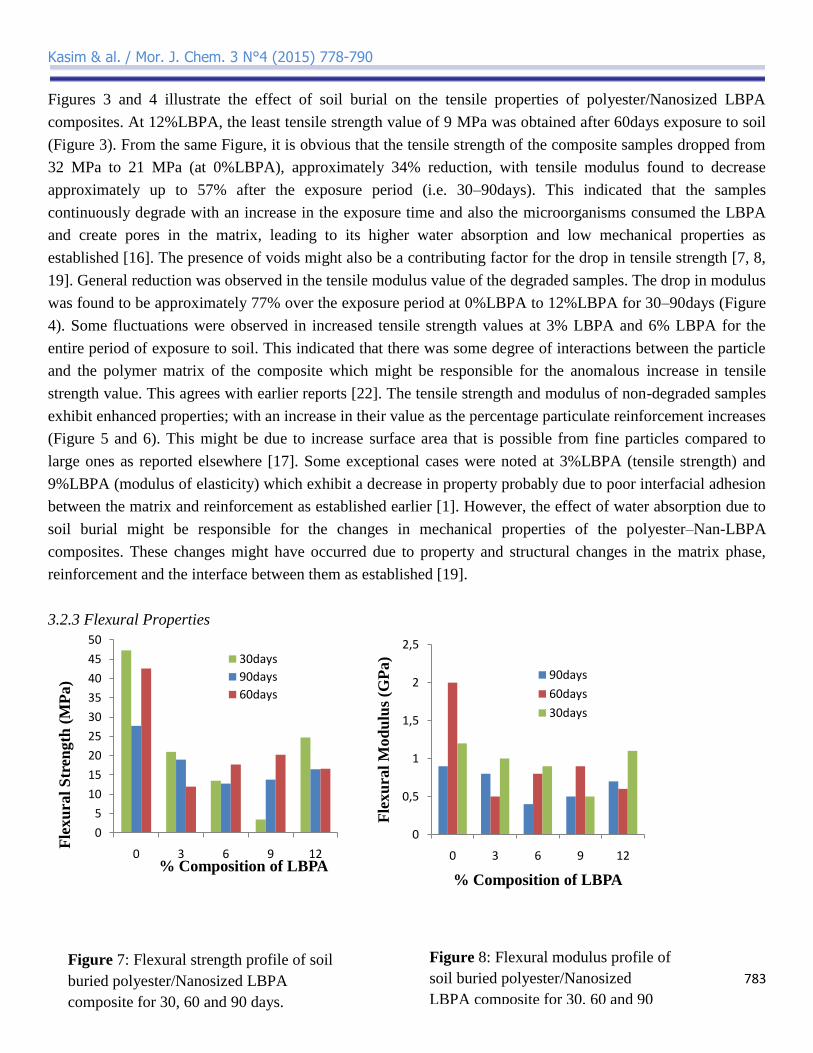
3.2.3 Flexural Properties
0
5
10
15
20
25
30
35
40
45
50
0 3 6 9 12
Fle
xu
ral
Str
ength
(M
Pa)
% Composition of LBPA
30days
90days
60days
0
0,5
1
1,5
2
2,5
0 3 6 9 12
Fle
xu
ral
Mod
ulu
s (G
Pa)
% Composition of LBPA
90days
60days
30days
Figure 7: Flexural strength profile of soil
buried polyester/Nanosized LBPA
composite for 30, 60 and 90 days.
Figure 8: Flexural modulus profile of
soil buried polyester/Nanosized
LBPA composite for 30, 60 and 90
days.

Kasim & al. / Mor. J. Chem. 3 N°4 (2015) 778-790
784
From Figure 7, the flexural strength of the polymer composite decreased with the increased LBPA addition. The
percentage reduction was 65% after exposure to soil at 0%LBPA, with flexural strength value of 62.13 MPa
(after 30days) and dropped to 8.73 MPa (after 90days) at 12%LBPA, with a modulus value of 1.2 GPa to 1.1
GPa respectively. The lowest flexural strength value of the composite samples, was observed to be 3.42 MPa at
9%LBPA after 30days; on the contrary, the lowest flexural modulus was observed to be at 6%LBPA after
90days (Figure 8). The decrease in flexural strength of the composites can be explained on the basis of
agglomerate formation; the presence of these agglomerates increased the flaws in the composite. The flaws
became larger in size and wetting of the filler by the matrix phase occurred, thus forming the voids between the
filler and the matrix polymer; these accelerated the rates of water absorption and caused more damage to the
composite samples [1, 2, 9]. Equally, increase in flexural strength value was observed for test samples exposed
to soil for 30days (at 9%LBPA) which increase sharply from 3.42 MPa to 24.71 MPa (at 12%LBPA); with the
rise in flexural modulus from 0.5 GPa to 1.1 GPa; similarly, after exposure for 60days at 6%LBPA, there was
an increase from 17.71 MPa to 20.24 MPa at 9%LBPA with approximately 13% increase in modulus value
(Figure 8) before falling back at 12% LBPA (16.57 MPa). The results obtained show that pure polyester
samples exhibit the highest flexural strength behaviour due to the matrix properties which displayed more
ductility than the test composite samples. The addition of natural particulate filler to the polymer matrix has
increased the degradation properties of the matrix and has also introduced stiffness to the polymer matrix
composite, thus reducing the flexibility of the composite (Figure 8). From Figure 9 and 10, the flexural strength
and flexural modulus of non-degraded samples exhibit an increase in value from 10.75 MPa at 0%LBPA to
14.17 MPa at 12%LBPA and 1.1 GPa at 0% to 1.4 GPa at 12%LBPA. This is similar to earlier report [17]. The
0
2
4
6
8
10
12
14
16
18
20
0 3 6 9 12
Fle
xu
ral
Str
eng
th (
MP
a)
% Composition of LBPA
0
0,2
0,4
0,6
0,8
1
1,2
1,4
1,6
1,8
0 3 6 9 12
Fle
xu
ral
Mod
ulu
s (G
Pa)
% Composition of LBPA
Figure 9: Flexural strength profile of non-
degraded polyester/Nanosized LBPA
composite.
Figure 10: Flexural modulus profile
of non-degraded polyester/Nanosized
LBPA composite.

Kasim & al. / Mor. J. Chem. 3 N°4 (2015) 778-790
785
lowest values were observed to be at 6%LBPA for both strength and flexural modulus. It is known that good
bonding increases the stiffness of a material but, at the same time, decreases the impact strength or toughness of
the materials. This agrees with a report elsewhere [1].
3.2.4 Hardness
Figures 11 and 12 show the hardness profile of the Nano-LBPA/polyester matrix composite at different LBPA
addition, after exposure to soil for 30, 60 and 90days and the hardness profile of non-degraded samples. It can
be seen that there is a fluctuation in the hardness values of the test samples. The pure polyester samples had the
highest hardness values for the entire period of exposure to soil compared to the composite samples. This might
be due to the degradation of the composite after being attacked by microorganism as report earlier [11].
Decrease in hardness value with increase weight percent reinforcement was observed for non-degraded samples
(Figure 12). This agrees with earlier reports [21].
3.2.5 Percent Water Absorption
The percent water absorption of the polyester/Nano-LBPA composite samples at volume fraction of 0, 3, 6, 9
and 12%LBPA was computed using equation 5. Figure 13 shows the percentage of weight gained as a function
of time for these test samples. From the curve, it could be seen that the water absorption, increased as the
volume fraction of LBPA increase for all test composite samples. This can be explained on the basis, that when
the composite is exposed to moisture, the hydrophilic nature of the reinforcement makes it swell. As a result,
weight gain in the composite samples was observed. The attack of the composite by water molecules resulted in
debonding the matrix from the reinforcement. This agrees with earlier research [5].
0
1
2
3
4
5
6
7
8
9
10
0 3 6 9 12
Rock
wel
l h
ard
enes
s (
HR
F)
% Composition of LBPA
90days 60days
30days
0
1
2
3
4
5
6
7
8
0 3 6 9 12
Rock
wel
l h
ard
nes
s (H
RF
)
% Composition of LBPA
Figure 11: Hardness profile of soil buried
polyester/Nanosized LBPA composite for 30, 60
and 90 days.
Figure 12: Hardness profile of non-degraded
polyester/Nanosized LBPA composite.

Kasim & al. / Mor. J. Chem. 3 N°4 (2015) 778-790
786
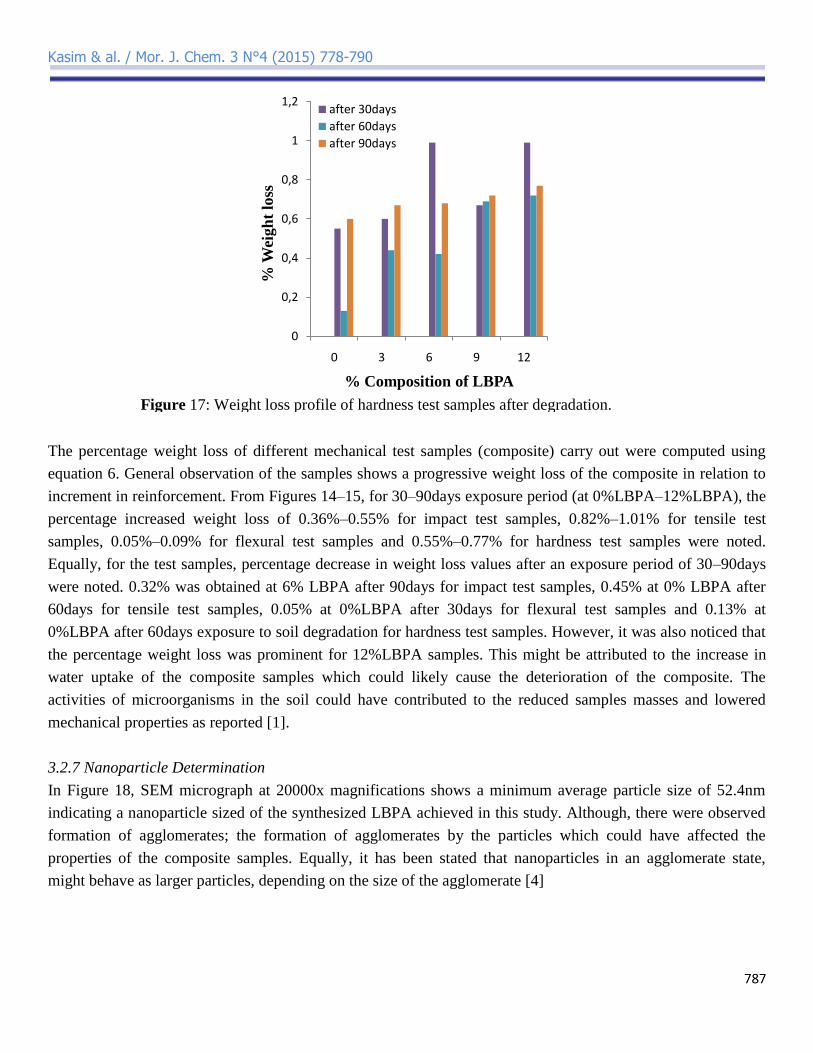
3.2.6 Percentage Weight Loss
0
0,2
0,4
0,6
0,8
1
1,2
1,4
1,6
0 3 6 9 12
% W
ate
r ab
sorp
tion
% Composition of LBPA
0
0,2
0,4
0,6
0,8
1
1,2
1,4
1,6
1,8
0 3 6 9 12
% W
eigh
t lo
ss
% Composition of LBPA
after 30daysafter 60daysafter 90days
0
0,05
0,1
0,15
0,2
0,25
0,3
0 3 6 9 12
% W
eigh
t lo
ss
% Composition of LBPA
after 30days
after 60days
after 90days
0
0,2
0,4
0,6
0,8
1
1,2
1,4
1,6
1,8
0 3 6 9 12
% W
eigh
t lo
ss
% Composition of LBPA
after 30daysafter 60days
Figure 13: Percent Water absorption
profile of polyester/Nanosized LBPA
composite after 24hour
Figure 14: Weight loss profile of impact test
samples after soil burial degradation for 30, 60
and 90days.
Figure 15: Weight loss profile of flexural
test samples after degradation.
Figure 16: Weight loss profile of tensile
test samples after degradation.
Kasim & al. / Mor. J. Chem. 3 N°4 (2015) 778-790
787
The percentage weight loss of different mechanical test samples (composite) carry out were computed using
equation 6. General observation of the samples shows a progressive weight loss of the composite in relation to
increment in reinforcement. From Figures 14–15, for 30–90days exposure period (at 0%LBPA–12%LBPA), the
percentage increased weight loss of 0.36%–0.55% for impact test samples, 0.82%–1.01% for tensile test
samples, 0.05%–0.09% for flexural test samples and 0.55%–0.77% for hardness test samples were noted.
Equally, for the test samples, percentage decrease in weight loss values after an exposure period of 30–90days
were noted. 0.32% was obtained at 6% LBPA after 90days for impact test samples, 0.45% at 0% LBPA after
60days for tensile test samples, 0.05% at 0%LBPA after 30days for flexural test samples and 0.13% at
0%LBPA after 60days exposure to soil degradation for hardness test samples. However, it was also noticed that
the percentage weight loss was prominent for 12%LBPA samples. This might be attributed to the increase in
water uptake of the composite samples which could likely cause the deterioration of the composite. The
activities of microorganisms in the soil could have contributed to the reduced samples masses and lowered
mechanical properties as reported [1].
3.2.7 Nanoparticle Determination
In Figure 18, SEM micrograph at 20000x magnifications shows a minimum average particle size of 52.4nm
indicating a nanoparticle sized of the synthesized LBPA achieved in this study. Although, there were observed
formation of agglomerates; the formation of agglomerates by the particles which could have affected the
properties of the composite samples. Equally, it has been stated that nanoparticles in an agglomerate state,
might behave as larger particles, depending on the size of the agglomerate [4]
0
0,2
0,4
0,6
0,8
1
1,2
0 3 6 9 12
% W
eigh
t lo
ss
% Composition of LBPA
after 30days
after 60days
after 90days
Figure 17: Weight loss profile of hardness test samples after degradation.

Kasim & al. / Mor. J. Chem. 3 N°4 (2015) 778-790
788
3.2.8 Surface morphology analysis
Figure 19: SEM micrographs of the polyester/Nanosized LBPA composite exposed to soil for 90days (at
3%LBPA), showing a rougher surface compared to Plate I, (A) 1000x (B) 5000x.
Figure 20: SEM micrographs of the polyester/Nanosized LBPA composite after water absorption test for
24hours, showing agglomerate of particles within the matrix phases (A) 1000x (B) 5000x.
Figure 18: SEM micrographs of the Nanoparticles developed from LBPA particle. These show 52.4nm of the
particle with agglomeration and non-uniformity in the shape. of the particl
A B
A B

Kasim & al. / Mor. J. Chem. 3 N°4 (2015) 778-790
789
Figure 20 shows the micrograph of the composite after testing for water absorption (at 12%LBPA for 24hours).
There were agglomerate of particles as observed from the microstructure; similar observation was noted in the
micrograph of the composite samples exposed to the soil. This might be due to poor dispersion of particles in
the matrix phases, leading to the formation of agglomerates. The presence of these agglomerates might have
facilitated higher rate of water/moisture absorption by the composite as established elsewhere [12]. The
microstructure of the polyester/Nano-LBPA composite fractured surface after degradation displayed a roughed
surface with pore sizes noted to be an average of 760.29µm2 (Figure 19). The high pore size noted in the
composite sample exposed to soil could be due to the removal of cellulose by the activities of microorganism in
the soil. The Presence of voids indicated that the rate of degradation and the area attacked by microorganisms.
The LBPA particles that are not encapsulated by the polyester matrix could easily absorb moisture from the
environment and from the rainfall–swelling pressures of the swelled LBPA particles occur. This might
simultaneously cause micro-cracks, particularly in the surrounding brittle polyester matrix, eventually leading to
reduction in weight of the composite samples; thus lowered mechanical properties observed [13, 20]. This
agrees with the result presented above.
4. Conclusions
LBPA could be utilized as biodegradable filler in polymeric materials, to minimize environmental
pollution.
Nano-sized LBPA reinforced polyester matrix composite have exhibited biodegradability due to soil
burial after 90days of exposure.
There was no correlation between the hardness and other properties after soil burial study may be
due to better interfacial bonding between the matrix and reinforcement of the hardess samples.
Presence of agglomerates may be due to poor dispersion of the particles.
REFERENCE
[1] H.P.S. AbdulKhalil, B.T. Poh, M. Jawaid, R. Ridzuan, R. Suriana, M.R. Said, N.A. Nick Fuad, 2010, J
RPC. DIO: 101177/0731684409102939 Vol. 29 1653.
[2] E. Ana, V. Francisco, K. Singbritt, Appl. SCI. &Manuf., 35 (2004) 1267-1276.
[3] A. Cao, T. Okamura, K. Nakayama, Y. Inoue, T. Masuda, PD&S 78 (2002) 107-117.
[4] B. Cristina, I.P.B. Ivan, R. Kevin, Biointerphase, 2 issues 4 (2007) 17-172.
[5] H.N. Dhakal, Z.Y. Zhang, M.O.W. Richardson, CS & Tech. 67 (2007) 1674-1683.
[6] A. Elsayed, M.S. Elbadry, Aly-Hassan, H. Hiroyuki, Advances in Mechanical Engineering, 2012, 1-10 DIO:
1155/2012/353547.
[7] A.G. Facca, M.T. Kortschot, N. Yan, Science & Manufacturing, 37( 2006) 1660-1671.
[8] C.A.S. Hill, H.P.S. Abdul, Khalil. JAPS, 77 (2000) 1322-1330.
[9] H. Ismail, H.B. Hong, C.V. Ping, H.P.S. AbdulKhalil, JRP&C, 16( 2003) 121-137.
[10] A.C. Karmakar, A.G.H. Hoffmann, JAPS, 54 (1994) 1803-1807.
[11] H.S. Kim, H.J. Kim, J.W. Lee, I.G. Choi, PD&S, 91 (2006) 1117-1127.
[12] R. Mat-Taib, N.S.Z. Ahmad, Z.A. Mohd-Ishak, H.D. Rozman, PPJ. 5, No. 2 (2010) 193-203.

Kasim & al. / Mor. J. Chem. 3 N°4 (2015) 778-790
790
[13] B. Mehdi, K. Abdolreza, K. Shahrzal, O. Abdolraoul, H.O.J. Amir, AJB, Vol. 9, 26 (2010) 4075-4080.
[14] N. Mohamed, Development of Coconut Shell Powder Reinforced HDPE Composites, MSc., Department of
Mechanical Engineering, University of Technical Malaysia, Melaka, 2007.
[15] A.K. Mohanty, M. Misra, L.T. Drazal, “SAMPE, advanced composite technology for 21st century
transportation,” in Proceedings of the Midwest Advanced Materials and Processing Conference, Dearborn,
Michigan, 2000.
[16] H.C. Obasi, IJS&E. Research, 2012, Vol. 3, Issue 8, ISSN2229-5518.
[17] I.O. Oladele, T.A. Adewole, BRI, 2013, Vol. 2013, 1-5, http://dx.doi.org/10.1155/2013/725396.
[18] A.A.A. Rashdi, S.M. Sapuan, M.M.H.M. Ahmad, A. Khalina, JFA&E, 17 (2009) 908-911.
[19] A.A.A. Rashdi, S.M. Sapuan, M.M.H.M. Ahmad, A. Khalina, IJMME, 5 (2010) 11-17.
[20] S.M. Sapuan, L.P. Fei, Y.A. El-Shekeil, M.A. Faris, M&D, 50 (2013) 467-470.
[21] U. Shehu, O. Aponbiede, O.T. Ause, E.F. Obiodunukwe, JM&ES, 5(2) (2014) 366-373.
[22] M.A. Shenoy, D.J. D’melo, EXPRESS Polymer Letters, 1( 9) (2007) 622-628.
[23] R.P. Singh, J.K. Pandeys, D. Rutot, P.H. Degee, P.H. Dubois, Carbohydrates Researches, 338 (2003)
1759-1769.
[24] H-S. Yang, H.J. Kim, J. Son, H.J. Park, B.J. Lee, Hwang T-S. Comp. Struct. 63 (2014) 305.


![historic locust grove GROVE GAZETTE · historic locust grove GROVE GAZETTE [FAll/WINTER 2016] Savvy Costumed Interpreters Enliven Locust Grove’s ‘Christmastide’ C hristmastide](https://static.fdocuments.net/doc/165x107/5f665b0e862ec713605d20c5/historic-locust-grove-grove-gazette-historic-locust-grove-grove-gazette-fallwinter.jpg)