Defnc naioIl UNCLASSIFIEDdtic.mil/dtic/tr/fulltext/u2/a264660.pdf · Defnc naioIl UNCLASSIFIED...
49
Defnc naioIl UNCLASSIFIED SUFFIELD REPORT NO. 583 A-A264 660 ' THERMAL CYCLER TEMPERATURE VARIATION AND ITS EFFECT ON THE POLYMERASE CHAIN REACTION ~ J~3i ~ by D.E. Bader 051 S H March 1993 ~ ~ 18 DEFENCE RESEARCH ESTABLISHMENT SUFFIELD: RALSTON: ALSIRTA 'PE WARNING/ > 'Tha' uipsQJ 'his information .0 pelmttiI', I jI~ 1 ... recqn~tiWQlvurogprietavy/and patenlrhts
Transcript of Defnc naioIl UNCLASSIFIEDdtic.mil/dtic/tr/fulltext/u2/a264660.pdf · Defnc naioIl UNCLASSIFIED...

Defnc naioIl UNCLASSIFIED
SUFFIELD REPORTNO. 583
A-A264 660 '
THERMAL CYCLER TEMPERATURE VARIATION AND ITS
EFFECT ON THE POLYMERASE CHAIN REACTION
~ J~3i ~ by
D.E. Bader
051 S H
March 1993 ~ ~ 18
DEFENCE RESEARCH ESTABLISHMENT SUFFIELD: RALSTON: ALSIRTA
'PE WARNING/ >'Tha' uipsQJ 'his information .0 pelmttiI', IjI~ 1 ... recqn~tiWQlvurogprietavy/and patenlrhts
UNCLASSIFIED
UNLIMITED DISTRIBUTION
DEFENCE RESEARCH ESTABLISHMENT SUFFIELD
RALSTON, ALBERTA
SUFFIELD REPORT NO. 583
THERMAL CYCLER TEMPERATURE VARIATION AND ITS EFFECT
ON THE POLYMERASE CHAIN REACTION
by
D.E. Bader
"I Th u t if is permitte S- toreogii ary and patent rights!
DRES SR-583 UNCLASSIFIEDI
UNCLASSIFIED
ACKNOWLEDGEMENT
The author would like to thank Dr. M. Hamilton, Dr. L. Nagata, and Ms. E
Fulton for their constructive comments and Joanne Hodges for her help in
performing some of the statistical analysis.
' - . . .. . . . . . . .
ii
UNCLASSIFIED ORE~S-SR• SX3
UNCLASSIFIED
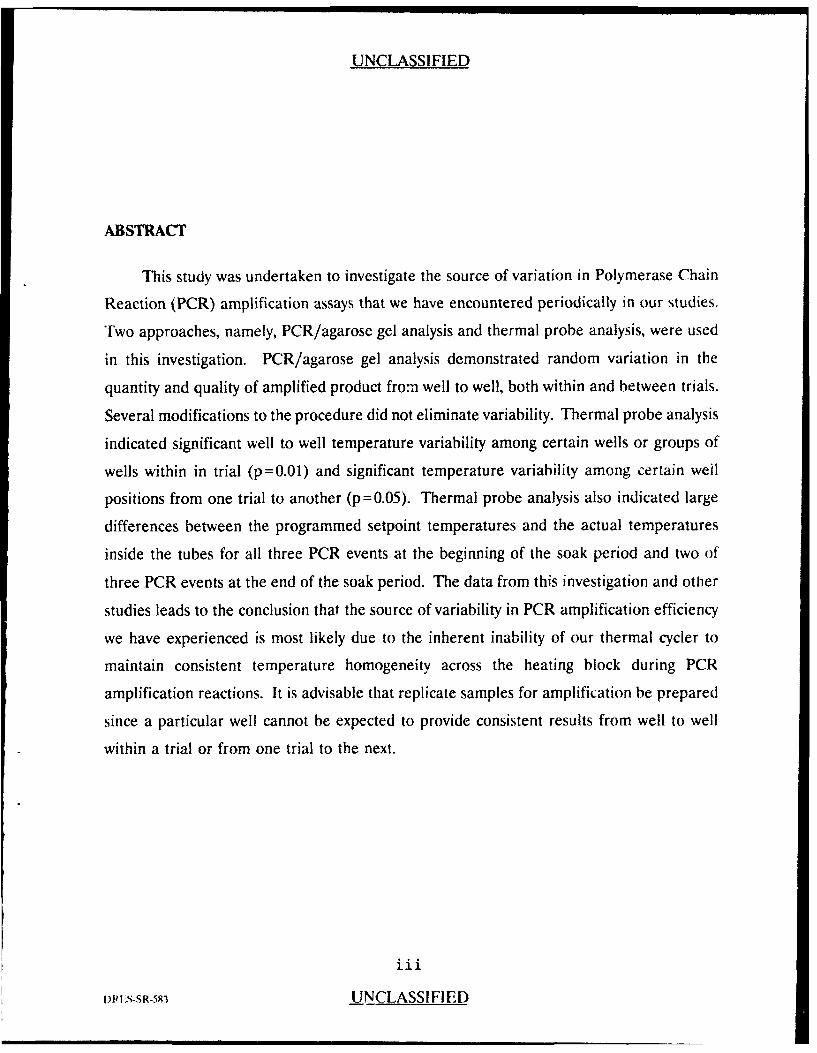
ABSTRACT
This study was undertaken to investigate the source of variation in Polymerase Chain
Reaction (PCR) amplification assays that we have encountered periodically in our studies.
Two approaches, namely, PCR/agarose gel analysis and thermal probe analysis, were used
in this investigation. PCR/agarose gel analysis demonstrated random variation in the
quantity and quality of amplified product from well to well, both within and between trials.
Several modifications to the procedure did not eliminate variability. Thermal probe analysis
indicated significant well to well temperature variability among certain wells or groups of
wells within in trial (p=0.01) and significant temperature variability among certain weil
positions from one trial to another (p=0.05). Thermal probe analysis also indicated large
differences between the programmed setpoint temperatures and the actual temperatures
inside the tubes for all three PCR events at the beginning of the soak period and two of
three PCR events at the end of the soak period. The data from this investigation and other
studies leads to the conclusion that the source of variability in PCR amplification efficiency
we have experienced is most likely due to the inherent inability of our thermal cycler to
maintain consistent temperature homogeneity across the heating block during PCR
amplification reactions. It is advisable that replicate samples for amplification be prepared
since a particular well cannot be expected to provide consistent results from well to well
within a trial or from one trial to the next.
iii
[WL.S-SR-583 UNCLASSIFIED

NON CLASSIRI
RIESUM~k
L~a pr~sente dtude a W entreprise pour ddterminer la source de la variabihiuý que
nous avons observ~e dans les essais d'amplification par la rdaction en chaine par la
polym~rase (PCR) au cours de nos travaux. Deux approches. la PCR/analyse sur gel
d'agarose et I'analyse par sonde thermique, ont 6t utilisdes au cours de Ia pr~sente dtude.
La PCR/analyse sur gel d'agarose a mis en 6vidence Line variation al~atoire de Ia quantit6
et de la qualit6 des produits amplifi~s, d'un puits A 1'autre, aussi bien dans un mn~me essal
qu'entre des essais differents. L'analyse par sonde thermique a indiqu6 une variabilit6
interpuits substantielle dans certains puits ou groupes. de puits dans un rn~rme essai
(p = 0,01) et une variabilit6 substantielle de la temperature entre certaines positions de
puits d'un essai A un autre (p = 0,05). L'analyse par sonde thermique a egalement indiquý
des diff~rences importantes entre les temperatures de, consigne programn&eS et les
temp~ratures r~e11es A I'int~rieur des tubes aui cours des trois &v6nements de PCR au debut
de la p~riode d'impr~gnation et au cours de deux des trois 6v~nements de PCR A la fin de
la pdriode d'impr~gnation. Les donn~es de cette 6tude et d'autres 6tudes nous amn~nent a
conclure que la variabilitd de 1'efficacitd de 1'amplification par PCR que nous avons
rencontr~e est fort probablement attribuahle A I'incapacit6 inhdrente de notre cycleur
thermique, de maintenir une temperature homnog~ne dans la totalit6 du bloc de chauffage
durarit les reactions en chaine par polymdrase. 11 est recommande de preparer des
6chanti11ons en double pour I'amplification 6tant donn6 que l'on peut s'attendre qu'un puits
particulier donne des r~sultats uniformes par rapport aux autres puits au cours d'un mn~me
essai ou d'un essai A un autre.
DRES-SR-583 NON CLASSIRI
UNCLASSIFIED
TABLE OF CONTENTS
ACKNOW LEDGEMEN'? ...................................... ii
A BSTRA CT ................................................ iii
TABLE OF CONTENTS ....................................... iv
INTRODUCTION .............................................. 1
MATERIALS AND METHODS .................................. 3
DNA Thermal Cycler ...................................... 3
PCR A m plification ...................................... 3
Horizontal Agarose Gel Analysis ............................. 4
Thermal Probe Analysis ................................. .. 5
R ESU LTS ................................................... 6
Method 1" PCR Amplification /Horizontal Agarose Gel Analysis .... 6
Experim ent 1 ...................................... 6
Experim ent 2 ...................................... 7
Experim ent 3 ...................................... 8
Experim ent 4 ............................... ....... 9
Method 2: Thermal Probe Analysis ........................... 9
D ISC USSIO N ............................................... 13
REFERENCES .............................................. 19
iv
UNCLASSIFIED DRS-sR-.S583
UNCLASSIFIED
INTRODUCTION
The Polyinerase Chain Reaction (PCR) is a technique which is used to
amplify specific nucleic acid sequences in vitro and is used in a wide number of
applications (for a review see [I1). The principle behind the PCR amplification
reaction involves the repeated cycling of three molecular events: (a) denaturation of
template and primer nucleic acid sequences into single stranded form; (b)
hybridization of the primer sequences to the template; (c) extension of the primer
sequence by a heat stable DNA polymerase enzyme which incorporates the
appropriate complementary nucleotide onto the 3'end of the primer sequence. These
three molecular events are carried out under very controlled conditions of time and
temperature which are dependent upon several factors such as nature and purity of
the template, nature of the PCR primers, Mg+2 concentration, etc. Typically, the
denaturation step is carried out at 94°C for I ruin; followed by the hybridization step
at 37°C for 2 min; followed by the extension step at 72°C for 3 min. One cycle
includes each of these three events and each cycle is repeated 20-40 times. Time,
temperature and number of cycles, are usually determinec empirically to find the
optimum values for a given PCR reaction. PCR can be carried out using two
temperatures rather than three if the hybridization and extension steps can be
effectively performed at temperatures near the extension temperature. The success
of the PCR reaction is, to a large extent, dependent upon the ability to provide
precise and accurate control of time and temperature for each of these molecular
events. Various commercial suppliers have developed DNA thermal cyclers which
are designed specifically to control time and temperature parameters for PCR in an
automated fashion.
DRES-SR-583 UNCLASSIFIED
2 UNCLASSIFIED
We have used PCR in our research to amplify specific regions of target
nucleic acid sequences for use in gene probe hybridization assays and gene cloning
experiments. When performing PCR amplifications, we have noticed, at times,
variations in the amount of amplified product from well to well or from one trial to
another. It has been stated that a variation of a factor of 3-5 is normal in PCR and
can be predicted theoretically [2]. However, we have experienced variations of up
to 20 fold or greater and we have also encountered amplification failures for samples
that had, at other times, generated strong positive signals. Weak amplification signals
are not of a major concern for those analyses in which a qualitative result is required,
for example, when screening clones for the presence of a cloned insert or in cases
where large amounts of amplified product are not required for subsequent analysis
or manipulation, for example, sequencing or cloning. However, it is more of a
concern when la.;ge quantities of material are required for subsequent analyses, for
example, when preparing large amounts of material for use as nucleic acid probes.
Amplification failures pose more of a concern than weak amplifications, both
qualitatively and quantitatively, since they can lead to false conclusions. Because
PCR is becoming more widely used in our research, it would be advantageous to
understand the cause of this variation especially for those cases in which
amplification failures occur. Consequently, this study was initiated to investigate the
source of variability in our PCR amplifications. Two approaches were used in this
study. The first approach involved carrying out PCR on identical samples (prepared
from a master PCR reaction mixture) placed in reaction tubes in all 48 well positions
of the thermal cycler heating block and analyzing the results by horizontal agarose
gel analysis. The second approach involved using a thermal probe to measure the
temperature inside the reaction tube for eight randomly selected well positions.
UNCLASSIFIED DRFS SR-X3
UNCLASSIFIED 3
MATERIALS AND METHODS
DNA Thermal Cycler
The DNA thermal cycler used in this study was a Perkin-Elmer Cetus DNA
thermal cycler (serial no. P3440). The block sample capacity for this model is 48 x
0.5 mL microcentrifuge tubes. According to the manufacturer's specifications, the
temperature accuracy (measured directly in the wells) is +/- 3°C in the range of 4-
32°C and +/-1°C in the range of 33-100'C.
PCR Amplification
A master mix of PCR reaction components was made using components from
the Perkin Elmer Cetus GeneampTM DNA Amplification Reagent Kit. It consisted
of the following components in the order listed: 588.5 jL sterile 3x distilled water,
110 pL of lOx reaction buffer (100 mM Tris-HCI; 500 mM KCI; 15 mM MgCl2; 0. 1 %
(w/v) gelatin), 176 IL of lOx dATP:dCTP:dGTP:dTTP mix (1.25 mM each), 55 JAL
of control primer 1 (20 pzM), 55 ML of control primer 2 (20 MM), 5.5 JL of
AmplitaqTM and 110 ML of lambda phage DNA template (0.1 ng/IL). Twenty •L of
the master mix were aliquotted carefully into forty eight 0.5 mL microfuge tubes.
Two types of tubes were used in this investigation: (1) GeneAmp"M reaction tubes
(Perkin-Elmer Cetus, catalog no. N801-0180); (2) siliconized Diamed tubes (Diamed,
catalog no. PRE05OS-N). All microfuge tubes were sterilized by autoclaving for 20
min (15 psi, 2400C) prior to use. Two drops of light white mineral oil (Sigma,
d=0.84 g/mL) were layered onto the reaction mixture in each tube to prevent
evaporation/refluxing. The 48 replic. samples were placed into the thermal cycler
DRES-SR•593 UNCLASSIFIED

4 UNCLASSIFIED
(pre-warmed for minimum of 0.5h) and the following temperature cycling profile was
used: 94°C for 1 min; 37C(2 for 2 min; 72'C for 3 min. This cycle was repeated for a
total of 30 cycles, followed by 72°C incubation for 7 min to allow for the extension
of incomplete strands. All other modifications to this procedure are described in the
results section. Two 1.L of l0x stop buffer (0. 1 % bromphenol blue; 1 % SDS; 0. 1 M
EDTA (pH 8.0); 50% glycerol) were added to each sample, mixed by vortexing and
then centrifuged briefly (30 sec) in an Eppendorf microfuge at 14,000g. The samples
were stored in -20°C freezer until analyzed by horizontal agarose gel electrophoresis
at which time all samples were thawed, mixed by vortexing and centrifuged for 30 sec
at 14,000g. The PCR primers used in this study are designed to amplify a nucleic
acid sequence region of 500 base pairs (bp).
Horizontal Agarose Gel Analysis
PCR samples were analyzed on 1 % agarose gels (BRL). Two double comb
gels (28 sample wells per gel) were prepared by melting 0.75 g of agarose in 75 mL
of Ix TAE buffer (40 mM Tris pH 8.2; 20 mM sodium acetate; 1 mM EDTA (pH
8.0)). The molten agarose was cooled to 65°C LAid then 4 jiL of ethidium bromide
(10 mg/mL) was added to give a final concentration of 0.5 /g/mL. Two 14-well gel
combs were placed in a 14 x 10 cm gel boat (one above the other). The molten
agarose was poured into the gel boat and allowed to harden for approximately I
hour. The gel was placed in a horizontal electrophoresis tray and submerged under
lx TAE buffer, Ten AL of each sample (bottom layer) were drawn through the
upper oil layer using a Gilson pipettmenTM and then loaded into the well. Ten juL
of 0.1 jg/#L Hindill digested lambda phage molecular weight standards were loadd
into the outermost wells. The gel was run at 50 V for 1.5 to 3 hours. The DNA was
UNCLASSIFIED DRF.S-SR-593
UNCLASSIFIED 5
visualized by exposure to UV light and a photograph of the gel was taken using
Polaroid Type 57 film (f-stop=F8, exposure=0.5 sec, camera height=56 cm).
Thermal Probe Analysis
One hundred psL of H20 weie placed into each of 48 Diamed microfuge tubes
and then overlaid with two drops of light mineral oil (Sigma, density= 0.84g/mL).
Prior to placing the tubes into the wells, the thermal cycler was pre-warmed for a
minimum of 0.5h, followed by running the auto-tune diagnostic program (diagnostic
program #6) according to the manufacturer's instructions. One drop of heavy
mineral oil (Sigma, density = 0.88g/mL) was placed in each well to enhance thermal
conductivity between the well and the tube and then each tube was plarc1r1 into one
of 48 wells. The temperature inside the reaction tube was measured by inserting a
temperature probe (Omega Engineering Inc., model 412B-T) through a hole in the
top of the microfuge tube cap. Thermal probe analysis was performed on eight of
forty-eight well positions on the thermal cycler block. These positions were selected
at random and inclided well positions A3, A5, B6, B8, C8, Dl, D2 and E8 (Figure
1). The temperature profile used in this experiment included the following cycle:94°C for 1 min; 37'C for 1 min; 72°C for 1 min. Temperature readings were taken
at 15 sec intervals during the I min soak period, beginning at the time in which the
thermal cycler sensors indicated that the heating block had reached the setpoint
temperature (time = 0 sec). Six cycles were measured for each of the 8 well
positions which constituted one trial. Two trials were carried out on two separate
days.
DRUs-SR--53 UNCLASSIFIED
6 UNCLASSIFIED
RESULTS
Method 1: PCR Amplification /Horizontal Agaruse Gel Analysis
Experiment 1
The PCR reaction was carried out on identical samples placed in all 48 well
positions of the thermal cycler heating block according to the procedure outlined in
"Methods and Materials". Briefly, twenty 4L of a master mix of PCR reaction
components were aliquotted carefully into forty eight 0.5 mL siliconized Diamed
microfuge tubes. The 48 replicate tubes were placed into all wells of the thermal
cycler (pre-warmed for 0.5h). A temperat ire cycling profile of 940 C (1 min): 37°C
(2 min); 72°C (3 min) for 30 cycles, followed by 72°C incubation for 7 min, was
performed and the samples were then analyzed by horizontal agarose gel
electrophoresis.
The results of the horizontal agarose gel analysis from this experiment are
presented in Figures 2a and 2b. There was noticeable variation in the quantity of the
500 bp product among the 48 samples as evidenced by differences in band intensities.
Well position C8 generated a very weak product band equivalent to about 50 ng of
DNA (determined by comparison to the intensity of the 2322 mwt band of the X-
Hind III markers which is equivalent to about 50 ng) while several other well
positions (DI, D3, D4, D6, D8, E3, ES, E7, E8, F4, FS, and F8) generated strong
bands equivalent to about 1000 ng or more. This variation represented at least a 20
fold difference. There were two well positions which did not generate any visible 500
bp product (C6 and C7) and were considered to be amplificatior failures. Diffuse
UNCLASSIFIED ORNS SR .S83
UNCLASSIFIED 7
banding below the 500 bp product band was evident in many of' the samples which
also varied in intensity. This diffuse banding was most likely due to the formation
of primer-oligomers which are formed as a consequence of the two PCR primers
having GGI/CC overlapping 3' ends.
In order to ensure that the cycler was working properly prior to running
further PCR amplifications, pre-programmed diagnostic programs were performed
according to the instruction manual. These diagnostic programs included the heater
test, the chiller test, the sensor test and the auto-tune initialize test. All diagnostic
tests were found to be within the manufacturer's limits and therefore found to be
acceptable. The auto-tune initialize test is of particular importance. According to
the manufacturer, this test shouil be performed whenever poor temperature control
is noticed. Consequently, this experimeitt was repeated following execution of the
auto-tune program (Experiment 2).
Experiment 2
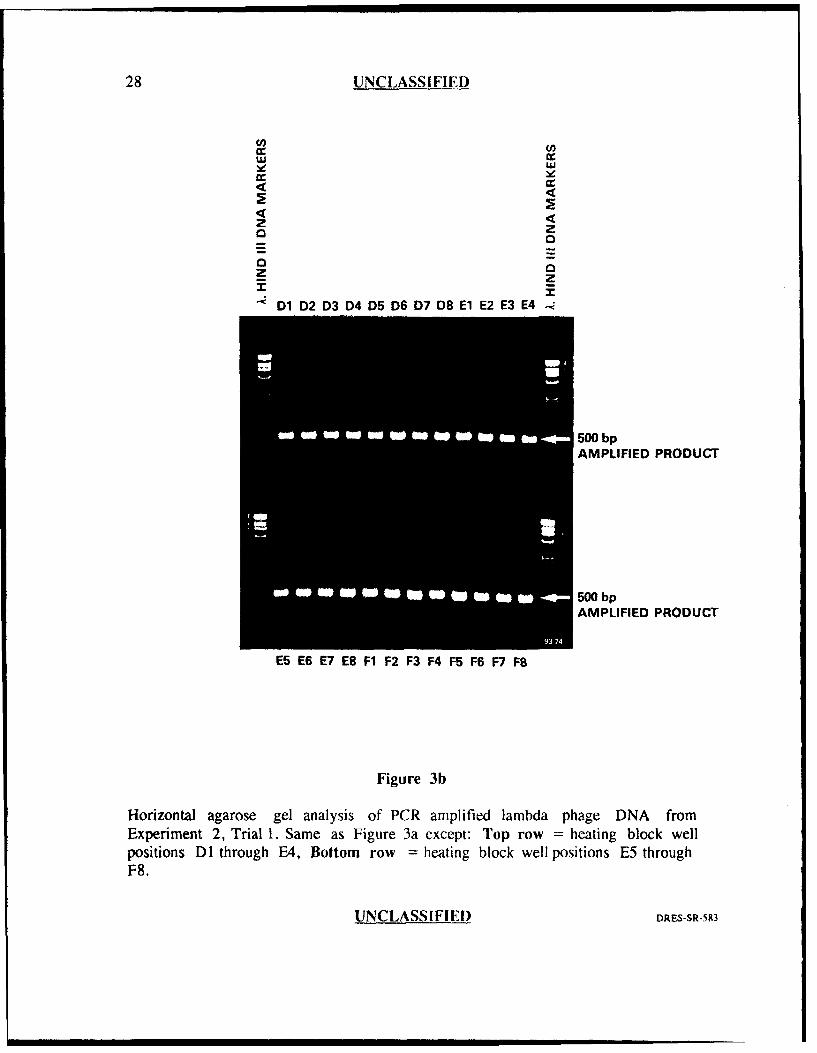
Figures 3a and 3b show the results from the first trial. Forty seven of forty
eight wells (98%) generated very intense 500 bp product bands of nearly equal
intensity with one well position (B2) generating slightly less. There were also no
amplification failures for this trial. These results indicated very good reproducibility
among the 48 wells which suggested that executing the auto-tune program prior to
amplification, reduced well to well variability. However, when this experiment was
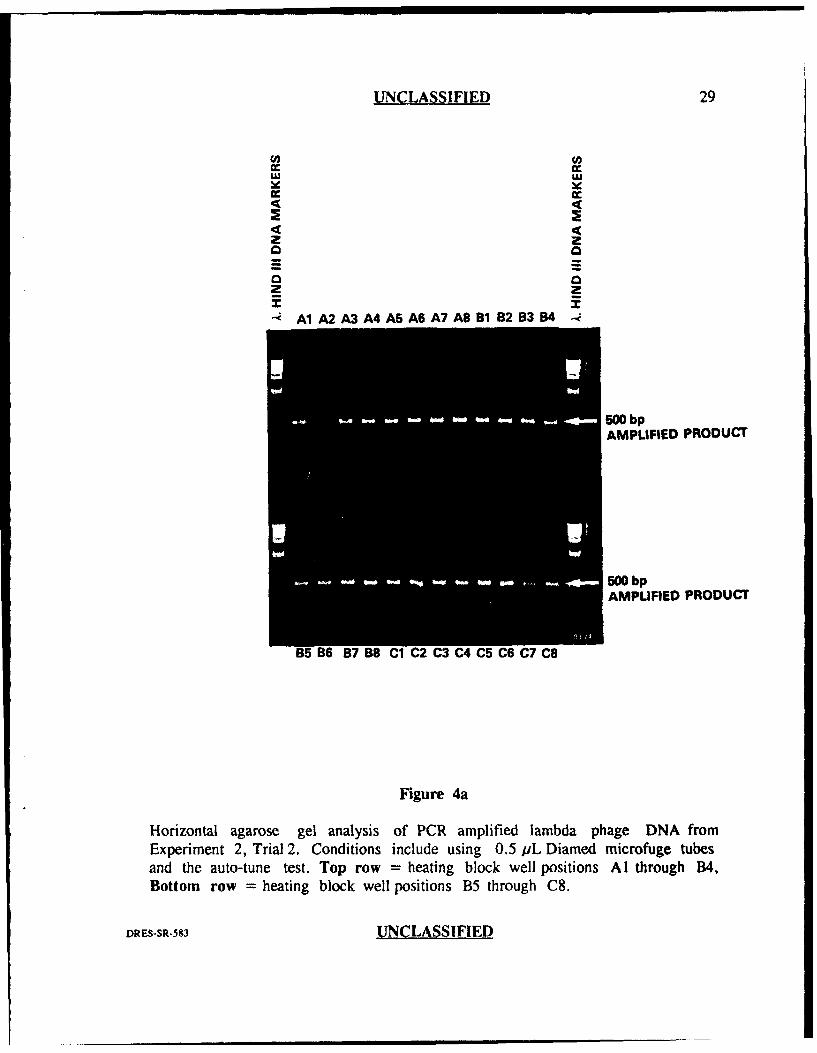
repeated (i-igures 4a and 4b), obvious variation in amplification efficiency was again
evident as judged by variation in intensity of the bands and by the absence of
amplified product in two of the wells (D3 and F7).
DRE-SR-S93 UNCLASSIFIED
8 UNCLASSIFIED
This data suggested that the well to well variability problem still existed and
was not solved completely by running the auto-tune program. In addition, this data
indicated trial to trial variation since trial I gave very little variation while trial 2
gave considerably more variation. A comparison of the results from experiment I
and experiment 2 suggested that the variation was random in that a particular well
which showed poor amplification or complete failure in Experiment I often showed
good amplification in Experiment 2 and vice versa. For example, the two
amplification failures seen in experiment I were generated in wells C6 and C7, while
those in experiment 2 (trial 2) were generated in wells D3 and F7.
Consultation with the manufacturer resulted in two additional modifications
to the procedure that were implemented in Experiment 3: (1) application of heavy
oil inside the wells to enhance thermal conductivity between the well and the
microfuge tube; (2) pre-heating the heating block to the initial denaturation
temperature (940C) prior to starting PCR to help reduce primer-oligomer
amplification.
Exveri.ment 3
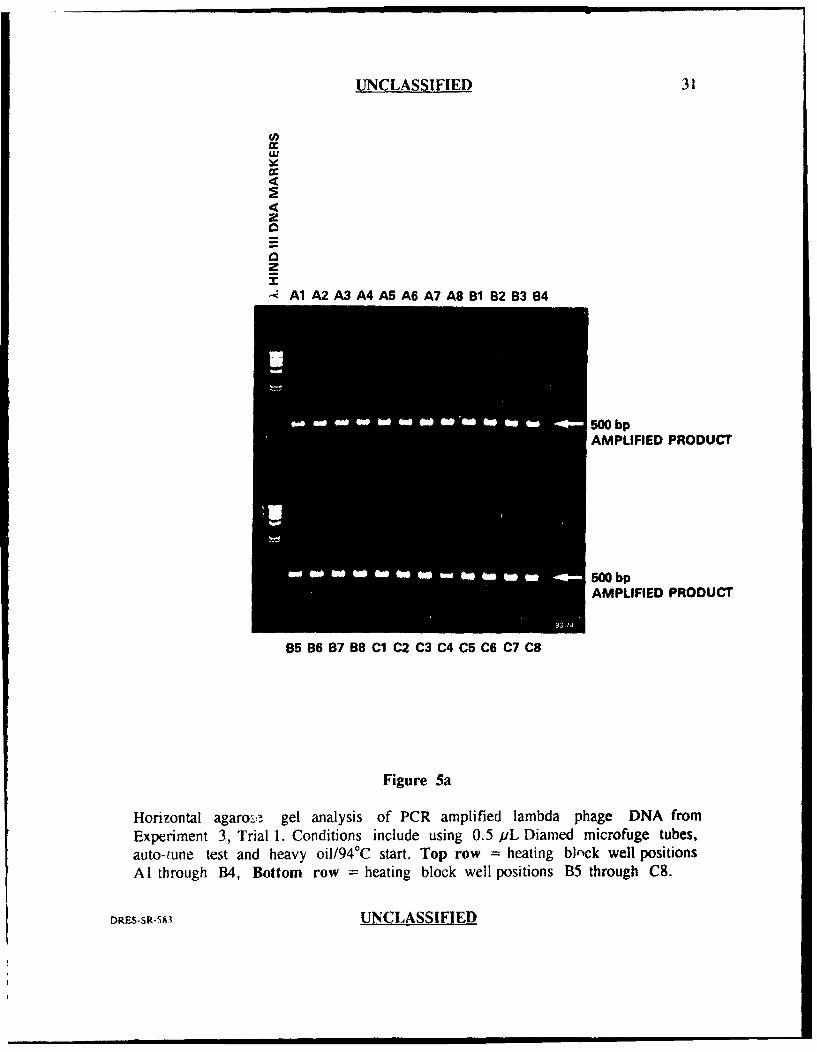
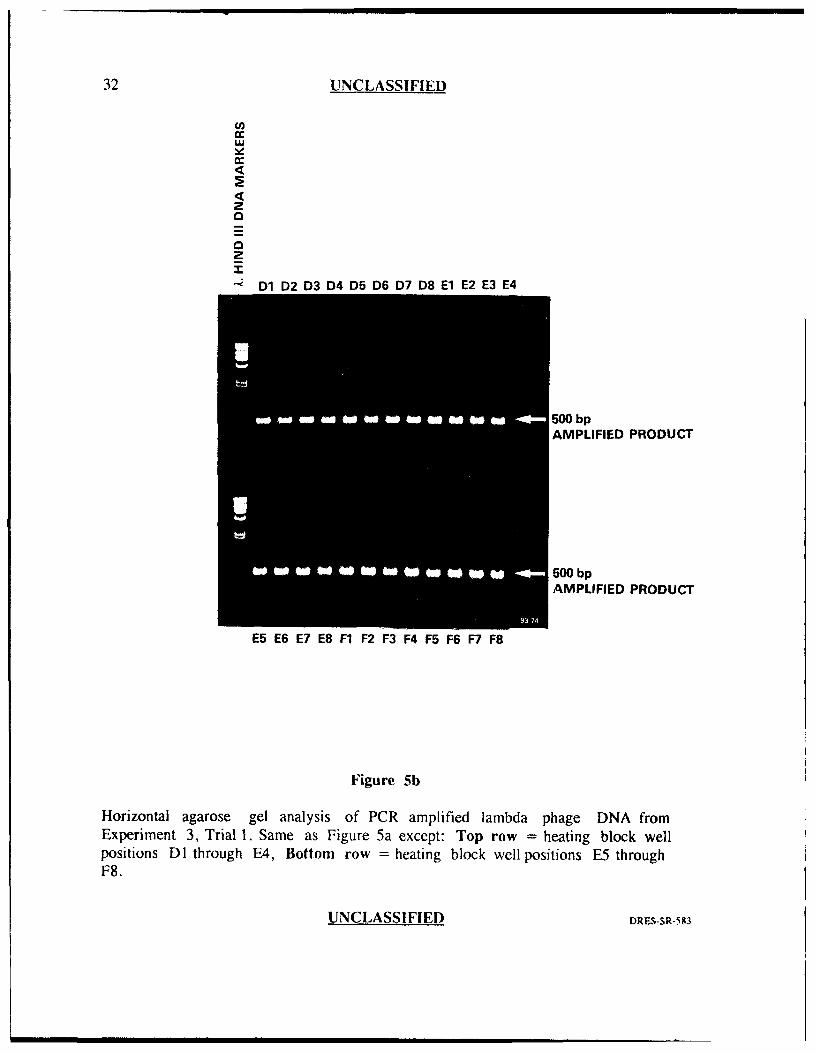
The results from this experiment (Figures 5a and 5b) are similar to
experiment 2, trial I in which 47 of 48 well positions (98%) generated similar, strong
band intensities with one well position generating slightly less (well position A4).
Again, there were no amplification failures and there was also a reduction in the
amount of primer-oligomer product. This experiment suggested that the addition of
the heavy oil in the wells, together with the pre-warming step (94'C) and auto-tuning
prior to running PCR, may have helped to reduce well to well var'ability. When this
UNCLASSIFIED DRES SR-SX3

UNCLASSIFIED 9
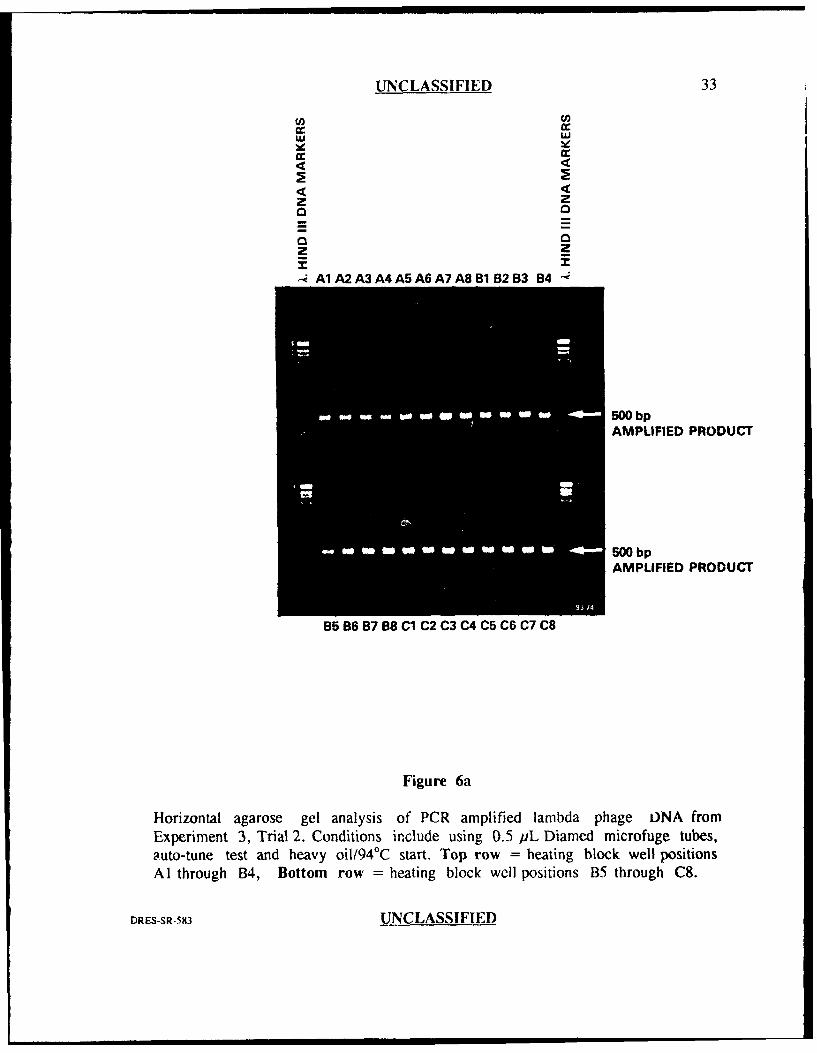
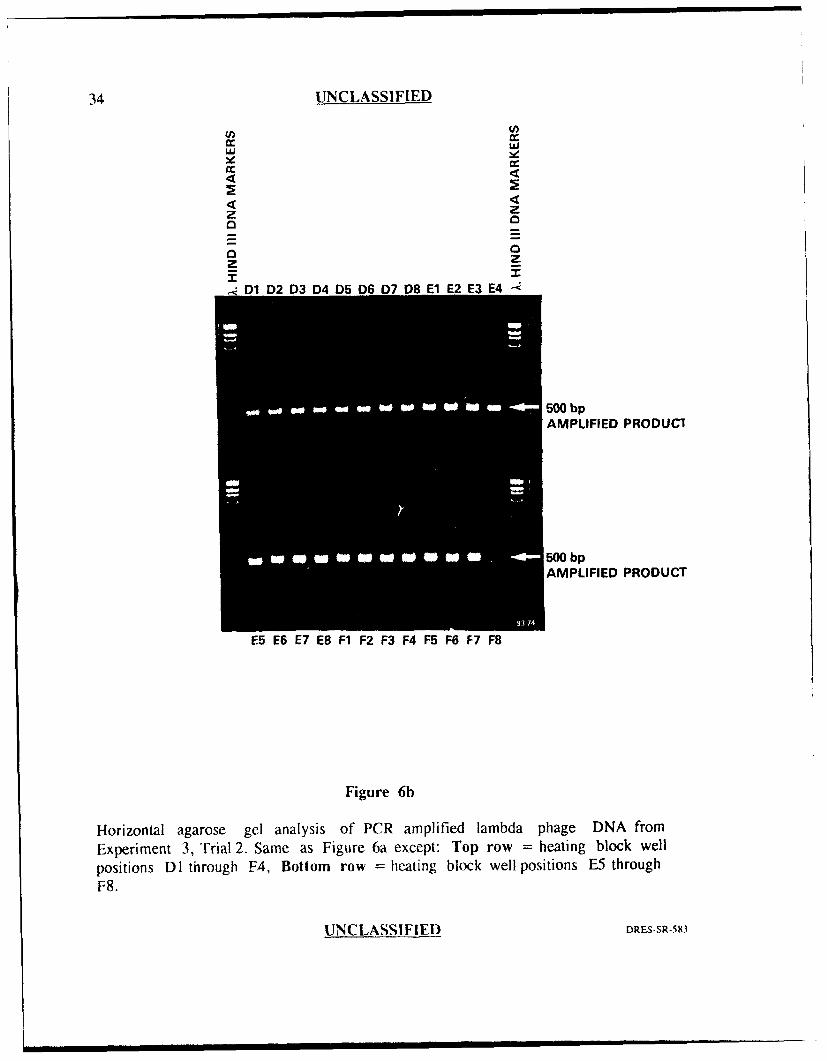
experiment was repeated (Figures 6a and 6h), the band intensities for most of the
wells were similar indicating good reproducibility, however, the product band in well
position F8 was completely missing. Well position F8 had not generated an
amplification failure prior to this experiment (ie. previous amplification failures were
seen in well positions C6, C7, D3 and F7) supporting the obserdtion that the cause
of this variation seems to be random.
Experiment 4
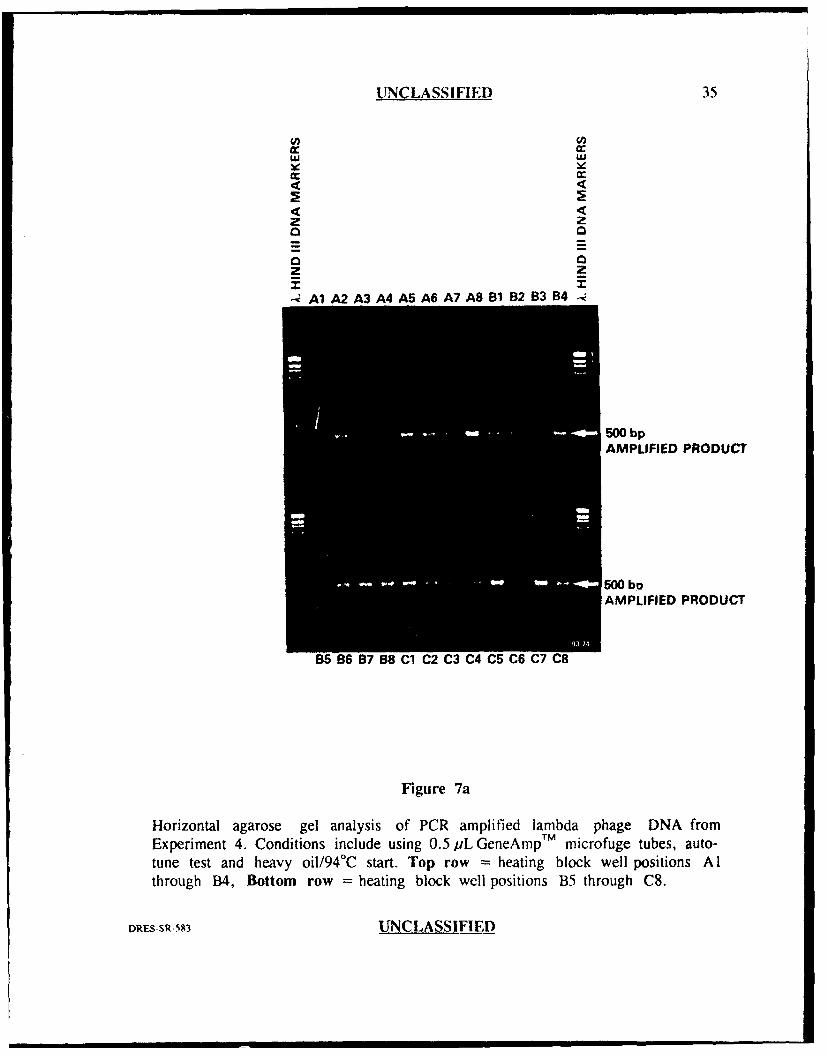
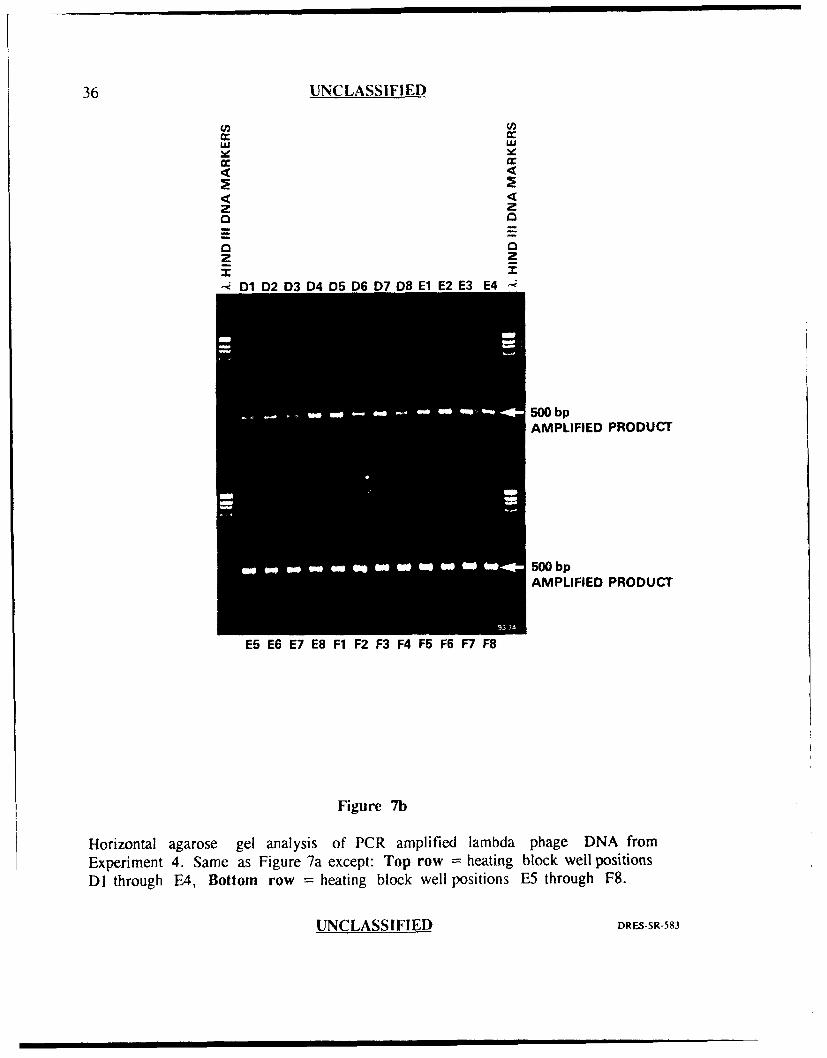
Experiment 4 was performed in identical fashion to experiment 3 except that
microfuge tubes specifically desi-'ned for the Perkin-Elmer Cetus thermal cycler
(GeneAmpTM) were used in place of the Diamed tubes. In addition to being made
by different manufacturers, these two tubes differed in that the Diamed tubes were
siliconized while the GeneAmpTM tubes were not. The results of this experiment can
be seen in Figures 7a and 7b. Again, there was obvious well to well variability with
some well positions generating very intense bands (approx 1000 ng in each of well
positions E4 through F8) versus well positions which generated weak bands (approx.
50 ng or less for well positions A l, B7 and C6) representing approximately a 20 fold
difference in the amount of amplified product. These results suggested that the
GeneAmpT ' tubes did not resolve the variability problem experienced in previous
experiments in which Diamed tubes were used.
Method 2: Thermal Probe Analysis
The thermal probe test was used to measure the performance of the thermal
cycler by monitoring the actual temperature inside the reaction tube for eight
DRES-SR.-53 UNCLASSIFIED
10 UNCLASSIFIED
randomly selected well positions (Figure 1). The thermal cycler diagnostic tests
(heater test, chiller test, sensor test and auto-tune initialize test) were performed
prior to PCR and found to be within the manufacturer's suggested limits.
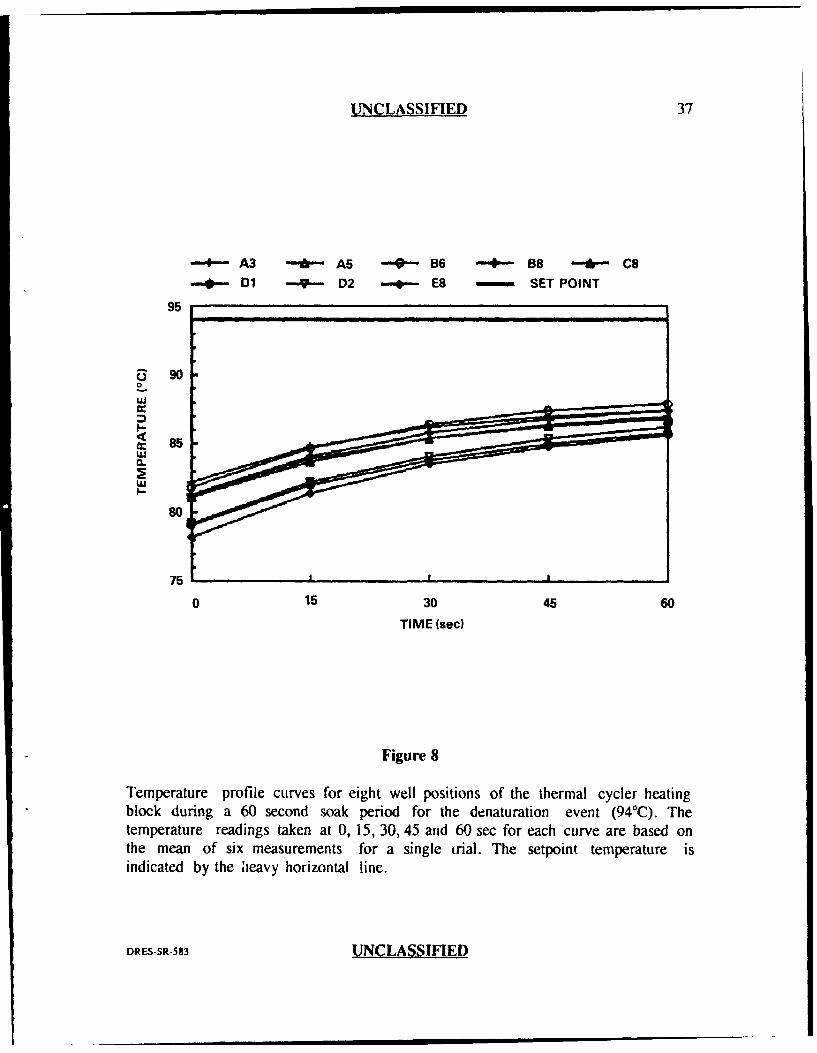
The results obtained from the thermal probe analysis are plotted in Figures
8, 9 and 10 for the three PCR events (denaturation, hybridization and extension,
respectively). These figures demonstrate three important features. First, the general
shape of the curves for all well positions in all three PCR events was asymptotic.
This indicated that the temperature inside the tube at the beginning of the soak
period was not the same as that measured at the end of the soak period. In most
cases, the curves levelled off by the erd of the 60 second soak period indicating that
they had reached their final equilibrium temperatures. Second, the curves for all
three PCR events indicated greateT divergence at the beginning of the soak period
than at the end. Third, there was an obvious difference between the setpoint
temperature (the temperature programmed into the thermal cycler for each of the
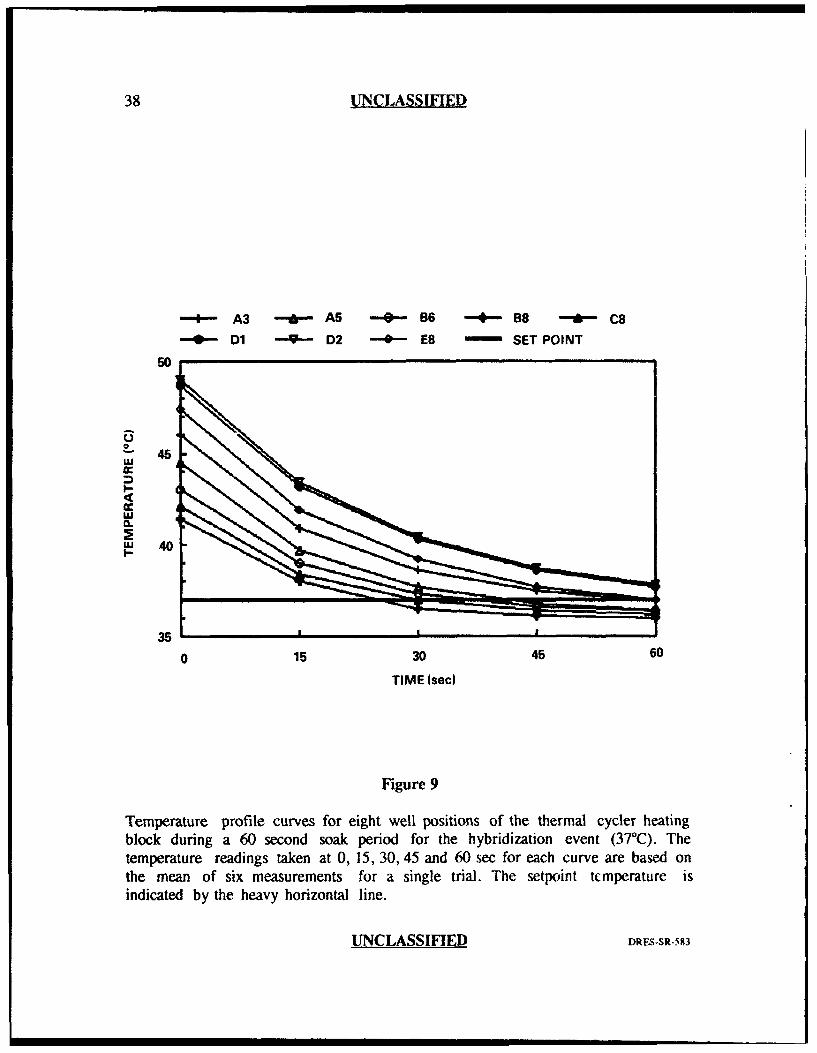
three PCR events) and the measured or actual temperature. For the hybridization
event (Figure 9), some well positions reached the setpoint temperature of 37°C
before the end of the 60 sec and actually fell below 37TC by the end of the 60 sec
soak period, while other wells never reached 37TC even after 60 sec. For the
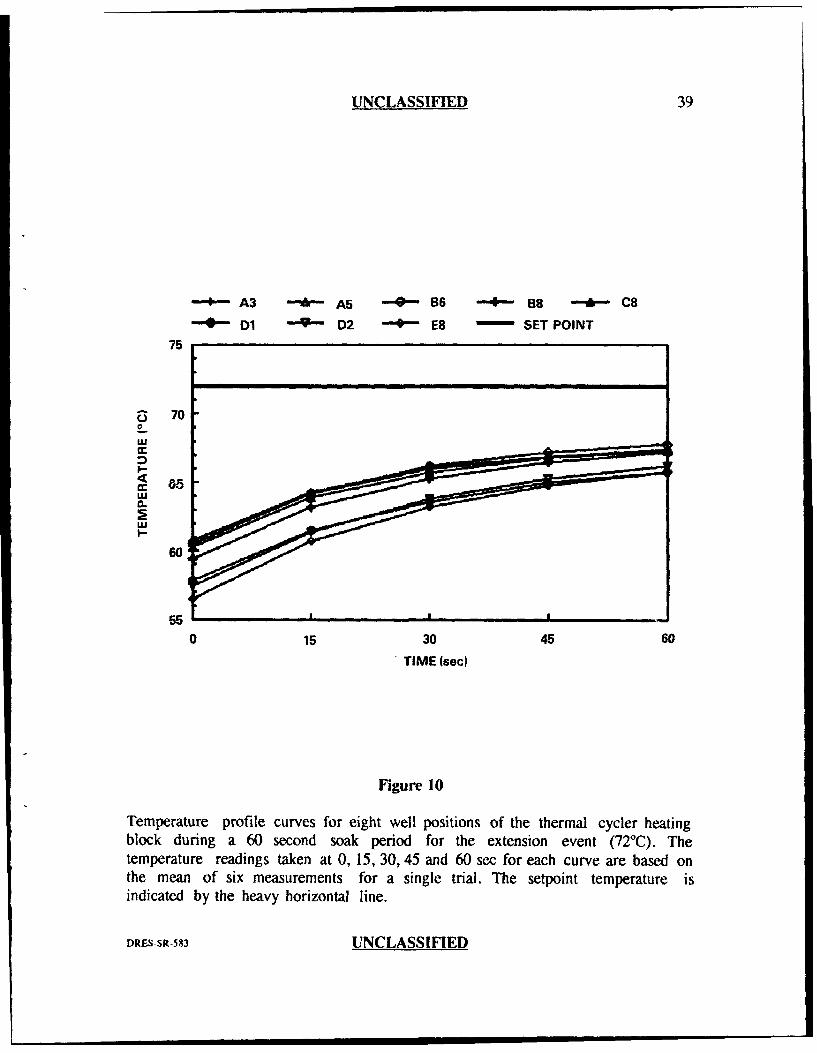
extension and denaturation steps, none of the well positions reached their respective
setpoint temperatures even after 60 seconds (Figures 8 and 10).
An analysis of variance (Student-Newman-Keuls Multiple Comparison test)
was performed on the data for each of the eight well positions at both the beginning
and end of the soak period for all three PCR events. Table I summarizes the zesults
of this analysis with respect to those well pjsitions or groups of wells which showed
UNCLASSIFIED DRES-SR-583

UNCLASSIFIED 11
significant differences at a 99% significance level (p=0.01). The analysis results
indicated that for the denaturation event, there were 3 groups of wells which were
significantly different from each other at the beginning of the soak period and 5
groups that were significantly different at the end of the soak period. The results for
the hybridization event indicated that all 8 well positions were significantly different
at the beginning of the soak period but only 6 out of 8 were significantly different at
the end. Finally, the results for the extension event indicated 4 significantly different
groups of wells at the beginning of the soak period and 3 at the end. There does
appear to be a trend among this data in that well positions E8, DI and D2 were
found to exhibit mean temperatures further from the other wells (with respect to the
setpoint temperature) for all three PCR events. Table II includes the mean
temperatures for the wells or groups of wells that were determined to be significantly
different in Table I. The temperature range (the mean temperature difference
between those wells which generated the highest and the lowest mean temperatures)
was found to be greater at the beginning of the soak period (3.4°C-denaturation;
7.60 C-hybridization; 4. 1C-extension) than at the end of the soak period (2.2(C-
denaturation; 1.8°C-hybridization; 1.6°C-extension) for all three PCR events.
As mentioned previously, thermal probe analysis indicated that there was a
difference between the setpoint temperature (the temperature programmed into the
thermal cycler for one of the three PCR events) and the measured or actual
temperature measured. Table III summarizes the lowest and highest temperature
differences among those well positions or groups of wells which were shown to be
significantly different (p=0.01). Again, for all three PCR events, the temperature
variation was found to be greater at the beginning of the soak period (12-16°C-
denaturation; 4.0-12.0°C-hybridization; 1 .0-- 15.0O"C-extension) than at the end of the
DRES-SR-S83 UNCLASSIFIED
12 UNCLASSIFIED
soak period (6-80C-denaturation; +/-I. 0C-hybridization; 5-6"C-extension) for all
three PCR events.
The extent of temperature variation for a particular well position from one
trial to another was examined by performing statistical analysis on each well position
with data from two trials. The results of this analysis are presented in Table IV.
Most of the well positions showed a significant temperature difference (AT) between
the two trials based on a 95% level of significance (p=0.05). The average
temperature difference, among those wells which showed a significant difference, was
greater at the beginning of the soak period than at the end for all three PCR steps,
with the extension event showing the greatest temperature range. Well positions
which exhibited AT values greater than the average included well E8 for the
denaturation event; wells DI, D2, and E8 for the hybridization event; and wells C8,
D2 and E8 for the extension event.
According to the manufacturer, poor temperature control can be a result of
low or high line voltage problems. Performing the auto-tune program can help
alleviate this problem but this was shown to be ineffective since the auto-tune
program was performed prior to thermal probe analysis for all PCR runs and
variability was still evident. Subsequently, a line noise suppressing ultra-isolator
(Webster Instruments Ltd.) was connected to the thermal cycler and thermal probe
analysis was performed using the same procedure as previously described to
determine if the variability problem could be reduced. The results from this analysis
(data not shown) indicated that temperature variability was worse than that obtained
without the ultra-isolator.
UNCLASSIFIED DRES.SR-583
UNCLASSIFIED 13
DISCUSSION
PCR/horizontal agarose gel analysis gave a quantitative and qualitative
indication of the PCR amplification efficiency for all 48 well positions of the heating
block. The results indicated that there was variation in the amount of amplified
product from well to well within a single trial and that the degree of variation ranged
from miniimal to large (20 fold differences), including some amplification failures.
Trial to trial variation was evident from comparisons of band intensities from one
trial to another, especially for those well positions which generated amplification
failures. That is, wells which generated strong, intense bands in one trial, generated
weaker bands or no bands in a repeated trial. The variation among the 48 well
positions appeared to be random in that wells which generated strong signals in one
experiment generated weak or no signals in others and vice versa. Large well to well
variation and/or amplification failures that we observed in this analysis could not be
attributed to differences in reaction component concentrations (or missing
components in the case of amplification failures) from one reaction tube to another
since all 48 tubes contained an aliquot from a master mixture. In addition, although
possible, it is highly unlikely that large well to well variations and/or amplification
failures could have arisen from pipetting errors when loading electrophoresis gels
since the variation in many cases was so large that one would have had to make a
95% error in order to generate these differences (50 ng in one well and up to at least
I jig in another represents about a 95% error). Therefore, variability must have
arisen from other factors such as: (a) variation in thermal transfer between the
heating block and the reaction tube due to variation in reaction mixture volumes or
variation in reaction tube thickness, and/or (b) the inability of the thermal cycler to
provide temperature homogeneity for every well position across the heating block.
DRES-SR-583 UNCLASSIFIED
14 UNCLASSIFIED
If pipetting inaccuracies or variations in reaction tube thickness were responsible for
large variations and/or amplification failures, one would expect this source of error
to be random and thus one would expect to find a similar degree of variation among
all six experimental trials. Our data does not reflect this hypothesis since half of the
experiments showed very good reproducibility among the 48 wells while the other
half showed obvious well to well variability. Therefore, it is more likely that large
variations in amplification efficiency were a result of thermal cycler itself. A study
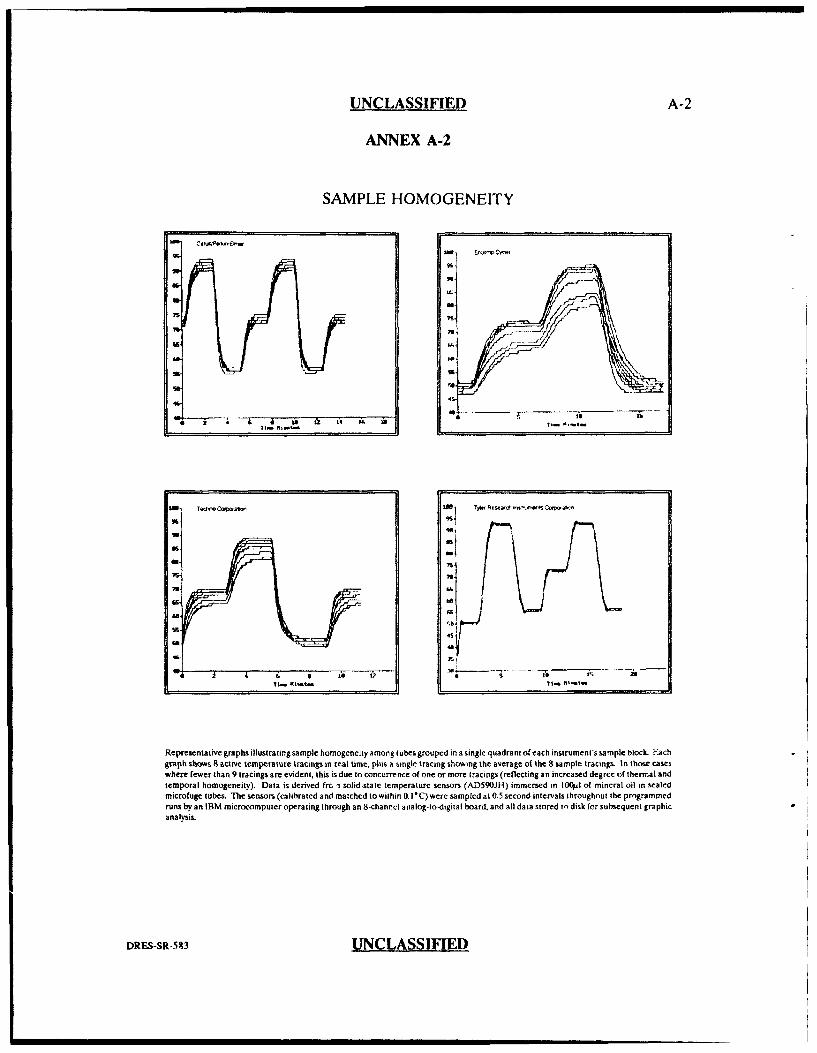
by the University of Alberta [annex A-1,2] supports the argument that well to well
variability is more likely a consequence of the inability of the thermal cycler to
maintain temperature homogeneity from one well position to another than due to
differences in reaction tubes or reaction volumes. They measured the temperature
profile of 8 well positions simultaneously using eight solid-state temperature sensors
(calibrated and matched to within 0. V°C) that were placed inside sealed individual
0.5 mL microfuge tubes containing 100 iL of mineral oil. The sensors measured the
temperature at 0.5 second intervals for a program based on 92°C soak for 2 min, a
rapid ramp to 55°C soak for 2 min and a rapid ramp to 72°C for a two min soak
followed by a repeat of this cycle. This same analysis was performed on a three
other thermal cyclers (Techne, Ericomp and Tyler Research Instruments). A
comparison of the graphical results [Annex A-2] between the Tyler Research thermal
cycler and the Perkin-Elmer Cetus cycler shows that the Perkin Elmer cycler
exhibited greater well to well temperature variation among the 8 well positions
tested. This same observation was evident for all well positions tested on the heating
block (data not shown). If the temperature variability was a function of differences
in reaction tube thickness or reaction mixture volume only, one might expect the
Tyler Instrument cycler to exhibit temperature variation to the same extent as othet
cyclers. Since this is not the case, this study supports the idea that well to well
UNCLASSIFIED DRES-SR-583

UNCLASSIFIED 15
temperature variability may be more of a function of the thermal cycler itself rather
than due to differences in reaction tube thickness or reaction volumes.4I
The results obtained from the thermal probe analysis in our study revealed4Ithat there were significant differences (p=0.01) among certain well positions or
among groups of wells within a trial depending upon the PCR event and the time
point during the soak period. Well to well temperature variation on average was
found to be greater at the beginning of the soak cycle than at the end and was found
to be outside the manufacturer's advertised range of 2°C for all three PCR setpoint
temperatures (3.4°C-denaturation; 7.6°C-hybridization; 4. lC-extension). Well to well
temperature values at the end of the soak pxeriod were closer to o. within this range
(2.2°C-denaturation; 1.80C-hybridization; 1.6°C-extension). Whether or not the
magnitude of these temperature differences are large enough to generate quantitative
differences in the amount of amplified product is not known for certainty. However,
it is conceivable that well positions which experience extreme temperature
differences from others might generate quantitative and qualitative differences. For
example, the data presented either in graphical form (Figures 8-10) or tabular form
(Tables I, II and Il), seem to indicate two populations of wells common to all three
PCR events, namely, population A which includes well furthest from the setpoint
temperature (Dl, D2 and E8) and population B, which includes wells closer to the
setpoint temperature (A3, A5, B6, B8 and C8). During the denaturation event, wells
in population A experienced lower denaturation temperatures than those in
population B which could be enough to generate reduced quantities of amplified
products since incomplete denaturation of the target template DNA and/or the PCR
product allows the DNA strands to re-anneal ("snapback") thereby reducing product
yield or even generating amplification failures [3). For the hybridization event, the
DRES-SR-583 UNCLASSIFIED
16 UNCLASSIFIED
wells in population A did not reach the 37'C setpoint temperature before the end of
the 60 second soak period, while most of the wells in the other population reached
this temperature 20-40 sec into the soak period. Since higher annealing temperatures
help to increase specificity [3], the wells in the first population may generate more
specific product than those in population B. Finally, for the extension step, those
wells in population A were further from the 72'C setpoint temperature than those
wells in population B. This difference may be enough to generate unextended
product molecules. In this study, an additional 7 minute extension step was included
to promote completion of deficient product molecules.
Thermal probe analysis also indicated that there were statistically significant
temperature differences (p=0.05) for certain well positions from one trial to another.
Again these differences were greater at the beginning of the cycle (1.3°C-
denaturation; 1.30C-hybridization; and 2.0°C-extension) than at the end (0.70 C-
denaturation; 0.2°C-hybridization; and 0.90C-extension). Certain well positions
seemed to generate larger temperature differences than others especially at the
beginning of the soak period for different PCR events. Those well positions which
were found to be above the mean AT at the beginning of the soak period included
well E8 for the denaturation event; wells DI, D2, and E8 for the hybridization event;
and wells C8, D2 and E8 for the extension event. It is interesting to note that wells
D1, D2 and E8 were also found to generate the greatest well to well temperature
variability in this study.
Thermal probe analysis showed that the actual equilibrium temperatures
measured within the reaction tubes are on average 6-8°C and 4-6"C lower than the
setpoint temperatures for the denaturation step (94°C) and extension step (72'C),
UNCLASSIFIED DRES-SR-593
UNCLASSIFIED 17
respectively. The equilibrium temperatures for the hybridization step were
considerably closer to the setpoint temperature (+/-I°C). Overall amplification
efficiency may be increased by raising the sct temperatures for the denaturation and
extension steps to accommodate these differences. In addition, increasing the holding
time period to ensure that the final temperatures are maintained for the intended
soak period, may increase the quality and quantity of amplified products.
This study was not designed to correlate temperature variability with
amplification efficiency directly since these two parameters were investigated
separately. However, the results from this study, along with other studies [annex A-
1,2], indicates that there is well to well and trial to trial variability in PCR efficiency
and that this variability is most likely due to the inability of our thermal cycler to
maintain temperature homogeneity for different well positions in the heating block.
It should be noted that the variability problem evident in this investigation utilized
PCR primer sequences that matched the target DNA perfectly. The variability
problem could be even more serious for primer/target sequences which contain
mismatches.
It is advisable that when performing PCR amplification assays using our
thermal cycler, one should prepare multiple samples for amplification since a
particular well cannot be expected to provide consistent results from one well to the
next within a trial or from one trial to the next. The auto-tune program should be
run prior to executing PCR and heavy oil should be placed into the wells to enhance
thermal conductivity since the "best" results were obtained under these conditions.
The heating block should be pre-heated to the denaturation temperature prior to
placing tubes inside the wells in order to minimize non-specific priming (eg. primer
DRES-SR-593 UNCLASSIFIED
18 UNCLASSIFIED
oligomer artifacts). There does not appear to be any advantage to connecting a line
voltage regulator to the thermal cycler and in fact, this may increase variability.
Because thermal probe analysis showed that the actual temperatures within the
reaction tubes are on average 6-8°C and 5-6°C lower than the setpoint temperatures
for the denaturation step (94"C) and extension step (72'C), respectively, the quantity
and quality of PCR amplified products might be increased by raising the set
temperatures to accommodate these differences. Similarly, increasing the holding
time period to ensure that the final temperatures are maintained for the intended
soak period, may increase the quality and quantity of amplified products, since many
of the well positions did not reach their equilibrium temperatures until 30-60 sec
after the thermal cycler initiated the soak period countdown.
UNCLASSIFIED DRES-SR-S83
UNCLASSIFIED 19
REFERENCES
1. Innis, M.A.,Gelfand, D.H., Sninsky, J.J., and White, T.J., PCR Protocols:
A Guide to Methods and Applications, Academic Press Inc., San Diego, 1990.
2. Linz, U., "Thermocycler Temperature Variation Invalidate PCR Results",
Biotechniques, 9, (3) pp. 286-292, 1990.
3. Innis, M.A.,and Gelfand, D.H. "Optimization of PCRs" in PCR Protocols: A
Guide to Methods and Applications. ed. Innis, M.A.,Gelfand, D.H.,Sninsky,
J.J., and White, T.J.,Academic Press Inc. pp. 3-12, 1990.
tRFS--SR-5%3 UNCLASSIFIED
20 UNCLASSIFIED
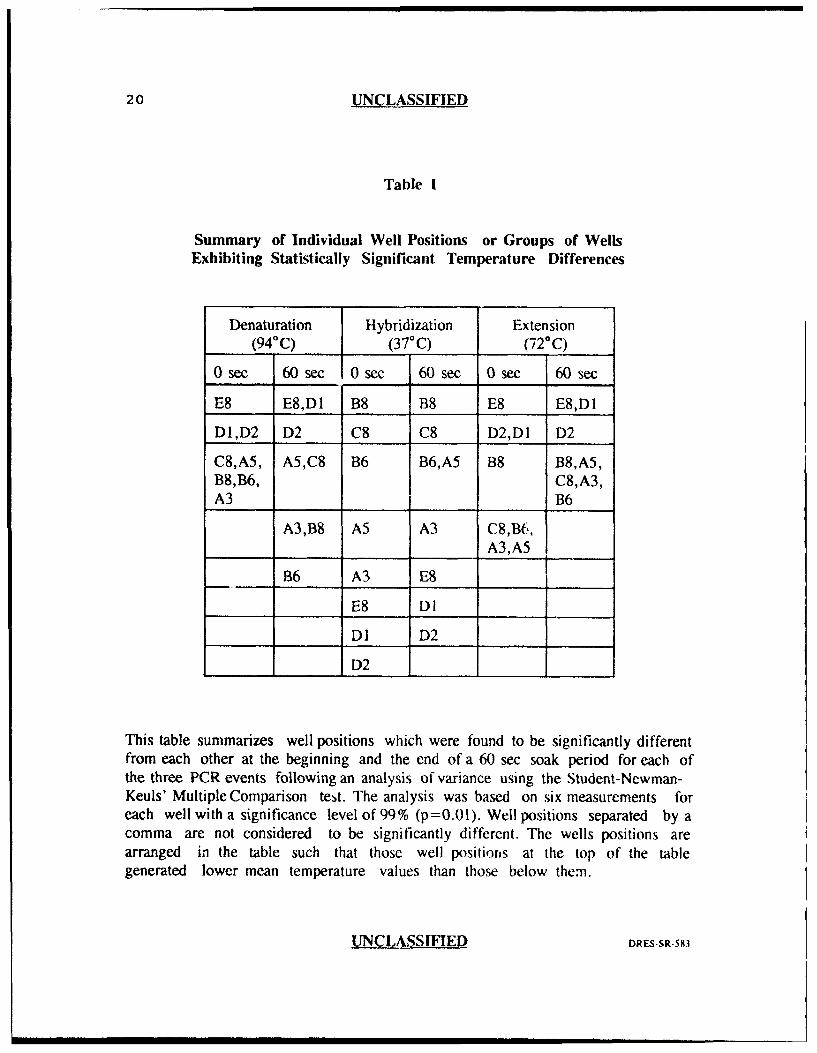
Table I
Summary of Individual Well Positions or Groups of WellsExhibiting Statistically Significant Temperature Differences
Denaturation Hybridization Extension(940C) (37°C) (72-C)
0 sec 60 sec 0 sec 60 sec 0 sec 60 sec
E8 E8,D1 B8 B8 E8 E8,D1
D1,D2 D2 C8 C8 D2,D1 D2
C8,A5, A5,C8 B6 B6,A5 B8 B8,A5,B8,B6, C8,A3,A3 B6
A3,B8 A5 A3 C8,B6,A3,A5
B6 A3 E8
E8 Dl
DI D2
D2 __
This table summarizes well positions which were found to be significantly differentfrom each other at the beginning and the end of a 60 sec soak period for each ofthe three PCR events following an analysis of variance using the Student-Newman-Keuls' Multiple Comparison test. The analysis was based on six measurements foreach well with a significance level of 99% (p=0.01). Well positions separated by acomma are not considered to be significantly different. The wells positions arearranged in the table such that those well positions at the top of the tablegenerated lower mean temperature values than those below them.
UNCLASSIFIED DRES-SR583

"UNCLASSIFIED 21
Table 1I
Mean Temperature Values of Individual Well Positions or Groups of WellsExhibiting Statistically Significant Temperature Differences
Denaturation Hybridization Extension(94°C) (37°C) (72°C)
0 sec 60 sec 0 sec 60 sec 0 sec 60 sec
78.15 85.70* 41.42 35.97 56.50 65.82*
79.14* 86.18 42.08 36.20 57.66* 66.20
81.53* 86.90* 43.03 36.38* 59.43 67.37*
87.38* 44.50 36.82 60.58*
87.88 45.98 36.98 1
47.37 37.68
48.65 37.80
48.98
3.4 2.2 7.6 1.8 4.1 1.6
This table contains the mean temperatures (°C) for those well positions which werefound to be significantly different from each other following an analysis of varianceusing the Student-Newman-Keuls' Multiple Comparison test (see Table 1). Forthose cases in which the statistical analysis indicated no significant differencesbetween two or more well positions, the mean temperatures for these wellpositions were averaged and are indicated by an asterisk. The values across thebottom row represent the temperature difference ('C) between wells whichgenerated the highest and lowest mean temperature values.
DRES-SR•-53 UNCLASSIFIEI)

22 UNCLASSIFIED
Table III
Minimum and Maximum Temperature Differences Betweenthe Setpoint Temperature and Measured Temperatures
for Significantly Different Well Positions
Beginning of Soak End of Soak(t = 0 sec) (t = 60 sec)
Denaturation 12.5 - 15.9 (below) 6.1 - 8.3 (below)(94-C)
Hybridization 4.4 - 12.0 (above) 1.0 (below) -(37-C) 0.8 (above)
Extension 11.4 - 15.5 (below) 4.6 - 6.2 (below)(72-C)
The temperature values (°C) in the table represent the minimum and maximumtemperature differences between the setpoint temperature and the actualmeasured temperature for those well positions which showed a significantdifference (see Table I and II). The direction of this difference (above or below thesetpoint temperature) is indicated in brackets.
UNCLASSIFIED DRES-SR-5s3
UNCLASSIFIED 23
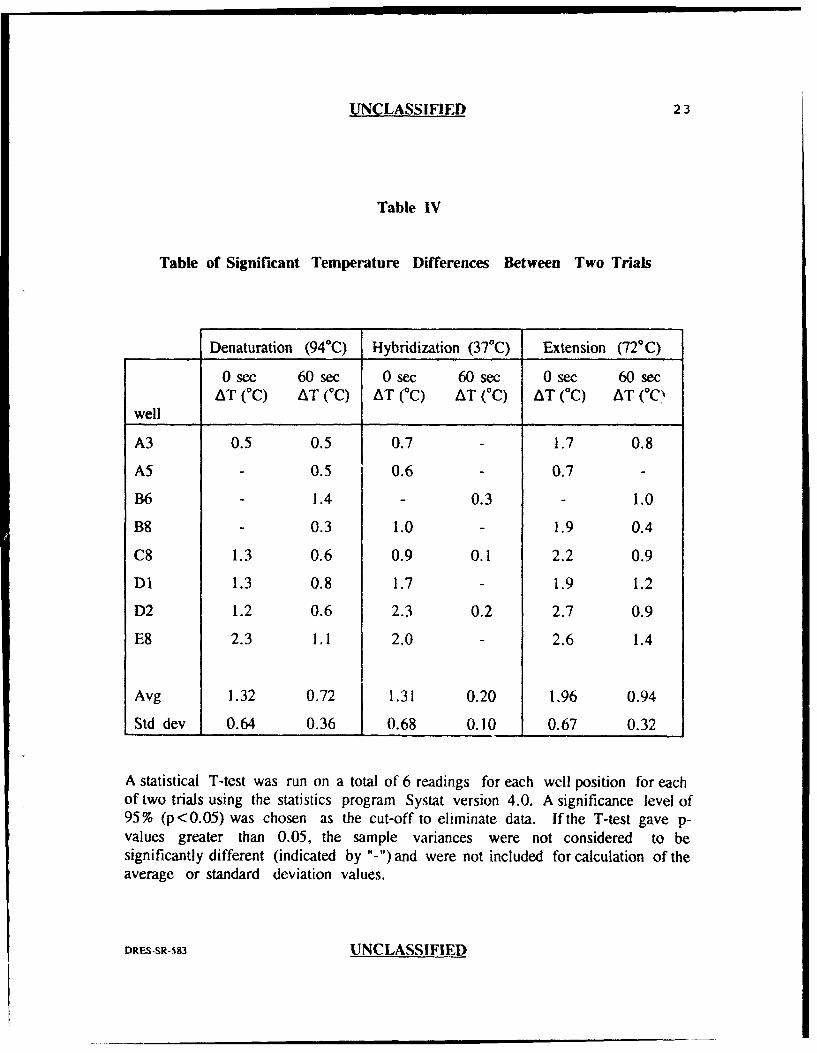
Table IV
Table of Significant Temperature Differences Between Two Trials
Denaturation (940C) Hybridization (37*C) Extension (720C)
0sec 60sec 0sec 60sec 0sec 60secAT (C) AT (TC) AT (°C) AT (C) AT (°C) AT (°C'
well
A3 0.5 0.5 0.7 1.7 0.8
A5 - 0.5 0.6 - 0.7 -
B6 1.4 - 0.3 - 1.0
B8 - 0.3 1.0 - 1.9 0.4
C8 1.3 0.6 0.9 0.1 2.2 0.9
DI 1.3 0.8 1.7 - 1.9 1.2
D2 1.2 0.6 2.3 0.2 2.7 0.9
E8 2.3 1.1 2.0 - 2.6 1.4
Avg 1.32 0.72 1.31 0.20 1.96 0.94
Std dev 0.64 0.36 0.68 0.10 0.67 0.32
A statistical T-test was run on a total of 6 readings for each well position for eachof two trials using the statistics program Systat version 4.0. A significance level of95% (p<0.05) was chosen as the cut-off to eliminate data. Ifthe T-test gave p-values greater than 0.05, the sample variances were not considered to besignificantly different (indicated by "-")and were not included for calculation of theaverage or standard deviation values.
DRES-sR-5•3 UNCLASSIFIED

24 UNCLASSIFIED
1 2 3 4 5 .. 6 7 81i
Figure 1
Schematic Diagram Depicting the Location of Eight Randomly Selected ThermalCycler Heating Block Well Positions (shaded) Used in the Thermal Probe AnalysisExperiment.
UNCLASSIFIED DRES-SR-583
UNCLASSIFIED 25
Cr
9 4d
Z zz
I I
SA1A2 A3 A4 A5 A6 A7 A8 B 1 B2 B3 B41
500 bpAMPLIFIED PRODUCT
500 bp
AMPLIFIED PRODUCT
B5 B6 B7 68 Cl C2 C3 C4 C5 C6 C7 C8
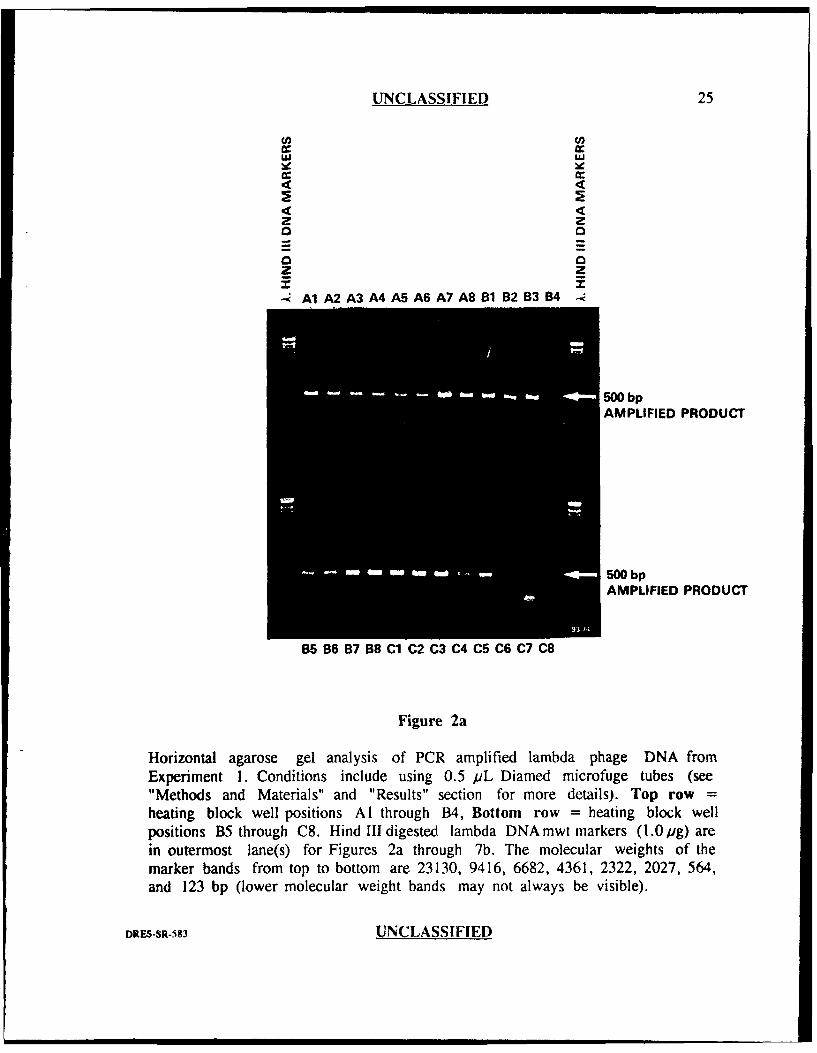
Figure 2a
Horizontal agarose gel analysis of PCR amplified lambda phage DNA fromExperiment 1. Conditions include using 0.5 pL Diamed microfuge tubes (see"Methods and Materials" and "Results" section for more details). Top row =heating block well positions Al through B4, Bottom row = heating block wellpositions B5 through C8. Hind III digested lambda DNA mwt markers (1.0 jig) arein outermost lane(s) for Figures 2a through 7b. The molecular weights of themarker bands from top to bottom are 23130, 9416, 6682, 4361, 2322, 2027, 564,and 123 bp (lower molecular weight bands may not always be visible).
DRES-SR-583 UNCLASSIFIED

26 UNCLASSIFIED
U, U
ul
Z Zz
. DD 2 D3 D4 D5 D6 D7 D8 E1 E2 E3 E4
500 bpAMPLIFIED PRODUCT
•] [3 L-• r_.J • [ r_ ,• L-• [-- •"', 500 bp
AMPLIFIED PRODUCT
E5 E6 E7 E8 F1 F2 F3 F4 F5 F6 F7 F8
Figure 2b
Horizontal agarose gel analysis of PCR amplified lambda phage DNA fromExperiment I. Same as Figure 2a except: Top row = heating block well positionsDI through E4, Bottom row =heating block well positions E5 through F8.
UNCLASSIFIED DRES-SR-583
UNCLASSIFIED 27
U) U)
2 zuo 0
o <2 z° Z- A1A2 A3 A4 A5 A6 A7 A8 B1 B2 B3B4
500 bpAMPLIFIED PRODUCT
500 bpAMPLIFIED PRODUCT
B5 B6 B7 B8 C1 C2 C3 C4 CS C6 C7 C8
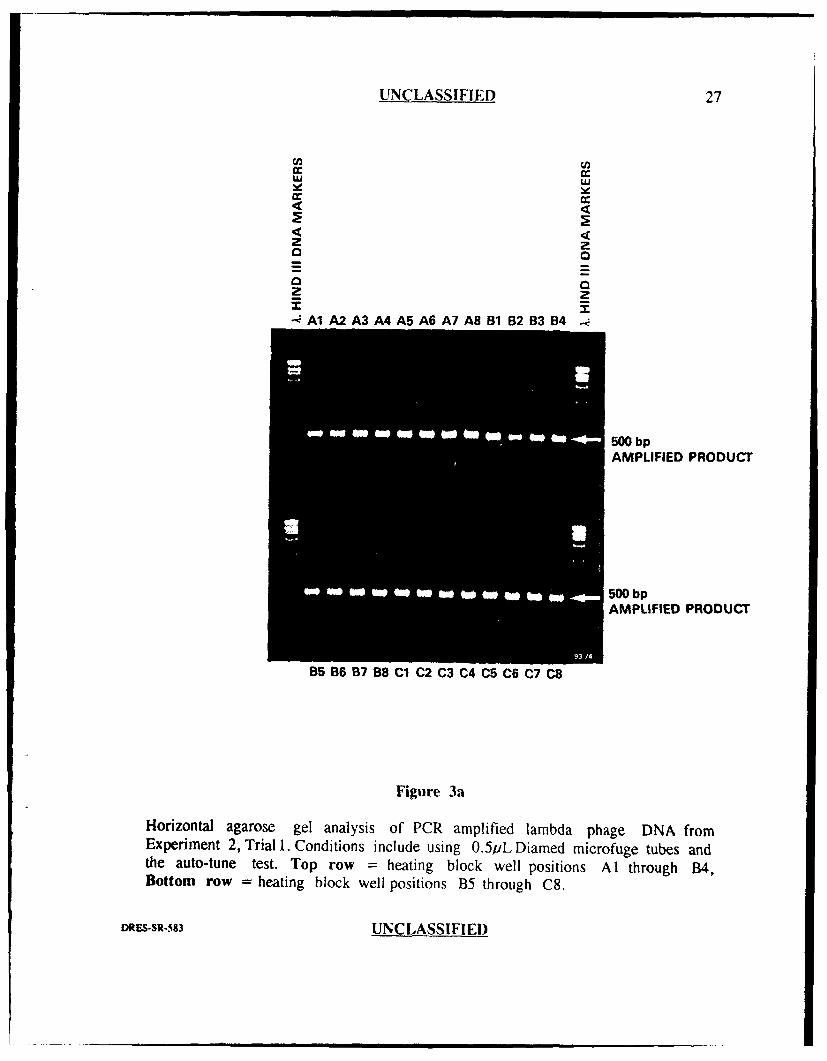
Figure 3a
Horizontal agarose gel analysis of PCR amplified lambda phage DNA fromExperiment 2, Trial 1. Conditions include using 0.5/iL Diamed microfuge tubes andthe auto-tune test. Top row = heating block well positions Al through B4,Bottom row = heating block well positions B5 through C8.
DRES-SR.•53 UNCLASSIFIED
28 UNCLASSIFIE)D
0r o•
0 o
< cc
z ztm z
--
"_ D1 D2 D3 D4 D5 D6 D7 D8 El E2 E3 E4 -.
500 bpAMPLIFIED PRODUCT
500 bpAMPLIFIED PRODUCT
ES E6 E7 E8 F1 F2 F3 F4 F5 F6 F7 F8
Figure 3b
Horizontal agarose gel analysis of PCR amplified lambda phage DNA fromExperiment 2, Trial 1. Same as Figure 3a except: Top row = heating block wellpositions DI through E4, Bottom row = heating block well positions E5 throughF8.
UNCLASSIFIED DRES-SR-583
UNCLASSIFIED 29
LU w
2 z= =o 0Z z
A1 A2 A3 A4 A5 A6 A7 A8B1 B2B3B4 88
AMPLIFIED PRODUCT
500 bpAMPLIFIED PRODUCT
B5 B6 878 C C2 C3 C4 C5 C6 C7 C8
Figure 4a
Horizontal agarose gel analysis of PCR amplified lambda phage DNA from
Experiment 2, Trial 2. Conditions include using 0.5 pL Diamed microfuge tubesand the auto-tune test. Top row = heating block well positions Al through B4,Bottom row = heating block well positions B5 through C8.
DRES-SR-593 UNCLASSIFIED

30 UNCLASSIFIED
w LU
4 4
D 4z 2o 0
- =_2 2I I
-. D1 D2 D3D4 D5D6 D7D8 E1E2 E3E4 -•
500 bpAMPLIFIED PRODUCT
500 bpAMPLIFIED PRODUCT
E5 E6 E7 E8 F1 F2 F3 F4 F5 F6 F7 F8
Figure 4b
Horizontal agarose gel analysis of PCR amplified lambda phage DNA fromExperiment 2, Trial 2. Same as Figure 4a except: Top row = heating block wellpositions DI through E4, Bottom row = heating block well positions E5 throughF8.
UNCLASSIFIED DRES-SR-583
UNCLASSIFIED 31
50 b
A13 86 137 138 C1 C2 C3 C4 C5 C6 C7 C8
Figure 5a
Horizontal agaro,_-. gel analysis of PCR amplified lambda phage DNA fromExperiment 3, Trial 1. Conditions include using 0.5 uL Diamed microfuge tubes,auto-tune test and heavy oi1/94°C start. Top row = heating bl,•ck well positionsA1I through B4, Bottom row = heating block well positions B5 through C8.
DRES-SR-58 UNCLASSIFIED
32 UNCLASSIFIED
w
4
4
z
rF
"D1 D2 D3 D4 D5 D6 D7 D8 E1 E2 E3 E4
F'I-• E][•[•-J [• •L•• [)L•] • --- I',500 bp
AMPLIFIED PRODUCT
500 bpAMPLIFIED PRODUCT
E5 E6 E7 E8 F1 F2 F3 F4 F5 F6 F7 F8
Figure 5b
Horizontal agarose gel analysis of PCR amplified lambda phage DNA fromExperiment 3, Trial 1. Same as Figure 5a except: Top row = heating block wellpositions DI through E4, Bottom row = heating block well positions E5 throughF8.
UNCLASSIFIED DRES-SR-583
UNCLASSIFIED 33
U,
w w
4 ZAl A14
z, zo 0
50 b
o 0
z _z
- A1 A2A3 A4A5 A6A7 A8 B1B2B3 84 --•
500 bp
AMPLIFIED PRODUCT
500bpAMPLIFIED PRODUCT
85 B6 B7 B8 C1 C2 C3 C4 C5 C6 C7 C8
Figure 6a
Horizontal agarose gel analysis of PCR amplified lambda phage DNA fromExperiment 3, Trial 2. Conditions include using 0.5 pL Diamed microfuge tubes,auto-tune test and heavy oil/94°C start. Top row = heating block well positionsAl through B4, Bottom row = heating block well positions B5 through C8.
DRES-SR-583 UNCLASSIFIED
34 UNCLASSIFIED
U) Ujw w4r 4
z z< 0
z z
Z z
D1 D2 D3 D4 D5 D6 D7 D8 El E2 E3 E4
AMPLIFIED PRODUCT
•j _j[-- •t• [-J 'E] [_]L•['- •[::3 '---500 bp
AMPLIFIED PRODUCT
E5 E6 E7 E8 F1 F2 F3 F4 F5 F6 F7 F8
Figure 6b
Horizontal agarose gel analysis of PCR amplified lambda phage DNA fromExperiment 3, Trial 2. Same as Figure 6a except: Top row = heating block wellpositions D1 through F4, Bottom row = heating block well positions E5 throughF8.
UNCLASSIFIED DRES-SR-583
UNCLASSIFIE[ 35
er le
,4 4,
4 <
z zo Z
Z Z
SAl A2 A3 A4 A5 A6 A7 A8 B1 B2 B3 B4 -<
500 bpAMPLIFIED PRODUCT
AMPLIFIED PRODUCT
B5 B6 B7 B8 C1 C2 C3 C4 C5 C6 C7 C8
Figure 7a
Horizontal agarose gel analysis of PCR amplified lambda phage DNA fromExperiment 4. Conditions include using 0.5 pLGeneAmpT M microfuge tubes, auto-tune test and heavy oil/94°C start. Top row = heating block well positions A Ithrough B4, Bottom row = heating block well positions 135 through C8.
DRESSR-583 UNCLASSIFIED
36 UNCLASSIFIED
w w
4 4
4 4
2 z
Z 2
SD1 D2 D3 D4 D5 D6 D7 D8 El E2 E3 E4 -•
500 bpAMPLIFIED PRODUCT
500 bpAMPLIFIED PRODUCT
E5 E6 E7 E8 F1 F2 F3 F4 F5 F6 F7 F8
Figure 7b
Horizontal agarose gel analysis of PCR amplified lambda phage DNA fromExperiment 4. Same as Figure 7a except: Top row = heating block well positionsDI through E4, Bottom row = heating block well positions E5 through F8.
UNCLASSIFIED DRES-SR-583
UNCLASSIFIED 37
-- A3 &* A5 -- 9 86 as 8 * C8-0-01 -9- D2 0.- E8 - SET POINT
95
E3 9
~85wjCL
80
75
0 15 30 45 60
TIME (sec)
Figure 8
Temperature profile curves for eight well positions of the thermal cycler heatingblock during a 60 second soak period for the denaturation event (940C2). Thetemperature readings taken at 0, 15, 30, 45 and 60 sec for each curve are based onthe mean of six measurements for a single trial. The setpoint temperature isindicated by the ileavy horizontal line.
DRES-SR-583 UNCLASSIFIED
38 IJNCLASSIFIED
-4-A3 -- e- AS -4 86 -- 68 - C8
-4-D1 -1 D2 -4- E8 SET POINT
50
-45
35
0 15 30 45 60
TIME (sec)
Figure 9
Temperature profile curves for eight well positions of the thermal cycler heatingblock during a 60 second soak period for the hybridization event (37C(). Thetemperature readings taken at 0, 15, 30, 45 and 60 sec for each curve are based onthe mean of six measurements for a single trial. The setpoint tcmperature isindicated by the heavy horizontal line.
UNCLASSIFIED DRES-SR-593
UNCLASSIFIED 39
-i A3 -- r-- A5 0 86 -- 4-- B8 - - C8
0 D1 9 D2 -4 E8 SET POINT
75
•3 7000
LU
-85
Li
60
6O0 15 30 45 60
TIME (sec)
Figure 10
Temperature profile curves for eight well positions of the thermal cycler heatingblock during a 60 second soak period for the extension event (720C). Thetemperature readings taken at 0, 15, 30, 45 and 60 sec for each curve are based onthe mean of six measurements for a single trial. The setpoint temperature isindicated by the heavy horizontal line.
DRES-SR-583 UNCLASSIFIED

UNCLASSI FlED A-I
ANNEX A-I
PERFORMANCE COMPARISON MATRIX
CETUS ERICOMP TECHNE TYLERPERKIN-ELMER RESEARCH
USER INTERI ;'E' 2 x 40 Display 2 x 40 Display 4 x 40 Displa,' 25 x 80 Computer
STANDARD SAJMPLE2 48 - 0,Sml tube 29 - 1.5ml tube 54 - 0.Sml tube 88 - 0.Sml tube
RAMPING FUNCTION' Programmable No (2 rates) limited (4 rates) Programmable
RAMPING RANGE' 0 - 0.2*C/sec 0,09* C/sec max. 0.30
C/S.c max. 0 - 0.5*C/sec
HOMOGENEITY' ±5(" "10, C ±7"C ±*" CDURING RAMP
HOMOGENEITY' .3-C ±.4W* t 5'C ±1 CDURING SOAK
SAMPLE SENSOR' NO YES YES YES
GRAPnt&CS NO NO NO YES
COUNTRY OF ORIGIN U.S.A. U.S.A. U.S.A. CANADA
'This is the means by which the user programs the instrument and is given nformation relating to the run while it is in progress. Two.and four-line displays show limited information at any one time, necessitating repeated "stepping through" of the programming functionsto review the programmed parameters. Because tiey make use of a lull 25-line by 80-character computer screen. Tyler ResearchInstruments isable to display all programming and optrating, 'formation on a single screen at one time, thereby simplifying programmingand analysis functions.
'This is the configuration normally supplied with the instrument. Some manufacturers offer alternate sample formats, such as microtiterplates. The Tyler Research reactor has the largest array of alternative trays available, accomodating 0.Sim and I.Sml microfuge tubes,microtiter trays, and vertical and horizontal in situ slide trays, with other sample formats currently under development.
I Ramping refers to the controlled move from one temperature to another In the two instruments with fully programmable rampingparameters (Cecus/Perkin-Flmer and Tyler Research). the range of ramp rates is from OC per second to the maximum axerage attainableby the instrument under a variety of ramping conditions. In the firicomp there are two possible ramp rates, corresponding to slow andextremely slow. The Techne. while much faster than the Ericomp, has only 4 available ramp rates which are not programmable by theuser. In both cases, the number shown represents the maximum available ramp rate
"(ritn each case, figures are those obtained during actual lesis conducted in the Faculty of Medicine at the University of Alberta, Folklwingmanufacturer's instructions fir each instrument Acomputer-controlled solid state array consisting of8 laser-trimmed sensors placed insideindividual tubes was monitored throughout programmed runs set to a Iwo-minute 92"C soak, a rapid ramp to 55*(. for a two-minutesoak, a rapid ramp to 72"C for a two minute soak, and a repeat of this cycle Complete test results including graphic output of all runsfor each instrument are available upon request. and representative graphs are presented overleaf. Homogeneity in the Cetus/Perkin-Elmer, Ericomp. and Techne cyclers is poor, particularly in light of the advertised figures. Claims of ±0.1" to ±0.5'C are typical forthese manufacturers. Maximum ramp rates are also grossly inflated in their specifications. The Cetus PCRcycler, for example, advertisesrates of l1C per second, although the maximum obtained in the University of Alberta tests was 0.3°C per second, with an average underall test conditions of only about 0.2 C per second. fbe Tyler Research Instruments thermal reactor is the only device tested that metadvertised specifications.
'The Cetus/Perkin-Elmer PCR does not have an encapsulated temperature sensor intended io mimric the conditions of the actual samplesrInstead, this manufacture, apparently makes the assumption that monitoiring the temperature of the block in which the samples are placedis adequate. The University of Alberta resulis clearly indicate that this is nut an accurate assumption. The Ericomp and Techneincorporate an epoxy-imbedded temperature sensor which occupies a posiliuin in the temperature block. 'he Tyler Research instrumentuses a tube identical to the sample tubes themselves, to yield constant feedback (-n sample temperatures 'htis information is interpretedby the computer controlling the instrument to provide fine control of actual sample conditions
$Only the Tyler Research reactor has built-in graphics functions to permit detailed graphic output of all run conditions, including reactorchamber temperature, actual sample temperature, and programmed temperatures. All may be plotted on the computer screen withrespect to time, and both graph axes are fully definable by the user fThe infosrmation is stored digitally for on-line or subsequent analysisand graphs may be printed on a variety of output devices, including dot-matrix and laser printers. This is particularly important in researchapplications for fine-tuning of experimental parameters. This function is also crucial for courtroom presentation in the case oif orensicevidence, and for medical records in the case of molecular diagnostics applications.
DRES-SR-583 UNCLASSIFIED
UNCLASSIFIED A-2
ANNEX A-2
SAMPLE HOMOGENEITY
6 I E.-W 0-1
757
4 1 f 4 5 t 14 is is
ne, TdCopo" h.ofl I" 7 Aes.W 'p 'Af.nsZf.W.i-.
:1
as-sa. 7s
45
r.4.
5I•- .•IS-
Representative graphs illustrating sample homogeneity Among tubes grouped in a single quadrant of each instrument's sample block. Fachgraph shows 8 active temperature tracings in real time, plus a single tracing showing the average of the 8 sample tracings. In those caseswhere fewer than 9 tracings are evident, this is due to concurrence of one or more tracings (reflecting an increased degree of thermal andtemporal homogeneity). Data is derived frc t solid-state temperature sensors (AD590JH) immersed in Il0(il of mineral oil in sealedmicrofuge tubes. The sensors (calibrated and matched to within 0. 1*C)were sampled at 0.5 second intervals throughout the programmedruns by an IBM microcomputer operating through an 8-channel analog-to-digital board, and all data stored in disk for subsequent graphicana lysis.
DRES-SR-583 UNCLASSIFIED
UNCLASSIFIED
SECURITY CLASSIFICATION OF FORM(hignest classification of Title, Abstract. Keywords)
DOCUMENT CONTROL DATA(Security classification of title, body of absiact and indexing afnnotation must be entered When, thle Overall document is clills,fleel
1.ORIGINATOR trine namne and address of the organization preparing the document. 2. SECUR1TY CLASSIFICATIONOrganizations for whom the document was prepared. e~g. Establishment sponsoring (overall security classification of the docurnent.a contractor's report, or tasking agency, are entered in section 8.) including special warning terms if applicaole)
Defence Research Establishment Suffield UNCLASSIFIED
TITLE (tt~e compolete document title as indica:etl on the title page. its classification Should be indicated by the appropriateaftreviation ISCR or WI n parentheses after thle titieci
Thermal Cycler Temperature Variation and its Effect on the Polyrnerase
Chain Reaction
4 AUITHORS il~asl name, first name, middle initial. If military, show rank, e.g. Doe, Mal. John E.)
Bader, Doug E.
-
15. DATE OF PUBLICATION (month and year of publication of 6A. NO. OF PAGES 11a1ul 6b. NO. OF REFS (total coteo indoc'jment)cnann nomtin nld ouet
16. DESCRIPTIVE NOTES Ithe category of the documtent, e.g. technical report, technical note or memorandum, If appropriate. enter the type ofrepsr:. e-g. interim. progress. summary, annual or final. Give the inclusive dates when a specific reporting period is covered.)
Suffield Report No. 583
SPO3NSORiNG ACTIVITY (the name of the tieparsrterti projectI office or laboratory sponsoring the research and development Incluce theadldress.)
19a. rRC JEOT OR GRANT NO. (if 4ppropriatte, the applicable research 9b. CONTRACT NO. Jif appropriate, the aipplicable number V-dtrand levelopment project or grant number under which the document which the document was written)was written. Please Specify whether prafec! or grant)
051SH
a.'ý GIGINATOR'.ý DOCUIMENT NUMa3ER (the official document ;Ob. OTH-ER DOCUMENT NOS. (Any other numbers which mayn~nimoer by wriich the document is identified by the originating Ibe assigned this document either by the originator or by the
T:. r his number must be unique to Oths document) sponsor)
SP 5831
~ DC.(UMENTAVAILABL.ITY (any limitations on further dissemination of the document. other than those imposen by security cfasstication)
(XI Urlrinm,'ed distributionOi~rribjt:ori limited to defence lepartmentS and defence contractors, further distribution only a15 approvedCOisribiitn limited to defence departments and Canadian defence contractors: further distribution only as approved
I Ijsiribut~or I-mited to govprnment decartments and agencies; further distribution only as approvedI C'slrib.,:ian fimtited to defence departments: further distribution only as approved
I Other (pleae specify).
06OC. ,'¶n4 1' A4NOUNCEMENT tany limu~ttion to thie bibliograohic announcement af this document This wifl normally corresoond I,;the Docurner': Availabilty (11l. However, where further distribution (beyond the audience specified in 11tI is possible, a widerannouncement laiienCe may be selected)
UNCLASSI FIE[D
SECURItY CLASSiFiCATiO.N OF FORM

UNCLASSIFIED
SECURITY CLASSIFICATION OF FORM
13. ABSTRACT ( a brief ard factual summary of the document It may also appear elsewhere in the body of the document itseff. II is h,9vdesirable that the abstract of classified documents be unclassified. Each paragraph of the abstract shall begin with an idicaTlion of thesecurity classification of the information in the paragraph (unless the document itself is unclassified) represented as (S), (C). (A), or !U)It is not necessary to include here abstracts in both offical languages unless the text is bilingual).
This study was undertaken to investigate the source of variation irlPolymerase chain Reaction (PCR) amplification assays that we hav4encountered periodically in our studies. Two approaches, namely,;PCR/agarose gel analysis and thermal probe analysis, were used in thisinvestigation. PCR/agarose gel analysis demonstrated random variation idthe quantity and quality of amplified product from well to well, bothwithin and between trials. Several modifications to the procedure dionot eliminate variability. Thermal probe analysis indicated significan•well to well temperature variability among certain wells or groups ofwells within a trial (p=0.01) and significant temperature variabilitylamong certain well positions from one trial to another (p=O.05). Thermailprobe analysis also indicated large differences between the programmecdsetpoint temperatures and the actual temperatures inside the tubes forall three PCR events at the beginning of the soak period and two of threPCR events at the end of the soak period. The data from thininvestigation and other studies leads to the conclusion that the sourceof variability in PCR amplification efficiency we have experienced ismost likely due to the inherent inability of our thermal cycler tomaintain consistent temperature homogeneity across the heating blockduring PCR amplification reactions. It is advisable that replicatesamples for amplification be prepared since a particular well cannot beexpected to provide consistent results from well to well within a trialor from one trial to the next.
14. KEYVWORDS, DESCRIPTORS or IDENTIFIERS (technically meaningful terms or short phrases that chaacterize a document and could beheloful in cataloguing the document They should be selected so that no security classification is required. Identifiers. Such as eauimen:model designation, trade name, militry project code name, geographic location may also be included. If possible keywords should be Sel:ýefrom a published thesaurus. e.g. Thesaurus of Engineering and Scientific Terms (TEST) and that thesaurus-identified. If it is not possiblv 1rselect indexing terms which are Unclassified. the classificstion of each should be indicated as with the title.)
PCR
Polymerase Chain Reaction
Thermal cycler
DNA amplification
Temperature variability
Amplification variability
UNCLASSIFIED
SECURITY CLASSIFiCATtON OF FORM