Default & Loss Rates of Structured Finance Securities ... · Special Comment Default & Loss Rates...
48
Special Comment Default & Loss Rates of Structured Finance Securities: 1993-2005 Summary Opinion This Special Comment presents Moody's fourth annual report of the default, impairment, and loss rates of global structured finance securities, covering the credit performance through year-end 2005 of all structured finance securities issued since 1993. The following are the highlights of this report: • The credit performance of structured finance securities improved sharply in 2005. The number of newly impaired tranches fell to 98 in 2005 from 213 in 2004, reflecting a large drop in the number of newly impaired US ABS and global CDO securities. Declining impairments, coupled with strong growth in the number of outstand- ing ratings, drove the one-year impairment rate – the number of newly impaired tranches as a percentage of the total tranches outstanding at the beginning of a year – down to historical lows. The one-year investment-grade impairment rate fell to 0.05% in 2005 from 0.4% in 2004, while the one-year speculative-grade impairment rate dropped to 2.7% from 5.4%. • Five-year loss rates as a percent of original balances have averaged 0.017% for Aaa-rated, 0.7% for Aa-rated, 1.8% for single-A-rated, 5.8% for Baa-rated, and 11.7% for speculative-grade-rated securities. Historical average loss rates, however, have varied substantially across asset classes, with those in the CMBS and RMBS sectors being the lowest among all structured finance sectors. • When weighted by dollar volume, the average credit loss rate across all structured finance has been very low, which should be expected since 83% (by volume) of all securities have been rated Aaa at issuance. Within five years of origination, the volume-weighted aggregate loss rate has been about 0.49%. • By the end of 2005, 1,095 securities issued since 1993 had become materially impaired. This represents roughly 2.3% of the 47,519 structured finance tranches and 4.4% of the 13,619 transactions studied. Of the $6.2 trillion worth of dollar-denominated structured finance tranches in the sample, 0.47% (by original balance) became impaired. • Final loss severity rates on impaired securities have averaged 53% as a share of original balances for the 352 impaired securities that have reached "maturity" (i.e., with no remaining principal balance) as of year-end 2005. The final loss severity rates of all impaired securities including those with balances still outstanding are expected to be lower. Final loss severity rates have historically been higher on matured ABS and CDO defaults than on matured RMBS and HEL defaults, and higher on securities rated lower at issuance than those rated higher at issuance. April 2006 New York Jian Hu 1.212.553.1653 Hadas Alexander Debjani Roy Julia Tung Richard Cantor Gus Harris Detlef Scholz Nicolas Weill Contact Phone
Transcript of Default & Loss Rates of Structured Finance Securities ... · Special Comment Default & Loss Rates...
Special CommentApril 2006
New YorkJian Hu 1.212.553.1653Hadas AlexanderDebjani RoyJulia TungRichard CantorGus HarrisDetlef ScholzNicolas Weill
Contact Phone
Default & Loss Rates of Structured Finance Securities: 1993-2005
Summary Opinion
This Special Comment presents Moody's fourth annual report of the default, impairment, and loss rates of globalstructured finance securities, covering the credit performance through year-end 2005 of all structured financesecurities issued since 1993. The following are the highlights of this report:• The credit performance of structured finance securities improved sharply in 2005. The number of newly
impaired tranches fell to 98 in 2005 from 213 in 2004, reflecting a large drop in the number of newly impaired USABS and global CDO securities. Declining impairments, coupled with strong growth in the number of outstand-ing ratings, drove the one-year impairment rate – the number of newly impaired tranches as a percentage of thetotal tranches outstanding at the beginning of a year – down to historical lows. The one-year investment-gradeimpairment rate fell to 0.05% in 2005 from 0.4% in 2004, while the one-year speculative-grade impairment ratedropped to 2.7% from 5.4%.
• Five-year loss rates as a percent of original balances have averaged 0.017% for Aaa-rated, 0.7% for Aa-rated, 1.8%for single-A-rated, 5.8% for Baa-rated, and 11.7% for speculative-grade-rated securities. Historical average lossrates, however, have varied substantially across asset classes, with those in the CMBS and RMBS sectors being thelowest among all structured finance sectors.
• When weighted by dollar volume, the average credit loss rate across all structured finance has been very low,which should be expected since 83% (by volume) of all securities have been rated Aaa at issuance. Within fiveyears of origination, the volume-weighted aggregate loss rate has been about 0.49%.
• By the end of 2005, 1,095 securities issued since 1993 had become materially impaired. This represents roughly2.3% of the 47,519 structured finance tranches and 4.4% of the 13,619 transactions studied. Of the $6.2 trillionworth of dollar-denominated structured finance tranches in the sample, 0.47% (by original balance) becameimpaired.
• Final loss severity rates on impaired securities have averaged 53% as a share of original balances for the 352impaired securities that have reached "maturity" (i.e., with no remaining principal balance) as of year-end 2005.The final loss severity rates of all impaired securities including those with balances still outstanding are expected tobe lower. Final loss severity rates have historically been higher on matured ABS and CDO defaults than on maturedRMBS and HEL defaults, and higher on securities rated lower at issuance than those rated higher at issuance.

Figure 1 – New Impairments in 2005 and Lifetime Impairments since 19932005 1993-2005
Number of New Impairments
One-Year Impairment Rate
Number of Impairments
Lifetime Impairment Rate
Invest. Grade
Spec. Grade
Invest. Grade
Spec. Grade
Invest. Grade
Spec. Grade
Invest. Grade
Spec. Grade
US ABS 4 36 0.04% 5.6% 402 139 3.2% 22.9%US CMBS 0 32 0.00% 2.9% 15 81 0.5% 6.5%US RMBS 3 8 0.07% 1.4% 90 60 1.3% 6.0%Global CDOs 4 11 0.10% 1.7% 181 122 3.7% 19.8%European SF ex CDOs 0 0 0.00% 0.0% 1 1 0.0% 0.7%SF in Other Regions 0 0 0.00% 0.0% 2 1 0.1% 0.6%All SF 11 87 0.05% 2.7% 691 404 2.2% 10.7%
Note: The categorization of investment (invest.) grade and speculative (spec.) grade for the 2005 data is based on the security's rating at the beginning of 2005. For the overall historical totals during 1993-2005, the categorization is by their original rating. Lifetime impairment rates are computed by dividing the total number of impairments from 1993 to 2005 by all the securities issued from 1993 to 2004 (securities issued in 2005 are not included.) SF stands for "structured finance," which includes ABS (including HELs), CMBS, RMBS, and CDOs. See Appendix 1 for a description of the data sample and glossary.
2 Moody’s Special Comment

Table of ContentsPage
Summary Opinion .................................................................................................................................. 1
Overview of Global Structured Finance Material Impairments in 2005 .............................................. 4
Analysis of Material Impairments and Payment Defaults by Credit Event ......................................... 6Distribution of Material Impairments by Credit Event ......................................................................................... 6Analyzing the Cure Rate of Payment Defaults .................................................................................................... 6Comparing Reasons Underlying Uncured Payment Defaults by Sector ............................................................... 8
Analysis of Material Impairments by Sector, Rating, and Vintage ...................................................... 8US ABS: Impairment Rates Dropped Precipitously ............................................................................................. 8US HEL: Impairment Rates Edged Down .......................................................................................................... 10US CMBS: Impairment Rates Remained Low ................................................................................................... 11US RMBS: Impairment Rates Rose in the Speculative-Grade Category ............................................................. 13Global CDOs: Impairment Rates Plunged Across All Categories ....................................................................... 14
Loss Severity Rates on Impaired Tranches by Sector, Rating, and Horizon ..................................... 17Final LGD of Matured Defaults in All Structured Finance Averaged 53% .......................................................... 17Estimated Final LGD Rates on Impaired RMBS and HEL Tranches Averaged 32% ............................................ 19Estimated Final LGD Rates on Impaired CDO Tranches Averaged 72% ............................................................ 20Comparing LGD Rates by Time Horizon ........................................................................................................... 21
Multi-Year Cumulative Loss Rates by Rating and Sector .................................................................. 22
Appendix 1: Descriptions of Data Sample and Glossary ................................................................... 24Description of Data Sample ............................................................................................................................. 24Glossary ......................................................................................................................................................... 24
Appendix 2: How to Calculate Multi-Year Material Impairment Rate and LGD Rate ........................ 27Cumulative Impairment Rate by Cohort Rating ................................................................................................ 27Cumulative Impairment Rate by Original Rating ............................................................................................... 28Multi-Year Cumulative LGD Rates ................................................................................................................... 29
Appendix 3: Impairment Rates by Rating ........................................................................................... 30
Appendix 4: Estimated Loss Rates by Rating ..................................................................................... 36
Appendix 5: List of 2005 New Impairments ....................................................................................... 41
Related Research ................................................................................................................................ 46
Moody’s Special Comment 3

Overview of Global Structured Finance Material Impairments in 2005
2005 was a year of strong growth and superb credit performance for global structured finance. The sector continued togrow at a brisk rate with traditional securitizations remaining strong and new products and new features beingintroduced into the market. The year 2005 also marked the first time asset-backed credit default swaps (ABS CDS)were introduced to the market, potentially enhancing the liquidity of ABS securities and showing that the market isbecoming increasingly mature.
With the benign corporate environment, strong real estate markets, and low interest rates, the structured financesector saw only 98 tranches become newly impaired in 2005. This number is substantially lower than those observedduring 2002-2004 and similar to the level last seen in 2001 (see Figure 2). Moreover, roughly 50 previously impairedtranches, or about 4.8% of the total 1051 impairments as of year-end 2004, were cured in 2005, as collateral assetvaluation strengthened and interest payments reverted to current.
Both the US ABS and global CDO sectors dramatically improved with only 40 and 15 new impairments in 2005,respectively, compared to 140 for US ABS and 41 for global CDOs in 2004. In particular, manufactured housing (MH)loan-backed ABS and high-yield corporate bond-backed CDOs (HYCBOs) saw the number of new impairmentsdwindle, with just three for MH and none for HY CBOs in 2005, down from 76 and 11 in 2004, respectively.
The CMBS, HEL, and RMBS sectors, supported by the continuing strong real estate markets and the steady andlow interest rate environment, performed well and similarly in 2005 and 2004. There were 32 newly impaired tranchesin CMBS, 20 in HEL, and 11 in RMBS in 2005, up slightly from 23, 16, and 7 in the prior year. Moreover, 19 of the42 impaired CMBS tranches in 2004 were subsequently cured in 2005.
The structured finance sector outside the United States excluding CDOs did not have any newly impairedtranches in 2005. The sector's total number of impairments remains at only five for the entire sample period.
Declining impairments, coupled with strong growth in the number of outstanding ratings, drove the one-yearimpairment rate – the number of newly impaired tranches as a percentage of the total tranches outstanding at thebeginning of a year – down to historical lows. Within the speculative-grade category, which includes securities ratedBa, single-B or Caa, the one-year impairment rate fell to 2.7% in 2005 from 5.4% in 2004, and within the investment-grade category, which includes securities rated Baa or above, the impairment rate went down to 0.05% from 0.4% (seeFigure 3).
Figure 2 – Number of New Material Impairments
0
50
100
150
200
250
300
1994 1995 1996 1997 1998 1999 2000 2001 2002 2003 2004 2005
Other SF (ex CDOs)
Europe SF (ex CDOs)
Global CDOs
US RMBS
US CMBS
US ABS
4 Moody’s Special Comment

The improvements in the impairment rates were broad-based, affecting all sectors. In the investment-gradeportion of the market, which comprises about 99% of total issuance volume or 90% of all structured finance securities,the one-year impairment rate declined across all sectors in 2005, especially in the ABS and CDOs sectors (see Figure4). In addition, the investment-grade impairment rate was almost zero in the ABS (excluding MH and HEL) sector forthe first time since 2001, and zero for the CMBS sector for the second year in a row.
Figure 3 – Investment-Grade and Speculative-Grade One-Year Impairment Rates in Structured Finance Overall
Figure 4 – Investment-Grade One-Year Impairment Rates by Sector
0.0%
0.4%
0.8%
1.2%
1.6%
2.0%
1996 1997 1998 1999 2000 2001 2002 2003 2004 20050%
2%
4%
6%
8%
10%
12%
Spec. Grade (right axis)
Invest. Grade (left axis)
19961997
19981999
20002001
20022003
20042005
US RMBS
US CMBS
US HEL
US ABS ex MH HELCDOs ex HY CBO
0.0%
0.2%
0.4%
0.6%
0.8%
1.0%
1.2%
Moody’s Special Comment 5
Analysis of Material Impairments and Payment Defaults by Credit Event
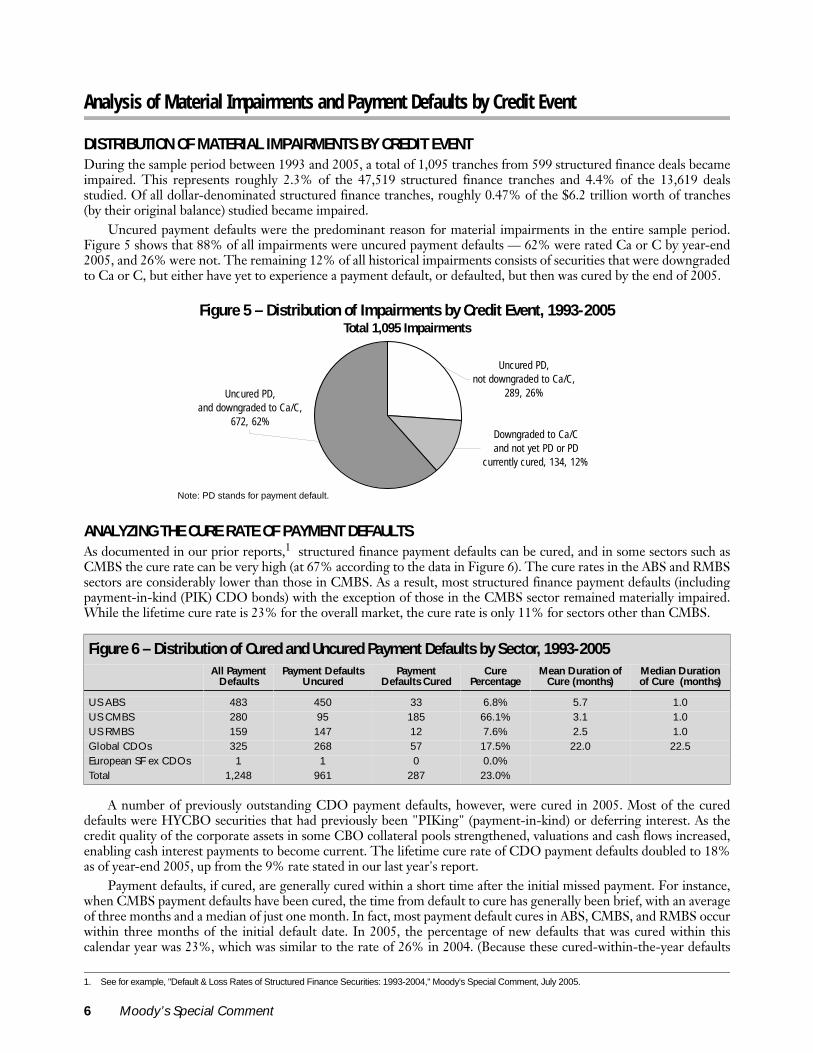
DISTRIBUTION OF MATERIAL IMPAIRMENTS BY CREDIT EVENTDuring the sample period between 1993 and 2005, a total of 1,095 tranches from 599 structured finance deals becameimpaired. This represents roughly 2.3% of the 47,519 structured finance tranches and 4.4% of the 13,619 dealsstudied. Of all dollar-denominated structured finance tranches, roughly 0.47% of the $6.2 trillion worth of tranches(by their original balance) studied became impaired.
Uncured payment defaults were the predominant reason for material impairments in the entire sample period.Figure 5 shows that 88% of all impairments were uncured payment defaults — 62% were rated Ca or C by year-end2005, and 26% were not. The remaining 12% of all historical impairments consists of securities that were downgradedto Ca or C, but either have yet to experience a payment default, or defaulted, but then was cured by the end of 2005.
ANALYZING THE CURE RATE OF PAYMENT DEFAULTSAs documented in our prior reports,1 structured finance payment defaults can be cured, and in some sectors such asCMBS the cure rate can be very high (at 67% according to the data in Figure 6). The cure rates in the ABS and RMBSsectors are considerably lower than those in CMBS. As a result, most structured finance payment defaults (includingpayment-in-kind (PIK) CDO bonds) with the exception of those in the CMBS sector remained materially impaired.While the lifetime cure rate is 23% for the overall market, the cure rate is only 11% for sectors other than CMBS.
A number of previously outstanding CDO payment defaults, however, were cured in 2005. Most of the cureddefaults were HYCBO securities that had previously been "PIKing" (payment-in-kind) or deferring interest. As thecredit quality of the corporate assets in some CBO collateral pools strengthened, valuations and cash flows increased,enabling cash interest payments to become current. The lifetime cure rate of CDO payment defaults doubled to 18%as of year-end 2005, up from the 9% rate stated in our last year's report.
Payment defaults, if cured, are generally cured within a short time after the initial missed payment. For instance,when CMBS payment defaults have been cured, the time from default to cure has generally been brief, with an averageof three months and a median of just one month. In fact, most payment default cures in ABS, CMBS, and RMBS occurwithin three months of the initial default date. In 2005, the percentage of new defaults that was cured within thiscalendar year was 23%, which was similar to the rate of 26% in 2004. (Because these cured-within-the-year defaults
Figure 5 – Distribution of Impairments by Credit Event, 1993-2005Total 1,095 Impairments
Note: PD stands for payment default.
1. See for example, "Default & Loss Rates of Structured Finance Securities: 1993-2004," Moody's Special Comment, July 2005.
Figure 6 – Distribution of Cured and Uncured Payment Defaults by Sector, 1993-2005All Payment
DefaultsPayment Defaults
UncuredPayment
Defaults CuredCure
PercentageMean Duration of
Cure (months)Median Duration of Cure (months)
US ABS 483 450 33 6.8% 5.7 1.0US CMBS 280 95 185 66.1% 3.1 1.0US RMBS 159 147 12 7.6% 2.5 1.0Global CDOs 325 268 57 17.5% 22.0 22.5European SF ex CDOs 1 1 0 0.0%Total 1,248 961 287 23.0%
Uncured PD, not downgraded to Ca/C,
289, 26%
Downgraded to Ca/C and not yet PD or PD
currently cured, 134, 12%
Uncured PD, and downgraded to Ca/C,
672, 62%
6 Moody’s Special Comment
are not outstanding at year-end, they are not included in the total number of new material impairments regularlyreported for each year-end.)
However, Figure 6 reveals that the cures of CDO defaults took considerably longer (averaging 22 months) thancures in other sectors, partly because CDO bonds have lower payment frequencies (quarterly or semi-annually) andpartly because the valuation of corporate assets may be more volatile than the valuation of other types of collateral.
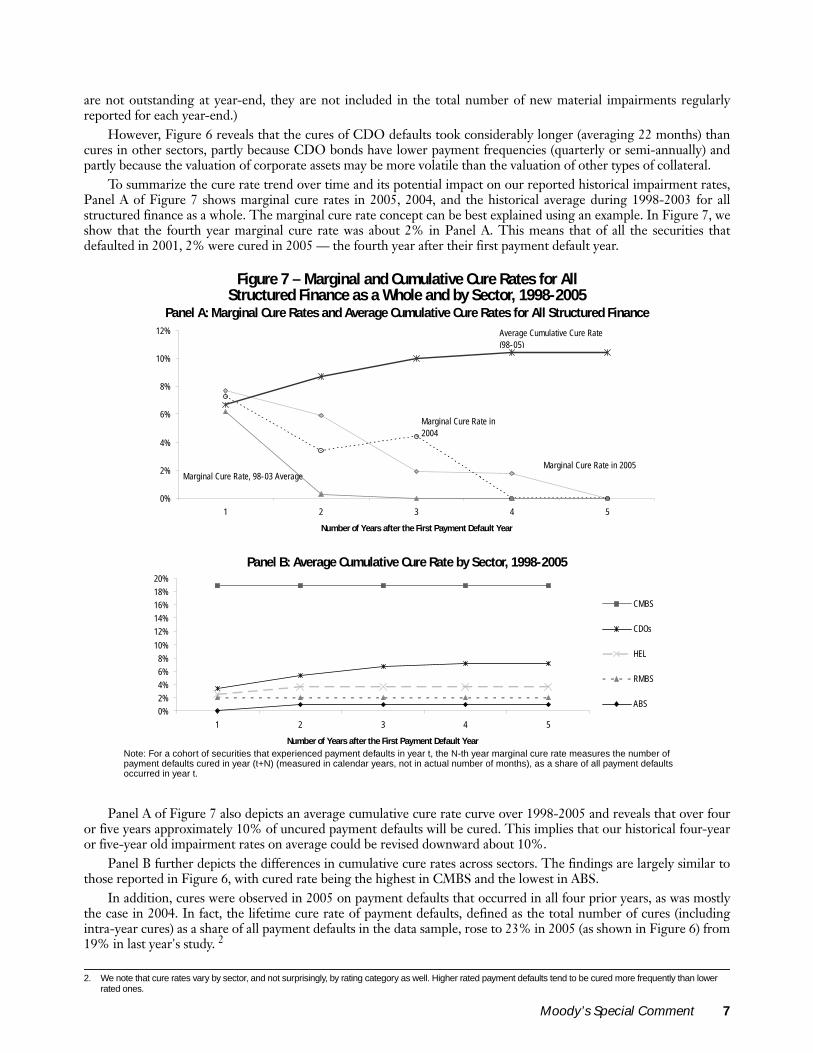
To summarize the cure rate trend over time and its potential impact on our reported historical impairment rates,Panel A of Figure 7 shows marginal cure rates in 2005, 2004, and the historical average during 1998-2003 for allstructured finance as a whole. The marginal cure rate concept can be best explained using an example. In Figure 7, weshow that the fourth year marginal cure rate was about 2% in Panel A. This means that of all the securities thatdefaulted in 2001, 2% were cured in 2005 — the fourth year after their first payment default year.
Panel A of Figure 7 also depicts an average cumulative cure rate curve over 1998-2005 and reveals that over fouror five years approximately 10% of uncured payment defaults will be cured. This implies that our historical four-yearor five-year old impairment rates on average could be revised downward about 10%.
Panel B further depicts the differences in cumulative cure rates across sectors. The findings are largely similar tothose reported in Figure 6, with cured rate being the highest in CMBS and the lowest in ABS.
In addition, cures were observed in 2005 on payment defaults that occurred in all four prior years, as was mostlythe case in 2004. In fact, the lifetime cure rate of payment defaults, defined as the total number of cures (includingintra-year cures) as a share of all payment defaults in the data sample, rose to 23% in 2005 (as shown in Figure 6) from19% in last year's study. 2
Figure 7 – Marginal and Cumulative Cure Rates for All Structured Finance as a Whole and by Sector, 1998-2005
Panel A: Marginal Cure Rates and Average Cumulative Cure Rates for All Structured Finance
Panel B: Average Cumulative Cure Rate by Sector, 1998-2005
Note: For a cohort of securities that experienced payment defaults in year t, the N-th year marginal cure rate measures the number of payment defaults cured in year (t+N) (measured in calendar years, not in actual number of months), as a share of all payment defaults occurred in year t.
2. We note that cure rates vary by sector, and not surprisingly, by rating category as well. Higher rated payment defaults tend to be cured more frequently than lower rated ones.
0%
2%
4%
6%
8%
10%
12%
1 2 3 4 5
Number of Years after the First Payment Default Year
Average Cumulative Cure Rate(98-05)
Marginal Cure Rate in 2004
Marginal Cure Rate in 2005Marginal Cure Rate, 98-03 Average
0%
2%
4%
6%
8%
10%
12%
14%
16%
18%
20%
1 2 3 4 5
Number of Years after the First Payment Default Year
CMBS
CDOs
HEL
RMBS
ABS
Moody’s Special Comment 7

COMPARING REASONS UNDERLYING UNCURED PAYMENT DEFAULTS BY SECTOR For payment defaults that remained uncured, the underlying reasons have varied by sector. In the CMBS sector, 41tranches have suffered principal losses as of year-end 2005, compared with 50 tranches experiencing uncured interestshortfalls (see Figure 8). Historically, a total of 185 CMBS securities recorded some interest shortfalls, but most ofthem were cured.
In the CDO sector, 44 or about 17% of the 257 payment defaults had suffered principal losses. Most of the CDOdefaults were PIKing or simply deferring interests. By contrast, in the ABS and RMBS sectors, defaulted securities thathad experienced only interest shortfalls were a minority, making up 19% of all ABS defaults and only 1% of all RMBSdefaults during the sample period. As we showed in prior-year reports, defaults with principal losses are much lesslikely to be cured than those experiencing only interest shortfalls. 3
Analysis of Material Impairments by Sector, Rating, and Vintage
US ABS: IMPAIRMENT RATES DROPPED PRECIPITOUSLYThe US ABS sector, including HEL, demonstrated much-improved performance in 2005, as the number of newimpairments in the troubled manufactured housing loan, franchise loan, and aircraft and equipment lease categoriesfinally dwindled to single digits. While the number of new HEL impairments exceeded those of other ABS assetclasses, its impairment rate remained very low relative to its large number of securities outstanding (see Figure 9).
3. See Moody's Special Comment, "Default & Loss Rates of Structured Finance Securities: 1993-2004," July 2005.
Figure 8 – Number of Uncured Payment Defaults with Interest Shortfalls and Principal Losses by Sector, 1993-2005
Figure 9 – 2005 US ABS New Impairments by Asset Class, Compared to Their Historical Totals
Number of New Impairments in 2005
Securities Outstanding
in 2005
2005 Impairment
Rate
Number of Impairments, 1993-2005
Securities Issued, 1993-2004
Lifetime Impairment Rate
Autos 0 391 0.0% 10 884 1.1%Cards 0 852 0.0% 12 1,634 0.7%Franchise 6 104 5.8% 60 165 36.4%HEL 20 6,381 0.3% 108 7,640 1.4%Health Care 0 6 0.0% 26 32 81.3%Leases 5 224 2.2% 55 507 10.8%Manu. Housing 3 430 0.7% 261 783 33.3%RVs, Trucks 3 57 5.3% 5 119 4.2%Small Business 3 141 2.1% 4 151 2.6%Other ABS 0 1,024 0.0% 0 1,388 0.0%All US ABS 40 9,610 0.4% 541 13,303 4.1%
Note: RVs are recreational vehicles.
0
50
100
150
200
250
300
350
400
US ABS Global CDOs US RMBS US CMBS
Interest Shortfall Only Principal Losses
8 Moody’s Special Comment

Only three manufactured housing and six franchise loan ABS tranches became newly impaired in 2005, which ismuch fewer than the number of impairments in these categories in recent years. Furthermore, 10 MH tranches thathad previously experienced interest shortfalls (some for more than two years) repaid all their interest shortfalls in 2005and became cured, mainly because the housing market remained strong and recovery values increased. These suggestthat the troubles in these two severely impaired ABS categories finally ran out of steam.
In the aircraft and equipment lease categories, two tranches of an Aircraft Finance Trust transaction missedinterest payments in 2005, and two tranches of a DVI VIII transaction were downgraded to Ca or C, althoughpayment defaults were not yet observed on these two tranches. In addition, one tranche from an aircraft transaction(ALPS 96-1) experienced substantial write-downs in December 2005.
In addition, two ABS tranches backed by the retail installment sales contracts of recreational vehicles (RVs) missedinterest payments in 2005 for the first time. A third tranche from a RV deal was originated by Green Tree andexperienced interest shortfalls first in 2002, but was cured three months later. In 2005, however, this security hassuffered substantial losses of principal.
Finally, three small business loan ABS issued in 2000 and originally sponsored by First International Bank (FIB)were downgraded into the Ca/C category in 2005. The pools underlying these transactions performed poorly as aresult of the manufacturing sector's recession in 2000 and 2001.
By rating at the beginning of the year, no securities rated single-A or above suffered any new impairments in 2005(Figure 10), while the Baa one-year impairment rate was the lowest in five years. The one-year impairment rates in thespeculative-grade categories were also much lower in 2005.
The credit performance of US ABS securities also varied across vintages (Figure 11). Tranches issued in 1999 and2000 performed much more poorly than those issued since 2001. For example, about 20% of the 1999 and 2000vintage Baa tranches were impaired, but only 9% of the Baa-rated securities issued in 2001 were impaired. Tranchesissued in 2002 and 2003 have so far performed very well. The higher impairment rates in the Aa category stemmedmainly from problems in the manufactured housing loan, franchise loan, and health care receivable ABS categories.
Figure 10 – US ABS One-Year Impairment Rates by Rating at the Beginning of the YearRating at the Beginning of the Year 2001 2002 2003 2004 2005
Aaa 0.00% 0.40% 0.00% 0.00% 0.00%Aa 0.37% 1.45% 0.00% 1.42% 0.00%A 0.67% 0.32% 0.27% 0.69% 0.00%Baa 1.84% 2.36% 4.50% 1.52% 0.16%Ba 5.61% 25.38% 18.36% 12.36% 1.71%B 18.35% 24.76% 38.67% 20.69% 7.43%Caa 0.00% 60.87% 42.62% 55.86% 23.03%Investment Grade 0.55% 0.87% 0.96% 0.77% 0.04%Speculative Grade 8.20% 26.25% 24.18% 19.22% 5.64%All Ratings 1.06% 2.51% 2.44% 1.98% 0.42%
Figure 11 – US ABS Lifetime Impairment Rates by Original Rating on Securities Issued during 1999-2003Original Rating 1999 Vintage 2000 Vintage 2001 Vintage 2002 Vintage 2003 Vintage
Aaa 1.5% 1.3% 1.8% 0.5% 0.0%Aa 15.6% 13.1% 5.2% 2.4% 0.3%A 8.8% 9.1% 4.1% 1.0% 0.2%Baa 18.8% 19.4% 8.7% 2.0% 0.1%Ba 50.0% 37.8% 37.3% 13.9% 2.4%B 70.0% 72.7% 0.0% 0.0% 0.0%Caa 0.0% n/a 100.0% n/a n/aInvestment Grade 8.9% 9.0% 4.5% 1.4% 0.1%Speculative Grade 53.7% 44.6% 36.4% 13.2% 2.1%All Ratings 11.3% 11.1% 6.0% 2.0% 0.2%
Note: Lifetime impairment rate is the total number of impaired securities to date as a share of all securities issued. No Caa-rated securities were issued in 2000, 2001, and 2003.
Moody’s Special Comment 9

As documented in our prior reports, impairment rates tend to exhibit seasoning patterns. We found that theseseasoning patterns also differed by rating. Figure 12 depicts that in the US ABS sector, the marginal impairment rates,measured by the number of new impairments as a share of all surviving (not previously impaired or withdrawn)securities at the beginning of a year, peaked in the fourth year for speculative-grade securities, and the fifth year forinvestment-grade securities.
The impairment rate experienced its steepest increase in the first three years after issuance. The differentialsbetween the two marginal impairment rates curves vary from roughly 6% in the second year to about 14% in thefourth year. Moreover, the impairment rates even six years after issuance can be material, as demonstrated by the levelof the curves in the fifth, sixth, and seventh year after issuance.
US HEL: IMPAIRMENT RATES EDGED DOWNThe HEL category has traditionally been categorized as an ABS asset class. In recent years, strong growth has made itthe largest segment within the ABS sector. In this section, we examine its impairment experiences separately.
In 2005, there were 20 new impairments in this sector, compared to 16 in 2004. The one-year impairment ratedropped to a five-year low of 0.3% of all securities outstanding at the beginning of 2005 (Figure 13). The one-yearimpairment rates of securities rated single-A or above have remained low for five years in a row, and the Baaimpairment rate was also on the decline at just 0.2% in 2005.
Most of the new 2005 HEL impairments were originated in 2000 and 2001. All but four involved subprimemortgage as their collateral. The remaining four impaired tranches were either backed by reperforming loans orbacked by nonperforming mortgage loans, which have experienced serious payment difficulties in the past.
Figure 12 – US ABS Marginal Impairment Rates by Years after Issuance, 1993-2005
Figure 13 – HEL One-Year Impairment Rates by Rating at the Beginning of the YearRating at the Beginning of the Year 2001 2002 2003 2004 2005
Aaa 0.00% 0.00% 0.00% 0.00% 0.00%Aa 0.00% 0.00% 0.00% 0.00% 0.00%A 0.41% 0.00% 0.00% 0.12% 0.00%Baa 0.85% 1.15% 1.66% 0.56% 0.20%Ba 3.92% 0.00% 10.14% 3.56% 2.88%B 13.33% 10.17% 17.86% 10.34% 20.00%Caa 0.00% 80.00% 71.43% 40.00% 25.00%Investment Grade 0.30% 0.28% 0.44% 0.19% 0.07%Speculative Grade 6.54% 5.15% 14.29% 5.84% 5.50%All Ratings 0.91% 0.71% 1.29% 0.43% 0.31%
0%
2%
4%
6%
8%
10%
1 2 3 4 5 6 7
Years after Issuance
0%
3%
6%
9%
12%
15%
18%
Spec. Grade (right axis)
Invest. Grade (left axis)
10 Moody’s Special Comment

While the overall performance in the HEL sector has been solid across all vintages, Figure 14 shows that the 1999vintage HEL securities on average performed worse than others. In addition, as of year-end 2005, the lifetimeimpairment rates among the 2001, 2002 and 2003 vintages were particularly low. HEL securities issued since 2003recorded no impairments.
The HEL sector also exhibits some interesting seasoning patterns. Figure 15 depicts the sector's steep increase inthe first four years after issuance in the marginal impairment rate of the speculative-grade category. Like in the USABS sector as a whole, investment-grade marginal impairment rates peaked in the fifth year, and then in the sixth andseven years, remained similar to the fifth year level.
US CMBS: IMPAIRMENT RATES REMAINED LOW The CMBS sector continued to exhibit excellent credit performance overall and a perfect record in the investment-grade category. For the second year in a row, no securities rated investment grade at the beginning of a year becameimpaired within the year (see Figure 16). There were 32 newly impaired tranches from 19 transactions in the CMBSsector, and all but three were conduit deals. The remaining three were large loan deals. Twenty of the impairedtranches were previously impaired, subsequently cured, and became impaired again in 2005. In other words, only 12securities experienced payment defaults for the first time in 2005.
Of the 32 newly impaired CMBS tranches in 2005, 19 were rated Caa, Ca or C as of year-end 2005 and wereexpected to sustain some losses ultimately. Only six of the 32 tranches have so far suffered principal losses.
Figure 14 – HEL Lifetime Impairment Rates by Original Rating on Securities Issued during 1999-2003Original Rating 1999 Vintage 2000 Vintage 2001 Vintage 2002 Vintage 2003 Vintage
Aaa 0.0% 0.0% 0.0% 0.0% 0.0%Aa 0.0% 0.0% 0.0% 0.0% 0.0%A 0.0% 2.8% 0.7% 0.0% 0.0%Baa 8.5% 11.4% 6.2% 0.7% 0.0%Ba 40.0% 0.0% 17.2% 4.2% 0.0%B 71.4% 0.0% 0.0% 0.0% 0.0%Caa n/a n/a n/a n/a n/aInvestment Grade 2.2% 3.5% 1.8% 0.2% 0.0%Speculative Grade 52.9% 0.0% 16.1% 3.8% 0.0%All Ratings 6.7% 3.3% 2.6% 0.3% 0.0%
Note: Lifetime impairment rate is the total number of impaired securities (to date) as a share of all securities issued.
Figure 15 – HEL Marginal Impairment Rates by Years after Issuance, 1993-2005
0%
2%
4%
6%
8%
10%
1 2 3 4 5 6 7
Years after Issuance
0%
3%
6%
9%
12%
15%
18%
Spec. Grade (right axis)
Invest. Grade (left axis)
Moody’s Special Comment 11

By rating at the beginning of the year, the one-year impairment rate in the speculative-grade category inched upto 2.9% in 2005 from 2.6% in 2004.
Within the CMBS sector, the 2000 vintage performed worse than other vintages (Figure 17).4 There were 28impaired securities in that vintage, and 14 of them experienced principal losses or were downgraded to Ca or C andwere expected to sustain significant principal losses. As a result, the lifetime impairment rates in both the investment-grade and speculative-grade categories were higher in the 2000 vintage than in other vintages.
The seasoning patterns of the marginal impairment rates for CMBS shared some similarities with those in theHEL sector, although there were also important distinctions. In the speculative-grade category, the marginalimpairment rates increased significantly over the first five years after issuance, peaking in the fifth year. By comparison,the marginal impairment rates for HEL peaked in the fourth year (see Figure 18).
In the investment-grade category, the seasoning pattern was much weaker because of the very small number ofimpairments in this CMBS category. Nonetheless, the marginal impairment rates increased in the first three yearsafter issuance before declining to zero in the fourth year.
Figure 16 – US CMBS One-Year Impairment Rates by Rating at the Beginning of the YearRating at the Beginning of the Year 2001 2002 2003 2004 2005
Aaa 0.00% 0.00% 0.00% 0.00% 0.00%Aa 0.00% 0.00% 0.00% 0.00% 0.00%A 0.00% 0.00% 0.23% 0.00% 0.00%Baa 0.00% 0.37% 1.05% 0.00% 0.00%Ba 1.23% 0.40% 0.81% 0.00% 1.07%B 1.86% 2.60% 2.50% 3.66% 2.59%Caa 5.88% 0.00% 20.00% 23.68% 21.88%Investment Grade 0.00% 0.14% 0.44% 0.00% 0.00%Speculative Grade 1.74% 1.39% 2.34% 2.56% 2.89%All Ratings 0.44% 0.46% 0.98% 0.77% 0.90%
4. See additional discussions in the CMBS section of Moody's Special Comment, "Structured Finance Rating Transitions: 1983-2005," February 2006.
Figure 17 – US CMBS Lifetime Impairment Rates by Original Rating on Securities Issued during 1999-2003Original Rating 1999 Vintage 2000 Vintage 2001 Vintage 2002 Vintage 2003 Vintage
Aaa 0.0% 0.0% 0.0% 0.0% 0.0%Aa 0.0% 0.0% 0.0% 0.0% 0.0%A 0.0% 2.4% 0.0% 0.0% 0.0%Baa 0.0% 3.7% 2.4% 0.0% 0.0%Ba 0.0% 3.1% 6.7% 2.7% 0.0%B 17.9% 25.0% 14.3% 3.3% 1.1%Caa 44.4% 33.3% 33.3% 0.0% 0.0%Investment Grade 0.0% 2.1% 1.1% 0.0% 0.0%Speculative Grade 12.0% 14.5% 10.5% 2.9% 0.5%All Ratings 3.4% 5.6% 3.6% 0.9% 0.1%
Note: Lifetime impairment rate is the total number of impaired securities to date as a share of all securities issued.
12 Moody’s Special Comment

US RMBS: IMPAIRMENT RATES ROSE IN THE SPECULATIVE-GRADE CATEGORYSimilar to the CMBS sector, the RMBS sector, which mainly includes transactions backed by prime and Alt-Aresidential mortgages, demonstrated superb credit performance in recent years. Nine securities were impaired for thefirst time in 2005, and two (backed by Quality Mortgage USA Inc. loans, which contributed to most of the RMBSimpairments in our data sample) were previously impaired, subsequently cured, and then became impaired again in2005, resulting in a total of 11 new impairments in this sector in 2005.
The nine newly impaired RMBS tranches involved just five transactions, of which four were backed by pools witha considerable proportion of Alt-A mortgage loans. All but one of these nine impaired tranches were downgraded tothe Ca or C category, either because they had already experienced significant principal losses, or were expected shortly.
By rating at the beginning of the year, the 2005 impairment rates remained at low levels in the investment-gradecategories. In the speculative-grade category, while the overall level was still low, the impairment rate did edge up to1.5% in 2005 from 0.6% in 2004 (Figure 19).
Across vintages, securities issued in 1999, 2000 and 2003 had perfect payment records with no impairments todate. The performance of the 2001 and 2002 vintages was largely similar (see Figure 20).
Figure 18 – US CMBS Marginal Impairment Rates by Years after Issuance, 1993-2005
Figure 19 – US RMBS One-Year Impairment Rates by Rating at the Beginning of the YearRating at the Beginning of the Year 2001 2002 2003 2004 2005
Aaa 0.00% 0.00% 0.00% 0.00% 0.00%Aa 0.00% 0.00% 0.00% 0.00% 0.00%A 0.00% 0.00% 0.21% 0.54% 0.00%Baa 0.31% 0.51% 0.40% 0.19% 0.40%Ba 1.27% 0.58% 0.87% 0.77% 1.19%B 3.33% 1.00% 0.00% 0.57% 1.46%Caa 16.67% 0.00% 20.00% 0.00% 28.57%Investment Grade 0.05% 0.09% 0.09% 0.11% 0.07%Speculative Grade 2.34% 0.68% 0.69% 0.64% 1.45%All Ratings 0.33% 0.15% 0.17% 0.17% 0.21%
0%
1%
2%
3%
4%
5%
6%
1 2 3 4 5 6 7
Years after Issuance
Spec. Grade
Invest. Grade
Moody’s Special Comment 13

Using all the data in the sample, Figure 21 reports a seasoning pattern of marginal impairment rates in the RMBSsector that is different from those in the HEL and CMBS sectors (Figures 15 and 18).
First, there was a clean hump in the marginal impairment rates of RMBS tranches. The impairment rates peakedin the fourth year for both investment-grade and speculative-grade securities, before declining precipitously in thefifth and sixth years after issuance.
Second, compared to the HEL and CMBS marginal impairment rates, the RMBS marginal impairment rates weremore front-loaded. The impairment rates jumped in the third year after issuance in the speculative-grade category, andthe fourth year after issuance in the investment-grade category. More importantly, the marginal impairment rates weresignificantly lower in the sixth and seventh years than those in the third and fourth years after issuance.
GLOBAL CDOs: IMPAIRMENT RATES PLUNGED ACROSS ALL CATEGORIES2005 was a banner year for global CDOs with just 15 newly impaired tranches, representing 0.3% of the total of 4,494tranches outstanding. In fact, the 0.3% one-year impairment rate was the lowest since 1998 in this sector.
All but one of these new impairments were CDO tranches backed mainly by other structured finance securities(SF CDOs) (see Figure 22). Tranches from balance-sheet CDOs, CBOs, synthetic arbitrage CDOs, and other types ofCDOs such as preferred-stock CDOs and market-value CDOs reported no new impairments. By comparison, thelifetime impairment rates were much higher with 29.4% among HY CBOs, and 4.7% among SF CDOs.
Figure 20 – US RMBS Lifetime Impairment Rates by Original Rating on Securities Issued during 1999-2003Original Rating 1999 Vintage 2000 Vintage 2001 Vintage 2002 Vintage 2003 Vintage
Aaa 0.0% 0.0% 0.0% 0.0% 0.0%Aa 0.0% 0.0% 0.0% 0.0% 0.0%A 0.0% 0.0% 0.0% 1.9% 0.0%Baa 0.0% 0.0% 1.8% 0.5% 0.0%Ba 0.0% 0.0% 4.7% 1.7% 0.0%B 0.0% 0.0% 3.2% 2.4% 0.0%Caa n/a n/a n/a n/a n/aInvestment Grade 0.0% 0.0% 0.3% 0.5% 0.0%Speculative Grade 0.0% 0.0% 4.1% 2.0% 0.0%All Ratings 0.0% 0.0% 0.7% 0.7% 0.0%
Note: Lifetime impairment rate is the total number of impaired securities to date as a share of all securities issued.
Figure 21 – US RMBS Marginal Impairment Rates by Years after Issuance, 1993-2005
0%
1%
2%
3%
4%
5%
1 2 3 4 5 6 7
Years after Issuance
Spec. Grade
Invest. Grade
14 Moody’s Special Comment
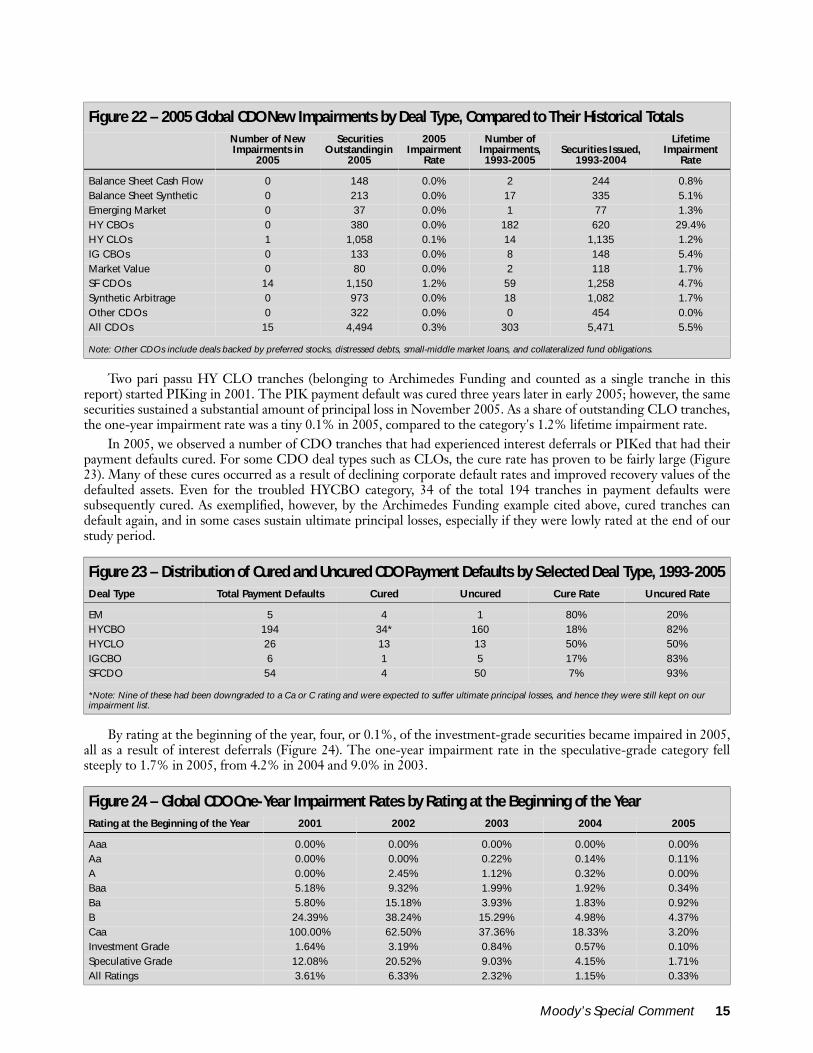
Two pari passu HY CLO tranches (belonging to Archimedes Funding and counted as a single tranche in thisreport) started PIKing in 2001. The PIK payment default was cured three years later in early 2005; however, the samesecurities sustained a substantial amount of principal loss in November 2005. As a share of outstanding CLO tranches,the one-year impairment rate was a tiny 0.1% in 2005, compared to the category's 1.2% lifetime impairment rate.
In 2005, we observed a number of CDO tranches that had experienced interest deferrals or PIKed that had theirpayment defaults cured. For some CDO deal types such as CLOs, the cure rate has proven to be fairly large (Figure23). Many of these cures occurred as a result of declining corporate default rates and improved recovery values of thedefaulted assets. Even for the troubled HYCBO category, 34 of the total 194 tranches in payment defaults weresubsequently cured. As exemplified, however, by the Archimedes Funding example cited above, cured tranches candefault again, and in some cases sustain ultimate principal losses, especially if they were lowly rated at the end of ourstudy period.
By rating at the beginning of the year, four, or 0.1%, of the investment-grade securities became impaired in 2005,all as a result of interest deferrals (Figure 24). The one-year impairment rate in the speculative-grade category fellsteeply to 1.7% in 2005, from 4.2% in 2004 and 9.0% in 2003.
Figure 22 – 2005 Global CDO New Impairments by Deal Type, Compared to Their Historical TotalsNumber of New Impairments in
2005
Securities Outstanding in
2005
2005 Impairment
Rate
Number of Impairments, 1993-2005
Securities Issued, 1993-2004
Lifetime Impairment
Rate
Balance Sheet Cash Flow 0 148 0.0% 2 244 0.8%Balance Sheet Synthetic 0 213 0.0% 17 335 5.1%Emerging Market 0 37 0.0% 1 77 1.3%HY CBOs 0 380 0.0% 182 620 29.4%HY CLOs 1 1,058 0.1% 14 1,135 1.2%IG CBOs 0 133 0.0% 8 148 5.4%Market Value 0 80 0.0% 2 118 1.7%SF CDOs 14 1,150 1.2% 59 1,258 4.7%Synthetic Arbitrage 0 973 0.0% 18 1,082 1.7%Other CDOs 0 322 0.0% 0 454 0.0%All CDOs 15 4,494 0.3% 303 5,471 5.5%
Note: Other CDOs include deals backed by preferred stocks, distressed debts, small-middle market loans, and collateralized fund obligations.
Figure 23 – Distribution of Cured and Uncured CDO Payment Defaults by Selected Deal Type, 1993-2005Deal Type Total Payment Defaults Cured Uncured Cure Rate Uncured Rate
EM 5 4 1 80% 20%HYCBO 194 34* 160 18% 82%HYCLO 26 13 13 50% 50%IGCBO 6 1 5 17% 83%SFCDO 54 4 50 7% 93%
*Note: Nine of these had been downgraded to a Ca or C rating and were expected to suffer ultimate principal losses, and hence they were still kept on our impairment list.
Figure 24 – Global CDO One-Year Impairment Rates by Rating at the Beginning of the YearRating at the Beginning of the Year 2001 2002 2003 2004 2005
Aaa 0.00% 0.00% 0.00% 0.00% 0.00%Aa 0.00% 0.00% 0.22% 0.14% 0.11%A 0.00% 2.45% 1.12% 0.32% 0.00%Baa 5.18% 9.32% 1.99% 1.92% 0.34%Ba 5.80% 15.18% 3.93% 1.83% 0.92%B 24.39% 38.24% 15.29% 4.98% 4.37%Caa 100.00% 62.50% 37.36% 18.33% 3.20%Investment Grade 1.64% 3.19% 0.84% 0.57% 0.10%Speculative Grade 12.08% 20.52% 9.03% 4.15% 1.71%All Ratings 3.61% 6.33% 2.32% 1.15% 0.33%
Moody’s Special Comment 15

CDO performance also improved steadily across vintages, as the lifetime impairment rates dropped from 20.6%within the 1999 vintage to 1.5% and 0% within the 2002 and 2003 vintages (see Figure 25). In addition, theseimprovements were evident across all rating categories.
Figure 26 describes the seasoning patterns of CDO marginal impairment rates. The marginal impairment ratesrose steadily in the first four years before they declined in the fifth year in both the speculative-grade and investment-grade categories. Similar to our findings in the ABS and HEL sectors, the marginal impairment rates in the fifth andsixth years after issuance were significantly above zero.
By comparison, the marginal impairment rates of CDOs excluding HYCBOs were much lower, and declined tozero in the sixth and seventh year for both the investment-grade and speculative-grade categories (see Figure 27).
Figure 25 – Global CDO Lifetime Impairment Rates by Original Rating on Securities Issued during 1999-2003Original Rating 1999 Vintage 2000 Vintage 2001 Vintage 2002 Vintage 2003 Vintage
Aaa 0.0% 0.0% 0.0% 0.0% 0.0%Aa 3.2% 2.4% 1.5% 0.0% 0.0%A 12.7% 10.2% 1.9% 1.0% 0.0%Baa 35.2% 20.6% 15.6% 3.2% 0.0%Ba 40.7% 29.1% 11.0% 6.6% 0.0%B 59.3% 22.2% 12.5% 0.0% 0.0%CaaInvestment Grade 13.9% 8.7% 5.1% 1.0% 0.0%Speculative Grade 46.5% 28.4% 11.1% 6.2% 0.0%All Ratings 20.6% 11.8% 6.0% 1.5% 0.0%
Note: Lifetime impairment rate is the total number of impaired securities to date as a share of all securities issued.
Figure 26 – Global CDO Marginal Impairment Rates by Years after Issuance, 1993-2005
0%
2%
4%
6%
8%
10%
12%
14%
16%
1 2 3 4 5 6 7
Years after Issuance
Spec. Grade
Invest. Grade
16 Moody’s Special Comment
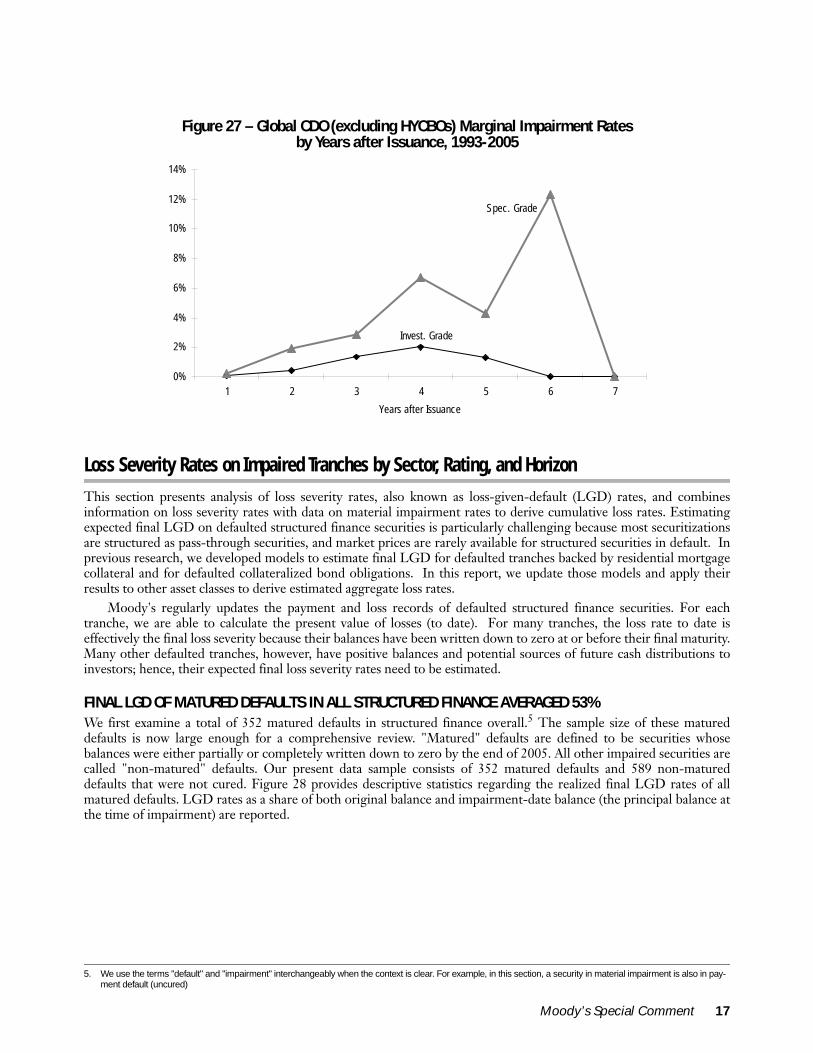
Loss Severity Rates on Impaired Tranches by Sector, Rating, and Horizon
This section presents analysis of loss severity rates, also known as loss-given-default (LGD) rates, and combinesinformation on loss severity rates with data on material impairment rates to derive cumulative loss rates. Estimatingexpected final LGD on defaulted structured finance securities is particularly challenging because most securitizationsare structured as pass-through securities, and market prices are rarely available for structured securities in default. Inprevious research, we developed models to estimate final LGD for defaulted tranches backed by residential mortgagecollateral and for defaulted collateralized bond obligations. In this report, we update those models and apply theirresults to other asset classes to derive estimated aggregate loss rates.
Moody's regularly updates the payment and loss records of defaulted structured finance securities. For eachtranche, we are able to calculate the present value of losses (to date). For many tranches, the loss rate to date iseffectively the final loss severity because their balances have been written down to zero at or before their final maturity.Many other defaulted tranches, however, have positive balances and potential sources of future cash distributions toinvestors; hence, their expected final loss severity rates need to be estimated.
FINAL LGD OF MATURED DEFAULTS IN ALL STRUCTURED FINANCE AVERAGED 53%We first examine a total of 352 matured defaults in structured finance overall.5 The sample size of these matureddefaults is now large enough for a comprehensive review. "Matured" defaults are defined to be securities whosebalances were either partially or completely written down to zero by the end of 2005. All other impaired securities arecalled "non-matured" defaults. Our present data sample consists of 352 matured defaults and 589 non-matureddefaults that were not cured. Figure 28 provides descriptive statistics regarding the realized final LGD rates of allmatured defaults. LGD rates as a share of both original balance and impairment-date balance (the principal balance atthe time of impairment) are reported.
Figure 27 – Global CDO (excluding HYCBOs) Marginal Impairment Rates by Years after Issuance, 1993-2005
5. We use the terms "default" and "impairment" interchangeably when the context is clear. For example, in this section, a security in material impairment is also in pay-ment default (uncured)
0%
2%
4%
6%
8%
10%
12%
14%
1 2 3 4 5 6 7
Years after Issuance
Spec. Grade
Invest. Grade
Moody’s Special Comment 17

6
The descriptive statistics have at least three notable implications:First, impaired tranches that were rated higher experienced lower loss severity. In particular, those rated Aaa lost
only a tiny fraction (3%) of their original balance, while those rated Aa lost less than 30% of their original balance. 7The impaired tranches that were rated single-B and Caa at origination had much higher loss severity rates than werethose rated single-A, Baa and Ba.
Second, the distribution of LGD rates within certain rating categories was skewed. For example, the median LGDrates of Aa-rated securities were much lower than their means, suggesting that more than half of the impaired Aa-securities suffered LGD rates that were lower than their means. In addition, the medians were higher than the meansin the Baa, Ba and single-B categories, implying that in these categories there were more than half of the securitieswith LGD rates higher than their means.
Third, by rating at impairment, securities rated Aa suffered only minor losses, but those rated Baa or below lost asignificant amount with their medians at above 90% of their impairment-date balance.
In addition to the differentiation of LGD rates by rating, there were also large differences across sectors amongmatured defaults. Figure 29 summarizes the final LGD rates by sector and reveals three interesting findings.
First, for impaired tranches that were rated investment grade, the LGD rates were the lowest in the CMBS sectorand the highest in the ABS sector.8 The LGD rates of impaired RMBS and HEL tranches were generally betweenthose in the ABS and CMBS categories, and the average RMBS LGD rates were lower than the average HEL LGDrates. Additionally, CDO tranches that were impaired and carried an investment-grade rating at origination generallyexperienced LGD rates that were lower than those of ABS tranches but higher than those of RMBS and HELtranches.
Second, for impaired tranches that were rated speculative grade, the LGD rates were much lower in the RMBSand HEL sectors than in the ABS and CDO sectors. The LGD rates of speculative-grade securities in the CMBSsector were ranked in between those of RMBS/HEL and ABS/CDOs.
Third, the variation of final LGD rates within the investment-grade and speculative-grade categories differedacross sectors. The standard deviation of LGD rates was much larger in both rating grade categories in the CDOsector than in the ABS sector, whereas those in the CMBS, HEL, and RMBS sectors appeared to be similar.
Figure 28 – Realized Final LGD Rates by Rating for All Matured Defaults in the All Structured Finance Category, 1993-20056
By original rating (% of original balance) By rating at impairment (% of impairment-date balance)Rating at origination Counts Mean Median Std Dev
Rating at impairment Counts Mean Median Std Dev
Aaa 6 2.6% 2.9% 1.1% Aaa 0Aa 15 28.4% 15.0% 28.5% Aa 1 2.8% 2.8% n/aA 29 52.0% 69.2% 32.7% A 7 47.5% 22.9% 45.4%Baa 137 51.7% 58.8% 31.4% Baa 53 63.0% 94.6% 41.2%Ba 93 53.9% 60.7% 33.1% Ba 90 72.0% 93.9% 36.7%B 70 63.8% 73.1% 32.3% B 103 74.0% 94.0% 35.0%Caa 2 78.1% 78.1% 9.5% Caa 98 72.0% 83.7% 34.5%Investment Grade 187 48.3% 53.4% 32.5% Investment Grade 61 60.2% 93.7% 41.9%Speculative Grade 165 58.4% 67.9% 32.9% Speculative Grade 291 72.7% 92.9% 35.3%All Rating 352 53.0% 64.8% 33.0% All Rating 352 70.5% 92.9% 36.8%
6. In a Moody's Special Comment, "Measuring Loss Severity Rates of Defaulted Residential Mortgage-Backed Securities: A Methodology," we compared LGD rates of matured and non-matured tranches, and found that there was a survival bias in the sense that non-matured defaults were expected to sustain lower final LGD rates than were matured defaults.
7. Impaired health care receivable ABS tranches involving a number of NPF transactions were not included in this calculation.8. Most of the investment-grade impairments were Baa-rated. Therefore, the contrast of LGD rates across sectors reflects their differences at the Baa rating level as well.
18 Moody’s Special Comment
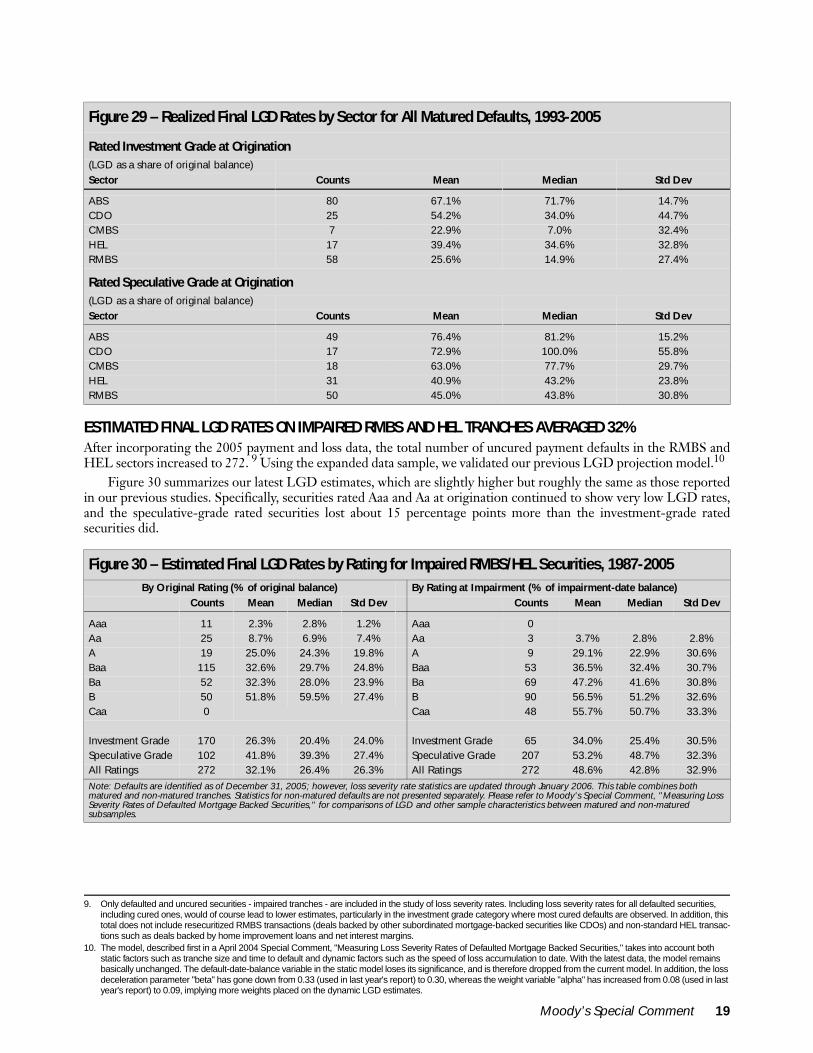
ESTIMATED FINAL LGD RATES ON IMPAIRED RMBS AND HEL TRANCHES AVERAGED 32%After incorporating the 2005 payment and loss data, the total number of uncured payment defaults in the RMBS andHEL sectors increased to 272. 9 Using the expanded data sample, we validated our previous LGD projection model.10
Figure 30 summarizes our latest LGD estimates, which are slightly higher but roughly the same as those reportedin our previous studies. Specifically, securities rated Aaa and Aa at origination continued to show very low LGD rates,and the speculative-grade rated securities lost about 15 percentage points more than the investment-grade ratedsecurities did.
Figure 29 – Realized Final LGD Rates by Sector for All Matured Defaults, 1993-2005
Rated Investment Grade at Origination(LGD as a share of original balance)Sector Counts Mean Median Std Dev
ABS 80 67.1% 71.7% 14.7%CDO 25 54.2% 34.0% 44.7%CMBS 7 22.9% 7.0% 32.4%HEL 17 39.4% 34.6% 32.8%RMBS 58 25.6% 14.9% 27.4%
Rated Speculative Grade at Origination(LGD as a share of original balance)Sector Counts Mean Median Std Dev
ABS 49 76.4% 81.2% 15.2%CDO 17 72.9% 100.0% 55.8%CMBS 18 63.0% 77.7% 29.7%HEL 31 40.9% 43.2% 23.8%RMBS 50 45.0% 43.8% 30.8%
9. Only defaulted and uncured securities - impaired tranches - are included in the study of loss severity rates. Including loss severity rates for all defaulted securities, including cured ones, would of course lead to lower estimates, particularly in the investment grade category where most cured defaults are observed. In addition, this total does not include resecuritized RMBS transactions (deals backed by other subordinated mortgage-backed securities like CDOs) and non-standard HEL transac-tions such as deals backed by home improvement loans and net interest margins.
10. The model, described first in a April 2004 Special Comment, "Measuring Loss Severity Rates of Defaulted Mortgage Backed Securities," takes into account both static factors such as tranche size and time to default and dynamic factors such as the speed of loss accumulation to date. With the latest data, the model remains basically unchanged. The default-date-balance variable in the static model loses its significance, and is therefore dropped from the current model. In addition, the loss deceleration parameter "beta" has gone down from 0.33 (used in last year's report) to 0.30, whereas the weight variable "alpha" has increased from 0.08 (used in last year's report) to 0.09, implying more weights placed on the dynamic LGD estimates.
Figure 30 – Estimated Final LGD Rates by Rating for Impaired RMBS/HEL Securities, 1987-2005By Original Rating (% of original balance) By Rating at Impairment (% of impairment-date balance)
Counts Mean Median Std Dev Counts Mean Median Std Dev
Aaa 11 2.3% 2.8% 1.2% Aaa 0Aa 25 8.7% 6.9% 7.4% Aa 3 3.7% 2.8% 2.8%A 19 25.0% 24.3% 19.8% A 9 29.1% 22.9% 30.6%Baa 115 32.6% 29.7% 24.8% Baa 53 36.5% 32.4% 30.7%Ba 52 32.3% 28.0% 23.9% Ba 69 47.2% 41.6% 30.8%B 50 51.8% 59.5% 27.4% B 90 56.5% 51.2% 32.6%Caa 0 Caa 48 55.7% 50.7% 33.3%
Investment Grade 170 26.3% 20.4% 24.0% Investment Grade 65 34.0% 25.4% 30.5%Speculative Grade 102 41.8% 39.3% 27.4% Speculative Grade 207 53.2% 48.7% 32.3%All Ratings 272 32.1% 26.4% 26.3% All Ratings 272 48.6% 42.8% 32.9%Note: Defaults are identified as of December 31, 2005; however, loss severity rate statistics are updated through January 2006. This table combines both matured and non-matured tranches. Statistics for non-matured defaults are not presented separately. Please refer to Moody's Special Comment, "Measuring Loss Severity Rates of Defaulted Mortgage Backed Securities," for comparisons of LGD and other sample characteristics between matured and non-matured subsamples.
Moody’s Special Comment 19

ESTIMATED FINAL LGD RATES ON IMPAIRED CDO TRANCHES AVERAGED 72%In our first study of CDO defaults and losses, we derived a simple model to project final LGD rates for defaulted high-yield CBO tranches, which have historically experienced the greatest number of defaults within the broader CDOsector. At present, we continue to use the same model we derived for CBOs and apply it to all impaired cash SF CDOsand CLOs.11 Figure 31 summarizes the estimated final LGD rates of all impaired CDOs including both matured andnon-matured, cash and synthetic securities, some of which were from European transactions.
Figure 31 reveals several interesting findings about LGDs of impaired CDO tranches:• LGD rates have varied systematically with original rating levels – single-B and Ba rated securities have
experienced higher LGDs than securities rated Baa and single-A, which in turn have higher LGDs than Aa-rated securities.
• In contrast, LGD rates by impairment date balance were generally at similarly high levels across the variousrating categories at the time of impairment.
• The median LGD rates were higher than the mean LGD rates for almost all rating categories except Aa,implying that there were more than half of the securities with LGD rates higher than the means.
• While the average LGD rates in the speculative-grade category were similar both as a share of originalbalance and as a share of impairment-date balance, in the investment-grade category, the LGD rates as ashare of impairment-date balance averaged much higher than those as a share of original balance. This islargely the result of amortization (occurring first to more senior tranches) that made principal balancessmaller than the balance at origination by the time the securities experienced impairments.
The LGD rates on impaired CDO tranches also varied by deal type. Figure 32 highlights the similarities anddifferences in the estimated final LGD rates across four CDO deal types. In particular, the LGD rates were similarbetween CBOs (including both HY CBOs and Investment-Grade CBOs) and SF CDOs in the investment-gradecategory. In this same category, the LGD rates of impaired CLO and synthetic arbitrage tranches were much lowerthan those of CBOs and SFCDOs. In the speculative-grade category, however, the LGD rates of CBOs and SF CDOswere similar, and higher than those of CLOs and synthetic arbitrage CDOs.
11. See "Default & Loss Rates of U.S. CDOs: 1993-2003," Moody's Special Comment, March 2005. The model uses the weighted average rating factor (WARF) and the weighted average maturity (WAM), as reported by Moody's deal performance reports, to find the weighted average loss rates expected in the pool. These expected pool loss rates are used to adjust the 2005 year-end OC ratios, after taking into account the potential excess interests that would become available in the deal, if any excess exists. The adjusted OC ratios are then used to derive future payments available to the impaired tranches and compute the tranches' projected loss rates.
Figure 31 – Estimated Final LGD Rates by Rating for Impaired CDO Securities, 1993-2005By original rating (% of original balance) By rating at impairment (% of impairment-date balance)
Counts Mean median Std Dev Counts Mean median Std Dev
Aaa 0 Aaa 0Aa 8 38.8% 33.8% 30.8% Aa 0A 18 64.3% 82.6% 38.0% A 12 79.8% 100.0% 38.8%Baa 132 66.8% 79.0% 33.3% Baa 56 88.2% 100.0% 29.1%Ba 56 81.0% 100.0% 31.0% Ba 56 88.8% 100.0% 29.1%B 36 89.2% 100.0% 23.8% B 70 81.5% 100.0% 34.3%Caa 0 Caa 56 80.6% 100.0% 33.3%
Investment Grade 158 65.1% 78.6% 34.1% Investment Grade 68 86.7% 100.0% 30.9%Speculative Grade 92 84.2% 100.0% 28.5% Speculative Grade 182 83.5% 100.0% 32.5%All Ratings 250 72.1% 84.3% 33.4% All Ratings 250 84.4% 100.0% 32.0%Note: Defaults are identified as of December 31, 2005; however, loss severity rate statistics are updated through January 2006. This table combines both matured and non-matured tranches. The sample size is smaller than the total number of impaired tranches in this sector because some impaired tranches lack complete information for predicting final LGD rates. Statistics for non-matured defaults are not presented separately. Please refer to Moody's Special Comment, "Measuring Loss Severity Rates of Defaulted Mortgage Backed Securities," for comparisons of LGD and other sample characteristics between matured and non-matured subsamples.
20 Moody’s Special Comment
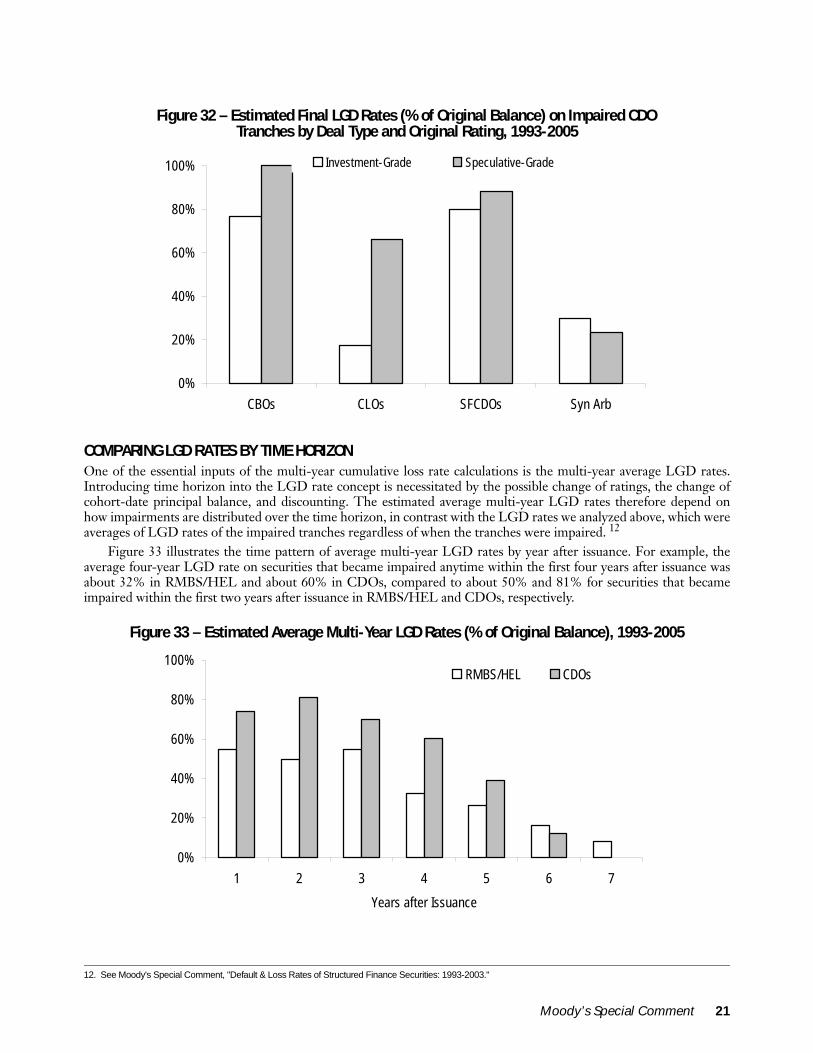
COMPARING LGD RATES BY TIME HORIZONOne of the essential inputs of the multi-year cumulative loss rate calculations is the multi-year average LGD rates.Introducing time horizon into the LGD rate concept is necessitated by the possible change of ratings, the change ofcohort-date principal balance, and discounting. The estimated average multi-year LGD rates therefore depend onhow impairments are distributed over the time horizon, in contrast with the LGD rates we analyzed above, which wereaverages of LGD rates of the impaired tranches regardless of when the tranches were impaired. 12
Figure 33 illustrates the time pattern of average multi-year LGD rates by year after issuance. For example, theaverage four-year LGD rate on securities that became impaired anytime within the first four years after issuance wasabout 32% in RMBS/HEL and about 60% in CDOs, compared to about 50% and 81% for securities that becameimpaired within the first two years after issuance in RMBS/HEL and CDOs, respectively.
Figure 32 – Estimated Final LGD Rates (% of Original Balance) on Impaired CDO Tranches by Deal Type and Original Rating, 1993-2005
12. See Moody's Special Comment, "Default & Loss Rates of Structured Finance Securities: 1993-2003."
Figure 33 – Estimated Average Multi-Year LGD Rates (% of Original Balance), 1993-2005
0%
20%
40%
60%
80%
100%
CBOs CLOs SFCDOs Syn Arb
Investment-Grade Speculative-Grade
0%
20%
40%
60%
80%
100%
1 2 3 4 5 6 7
Years after Issuance
RMBS/HEL CDOs
Moody’s Special Comment 21

In addition to the original-rating-based impairment rate and LGD rates, Moody's also provides cohort-ratingbased impairment rate and LGD rates. Figure 34 compares the four-year LGD rates as a share of cohort-datebalances, i.e. the principal balances at the beginning of the impairment year and of each of the years prior to theobserved impairments. Figure 34 reveals that the cohort ratings, i.e. ratings at the beginning of a year, ranked-orderLGD rates better in the RMBS/HEL sector than in the CDO sector.
Multi-Year Cumulative Loss Rates by Rating and Sector
Multi-year cumulative loss rates are the product of multi-year cumulative impairment rates and multi-year cumulativeLGD rates. To derive these multi-year loss rates, we continue to use the approach we employed in our previous report;namely, we combine the estimated LGD rates of non-matured impairments and the realized final LGD rates ofmatured impairments to derive the average LGD rates in the RMBS/HEL and CDO sectors. Further, we apply:• the estimated LGD rates based on impaired RMBS and HEL tranches to the calculation of loss rates in the
RMBS, HEL, RMBS/HEL sectors combined, and the CMBS sector;• the estimated LGD rates based on impaired CDO tranches to the calculation of loss rates in the CDO sector; • the equally-weighted averages of LGD rates in RMBS/HEL and CDOs to the calculation of loss rates in the ABS
sector as well as in the all structured finance category. Figure 35 provides the resulting estimated five-year cumulative loss rates by rating, with comparisons between
original-rating and cohort-rating-based loss rates in structured finance and those in the corporate sector. Detailedmulti-year cumulative loss rates by rating, horizon, and sector appear in Appendix 3.
Figure 34 – Estimated Average Four-Year LGD Rates (% of Cohort-Date Balance) by Cohort Rating, 1993-2005
Note: Cohort ratings are ratings on securities outstanding at the beginning of a cohort horizon (four-year horizon in this Figure), regardless of when they were issued. The four-year LGD rates are the averages of realized LGD rates on tranches impaired in each of the four years, weighted by the incremental impairment rates of each year.
0%
20%
40%
60%
80%
100%
Aaa Aa A Baa Ba B
Cohort Rating
RMBS/HEL CDOs
22 Moody’s Special Comment

Moody’s Special Comment 23
These newly estimated loss rates by rating are largely similar to what we provided in previous reports. Inparticular:
• The estimated five-year loss rates continued to be increasing as ratings decrease, and the relationshipbetween loss rates and ratings was similar between those measured by cohort rating and those measured byoriginal rating.
• Moody's continues to observe generally higher loss rates when measured by cohort rating than by originalrating in the all structured finance category. It is important to note that this ordering of loss rates betweencohort rating and original rating does not hold for all asset classes and all time horizons.
• Estimated loss rates by original rating are slightly higher, relative to those in last year's report, mostly due tothe increases in the estimated LGD rates at the fourth and fifth year horizons. By contrast, the estimatedloss rates by cohort rating declined a bit, relative to our previously reported numbers.
• Estimated loss rates remain higher in structured finance as a whole than in the corporate sector. Variationscontinued to persist across different structured finance sectors, with the CMBS and RMBS sectorsdemonstrating the lowest loss rates by rating (Figure 36).
Finally, it is important to note that all statistics presented in this report so far are not weighted by dollar volume,and we generally do not provide volume-based impairment and loss rates. Using the same data underlying Figure 35(details appear in Appendix 3) and weighting them by the total original balances in each rating category, we find thatoverall five-year loss rates as a share of original balance averaged about 49 basis points for all securities combined – 1.7basis points in the Aaa category, 2.3% for non-Aaa investment-grade securities, and 10.6% for speculative-gradesecurities. 13
Figure 35 – Estimated Five-Year Cumulative Loss Rates by Rating for All Structured Finance, 1993-2005Global Structured Finance, Global Structured Finance, Global Corporate,
By Original Rating By Cohort Rating by Cohort Rating
Aaa 0.017% 0.019% 0.004%Aa 0.74% 0.85% 0.08%A 1.78% 1.40% 0.23%Baa 5.81% 6.92% 1.24%Ba 8.65% 11.97% 7.04%B 16.22% 17.95% 18.61%Caa n/a 22.33% 37.70%
Investment Grade 2.04% 2.17% 0.77%Speculative Grade 11.65% 15.06% 26.97%All Ratings 3.16% 3.71% 6.97%Note: All structured finance securities are included. We assume that the LGD rates of all structured finance securities are the equally-weighted averages of the estimated LGD rates in RMBS and HEL and the estimated LGD rates in CDOs. Loss rates by cohort rating in the corporate sector are reproduced from Moody's 2005 corporate bond default study, "Default and Recovery Rates of Corporate Bond Issuers, 1920-2005," Moody's Special Comment, March 2005.
Figure 36 – Estimated Five-Year Cumulative Loss rates by Sector and Cohort Rating, 1993-2005
US CMBS US RMBS US HELGlobal CDOs excl. HYCBOs
ABS excl. MH HEL Global Corporate
Aaa 0.000% 0.028% 0.000% 0.000% 0.027% 0.004%Aa 0.00% 0.06% 0.00% 0.92% 2.69% 0.08%A 0.09% 0.34% 0.47% 2.47% 1.31% 0.23%Baa 0.36% 2.17% 3.42% 10.28% 6.31% 1.24%Ba 1.40% 3.26% 10.25% 12.60% 21.46% 7.04%B 9.06% 5.82% 22.44% 27.63% 28.04% 18.61%Caa 14.88% 19.77% n/a n/a n/a 37.70%
Investment Grade 0.14% 0.51% 0.95% 3.73% 1.67% 0.77%Speculative Grade 5.70% 4.42% 14.19% 17.07% 25.71% 26.97%All Ratings 1.46% 1.00% 2.03% 5.67% 2.69% 6.97%
13. Moody's generally focuses on issue-weighted statistics, not volume-weighted statistics, because issue-weighted statistics are likely to be more useful in predicting future performance level of a wide variety of portfolios. The volume-weighted statistics are more representative of the average historical experience of individual inves-tors.

Appendix 1: Descriptions of Data Sample and Glossary
DESCRIPTION OF DATA SAMPLEThe data sample for the study covers all structured finance rating observations globally between 1993 and 2005 anduses the following set of criteria:
• Only securities carrying long-term bond ratings are included, whereas short-term ratings, foreign nationalratings, provisional ratings, and rating estimates are excluded.
• Tranches wrapped by financial guarantors, government agencies, or government sponsored enterprises(GSEs) are excluded.
• Interest-only (IO) tranches and residual tranches are excluded.• Deals whose credit quality are entirely dependent on a single corporate rating, such as single borrower
credit tenant lease (CTL) deals in CMBS, are excluded. Derivative ratings, which are generally linked tothe credit rating of a single entity, are also excluded.
• Tranches carrying the same rating from the same deal are collapsed into a single rating observation, withthe following exception: if two or more tranches share the same rating in the same deal, but arecollateralized by distinct groups of loan pools, then the tranches are not collapsed.
During each year's update, Moody's not only adds new rating and default/loss data to the data sample, but alsoupdates past data observations using the latest information from servicers and trustees, who periodically produces newreports as well as updates on their past reports. The number of outstanding securities, impairments, and the amount oflosses may change depending on the securities' latest payment reports. In addition, small data errors may also havebeen discovered and corrected. As a result, past impairment and loss rates are subject to minor revisions. This reporthas incorporated all these necessary changes. Finally, the structured finance data set used in this study is availablethrough Moody's Structured Finance Default Risk Service (DRS) database.
GLOSSARY
Payment DefaultStructured finance securities are defined as being in payment default if they have suffered:• an interest shortfall, or• a principal write-down.
Moody's identifies structured finance securities' interest shortfalls and principal write-downs by reviewing all ofMoody's performance data reports, both in electronic and physical form. Prepayment-related interest shortfalls arenot considered to be payment defaults, but PIKing tranches are. Only explicit principal write-downs are included aspayment defaults as reported by servicers or trustees. Implicit principal losses or undercollateralizations are notincluded.
Material ImpairmentStructured finance securities are defined as being in material impairment if they have:• sustained a payment default that remained uncured, or• been downgraded to Ca or C.
The impairment status of a security may change as it goes from cured (i.e. all outstanding shortfalls and losseswere repaid in full) to uncured (i.e. positive interest shortfalls or principal losses outstanding), or vice versa. If anysecurities rated Ca or C but not in payment default are upgraded, they are considered to be no longer in materialimpairment. Securities rated Ca or C that were not upgraded are in material impairment even if their payment defaultshave been cured. Finally, securities with very minor shortfalls or losses are excluded.
One-Year Impairment RateThis is the number of securities that became newly impaired in a given year divided by the number of securitiesoutstanding at the beginning of a year.
24 Moody’s Special Comment

Lifetime Impairment RateThis is the total number of impaired securities divided by the total number of securities issued over a particular timeperiod without regard to the time horizon of impairments.
Marginal Impairment RateFor a cohort of securities outstanding (or issued if by original rating) at the beginning of year t, the N-th year marginalimpairment rate is the number of securities newly impaired in year (t+N) divided by the total number of securities thatsurvived to that year. Securities that are impaired or withdrawn before the year have not survived, and therefore do notappear in the denominator of this rate.
Marginal Cure RateFor a cohort of securities that experienced payment defaults in year t, the N-th year marginal cure rate measures thenumber of payment defaults cured in year (t+N) (measured in calendar years, not in actual number of months), as ashare of all payment defaults occurred in year t.
Loss Severity or LGDThe LGD rate of an impaired structured finance security is measured by the sum of the present values of net losses,including both interest shortfalls and principal losses, discounted by the security's coupon rate and expressed as apercentage of a given principal balance such as the principal balance at origination, at impairment date, or any givencohort date.
Matured and Non-Matured DefaultsSecurities that have sustained payment defaults are called "matured defaults" if their principal balance has beenreduced to zero. They are called "non-matured defaults" if they have positive principal balance outstanding as of theend of the study period.
Multi-Year Cumulative Loss RateThis is the product of the multi-year cumulative impairment rate and multi-year average LGD rate. The multi-yearaverage LGD rate is estimated using the realized and estimated final LGD rates of impaired securities that have knownloss rates, after taking into account the uncertainty of impairment timing.
ABSABS stand for asset-backed securities. This structured finance sector includes securities backed by home equity loans(HEL) and both traditional asset types such as auto loans, credit card receivables, student loans, and manufacturedhousing loans, and non-traditional asset types such as mutual fund fees, tax liens, tobacco settlement payments, andintellectual property.
HELThe home equity loan or HEL sector includes securities backed by subprime (B&C) mortgage loans, homeimprovement loans, high loan-to-value (high LTV) loans, home equity lines of credit (HELOCs), and closed-endsecond-lien loans, as well as net interest margin (NIM) securitizations. It does not include securities backed by Alt-Amortgages, which are included in the RMBS sector. HEL is part of the ABS sector.
CDOsCDOs stand for collateralized debt obligations. Derivative securities such as structured notes, repackaged securities,and credit derivatives are not considered to be part of this sector.
CMBSCMBS stand for commercial mortgage-backed securities.
RMBSRMBS stand for residential mortgage-backed securities. The large majority of these securities are backed by first-lienprime mortgages, but some are backed by Alt-A mortgages. HEL is not considered to be part of this sector.
Moody’s Special Comment 25

All Structured FinanceAll structured finance captures global structured securities in four major sectors: ABS, CDO, CMBS, and RMBS.
U.S. Structured FinanceU.S. structured finance securities are denominated in U.S. dollars and issued in the U.S. market.
European Structured FinanceEuropean structured finance securities are denominated in a European currency or issued in a European country.
Structured Finance in Other RegionsStructured finance securities in other regions are non-U.S. and non-European securities.
26 Moody’s Special Comment

Appendix 2: How to Calculate Multi-Year Material Impairment Rate and LGD Rate
CUMULATIVE IMPAIRMENT RATE BY COHORT RATINGMoody's uses the same method to calculate multi-year cumulative impairment rates as that used in Moody's corporateissuer default studies. In particular, we make an adjustment to the denominator of a marginal impairment rate in agiven period (such as a year) to reflect tranches whose ratings were withdrawn or impaired prior to that period. Suchadjustment ensures future impairments can only occur to survived tranches, i.e. withdrawn tranches or impairedtranches are not eligible for impairments in the subsequent periods.
The cumulative impairment rate for a time horizon T is therefore calculated as:
Where dt is the marginal impairment rate:
Where xt is the number of impairments in year t, wt is the number of rating withdrawals in year t, and
which is the number of tranches that survived into the cohort at time t. When the time horizon T is equal to 1, thecumulative impairment rate and the marginal impairment rate are equal. Note that in addition to removing the prior-year withdrawals from the denominator, half of the withdrawals in time t are also removed. This is because we usediscrete data to estimate marginal impairment rate and the timing of withdrawals within a given period is assumed tobe uniformly distributed.
Let us now look at an example, assuming all securities are carrying the same rating in both 2004 and 2005.
In the example, the average first-year marginal impairment rate is (10+5)/(200+95-95/2-90/2), or 7.41%. Thesecond-year marginal impairment rate is 5/(95-90/2)=10%.14 The average marginal survival rates are 92.6% and90.0% in the first and second year, respectively. The average two-year cumulative survival rate is92.6%*90.0%=83.3%. Therefore, the average two-year cumulative impairment rate is 16.7%.
We believe our method of calculating cumulative impairment rates provides the most relevant information toinvestors who want to look at the historical impairment experience when evaluating the risk of an investment with anyparticular expected maturity. There are, however, at least two other approaches found in the literature, which tend toproduce lower impairment rates and/or fail to use all available information. One approach, which is similar to the above method, calculates marginal impairment rates first, but it does not adjustfor withdrawals, hence, nt = nt-1 - xt-1. As a result, the second year marginal impairment rate is 5/(95+95-90/2)=3.45%.The two-year cumulative impairment rate becomes (1-7.41%)*(1-3.45%) = 10.6%.
Another approach calculates cumulative impairment rates using a ratings transition matrix, treating impairment asa “rating” category (we note that Moody's does not have a “D” or default rating category). For a given time horizon,ratings transition frequencies are calculated using only ratings observations at the beginning and the end of the timehorizon. Newly issued ratings that have not spanned the entire time horizon are not included. For example, if
An Example for Calculating a Two-Year Cumulative Impairment Rate2004 2005
At the beginning of 2004 At the end of 2004 At the beginning of 2005 At the end of 2005Number of Securities Issued Impaired Withdrawn Number of Securities Outstanding Impaired Withdrawn
200 10 95 95 5 90
14. There are two first-year cohorts in this example - one formed at the beginning of 2004 and the other formed at the beginning of 2005. However, there is only one sec-ond-year cohort - the observations in 2005 of the two-year cohort that is formed at the beginning of 2004.
)1(1)(1
t
T
tdTD −−= Π
=
2/tt
tt wn
xd
−=
111 −−− −−= tttt wxnn
Moody’s Special Comment 27

additional securities are issued at the beginning of 2005, the impairment experience of those securities would not beincluded in a two-year impairment rate calculation. Therefore this latter approach does not fully utilize all availabledata.
CUMULATIVE IMPAIRMENT RATE BY ORIGINAL RATINGAs in previous structured finance default studies, we calculate impairment rates for both cohort and original ratingsusing essentially the same method. We find that cumulative impairment rates by original rating have on average beenlower than those by cohort rating for structured finance as a whole. We also caution that the contrast of theimpairment rates by these two types of ratings can be different depending on sector and sample period. This can bebest illustrated in the following example.
In the example, 100 Baa-rated and 100 single-B rated securities are issued at the beginning of 2004. 95 of the 100Baa-rated securities have not changed their ratings and are withdrawn at the end of 2005, but five of them aredowngraded to single-B in 2004 before they become impaired in 2005. Five of the 100 single-B rated securities issuedin 2004 become impaired in 2005 and the rest (95 securities) are withdrawn in 2005.
Based on cohort ratings, the first-year marginal impairment rate in the Baa category is 0% since no impairmentsare observed on securities rated Baa in 2004 or 2005. The second year marginal impairment rate for Baa is 5/(100-95/2)=9.5% (this is based solely on the performance in 2005 of the 100 Baa-rated securities issued in 2004). Hence, thetwo-year cumulative impairment rate in the Baa rating category is 9.5%.
By original rating, the two-year cumulative impairment rate for the Baa rating category is also 9.5% because theBaa sample and performance are the same whether they are by original rating or cohort rating. In the single-Bcategory, however, there are significant differences.
For the single-B rating category, the average first-year marginal impairment rate by cohort rating is (0+5+5)/(100+100+5-95/2)=6.35%. Note that there are three first-year cohorts for single-B, and both the numerator anddenominator include five single-B securities at the beginning of 2005 that are initially rated Baa at the beginning of2004. The second-year marginal impairment rate by cohort rating is 5/(100-95/2)=9.5%. Therefore, the average two-year cumulative impairment rate is 1-(1-6.35%)*(1-9.5%)=15.25%.
However, by original rating, the first-year single-B marginal impairment rate is 0% because the only first-year inthe example for single-B is 2004 and there are no impairments. The second-year marginal impairment rate is 9.5%,the same as that by cohort rating. This implies that the two-year cumulative impairment rate by original rating forsingle-B is 9.5%, which is substantially lower than the cumulative impairment rate of 15.25% by cohort rating.
The large difference illustrated above for single-B original-rating two-year impairment rates hinges on thetreatment of the five securities initially rated Baa at the beginning of 2004 but are rated single-B at the beginning of2005. These securities are not originally rated single-B, but are downgraded to that rating. If the performance of thesedowngraded single-B's is worse than the original single-B's, then the cohort-rating based impairment rates will behigher than the original-rating based impairment rates. Conversely, if the performance of these downgraded single-B'sis better, the cohort-rating based impairment rates will be lower instead.
An Example Showing the Difference between Cohort-Based Impairment Rates and Origination-Based Impairment Rates
2004 2005
At the beginning of 2004 At the end of 2004 At the beginning of 2005 At the end of 2005Number of Securities Issued and Their Rating Impaired Withdrawn
Distribution of Outstanding Securities by Rating Impaired Withdrawn
100, rated Baa 0 0 95, remain Baa rated5, downgraded to single-B
05
95
100, rated single-B 0 0 100, remain single-B 5 95
28 Moody’s Special Comment

MULTI-YEAR CUMULATIVE LGD RATESThe concept of multi-year cumulative LGD rate15 is necessary when loss rates on all impaired securities are notavailable, so a direct calculation of cumulative loss rate is not possible. The method can best be explained by anexample. Suppose we know the average loss severity (as a percent of the cohort-date balance) of securities that wererated single-B two years before they defaulted and those rated single-B one year before they defaulted. We will callthese loss severity values "marginal loss severity rates." To calculate the average loss severity rates of the single-B ratedsecurities that defaulted within two years (either in year one or year two) one needs to take a weighted average of theone-year and the two-year marginal severity rates, where the weights are the shares of the two-year cumulative defaultrates attributable to year one and year two. The following is a concrete example.
In this example, there are five impairments in the first year, and all have a loss severity rate of 30% as a share oftheir balance at the beginning of 2004. Six securities are impaired in the second year, and all have a loss severity rate of50%, which is expressed as a share of the principal balance at the beginning of 2004 – the two-year cohort-datebalance. Note that in order to compute a two-year cumulative LGD rate, all marginal LGD rates need to be expressedas a share of the cohort-date balance with appropriate discounting.
In the example, the one-year impairment rate is 5%, and the two-year cumulative impairment rate is 1-(1-5%)*(1-6/(95-89/2)), or 16.3%. The two-year cumulative LGD rate is: (5%*30%+11.3%*50%)/16.3%=43.9%, whichmeasures the average LGD rate over a two-year period, assuming no knowledge about the timing of impairments atthe beginning of 2004.
The two-year cumulative loss rate is the product of the two-year cumulative impairment rate and the two-yearcumulative LGD rate, i.e. 16.3%*43.9%=7.2%.
Finally, our estimated average multi-year LGD rates can be directly computed from the tables in Appendices 3and 4 by simply dividing the estimated multi-year loss rates by the multi-year impairment rates.
In addition, the multi-year LGD rates for RMBS, HEL, RMBS/HEL combined, and CMBS are empiricallyestimated based on a sample of matured and non-matured impaired RMBS and HEL tranches during 1987-2005. Themulti-year LGD rates for CDOs are empirically estimated based on a sample of matured and non-matured impairedCDO tranches during 1993-2005. The multi-year LGD rates for all structured finance as a whole, ABS overall, andABS excluding MH and HEL are the equally-weighted averages of multi-year LGD rates for RMBS/HEL andCDOs. LGD rates at longer horizons are subject to small sample variations.
15. When analyzing loss severity given default, we use the term LGD (loss given default) instead of LGI (loss given impairment) because LGD is a commonly used term, and the data sample is made up of only uncured payment defaults and an impaired security is also in payment default.
An Example for Calculating a Two-Year Cumulative LGD Rate2004 2005
At the beginning of 2004 At the end of 2004 At the beginning of 2005 At the end of 2005Number of Securities Issued Impaired Withdrawn Number of Outstanding Securities Impaired Withdrawn
100 5 (LGD=30%) 0 95 6 (LGD=50%) 89
Moody’s Special Comment 29

Appendix 3: Impairment Rates by Rating
Figure 37 – Multi-Year Cumulative Impairment Rates by Cohort Rating, 1993-20051-Year 2-Year 3-Year 4-Year 5-Year
All Structured FinanceAaa 0.02% 0.07% 0.17% 0.30% 0.40%Aa 0.18% 0.53% 1.18% 2.00% 2.63%A 0.24% 0.95% 1.79% 2.63% 3.35%Baa 1.19% 3.49% 6.79% 9.66% 12.94%Ba 3.79% 8.75% 12.94% 17.10% 19.45%B 5.94% 11.85% 17.89% 22.68% 26.54%Caa 25.73% 37.41% 44.11% 55.57% 63.77%
Investment Grade 0.37% 1.13% 2.21% 3.25% 4.30%Speculative Grade 5.55% 11.07% 15.93% 20.46% 23.48%All Ratings 0.99% 2.33% 3.88% 5.34% 6.64%
US ABSAaa 0.05% 0.11% 0.26% 0.38% 0.53%Aa 0.50% 1.42% 2.98% 4.85% 6.43%A 0.27% 1.26% 2.58% 3.94% 5.27%Baa 1.42% 4.51% 9.73% 14.76% 21.93%Ba 9.93% 22.88% 32.08% 45.07% 50.81%B 17.70% 31.30% 42.03% 47.96% 53.16%Caa 41.94% 58.53% 58.53% n/a n/a
Investment Grade 0.48% 1.55% 3.23% 4.93% 7.07%Speculative Grade 14.20% 27.33% 36.43% 47.40% 52.84%All Ratings 1.33% 3.13% 5.25% 7.55% 9.91%
US CMBSAaa 0.00% 0.00% 0.00% 0.00% 0.00%Aa 0.00% 0.00% 0.00% 0.00% 0.00%A 0.04% 0.15% 0.31% 0.31% 0.31%Baa 0.27% 0.66% 0.83% 0.91% 1.05%Ba 0.58% 1.47% 2.71% 3.39% 4.28%B 2.36% 6.14% 11.45% 17.47% 23.45%Caa 15.79% 28.56% 40.56% 56.20% 67.73%
Investment Grade 0.11% 0.27% 0.37% 0.40% 0.45%Speculative Grade 2.08% 4.80% 8.44% 12.45% 16.50%All Ratings 0.66% 1.55% 2.64% 3.76% 4.86%
US RMBSAaa 0.00% 0.07% 0.22% 0.42% 0.53%Aa 0.02% 0.09% 0.24% 0.43% 0.48%A 0.26% 0.72% 0.97% 1.03% 1.12%Baa 0.92% 2.47% 4.40% 5.94% 7.06%Ba 2.13% 4.46% 6.69% 8.22% 9.38%B 3.42% 6.74% 9.93% 11.37% 12.17%Caa 27.59% 37.75% 43.54% 50.38% 54.70%
Investment Grade 0.21% 0.62% 1.14% 1.58% 1.88%Speculative Grade 2.92% 5.72% 8.34% 9.95% 11.05%All Ratings 0.54% 1.25% 2.03% 2.63% 3.03%
30 Moody’s Special Comment

Figure 37 – Multi-Year Cumulative Impairment Rates by Cohort Rating, 1993-20051-Year 2-Year 3-Year 4-Year 5-Year
US ABS (excl. both MH and HEL)Aaa 0.08% 0.16% 0.30% 0.41% 0.59%Aa 0.89% 2.01% 3.80% 5.90% 8.23%A 0.13% 0.67% 1.49% 2.47% 3.31%Baa 0.83% 2.94% 6.08% 9.07% 11.78%Ba 4.95% 15.12% 22.99% 29.62% 34.98%B 20.11% 34.93% 40.72% 40.72% 40.72%Caa 39.18% 52.51% 52.51% n/a n/a
Investment Grade 0.25% 0.81% 1.63% 2.50% 3.34%Speculative Grade 12.82% 24.16% 30.85% 35.77% 39.73%All Ratings 0.85% 1.86% 2.88% 3.86% 4.77%
US RMBS & HELAaa 0.00% 0.05% 0.17% 0.35% 0.44%Aa 0.01% 0.06% 0.17% 0.32% 0.35%A 0.15% 0.52% 0.93% 1.23% 1.46%Baa 0.79% 2.31% 4.52% 6.82% 8.63%Ba 2.59% 6.04% 9.59% 12.07% 14.24%B 4.88% 9.60% 14.50% 17.45% 19.57%Caa 40.00% 52.17% 56.43% 61.71% 65.04%
Investment Grade 0.21% 0.64% 1.27% 1.92% 2.40%Speculative Grade 3.91% 7.94% 11.95% 14.64% 16.82%All Ratings 0.58% 1.40% 2.43% 3.33% 4.04%
US HELAaa 0.00% 0.00% 0.00% 0.00% 0.00%Aa 0.00% 0.00% 0.00% 0.00% 0.00%A 0.05% 0.31% 0.95% 1.66% 2.23%Baa 0.66% 2.14% 4.86% 8.94% 12.87%Ba 3.83% 10.90% 18.81% 24.74% 31.58%B 12.21% 23.41% 35.14% 43.49% 50.37%Caa 62.50% 81.25% 81.25% n/a n/a
Investment Grade 0.21% 0.69% 1.58% 2.85% 4.08%Speculative Grade 7.09% 15.57% 24.50% 31.20% 38.09%All Ratings 0.64% 1.70% 3.34% 5.23% 7.18%
Global CDOsAaa 0.00% 0.00% 0.00% 0.00% 0.00%Aa 0.10% 0.31% 1.10% 2.55% 4.08%A 0.57% 1.80% 3.33% 5.59% 6.66%Baa 2.59% 7.52% 14.16% 19.67% 24.02%Ba 4.84% 11.71% 18.23% 21.75% 25.29%B 12.49% 24.64% 36.75% 46.48% 52.78%Caa 21.80% 31.25% 31.25% 31.25% n/a
Investment Grade 0.86% 2.59% 5.10% 7.56% 9.57%Speculative Grade 7.80% 16.05% 23.72% 28.94% 33.58%All Ratings 2.01% 4.87% 8.28% 11.20% 13.62%
Moody’s Special Comment 31

Figure 37 – Multi-Year Cumulative Impairment Rates by Cohort Rating, 1993-20051-Year 2-Year 3-Year 4-Year 5-Year
Global CDOs excl. HYCBOSAaa 0.00% 0.00% 0.00% 0.00% 0.00%Aa 0.12% 0.32% 0.80% 1.52% 1.52%A 0.43% 1.14% 2.05% 3.20% 3.20%Baa 1.34% 4.21% 7.99% 11.12% 12.82%Ba 2.05% 5.26% 8.72% 11.44% 14.11%B 7.15% 13.53% 19.68% 24.34% 30.23%Caa 17.47% 26.15% 26.15% 26.15% n/a
Investment Grade 0.47% 1.45% 2.85% 4.21% 4.81%Speculative Grade 4.02% 8.13% 12.08% 15.24% 18.93%All Ratings 0.98% 2.43% 4.22% 5.87% 6.97%
European Structured Finance (excl. CDOs)Aaa 0.00% 0.00% 0.00% 0.00% 0.00%Aa 0.00% 0.00% 0.00% 0.00% 0.00%A 0.00% 0.00% 0.00% 0.00% 0.00%Baa 0.08% 0.19% 0.19% 0.19% 0.19%Ba 0.00% 0.44% 1.16% 1.16% 1.16%B 4.00% 4.00% 4.00% n/a n/aCaa 0.00% 0.00% n/a n/a n/a
Investment Grade 0.01% 0.03% 0.03% 0.03% 0.03%Speculative Grade 0.26% 0.67% 1.38% 1.38% 1.38%All Ratings 0.03% 0.06% 0.09% 0.09% 0.09%
Structured Finance in Other Regions (excl. CDOs)Aaa 0.00% 0.00% 0.00% 0.00% 0.00%Aa 0.00% 0.00% 0.00% 0.00% 0.00%A 0.00% 0.24% 0.24% 0.24% 0.24%Baa 0.28% 0.28% 0.28% 0.28% 0.28%Ba 0.00% 0.71% 2.02% 4.66% 10.62%B 1.06% 1.06% 1.06% 1.06% 1.06%Caa 0.00% 0.00% 0.00% 0.00% 0.00%
Investment Grade 0.05% 0.09% 0.09% 0.09% 0.09%Speculative Grade 0.29% 0.79% 1.77% 3.74% 7.92%All Ratings 0.07% 0.14% 0.21% 0.33% 0.58%
32 Moody’s Special Comment

Figure 38 – Multi-Year Cumulative Impairment Rates by Original Rating, 1993-20051-Year 2-Year 3-Year 4-Year 5-Year 6-Year 7-Year
All Structured FinanceAaa 0.02% 0.08% 0.12% 0.30% 0.73% 0.84% 0.92%Aa 0.05% 0.34% 0.63% 1.74% 3.22% 4.05% 4.58%A 0.04% 0.31% 1.05% 2.33% 3.46% 4.25% 4.83%Baa 0.04% 0.69% 3.39% 7.83% 10.99% 14.41% 16.77%Ba 0.16% 2.37% 6.23% 12.48% 16.22% 18.88% 20.30%B 0.17% 1.47% 8.77% 16.36% 22.59% 26.56% 30.38%Caa 2.47% 2.47% 6.08% 14.82% 29.85% 48.15% 74.08%
Investment Grade 0.03% 0.33% 1.19% 2.78% 4.20% 5.38% 6.21%Speculative Grade 0.19% 2.08% 7.04% 13.76% 18.56% 22.02% 24.43%All Ratings 0.05% 0.52% 1.87% 4.07% 5.91% 7.37% 8.39%
US ABSAaa 0.05% 0.22% 0.31% 0.66% 1.10% 1.22% 1.42%Aa 0.14% 1.07% 1.96% 3.93% 7.76% 9.96% 11.44%A 0.03% 0.30% 1.22% 3.11% 4.94% 6.13% 7.29%Baa 0.03% 0.66% 3.43% 7.94% 12.90% 19.59% 25.70%Ba 0.57% 7.65% 17.72% 28.80% 40.08% 45.97% 51.81%B 0.00% 3.13% 27.34% 44.78% 44.78% 57.93% 61.59%Caa 50.00% 50.00% 50.00% 50.00% 50.00% 50.00% n/a
Investment Grade 0.06% 0.48% 1.47% 3.31% 5.55% 7.65% 9.60%Speculative Grade 0.66% 7.06% 19.58% 31.98% 40.58% 48.51% 53.82%All Ratings 0.08% 0.75% 2.30% 4.65% 7.24% 9.68% 11.84%
US CMBSAaa 0.00% 0.00% 0.00% 0.00% 0.00% 0.00% 0.00%Aa 0.00% 0.00% 0.00% 0.00% 0.00% 0.00% 0.00%A 0.00% 0.00% 0.42% 0.42% 0.42% 0.42% 0.42%Baa 0.00% 0.41% 1.54% 1.54% 1.54% 1.54% 1.54%Ba 0.00% 0.39% 0.39% 2.57% 2.57% 2.57% 2.57%B 0.18% 0.40% 2.95% 7.27% 15.70% 18.48% 25.73%Caa 0.00% 0.00% 4.35% 14.69% 32.97% 55.31% 100.00%
Investment Grade 0.00% 0.16% 0.69% 0.69% 0.69% 0.69% 0.69%Speculative Grade 0.08% 0.38% 1.68% 5.14% 9.95% 12.60% 16.92%All Ratings 0.02% 0.22% 0.98% 1.97% 3.35% 4.06% 5.03%
US RMBSAaa 0.00% 0.00% 0.00% 0.12% 1.03% 1.20% 1.20%Aa 0.00% 0.00% 0.00% 1.23% 1.41% 1.41% 1.41%A 0.00% 0.12% 0.82% 1.36% 1.36% 1.72% 1.72%Baa 0.07% 0.62% 2.09% 7.53% 9.25% 10.03% 10.30%Ba 0.00% 0.21% 1.56% 5.90% 6.79% 8.22% 8.74%B 0.26% 0.93% 8.35% 13.01% 16.69% 16.69% 17.85%Caa 0.00% 0.00% 0.00% 0.00% 0.00% 0.00% 0.00%
Investment Grade 0.01% 0.13% 0.54% 2.11% 2.84% 3.12% 3.18%Speculative Grade 0.10% 0.48% 4.07% 8.50% 10.29% 11.25% 11.96%All Ratings 0.02% 0.18% 1.04% 3.02% 3.90% 4.29% 4.44%
Moody’s Special Comment 33
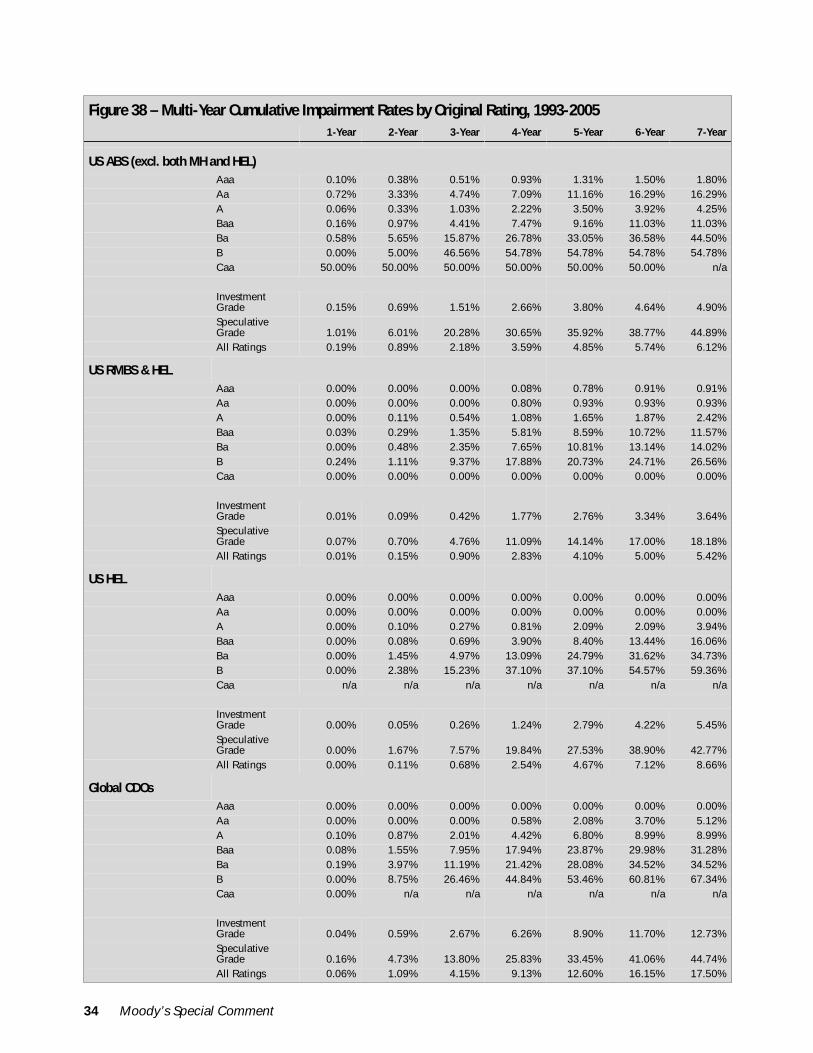
Figure 38 – Multi-Year Cumulative Impairment Rates by Original Rating, 1993-20051-Year 2-Year 3-Year 4-Year 5-Year 6-Year 7-Year
US ABS (excl. both MH and HEL)Aaa 0.10% 0.38% 0.51% 0.93% 1.31% 1.50% 1.80%Aa 0.72% 3.33% 4.74% 7.09% 11.16% 16.29% 16.29%A 0.06% 0.33% 1.03% 2.22% 3.50% 3.92% 4.25%Baa 0.16% 0.97% 4.41% 7.47% 9.16% 11.03% 11.03%Ba 0.58% 5.65% 15.87% 26.78% 33.05% 36.58% 44.50%B 0.00% 5.00% 46.56% 54.78% 54.78% 54.78% 54.78%Caa 50.00% 50.00% 50.00% 50.00% 50.00% 50.00% n/a
Investment Grade 0.15% 0.69% 1.51% 2.66% 3.80% 4.64% 4.90%Speculative Grade 1.01% 6.01% 20.28% 30.65% 35.92% 38.77% 44.89%All Ratings 0.19% 0.89% 2.18% 3.59% 4.85% 5.74% 6.12%
US RMBS & HELAaa 0.00% 0.00% 0.00% 0.08% 0.78% 0.91% 0.91%Aa 0.00% 0.00% 0.00% 0.80% 0.93% 0.93% 0.93%A 0.00% 0.11% 0.54% 1.08% 1.65% 1.87% 2.42%Baa 0.03% 0.29% 1.35% 5.81% 8.59% 10.72% 11.57%Ba 0.00% 0.48% 2.35% 7.65% 10.81% 13.14% 14.02%B 0.24% 1.11% 9.37% 17.88% 20.73% 24.71% 26.56%Caa 0.00% 0.00% 0.00% 0.00% 0.00% 0.00% 0.00%
Investment Grade 0.01% 0.09% 0.42% 1.77% 2.76% 3.34% 3.64%Speculative Grade 0.07% 0.70% 4.76% 11.09% 14.14% 17.00% 18.18%All Ratings 0.01% 0.15% 0.90% 2.83% 4.10% 5.00% 5.42%
US HELAaa 0.00% 0.00% 0.00% 0.00% 0.00% 0.00% 0.00%Aa 0.00% 0.00% 0.00% 0.00% 0.00% 0.00% 0.00%A 0.00% 0.10% 0.27% 0.81% 2.09% 2.09% 3.94%Baa 0.00% 0.08% 0.69% 3.90% 8.40% 13.44% 16.06%Ba 0.00% 1.45% 4.97% 13.09% 24.79% 31.62% 34.73%B 0.00% 2.38% 15.23% 37.10% 37.10% 54.57% 59.36%Caa n/a n/a n/a n/a n/a n/a n/a
Investment Grade 0.00% 0.05% 0.26% 1.24% 2.79% 4.22% 5.45%Speculative Grade 0.00% 1.67% 7.57% 19.84% 27.53% 38.90% 42.77%All Ratings 0.00% 0.11% 0.68% 2.54% 4.67% 7.12% 8.66%
Global CDOsAaa 0.00% 0.00% 0.00% 0.00% 0.00% 0.00% 0.00%Aa 0.00% 0.00% 0.00% 0.58% 2.08% 3.70% 5.12%A 0.10% 0.87% 2.01% 4.42% 6.80% 8.99% 8.99%Baa 0.08% 1.55% 7.95% 17.94% 23.87% 29.98% 31.28%Ba 0.19% 3.97% 11.19% 21.42% 28.08% 34.52% 34.52%B 0.00% 8.75% 26.46% 44.84% 53.46% 60.81% 67.34%Caa 0.00% n/a n/a n/a n/a n/a n/a
Investment Grade 0.04% 0.59% 2.67% 6.26% 8.90% 11.70% 12.73%Speculative Grade 0.16% 4.73% 13.80% 25.83% 33.45% 41.06% 44.74%All Ratings 0.06% 1.09% 4.15% 9.13% 12.60% 16.15% 17.50%
34 Moody’s Special Comment

Figure 38 – Multi-Year Cumulative Impairment Rates by Original Rating, 1993-20051-Year 2-Year 3-Year 4-Year 5-Year 6-Year 7-Year
Global CDOs excl. HYCBOSAaa 0.00% 0.00% 0.00% 0.00% 0.00% 0.00% 0.00%Aa 0.00% 0.00% 0.00% 0.79% 2.39% 2.39% 2.39%A 0.10% 0.52% 1.36% 2.98% 3.97% 3.97% 3.97%Baa 0.10% 1.26% 5.57% 10.92% 13.12% 13.12% 13.12%Ba 0.24% 1.81% 5.07% 10.80% 15.86% 22.46% 22.46%B 0.00% 5.13% 5.13% 14.94% 14.94% 31.95% 31.95%Caa 0.00% n/a n/a n/a n/a n/a n/a
Investment Grade 0.05% 0.42% 1.75% 3.72% 4.94% 4.94% 4.94%Speculative Grade 0.22% 2.18% 5.04% 11.44% 15.27% 25.73% 25.73%All Ratings 0.06% 0.60% 2.11% 4.69% 6.31% 8.06% 8.06%
European Structured Finance (excl. CDOs)Aaa 0.00% 0.00% 0.00% 0.00% 0.00% 0.00% 0.00%Aa 0.00% 0.00% 0.00% 0.00% 0.00% 0.00% 0.00%A 0.00% 0.00% 0.00% 0.00% 0.00% 0.00% 0.00%Baa 0.00% 0.00% 0.41% 0.41% 0.41% 0.41% 0.41%Ba 0.00% 0.00% 0.00% 2.47% 2.47% 2.47% 2.47%B 0.00% 0.00% 0.00% 0.00% 0.00% n/a n/aCaa 0.00% 0.00% n/a n/a n/a n/a n/a
Investment Grade 0.00% 0.00% 0.07% 0.07% 0.07% 0.07% 0.07%Speculative Grade 0.00% 0.00% 0.00% 2.41% 2.41% 2.41% 2.41%All Ratings 0.00% 0.00% 0.07% 0.17% 0.17% 0.17% 0.17%
Structured Finance in Other Regions (excl. CDOs)Aaa 0.00% 0.00% 0.00% 0.00% 0.00% 0.00% 0.00%Aa 0.00% 0.00% 0.00% 0.00% 0.00% 0.00% 0.00%A 0.32% 0.80% 0.80% 0.80% 0.80% 0.80% 0.80%Baa 0.00% 0.00% 0.00% 0.00% 0.00% 0.00% 0.00%Ba 0.00% 0.00% 0.00% 0.00% 0.00% 25.00% 25.00%B 0.00% 0.00% 0.00% 0.00% 0.00% 0.00% n/aCaa 0.00% 0.00% 0.00% 0.00% 0.00% 0.00% n/a
Investment Grade 0.06% 0.14% 0.14% 0.14% 0.14% 0.14% 0.14%Speculative Grade 0.00% 0.00% 0.00% 0.00% 0.00% 14.29% 14.29%All Ratings 0.05% 0.13% 0.13% 0.13% 0.13% 1.09% 1.09%
Moody’s Special Comment 35

Appendix 4: Estimated Loss Rates by Rating
Figure 39 – Estimated Multi-Year Cumulative Loss Rates by Cohort Rating, 1993-20051-Year 2-Year 3-Year 4-Year 5-Year
All Structured FinanceAaa 0.00% 0.01% 0.01% 0.02% 0.02%Aa 0.09% 0.27% 0.49% 0.75% 0.85%A 0.14% 0.52% 0.96% 1.35% 1.40%Baa 0.74% 2.16% 4.08% 5.53% 6.92%Ba 2.57% 5.70% 8.29% 10.59% 11.97%B 3.99% 8.13% 12.46% 15.67% 17.95%Caa 16.26% 21.74% 21.96% 22.30% 22.33%
Investment Grade 0.23% 0.68% 1.28% 1.76% 2.17%Speculative Grade 3.70% 7.32% 10.51% 13.27% 15.06%All Ratings 0.64% 1.48% 2.40% 3.14% 3.71%
US ABSAaa 0.00% 0.01% 0.02% 0.02% 0.03%Aa 0.26% 0.71% 1.25% 1.84% 2.11%A 0.16% 0.69% 1.37% 2.01% 2.10%Baa 0.89% 2.79% 5.83% 8.36% 11.42%Ba 6.73% 14.92% 20.59% 27.79% 31.16%B 11.88% 21.43% 29.10% 33.08% 36.16%Caa 26.51% 34.30% 34.30% n/a n/a
Investment Grade 0.30% 0.93% 1.86% 2.65% 3.47%Speculative Grade 9.48% 18.08% 24.04% 30.75% 33.96%All Ratings 0.86% 1.99% 3.24% 4.41% 5.45%
US CMBSAaa 0.00% 0.00% 0.00% 0.00% 0.00%Aa 0.00% 0.00% 0.00% 0.00% 0.00%A 0.01% 0.05% 0.09% 0.09% 0.09%Baa 0.11% 0.26% 0.31% 0.33% 0.36%Ba 0.26% 0.59% 0.99% 1.19% 1.40%B 1.25% 3.31% 5.91% 7.97% 9.06%Caa 8.97% 13.10% 13.88% 14.81% 14.88%
Investment Grade 0.04% 0.10% 0.13% 0.13% 0.14%Speculative Grade 1.04% 2.24% 3.64% 4.83% 5.70%All Ratings 0.30% 0.66% 1.02% 1.28% 1.46%
US RMBSAaa 0.00% 0.01% 0.02% 0.03% 0.03%Aa 0.00% 0.02% 0.03% 0.05% 0.06%A 0.09% 0.25% 0.32% 0.33% 0.34%Baa 0.36% 0.96% 1.59% 1.96% 2.17%Ba 0.95% 1.81% 2.53% 2.98% 3.26%B 1.82% 3.62% 5.18% 5.68% 5.82%Caa 15.67% 18.96% 19.34% 19.74% 19.77%
Investment Grade 0.08% 0.23% 0.38% 0.46% 0.51%Speculative Grade 1.46% 2.69% 3.70% 4.18% 4.42%All Ratings 0.25% 0.53% 0.79% 0.93% 1.00%
36 Moody’s Special Comment

Figure 39 – Estimated Multi-Year Cumulative Loss Rates by Cohort Rating, 1993-20051-Year 2-Year 3-Year 4-Year 5-Year
US ABS (excl. both MH and HEL)Aaa 0.00% 0.01% 0.02% 0.02% 0.03%Aa 0.46% 1.02% 1.63% 2.29% 2.69%A 0.07% 0.37% 0.79% 1.25% 1.31%Baa 0.52% 1.82% 3.65% 5.15% 6.31%Ba 3.36% 9.79% 14.64% 18.31% 21.46%B 13.50% 23.90% 28.04% 28.04% 28.04%Caa 24.76% 31.02% 31.02% n/a n/a
Investment Grade 0.15% 0.49% 0.94% 1.35% 1.67%Speculative Grade 8.56% 15.98% 20.37% 23.38% 25.71%All Ratings 0.55% 1.18% 1.79% 2.29% 2.69%
US RMBS & HELAaa 0.00% 0.01% 0.01% 0.02% 0.02%Aa 0.00% 0.01% 0.02% 0.04% 0.04%A 0.05% 0.18% 0.29% 0.34% 0.37%Baa 0.31% 0.90% 1.62% 2.17% 2.50%Ba 1.16% 2.44% 3.58% 4.30% 4.82%B 2.59% 5.16% 7.56% 8.57% 8.96%Caa 22.72% 26.66% 26.94% 27.25% 27.27%
Investment Grade 0.08% 0.24% 0.42% 0.54% 0.62%Speculative Grade 1.96% 3.73% 5.28% 6.07% 6.54%All Ratings 0.26% 0.60% 0.93% 1.14% 1.26%
US HELAaa 0.00% 0.00% 0.00% 0.00% 0.00%Aa 0.00% 0.00% 0.00% 0.00% 0.00%A 0.02% 0.11% 0.28% 0.39% 0.47%Baa 0.26% 0.83% 1.71% 2.69% 3.42%Ba 1.71% 4.33% 6.88% 8.60% 10.25%B 6.49% 12.57% 18.33% 21.18% 22.44%Caa 35.51% 41.57% 41.57% n/a n/a
Investment Grade 0.08% 0.26% 0.51% 0.76% 0.95%Speculative Grade 3.55% 7.27% 10.72% 12.71% 14.19%All Ratings 0.29% 0.72% 1.26% 1.69% 2.03%
Global CDOsAaa 0.00% 0.00% 0.00% 0.00% 0.00%Aa 0.10% 0.27% 0.72% 1.46% 1.88%A 0.47% 1.36% 2.54% 4.30% 4.30%Baa 2.22% 6.36% 11.95% 16.18% 19.09%Ba 4.39% 10.55% 16.48% 19.36% 22.66%B 10.13% 20.58% 31.97% 41.71% 48.00%Caa 15.17% 20.98% 20.98% 20.98% 0.00%
Investment Grade 0.74% 2.16% 4.21% 6.04% 7.27%Speculative Grade 6.50% 13.69% 20.78% 25.61% 30.10%All Ratings 1.69% 4.11% 7.02% 9.34% 11.05%
Moody’s Special Comment 37
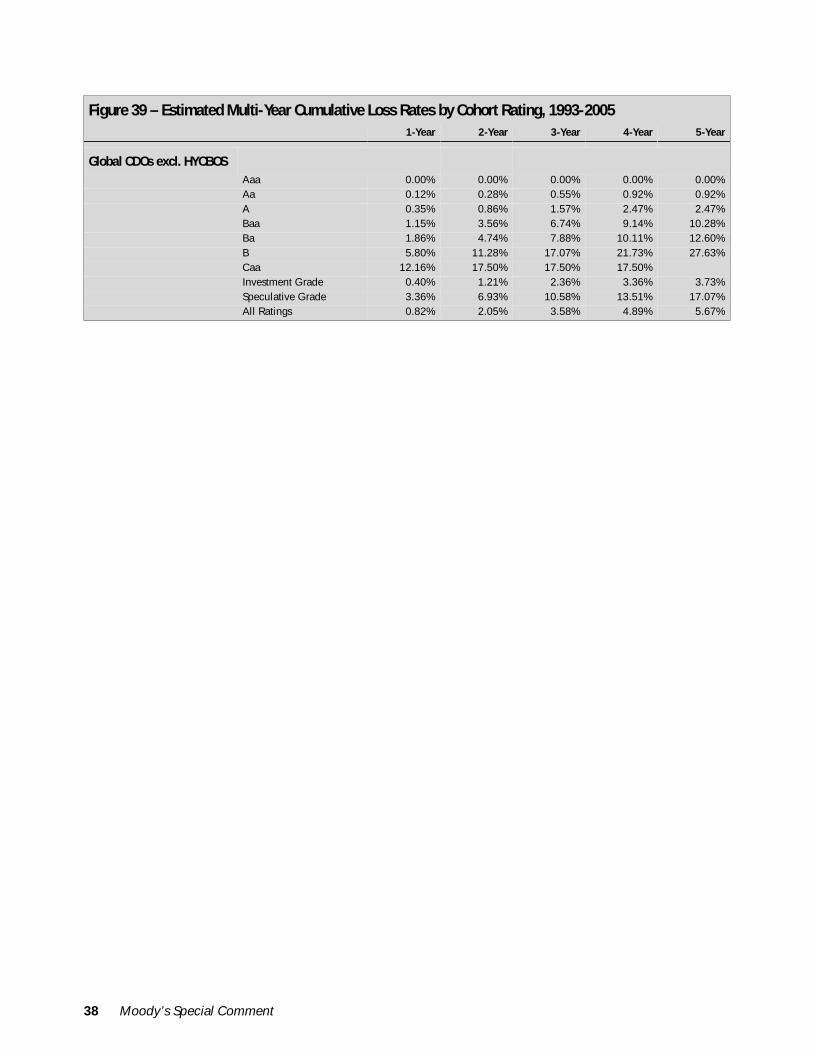
Figure 39 – Estimated Multi-Year Cumulative Loss Rates by Cohort Rating, 1993-20051-Year 2-Year 3-Year 4-Year 5-Year
Global CDOs excl. HYCBOSAaa 0.00% 0.00% 0.00% 0.00% 0.00%Aa 0.12% 0.28% 0.55% 0.92% 0.92%A 0.35% 0.86% 1.57% 2.47% 2.47%Baa 1.15% 3.56% 6.74% 9.14% 10.28%Ba 1.86% 4.74% 7.88% 10.11% 12.60%B 5.80% 11.28% 17.07% 21.73% 27.63%Caa 12.16% 17.50% 17.50% 17.50%Investment Grade 0.40% 1.21% 2.36% 3.36% 3.73%Speculative Grade 3.36% 6.93% 10.58% 13.51% 17.07%All Ratings 0.82% 2.05% 3.58% 4.89% 5.67%
38 Moody’s Special Comment

Moody’s Special Comment 39
Figure 40 – Multi-Year Cumulative Loss Rates by Original Rating, 1993-20051-Year 2-Year 3-Year 4-Year 5-Year 6-Year 7-Year
All Structured FinanceAaa 0.00% 0.00% 0.00% 0.01% 0.02% 0.02% 0.02%Aa 0.00% 0.00% 0.00% 0.32% 0.74% 0.82% 0.85%A 0.00% 0.08% 0.45% 1.10% 1.78% 1.87% 1.98%Baa 0.02% 0.46% 2.18% 4.43% 5.81% 6.91% 7.07%Ba 0.00% 1.36% 4.00% 6.88% 8.65% 9.42% 9.59%B 0.14% 1.10% 7.10% 12.39% 16.22% 16.88% 16.88%
Investment Grade 0.02% 0.19% 0.71% 1.47% 2.04% 2.38% 2.46%Speculative Grade 0.15% 1.43% 5.25% 9.20% 11.65% 12.34% 12.64%All Ratings 0.04% 0.33% 1.24% 2.37% 3.16% 3.57% 3.67%
US ABSAaa 0.00% 0.00% 0.00% 0.01% 0.02% 0.02% 0.03%Aa 0.00% 0.01% 0.01% 0.56% 1.68% 1.87% 1.97%A 0.00% 0.08% 0.54% 1.50% 2.60% 2.74% 2.94%Baa 0.02% 0.44% 2.20% 4.49% 6.66% 8.81% 9.23%Ba 0.00% 4.34% 11.24% 16.33% 21.69% 23.39% 24.11%B 0.00% 2.31% 22.23% 34.37% 34.37% 36.54% 36.54%
Investment Grade 0.04% 0.27% 0.88% 1.75% 2.65% 3.26% 3.44%Speculative Grade 0.53% 4.87% 14.50% 21.79% 26.19% 27.77% 28.42%All Ratings 0.06% 0.48% 1.52% 2.72% 3.85% 4.52% 4.74%
US CMBSAaa 0.00% 0.00% 0.00% 0.00% 0.00% 0.00% 0.00%Aa 0.00% 0.00% 0.00% 0.00% 0.00% 0.00% 0.00%A 0.00% 0.00% 0.17% 0.17% 0.17% 0.17% 0.17%Baa 0.00% 0.27% 0.90% 0.90% 0.90% 0.90% 0.90%Ba 0.00% 0.17% 0.17% 0.79% 0.79% 0.79% 0.79%B 0.14% 0.28% 1.92% 4.02% 6.43% 6.93% 6.93%
Investment Grade 0.00% 0.07% 0.34% 0.34% 0.34% 0.34% 0.34%Speculative Grade 0.06% 0.23% 0.97% 2.24% 4.03% 4.69% 5.22%All Ratings 0.01% 0.11% 0.52% 0.84% 1.21% 1.33% 1.40%
US RMBSAaa 0.00% 0.00% 0.00% 0.00% 0.03% 0.03% 0.03%Aa 0.00% 0.00% 0.00% 0.18% 0.19% 0.19% 0.19%A 0.00% 0.00% 0.27% 0.47% 0.47% 0.52% 0.52%Baa 0.02% 0.39% 1.19% 3.05% 3.60% 3.70% 3.72%Ba 0.00% 0.09% 0.65% 1.90% 2.27% 2.68% 2.75%B 0.21% 0.62% 5.41% 7.67% 8.72% 8.72% 8.72%
Investment Grade 0.00% 0.06% 0.26% 0.73% 0.90% 0.93% 0.94%Speculative Grade 0.08% 0.29% 2.33% 3.96% 4.63% 4.87% 4.95%All Ratings 0.01% 0.09% 0.56% 1.20% 1.43% 1.50% 1.51%
US ABS (excl. both MH and HEL)Aaa 0.00% 0.00% 0.00% 0.02% 0.02% 0.03% 0.03%Aa 0.00% 0.04% 0.04% 0.70% 1.88% 2.33% 2.33%A 0.00% 0.08% 0.43% 1.04% 1.80% 1.85% 1.91%Baa 0.11% 0.65% 2.83% 4.38% 5.12% 5.72% 5.72%Ba 0.00% 3.10% 10.10% 15.12% 18.10% 19.12% 20.09%B 0.00% 3.69% 37.89% 43.61% 43.61% 43.61% 43.61%Investment Grade 0.10% 0.39% 0.90% 1.45% 1.91% 2.15% 2.17%Speculative Grade 0.81% 4.20% 15.19% 21.28% 23.97% 24.54% 25.29%All Ratings 0.14% 0.58% 1.45% 2.17% 2.72% 2.96% 3.00%

Figure 40 – Multi-Year Cumulative Loss Rates by Original Rating, 1993-20051-Year 2-Year 3-Year 4-Year 5-Year 6-Year 7-Year
US RMBS & HELAaa 0.00% 0.00% 0.00% 0.00% 0.02% 0.02% 0.02%Aa 0.00% 0.00% 0.00% 0.12% 0.12% 0.12% 0.12%A 0.00% 0.00% 0.17% 0.37% 0.48% 0.51% 0.60%Baa 0.01% 0.19% 0.76% 2.29% 3.17% 3.47% 3.53%Ba 0.00% 0.21% 0.98% 2.50% 3.84% 4.52% 4.62%B 0.19% 0.73% 6.06% 10.18% 10.99% 11.71% 11.71%
Investment Grade 0.00% 0.04% 0.21% 0.61% 0.83% 0.91% 0.93%Speculative Grade 0.06% 0.40% 2.71% 5.05% 6.18% 6.89% 7.04%All Ratings 0.01% 0.08% 0.48% 1.11% 1.44% 1.59% 1.62%
US HELAaa 0.00% 0.00% 0.00% 0.00% 0.00% 0.00% 0.00%Aa 0.00% 0.00% 0.00% 0.00% 0.00% 0.00% 0.00%A 0.00% 0.00% 0.07% 0.27% 0.52% 0.52% 0.84%Baa 0.00% 0.05% 0.39% 1.48% 2.91% 3.61% 3.79%Ba 0.00% 0.62% 2.09% 4.41% 9.37% 11.35% 11.73%B 0.00% 1.47% 9.76% 20.35% 20.35% 23.49% 23.49%
Investment Grade 0.00% 0.02% 0.13% 0.42% 0.77% 0.95% 1.04%Speculative Grade 0.00% 0.91% 4.26% 8.79% 11.65% 14.48% 14.96%All Ratings 0.00% 0.06% 0.36% 0.97% 1.53% 1.93% 2.06%
Global CDOsAaa 0.00% 0.00% 0.00% 0.00% 0.00% 0.00% 0.00%Aa 0.00% 0.00% 0.00% 0.24% 1.03% 1.16% 1.33%A 0.00% 0.48% 1.16% 2.73% 5.11% 5.11% 5.11%Baa 0.08% 1.05% 5.69% 12.41% 15.73% 18.80% 18.80%Ba 0.00% 3.01% 9.90% 16.38% 19.87% 19.87% 19.87%B 0.00% 7.53% 25.24% 41.94% 50.09% 51.19% 51.19%
Investment Grade 0.04% 0.40% 1.88% 4.24% 5.77% 7.02% 7.15%Speculative Grade 0.00% 3.72% 12.52% 22.21% 27.17% 28.31% 28.31%All Ratings 0.06% 0.82% 3.31% 6.77% 8.87% 10.25% 10.41%
Global CDOs excl. HYCBOSAaa 0.00% 0.00% 0.00% 0.00% 0.00% 0.00% 0.00%Aa 0.00% 0.00% 0.00% 0.33% 1.16% 1.16% 1.16%A 0.00% 0.26% 0.76% 1.81% 2.80% 2.80% 2.80%Baa 0.10% 0.87% 3.99% 7.59% 8.82% 8.82% 8.82%Ba 0.00% 1.25% 4.35% 7.99% 10.65% 10.65% 10.65%B 0.00% 4.41% 4.41% 13.33% 13.33% 15.88% 15.88%
Investment Grade 0.05% 0.29% 1.24% 2.53% 3.23% 3.23% 3.23%Speculative Grade 0.00% 1.59% 4.37% 9.53% 12.02% 13.59% 13.59%All Ratings 0.06% 0.46% 1.68% 3.48% 4.46% 5.14% 5.14%
40 Moody’s Special Comment

Moody’s Special C
omm
ent41
A
1
ial rment
Material Impairment Month (1=January, etc.)
Payment Default?
Ca or C?
3 Y N1 Y N8 N Y3 Y Y9 Y N9 Y Y6 Y N2 Y N12 Y N2 Y Y2 Y N3 Y N
5 Y Y
2 Y N
2 N Y
12 Y N
5 Y Y
3 Y N
3 Y Y
3 N Y
10 N Y
2 Y N
6 Y N
7 Y Y
9 Y Y
9 Y Y
ppendix 5: List of 2005 New Impairments16
6. The complete list of all historically impaired non-private structured finance securities in our data sample is available in Moody's structured finance default risk service (SF DRS).
Deal NameTranche Name Sector Asset Type
Closing Date
Tranche Original Balance
Original Rating
MaterImpaiYear
ACLC Business Loan Receivables Trust 1998-2 C ABS Franchise Loans 12/30/1998 16,248,000 A2 2005ACLC Business Loan Receivables Trust 1999-1 Class B ABS Franchise Loans 6/4/1999 17,672,000 Aa2 2005ACLC Business Loan Receivables Trust 2000-1 Class B ABS Franchise Loans 8/1/2000 16,275,000 Aa2 2005FFCA Secured Franchise Lending Corporation Class B-2 ABS Franchise Loans 10/12/1999 5,390,000 Aa2 2005FFCA Secured Franchise Loan Grantor Trust 2000-1 Class D ABS Franchise Loans 11/29/2000 10,156,000 A3 2005FFCA Secured Franchise Loan Owner Trust 2000-1 Class D ABS Franchise Loans 11/29/2000 10,156,000 A3 2005Aircraft Finance Trust. Series 1999-1 Class B ABS Leases – Aircraft 5/5/1999 126,500,000 A2 2005Aircraft Finance Trust. Series 1999-1 Class C ABS Leases – Aircraft 5/5/1999 106,000,000 Baa2 2005ALPS 96-1 Class B ABS Leases – Aircraft 6/27/1996 56,868,750 A2 2005DVI Receivables VIII, L.L.C. Class C ABS Leases – Equipment 7/27/1999 7,537,000 A2 2005DVI Receivables VIII, L.L.C. Class D ABS Leases – Equipment 7/27/1999 5,024,000 Baa2 2005Access Financial MH Contract Trust 1996-1 B-1 ABS Manufactured
Housing5/29/1996 17,551,000 Baa3 2005
Lehman ABS Manufactured Housing Contract Trust 2001-B
Cl. B-2 ABS Manufactured Housing
11/2/2001 49,548,738 Ba2 2005
Origen Manufactured Housing Contract Senior/Subordinate Asset-Backed Certificates, Series 2001-A
Cl. M-2 ABS Manufactured Housing
3/27/2001 12,787,500 A2 2005
Green Tree Recreational, Equipment & Consumer Trust 1997-A
Certificates ABS ABS – Other 3/20/1997 15,000,000 Baa1 2005
CIT RV Trust 1998-A Certificates ABS Recreational Vehicles
6/15/1998 6,060,865 Baa3 2005
CIT RV Trust 1999-A Certificates ABS Recreational Vehicles
5/19/1999 11,515,205 Baa3 2005
FIB Business Loan Trust 2000-A Class M-1 ABS Small Business Loans
6/28/2000 2,600,000 A2 2005
FIB Business Loan Trust 2000-A Class M-2 ABS Small Business Loans
6/28/2000 2,600,000 Baa2 2005
First International Bank Trust Fund, Series 2000-1 Class M ABS Small Business Loans
3/24/2000 2,860,000 A2 2005
Aames Mortgage Trust 2001-1 Cl. B HEL Subprime mortgages
3/29/2001 6,000,000 Baa2 2005
Aames Mortgage Trust 2001-2 Cl. B HEL Subprime mortgages
6/28/2001 5,625,000 Baa2 2005
Bear Stearns Asset Backed Securities, Inc., 1999-2 BF HEL Subprime mortgages
10/19/1999 7,754,000 Baa3 2005
Conseco Finance Home Equity Loan Trust 2001-A Cl. II-B-2 HEL Subprime mortgages
1/31/2001 13,805,000 Ba2 2005
Delta Funding Home Equity Loan Trust 2000-3 Cl. B HEL Subprime mortgages
9/28/2000 6,500,000 Baa3 2005
GE Capital Mtg Services Inc 1998-HE2 B2 HEL Subprime mortgages
6/26/1998 1,945,000 Baa2 2005

42M
oody’s Special Com
ment
4 Y N
8 Y N
3 N Y
9 Y N
8 Y N
5 Y N
3 N Y
12 N Y
3 N Y
4 Y N9 Y N9 Y Y7 Y N3 Y Y4 Y Y
4 Y N
5 Y N
4 Y Y
ial rment
Material Impairment Month (1=January, etc.)
Payment Default?
Ca or C?
IndyMac Home Equity Mortgage Loan Asset-Backed Trust, Series SPMD 2001-B
Cl. BF HEL Subprime mortgages
6/28/2001 11,375,000 Baa2 2005
Long Beach Mortgage Loan Trust 2000-1 Cl. M-3 HEL Subprime mortgages
12/15/2000 17,500,000 Baa1 2005
Long Beach Mortgage Loan Trust 2001-2 Cl. M-3 HEL Subprime mortgages
7/20/2001 67,760,000 Baa2 2005
Long Beach Mortgage Loan Trust 2001-4, Asset Backed Certificates, Series 2001-4
Cl. I-M3 HEL Subprime mortgages
12/3/2001 55,120,000 Baa2 2005
Long Beach Mortgage Loan Trust Asset-Backed Certificates, Series 2001-3
Cl. M-3 HEL Subprime mortgages
9/24/2001 37,538,000 Baa2 2005
Metropolitan Asset Funding, Inc. Series 2000-A Cl. M-2 HEL Subprime mortgages
3/30/2000 5,578,000 A2 2005
Metropolitan Mortgage Funding, Inc., Series 2000-B Cl. B-1 HEL Subprime mortgages
9/28/2000 9,750,000 Baa2 2005
Saxon Asset Securities Trust 2000-1 Cl. BF-1 HEL Subprime mortgages
2/29/2000 8,964,000 Baa2 2005
Saxon Asset Securities Trust 2000-4 Cl. BF-1 HEL Subprime mortgages
12/20/2000 4,500,000 Baa2 2005
BlackRock Capital Finance L.L.C. 1997-R2 B-5 HEL HEL – Other 6/23/1997 6,264,000 B2 2005CSFB Trust 2002-NP14 Cl. B-1 HEL HEL – Other 8/9/2002 3,020,000 Baa2 2005CSFB Trust 2002-NP14 Cl. B-2 HEL HEL – Other 8/9/2002 1,208,000 Ba2 2005RAMP Series 2002-RS2 Trust Cl. M-I-3 HEL HEL – Other 3/27/2002 7,726,000 Baa2 2005SBMS VII 1997-HUD1 B-4 HEL HEL – Other 4/30/1997 11,415,000 Ba2 2005Archimedes Funding, L.L.C. $36,000,00
0 Class B-2 Fixed Rate Second Priority Sr Sec Notes due 11/08/09
CDO HY CLO 11/5/1997 36,000,000 Baa3 2005
ABS Capital Funding, Ltd. Class B-2 Second Priority Fixed Rate Term Notes Due 2033
CDO SF CDOs 12/20/2000 13,000,000 Baa2 2005
Aspen Funding I, Ltd. U.S. $5,500,000 Class B-1 9.06% Notes Due July 2037
CDO SF CDOs 5/30/2002 5,500,000 Baa3 2005
Capital Guardian ABS CDO I Class C Mezzanine Secured Floating Rate Notes due April 2037
CDO SF CDOs 2/28/2002 14,100,000 Baa2 2005
Deal NameTranche Name Sector Asset Type
Closing Date
Tranche Original Balance
Original Rating
MaterImpaiYear

Moody’s Special C
omm
ent43
10 Y N
7 Y Y
5 Y N
6 Y Y
1 Y Y
2 Y N
1 N Y
10 Y Y
ial rment
Material Impairment Month (1=January, etc.)
Payment Default?
Ca or C?
Capital Guardian ABS CDO I Preference Shares
CDO SF CDOs 2/28/2002 15,000,000 Ba3 2005
Fulton Street CDO, Ltd. U.S.$7,000,000 Class C Fixed Rate Notes Due April 20, 2037
CDO SF CDOs 3/15/2002 7,000,000 Ba2 2005
Galleria CBO IV (formerly Beacon Hill II) $14,000,000 Class B Second Priority Floating Rate Term Notes, Due 2034
CDO SF CDOs 7/19/2001 14,000,000 Aa2 2005
Harbourview CDO III, Limited $22,500,000 Class B Second Priority Senior Secured Floating Rate Notes Due 2036
CDO SF CDOs 4/24/2001 22,500,000 Aa2 2005
MID OCEAN CBO 2000-1 LTD. Class B-1 6.9889% Notes
CDO SF CDOs 1/8/2001 12,500,000 Baa3 2005
MKP CBO II, Ltd. $12,500,000 Class C-2 Third Priority Fixed Rate Term Notes, Due 2036
CDO SF CDOs 12/20/2001 12,500,000 Baa2 2005
MWAM CBO 2001-1, LTD. U.S.$8,125,000 Class C-2 Fixed Rate Notes Due January 30, 2031
CDO SF CDOs 1/25/2001 8,125,000 Baa2 2005
Solstice ABS CBO, Ltd./Solstice ABS CBO Inc. U.S. $12,500,000 Class C Mezzanine Floating Rate Notes Due 2036
CDO SF CDOs 4/19/2001 12,500,000 Baa2 2005
Deal NameTranche Name Sector Asset Type
Closing Date
Tranche Original Balance
Original Rating
MaterImpaiYear

44M
oody’s Special Com
ment
5 5 Y Y
5 10 Y N
5 10 Y Y
5 2 Y Y
5 11 Y N5 5 Y N5 1 Y N5 12 Y N5 9 Y N5 10 Y N5 3 Y Y5 12 Y Y
5 11 Y N
5 7 Y N5 10 Y N5 3 Y N5 11 Y N
5 11 N Y
5 11 Y N
5 10 Y N
5 3 Y N
5 1 Y Y
5 5 Y Y
terial airment r
Material Impairment Month (1=January, etc.)
Payment Default?
Ca or C?
Solstice II U.S. $22,000,000 Class C Mezzanine Floating Rate Notes due 2038
CDO SF CDOs 5/9/2002 22,000,000 Baa2 200
Trainer Wortham First Republic CBO II, Limited U.S.$7,600,000 Class B-1L Floating Rate Notes Due 2037
CDO SF CDOs 2/28/2002 7,600,000 Baa3 200
Trainer Wortham First Republic CBO II, Limited Preference Shares
CDO SF CDOs 2/28/2002 18,000,000 Ba3 200
Bear Stearns Commercial Mortgage Securities Inc 1999-C1
J CMBS Conduits 2/10/1999 2,390,020 B3 200
CS First Boston Mortgage Securities Corp 1998-C2 I CMBS Conduits 11/24/1998 19,200,000 B3 200CS First Boston Mortgage Securities Corp 1999-C1 L CMBS Conduits 11/10/1999 15,800,000 B2 200CS First Boston Mortgage Securities Corp 1999-C1 M CMBS Conduits 11/10/1999 9,300,000 B3 200CS First Boston Mortgage Securities Corp 2001-CF2 Cl. M CMBS Conduits 4/27/2001 9,854,000 B2 200CS First Boston Mortgage Securities Corp 2001-CF2 Cl. N CMBS Conduits 4/27/2001 5,474,000 B3 200DLJ Commercial Mortgage Corp. 1999-CG3 B-8 CMBS Conduits 10/12/1999 8,993,000 B3 200DLJ Commercial Mortgage Trust 2000-CKP1 Cl. B-7 CMBS Conduits 11/6/2000 9,675,000 B1 200First Union National Bank – Bank of America, N.A. Commercial Mortgage Pass-Through Certificates Series 2001-C1
Cl. P CMBS Conduits 3/30/2001 6,542,000 B3 200
J.P. Morgan Commercial Mortgage Finance Corp. 2000-C10
Cl. M CMBS Conduits 9/28/2000 5,539,000 B3 200
LB-UBS Commercial Mortgage Trust 2000-C5 Cl. N CMBS Conduits 12/6/2000 4,980,000 B3 200LB-UBS Commercial Mortgage Trust 2001-C2 Cl. N CMBS Conduits 5/24/2001 6,712,000 B3 200LB-UBS Commercial Mortgage Trust 2001-C2 Cl. P CMBS Conduits 5/24/2001 3,355,000 Caa2 200Merrill Lynch Mortgage Trust Commercial Mortgage Pass-Through Certificates, Series 2002-MW1
Cl. H CMBS Conduits 7/11/2002 18,945,000 Ba1 200
Merrill Lynch Mortgage Trust Commercial Mortgage Pass-Through Certificates, Series 2002-MW1
Cl. J CMBS Conduits 7/11/2002 16,239,000 Ba2 200
Merrill Lynch Mortgage Trust Commercial Mortgage Pass-Through Certificates, Series 2002-MW1
Cl. K CMBS Conduits 7/11/2002 5,413,000 Ba3 200
Merrill Lynch Mortgage Trust Commercial Mortgage Pass-Through Certificates, Series 2002-MW1
Cl. L CMBS Conduits 7/11/2002 8,120,000 B1 200
Merrill Lynch Mortgage Trust Commercial Mortgage Pass-Through Certificates, Series 2002-MW1
Cl. M CMBS Conduits 7/11/2002 13,532,000 B2 200
Merrill Lynch Mortgage Trust Commercial Mortgage Pass-Through Certificates, Series 2002-MW1
Cl. N CMBS Conduits 7/11/2002 5,413,000 B3 200
Prudential Securities Secured Financing Corporation, Series KEY 2000-C1
Cl. N CMBS Conduits 6/29/2000 6,122,000 B3 200
Deal NameTranche Name Sector Asset Type
Closing Date
Tranche Original Balance
Original Rating
MaImpYea
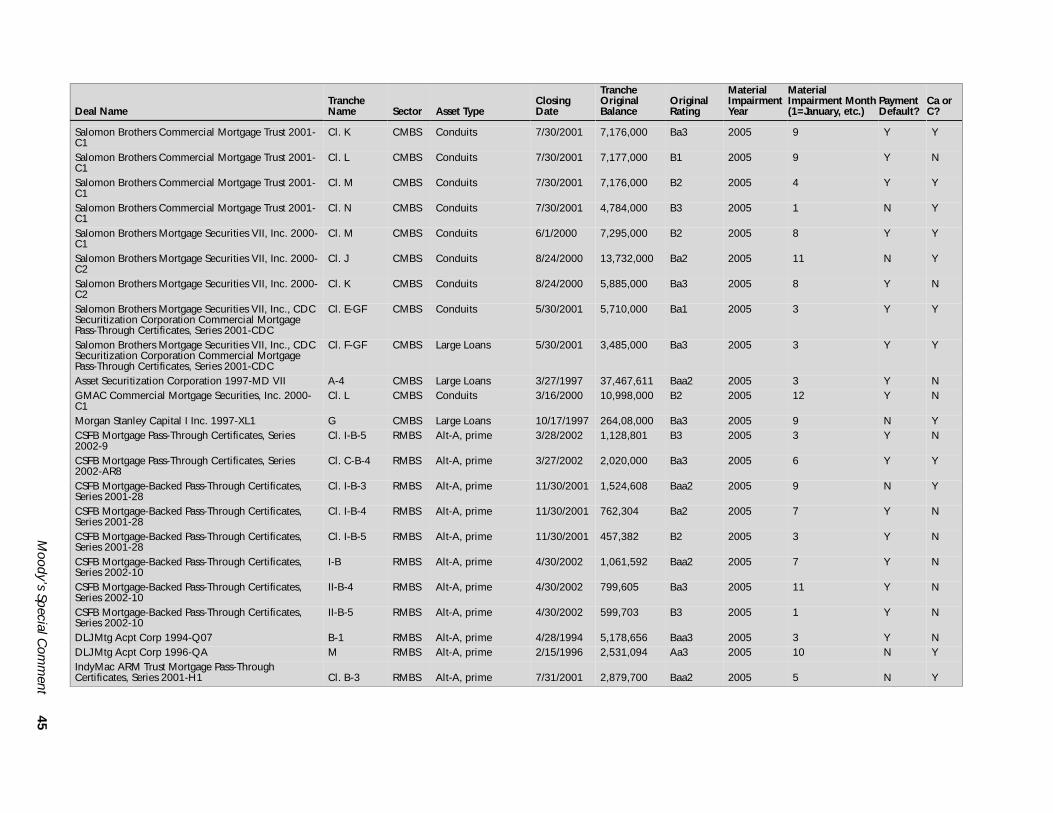
Moody’s Special C
omm
ent45
Y Y
Y N
Y Y
N Y
Y Y
N Y
Y N
Y Y
Y Y
Y NY N
N YY N
Y Y
N Y
Y N
Y N
Y N
Y N
Y N
Y NN Y
N Y
Payment Default?
Ca or C?
Salomon Brothers Commercial Mortgage Trust 2001-C1
Cl. K CMBS Conduits 7/30/2001 7,176,000 Ba3 2005 9
Salomon Brothers Commercial Mortgage Trust 2001-C1
Cl. L CMBS Conduits 7/30/2001 7,177,000 B1 2005 9
Salomon Brothers Commercial Mortgage Trust 2001-C1
Cl. M CMBS Conduits 7/30/2001 7,176,000 B2 2005 4
Salomon Brothers Commercial Mortgage Trust 2001-C1
Cl. N CMBS Conduits 7/30/2001 4,784,000 B3 2005 1
Salomon Brothers Mortgage Securities VII, Inc. 2000-C1
Cl. M CMBS Conduits 6/1/2000 7,295,000 B2 2005 8
Salomon Brothers Mortgage Securities VII, Inc. 2000-C2
Cl. J CMBS Conduits 8/24/2000 13,732,000 Ba2 2005 11
Salomon Brothers Mortgage Securities VII, Inc. 2000-C2
Cl. K CMBS Conduits 8/24/2000 5,885,000 Ba3 2005 8
Salomon Brothers Mortgage Securities VII, Inc., CDC Securitization Corporation Commercial Mortgage Pass-Through Certificates, Series 2001-CDC
Cl. E-GF CMBS Conduits 5/30/2001 5,710,000 Ba1 2005 3
Salomon Brothers Mortgage Securities VII, Inc., CDC Securitization Corporation Commercial Mortgage Pass-Through Certificates, Series 2001-CDC
Cl. F-GF CMBS Large Loans 5/30/2001 3,485,000 Ba3 2005 3
Asset Securitization Corporation 1997-MD VII A-4 CMBS Large Loans 3/27/1997 37,467,611 Baa2 2005 3GMAC Commercial Mortgage Securities, Inc. 2000-C1
Cl. L CMBS Conduits 3/16/2000 10,998,000 B2 2005 12
Morgan Stanley Capital I Inc. 1997-XL1 G CMBS Large Loans 10/17/1997 264,08,000 Ba3 2005 9CSFB Mortgage Pass-Through Certificates, Series 2002-9
Cl. I-B-5 RMBS Alt-A, prime 3/28/2002 1,128,801 B3 2005 3
CSFB Mortgage Pass-Through Certificates, Series 2002-AR8
Cl. C-B-4 RMBS Alt-A, prime 3/27/2002 2,020,000 Ba3 2005 6
CSFB Mortgage-Backed Pass-Through Certificates, Series 2001-28
Cl. I-B-3 RMBS Alt-A, prime 11/30/2001 1,524,608 Baa2 2005 9
CSFB Mortgage-Backed Pass-Through Certificates, Series 2001-28
Cl. I-B-4 RMBS Alt-A, prime 11/30/2001 762,304 Ba2 2005 7
CSFB Mortgage-Backed Pass-Through Certificates, Series 2001-28
Cl. I-B-5 RMBS Alt-A, prime 11/30/2001 457,382 B2 2005 3
CSFB Mortgage-Backed Pass-Through Certificates, Series 2002-10
I-B RMBS Alt-A, prime 4/30/2002 1,061,592 Baa2 2005 7
CSFB Mortgage-Backed Pass-Through Certificates, Series 2002-10
II-B-4 RMBS Alt-A, prime 4/30/2002 799,605 Ba3 2005 11
CSFB Mortgage-Backed Pass-Through Certificates, Series 2002-10
II-B-5 RMBS Alt-A, prime 4/30/2002 599,703 B3 2005 1
DLJ Mtg Acpt Corp 1994-Q07 B-1 RMBS Alt-A, prime 4/28/1994 5,178,656 Baa3 2005 3DLJ Mtg Acpt Corp 1996-QA M RMBS Alt-A, prime 2/15/1996 2,531,094 Aa3 2005 10IndyMac ARM Trust Mortgage Pass-Through Certificates, Series 2001-H1 Cl. B-3 RMBS Alt-A, prime 7/31/2001 2,879,700 Baa2 2005 5
Deal NameTranche Name Sector Asset Type
Closing Date
Tranche Original Balance
Original Rating
Material Impairment Year
Material Impairment Month(1=January, etc.)

46 Moody’s Special Comment
Related Research
Special Comments:Default & Loss Rates of Structured Finance Securities: 1993-2004, July 2005Default & Loss Rates of U.S. CDOs: 1993-2003, March 2005Default & Loss Rates of Structured Finance Securities: 1993-2003, September 2004Measuring Loss Severity Rates of Defaulted Residential Mortgage Backed Securities: A Methodology, April 2004Payment Defaults and Material Impairments of U.S. Structured Finance Securities: 1993-2002, December 2003European Structured Finance Rating Transitions: 1988-2005, February 2006Structured Finance Rating Transitions: 1983-2005, February 2006Structured Finance Rating Transitions: 1983-2004, February 2005Structured Finance Rating Transitions: 1983-2003, February 2004Structured Finance Rating Transitions: 1983-2002, Comparisons with Corporate Ratings and Across Sectors, January 2003Structured Finance Watchlist Resolutions: 1992-2003, June 2004The Performance of Structured Finance Ratings: Mid-Year 2005 Report, September 2005The Relationship between Par Coupon Spreads and Credit Ratings in US Structured Finance, December 2005Guide to Moody's Default Research: January 2006 Update, January 2006Default and Recovery Rates of Corporate Bond Issuers, 1920-2005, March 2006
To access any of these reports, click on the entry above. Note that these references are current as of the date of publication of thisreport and that more recent reports may be available. All research may not be available to all clients.

PAGE INTENTIONALLY LEFT BLANK

© Copyright 2006, Moody’s Investors Service, Inc. and/or its licensors and affiliates including Moody’s Assurance Company, Inc. (together, “MOODY’S”). All rights reserved. ALLINFORMATION CONTAINED HEREIN IS PROTECTED BY COPYRIGHT LAW AND NONE OF SUCH INFORMATION MAY BE COPIED OR OTHERWISE REPRODUCED, REPACKAGED,FURTHER TRANSMITTED, TRANSFERRED, DISSEMINATED, REDISTRIBUTED OR RESOLD, OR STORED FOR SUBSEQUENT USE FOR ANY SUCH PURPOSE, IN WHOLE OR IN PART, INANY FORM OR MANNER OR BY ANY MEANS WHATSOEVER, BY ANY PERSON WITHOUT MOODY’S PRIOR WRITTEN CONSENT. All information contained herein is obtained byMOODY’S from sources believed by it to be accurate and reliable. Because of the possibility of human or mechanical error as well as other factors, however, such information is provided “asis” without warranty of any kind and MOODY’S, in particular, makes no representation or warranty, express or implied, as to the accuracy, timeliness, completeness, merchantability or fitnessfor any particular purpose of any such information. Under no circumstances shall MOODY’S have any liability to any person or entity for (a) any loss or damage in whole or in part caused by,resulting from, or relating to, any error (negligent or otherwise) or other circumstance or contingency within or outside the control of MOODY’S or any of its directors, officers, employees oragents in connection with the procurement, collection, compilation, analysis, interpretation, communication, publication or delivery of any such information, or (b) any direct, indirect,special, consequential, compensatory or incidental damages whatsoever (including without limitation, lost profits), even if MOODY’S is advised in advance of the possibility of suchdamages, resulting from the use of or inability to use, any such information. The credit ratings and financial reporting analysis observations, if any, constituting part of the informationcontained herein are, and must be construed solely as, statements of opinion and not statements of fact or recommendations to purchase, sell or hold any securities. NO WARRANTY,EXPRESS OR IMPLIED, AS TO THE ACCURACY, TIMELINESS, COMPLETENESS, MERCHANTABILITY OR FITNESS FOR ANY PARTICULAR PURPOSE OF ANY SUCH RATING OR OTHEROPINION OR INFORMATION IS GIVEN OR MADE BY MOODY’S IN ANY FORM OR MANNER WHATSOEVER. Each rating or other opinion must be weighed solely as one factor in anyinvestment decision made by or on behalf of any user of the information contained herein, and each such user must accordingly make its own study and evaluation of each security and ofeach issuer and guarantor of, and each provider of credit support for, each security that it may consider purchasing, holding or selling. MOODY’S hereby discloses that most issuers of debt securities (including corporate and municipal bonds, debentures, notes and commercial paper) and preferred stock rated byMOODY’S have, prior to assignment of any rating, agreed to pay to MOODY’S for appraisal and rating services rendered by it fees ranging from $1,500 to $2,400,000. Moody’s Corporation(MCO) and its wholly-owned credit rating agency subsidiary, Moody’s Investors Service (MIS), also maintain policies and procedures to address the independence of MIS’s ratings and ratingprocesses. Information regarding certain affiliations that may exist between directors of MCO and rated entities, and between entities who hold ratings from MIS and have also publiclyreported to the SEC an ownership interest in MCO of more than 5%, is posted annually on Moody’s website at www.moodys.com under the heading “Shareholder Relations — CorporateGovernance — Director and Shareholder Affiliation Policy.” Moody’s Investors Service Pty Limited does not hold an Australian financial services licence under the Corporations Act. This credit rating opinion has been prepared without taking intoaccount any of your objectives, financial situation or needs. You should, before acting on the opinion, consider the appropriateness of the opinion having regard to your own objectives,financial situation and needs.
48 Moody’s Special Comment
To order reprints of this report (100 copies minimum), please call 1.212.553.1658.Report Number: 97234
Author Editor Production Associate
Jian Hu Nathan Trier Wing Chan