Dedicated to Value - Massmart · Dedicated to Value Massmart Reviewed Results for the 26 weeks to...
71
Dedicated to Value Massmart Reviewed Results for the 26 weeks to 27 December 2009 Presentation to Investors, Analysts and Media February 2010
Transcript of Dedicated to Value - Massmart · Dedicated to Value Massmart Reviewed Results for the 26 weeks to...

Dedicated to Value
Massmart Reviewed Resultsfor the 26 weeks to 27 December 2009
Presentation to Investors, Analysts and Media February 2010

Agenda
Group Financial Performance
Divisional Financial Performance
Highlights of the Operational Performance
The Environment
Vision for Growth 2012
Vision for Growth 2013 – A New Focus
Risks & Prospects
ADDENDUM – Additional financial data

December 2009 Group Financial Performance

Key Points … looking back
The Group traded through a perfect storm:
Food:
Disinflation / deflation
Wholesale volumes negative as customers delayed purchases
Gross margins contracted
General Merchandise sale weak:
South African consumers cautious
Bank consumer credit scarce
Compounded by deflation in this category
Africa:
Belated reaction to global crisis
Local sales growth negative
Initial currency weakness caused over-pricing of stock in Game
Currency strengthened relative to 1H in FY09:
While still very profitable, Rand trading profits from Africa down by 26%

Key Points … looking ahead
Internal:
Great operational performance: costs, employees, stock levels
Sales growth accelerating since mid-December ’09
Builders Warehouse and Game SA trading well
New stores and acquisitions
Gained market share
External:
Increasing and broad-based signs of economic recovery
African currencies likely to stabilise / strengthen
CPI to remain low <6%, suggesting a benign to positive economic outlook
Sales
(Rm’s) 2009 2008 Total % Chg
Comp % Chg Infl %
Massdiscounters 6 114 6 088 0.4 -3.8 0.5
Makro 5 956 5 868 1.5 1.5 5.1
Massbuild 3 190 2 936 8.6 -0.4 2.7
Masscash 8 894 7 866 13.1 0.1 -0.4
Total 24 154 22 758 6.1 -0.5 1.6
Non-SA Sales7%
SA Sales93%
Inflation = financial YTD sales inflation
Excluding Africa, Total and Comparable sales growths were 7.0% and 1.2% respectively

Sales Inflation
YTD sales inflation to December 2009:
General Merchandise -0.5%
Home Improvement 2.7%
Food & Liquor 2.1%
Total 1.6%
General Merchandise deflation – from relative Rand strength
Food inflation declining (disinflation). Commodities in deflation
Group inflation should increase gradually (<5%) in next six months
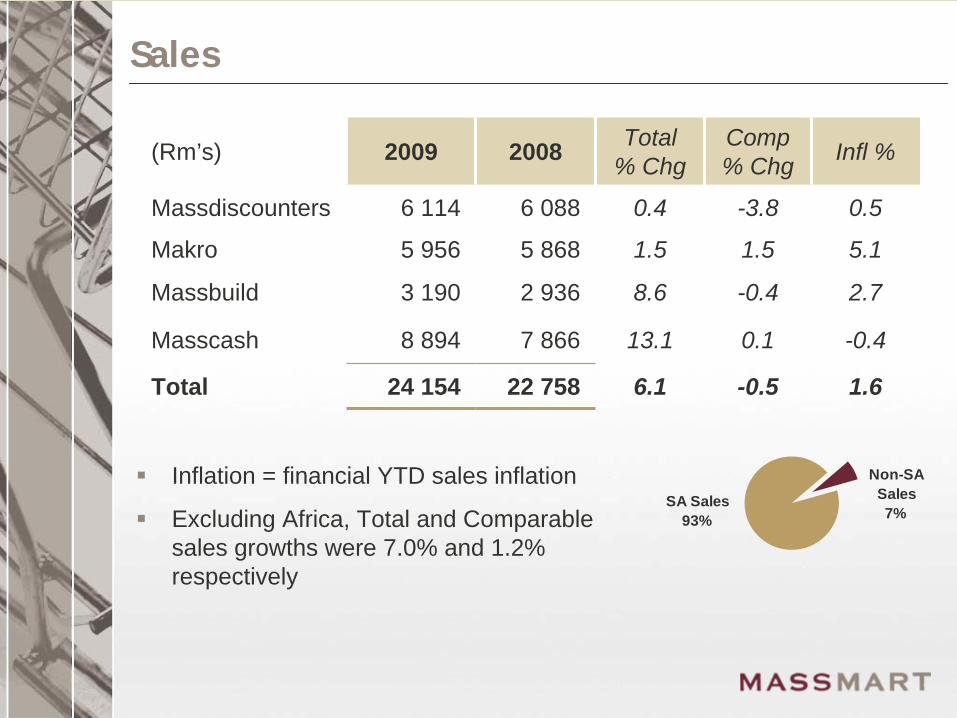
Store Portfolio
Massdiscounters Makro Massbuild Masscash Total
June 09 93 *13 71 77 254
Acquired - - 16 9 25
Closed (1) - (3) - (4)
Openings 10 - 4 1 15
Dec 09 102 *13 88 87 290
* Excludes two Makro Zimbabwe stores
Massdiscounters: six new Game and four Dion Wired stores
Massbuild: one new Warehouse, one Express, two Depot stores. Three closures (two Express, one Depot). 16 acquired (incl. 3 ex-Mica)
Masscash: acquired nine stores in five acquisitions, one new Cambridge
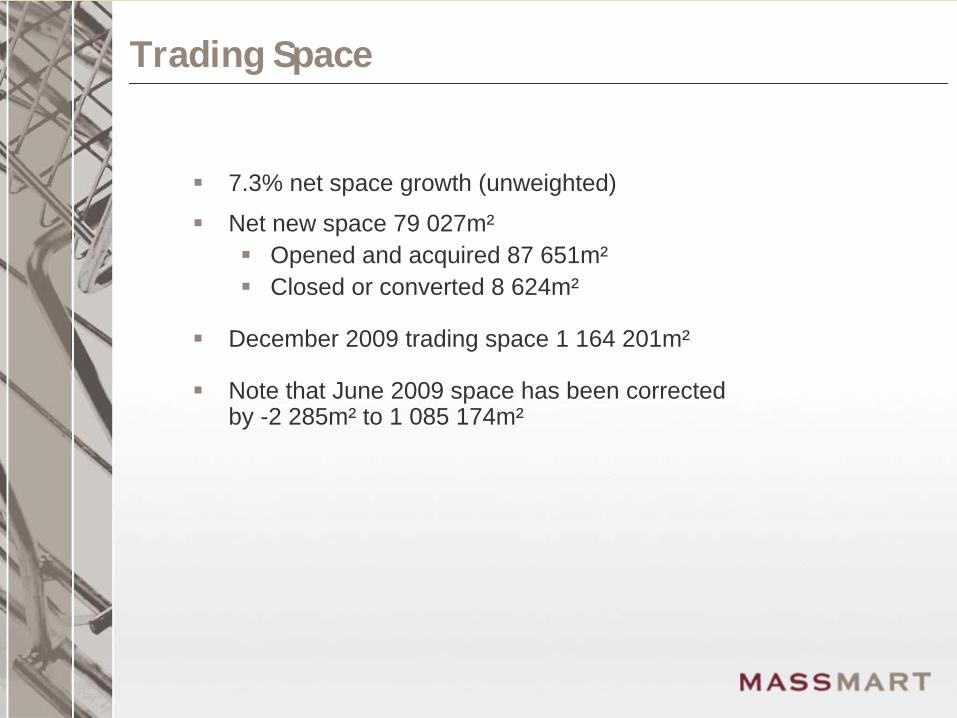
Trading Space
7.3% net space growth (unweighted)
Net new space 79 027m²
Opened and acquired 87 651m²
Closed or converted 8 624m²
December 2009 trading space 1 164 201m²
Note that June 2009 space has been corrected by -2 285m² to 1 085 174m²
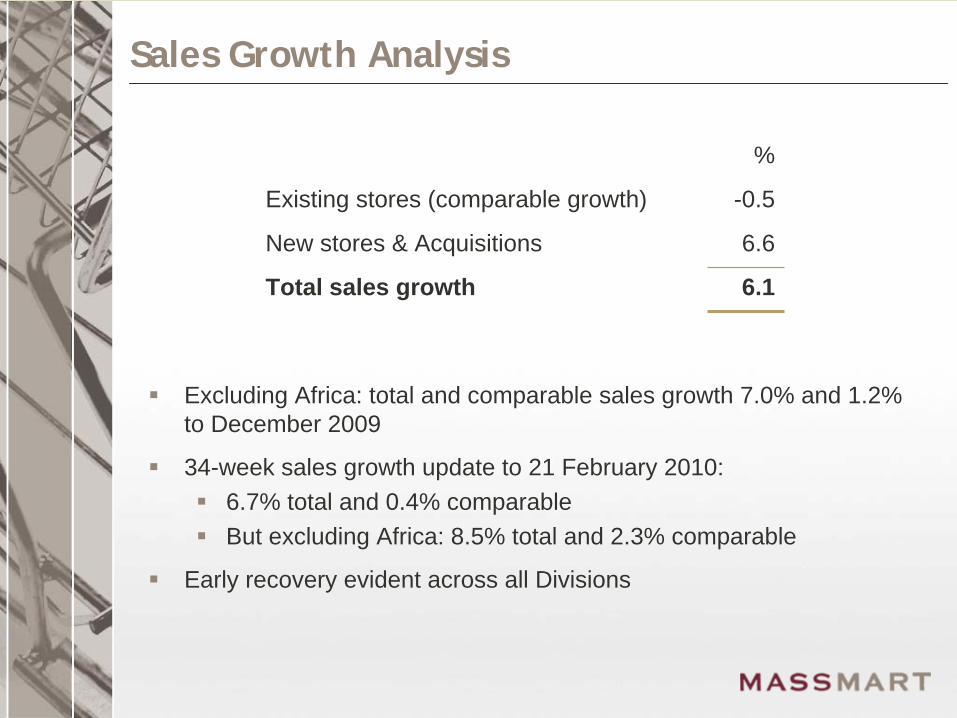
Sales Growth Analysis
Excluding Africa: total and comparable sales growth 7.0% and 1.2% to December 2009
34-week sales growth update to 21 February 2010:
6.7% total and 0.4% comparable
But excluding Africa: 8.5% total and 2.3% comparable
Early recovery evident across all Divisions
%
Existing stores (comparable growth) -0.5
New stores & Acquisitions 6.6
Total sales growth 6.1
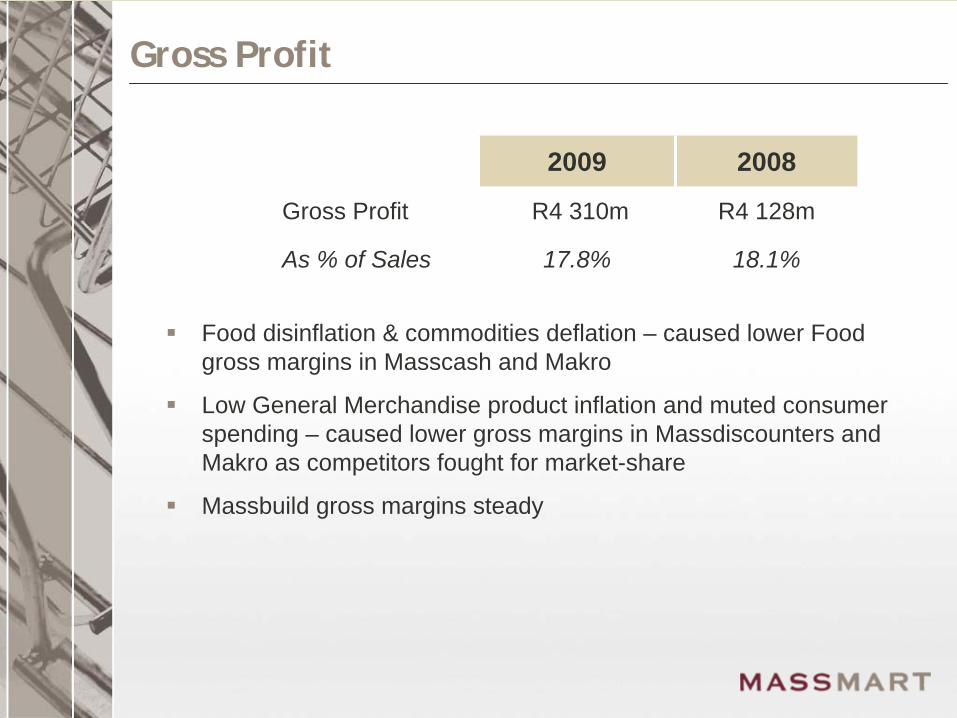
Gross Profit
2009 2008
Gross Profit R4 310m R4 128m
As % of Sales 17.8% 18.1%
Food disinflation & commodities deflation – caused lower Food gross margins in Masscash and Makro
Low General Merchandise product inflation and muted consumer spending – caused lower gross margins in Massdiscounters and Makro as competitors fought for market-share
Massbuild gross margins steady
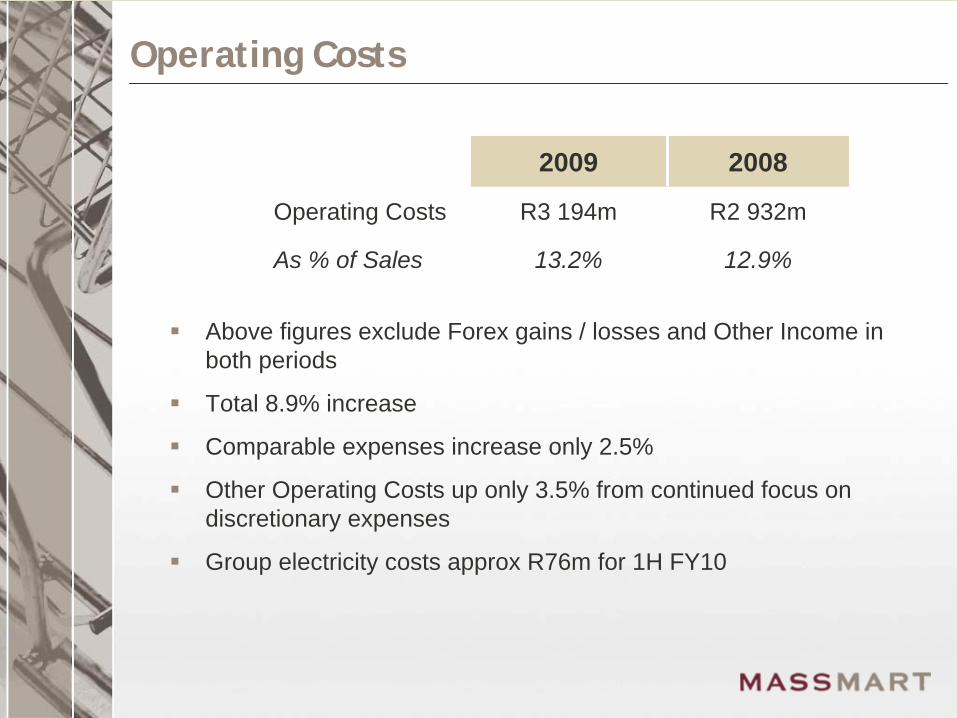
Operating Costs
2009 2008
Operating Costs R3 194m R2 932m
As % of Sales 13.2% 12.9%
Above figures exclude Forex gains / losses and Other Income in both periods
Total 8.9% increase
Comparable expenses increase only 2.5%
Other Operating Costs up only 3.5% from continued focus on discretionary expenses
Group electricity costs approx R76m for 1H FY10
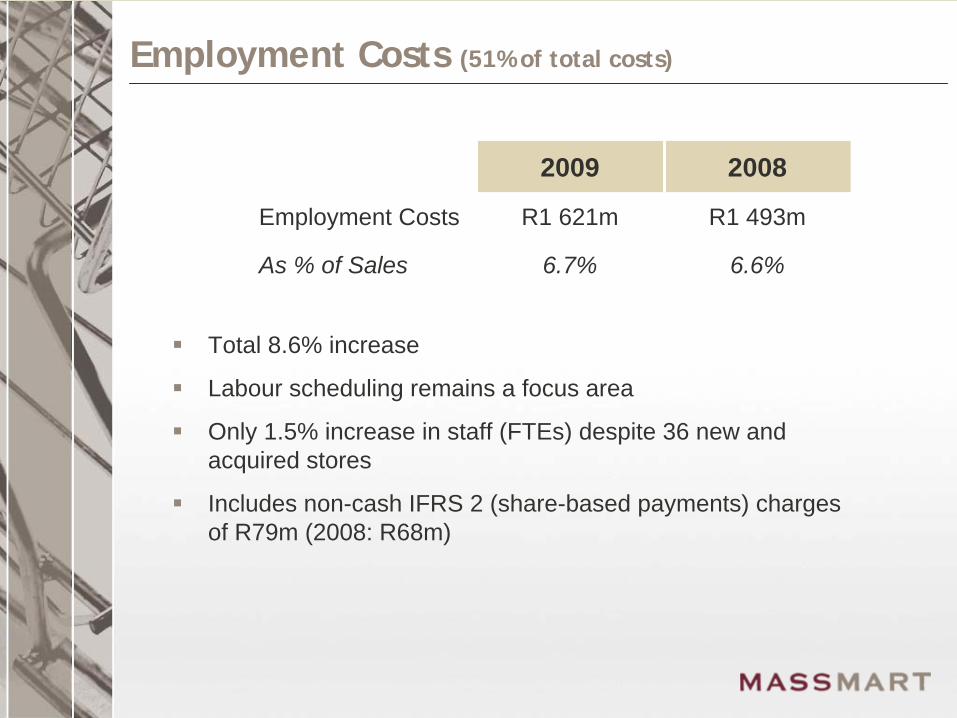
Employment Costs (51% of total costs)
2009 2008
Employment Costs R1 621m R1 493m
As % of Sales 6.7% 6.6%
Total 8.6% increase
Labour scheduling remains a focus area
Only 1.5% increase in staff (FTEs) despite 36 new and acquired stores
Includes non-cash IFRS 2 (share-based payments) charges of R79m (2008: R68m)
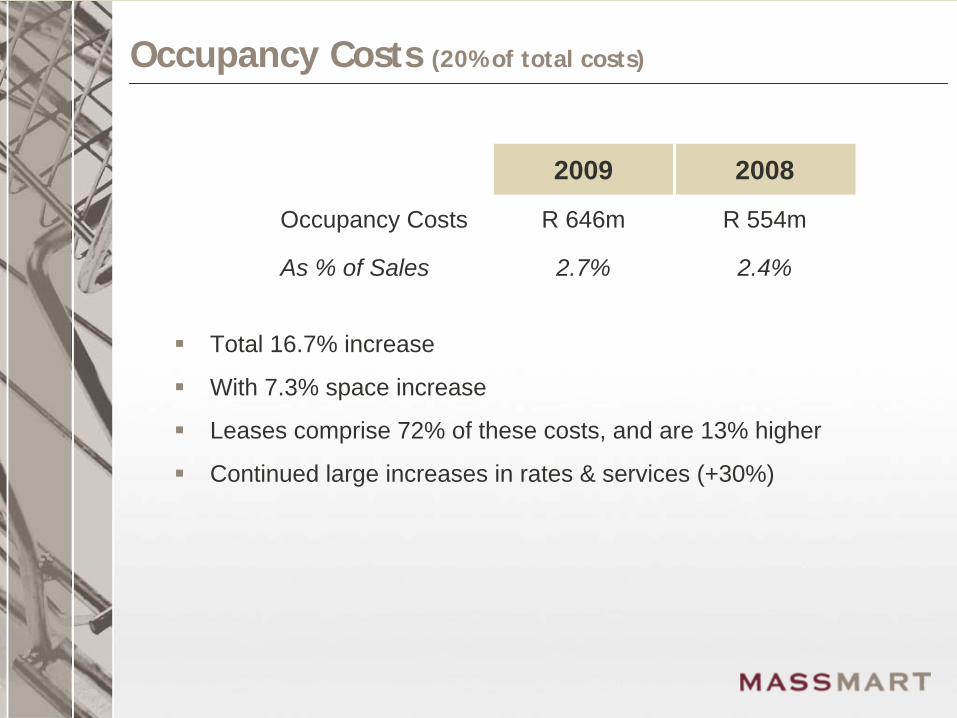
Occupancy Costs (20% of total costs)
2009 2008
Occupancy Costs R 646m R 554m
As % of Sales 2.7% 2.4%
Total 16.7% increase
With 7.3% space increase
Leases comprise 72% of these costs, and are 13% higher
Continued large increases in rates & services (+30%)
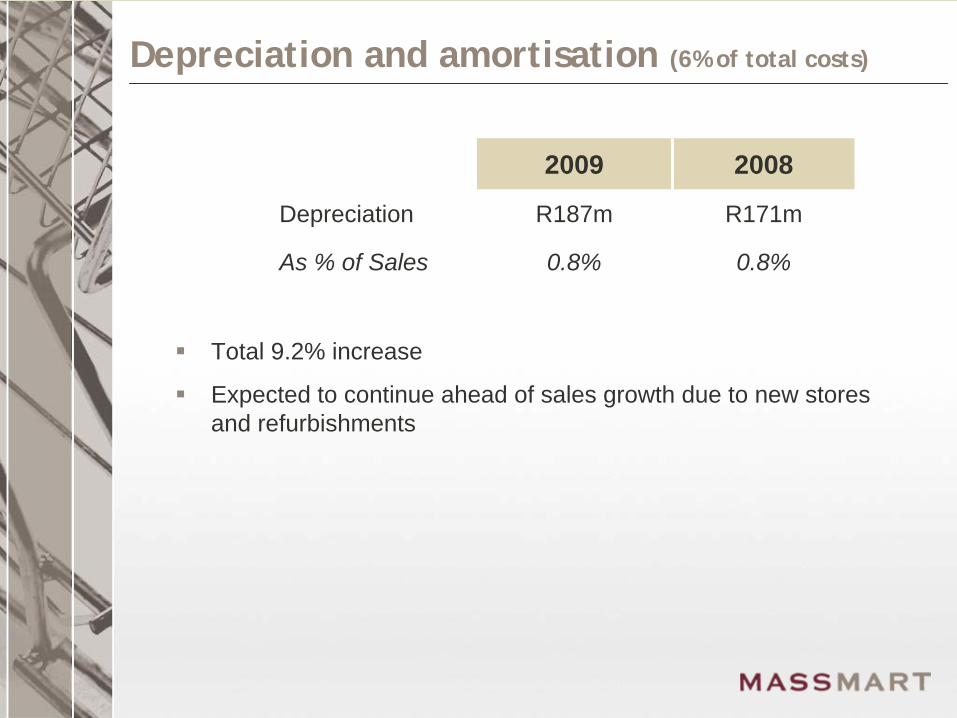
Depreciation and amortisation (6% of total costs)
2009 2008
Depreciation R187m R171m
As % of Sales 0.8% 0.8%
Total 9.2% increase
Expected to continue ahead of sales growth due to new stores and refurbishments
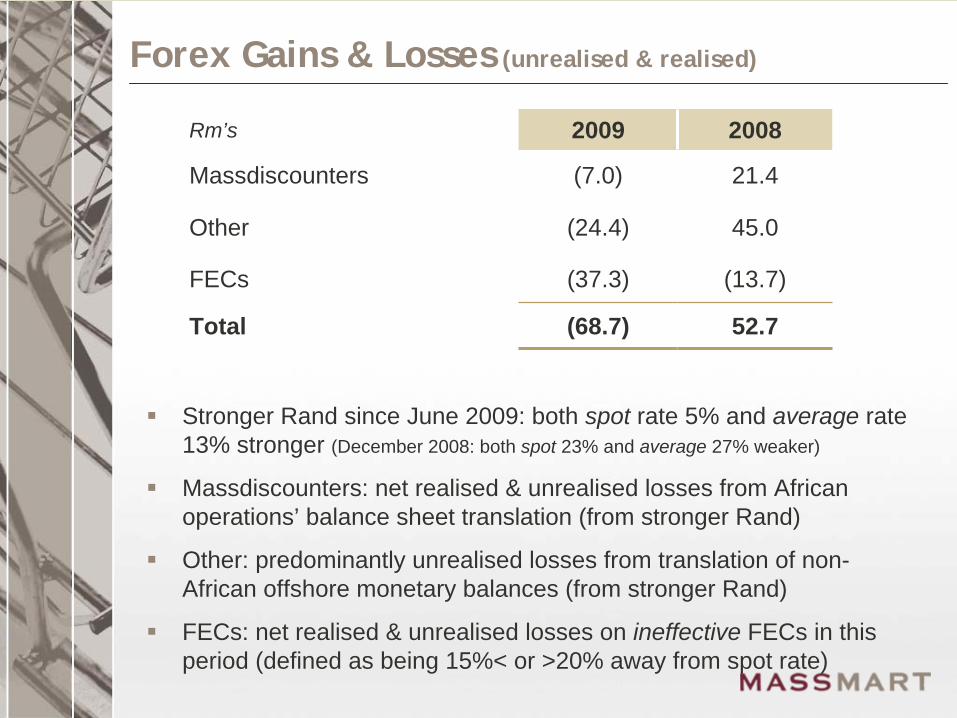
Forex Gains & Losses (unrealised & realised)
Rm’s 2009 2008
Massdiscounters (7.0) 21.4
Other (24.4) 45.0
FECs (37.3) (13.7)
Total (68.7) 52.7
Stronger Rand since June 2009: both spot rate 5% and average rate 13% stronger (December 2008: both spot 23% and average 27% weaker)
Massdiscounters: net realised & unrealised losses from African operations’ balance sheet translation (from stronger Rand)
Other: predominantly unrealised losses from translation of non- African offshore monetary balances (from stronger Rand)
FECs: net realised & unrealised losses on ineffective FECs in this period (defined as being 15%< or >20% away from spot rate)
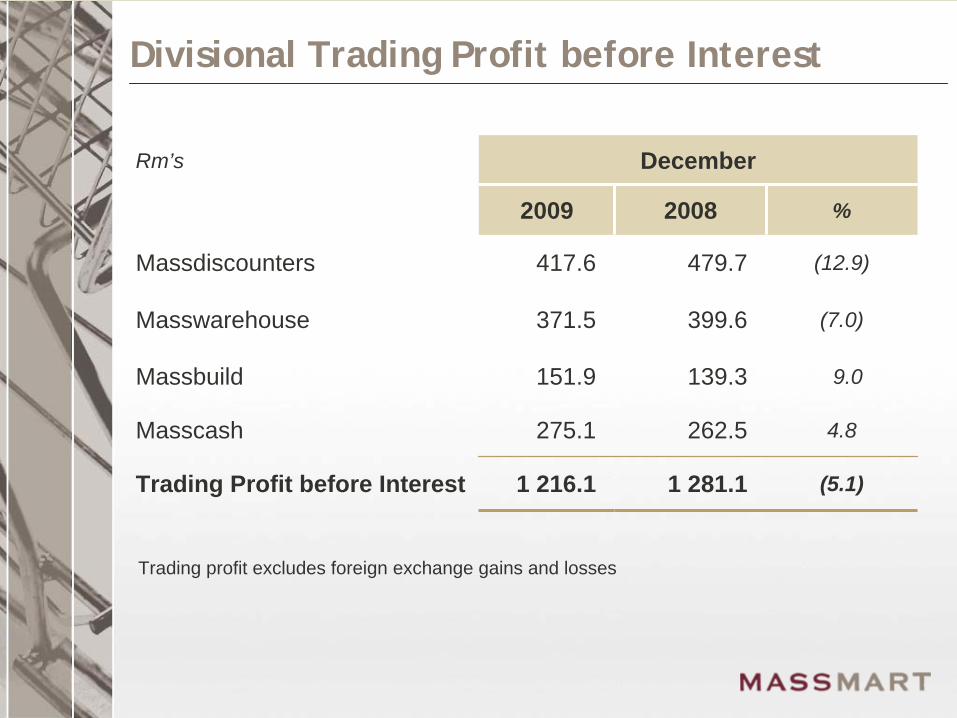
Divisional Trading Profit before Interest
Rm’s December
2009 2008 %
Massdiscounters 417.6 479.7 (12.9)
Masswarehouse 371.5 399.6 (7.0)
Massbuild 151.9 139.3 9.0
Masscash 275.1 262.5 4.8
Trading Profit before Interest 1 216.1 1 281.1 (5.1)
Trading profit excludes foreign exchange gains and losses
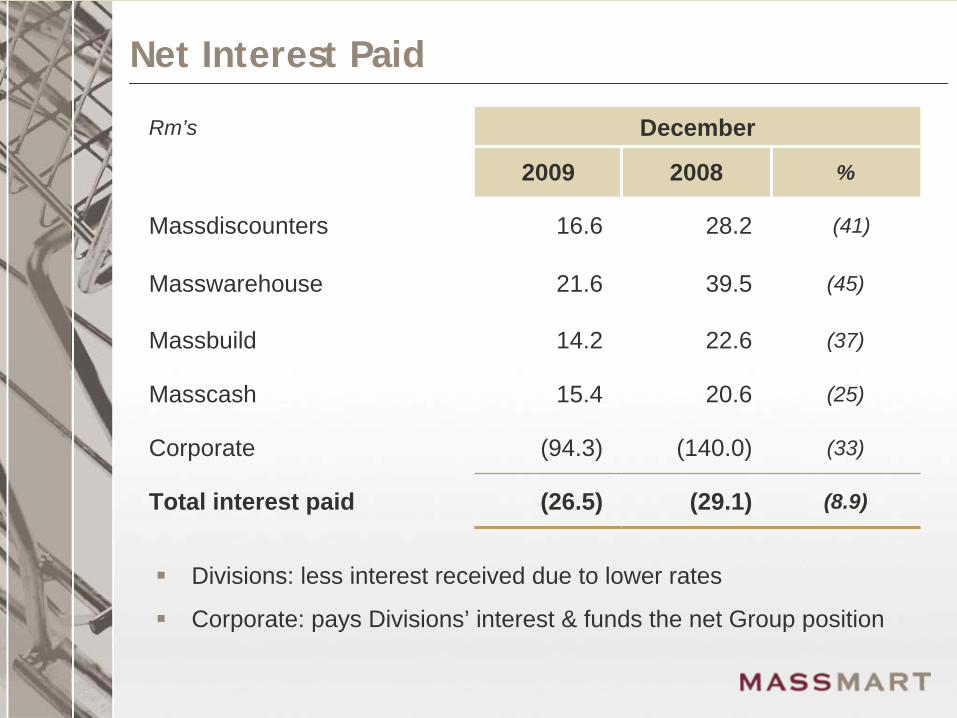
Net Interest Paid
Rm’s December
2009 2008 %
Massdiscounters 16.6 28.2 (41)
Masswarehouse 21.6 39.5 (45)
Massbuild 14.2 22.6 (37)
Masscash 15.4 20.6 (25)
Corporate (94.3) (140.0) (33)
Total interest paid (26.5) (29.1) (8.9)
Divisions: less interest received due to lower rates
Corporate: pays Divisions’ interest & funds the net Group position
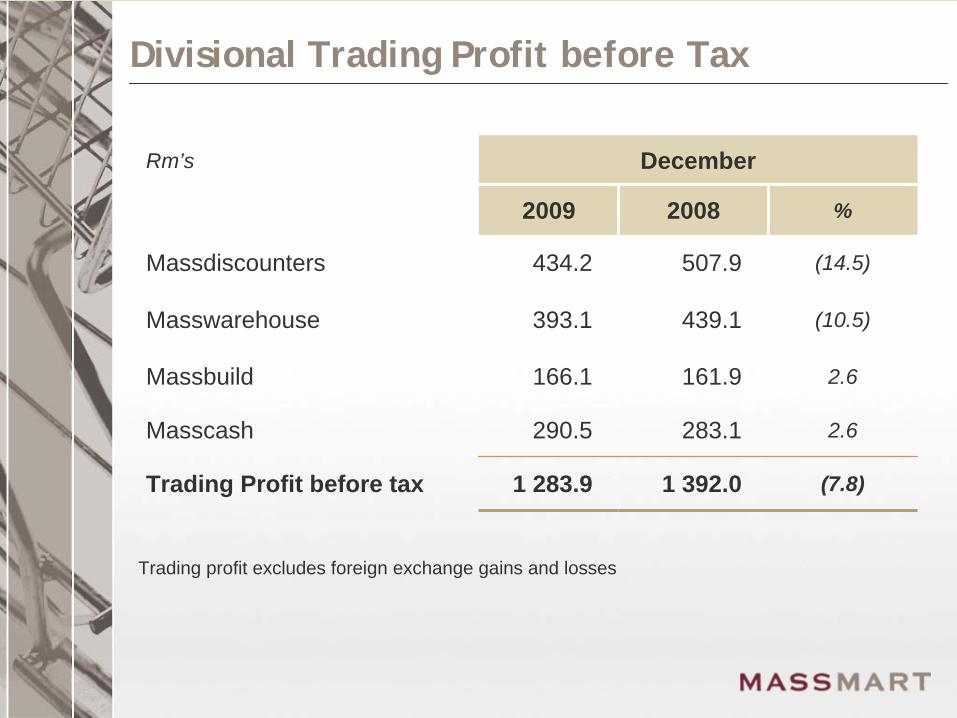
Divisional Trading Profit before Tax
Rm’s December
2009 2008 %
Massdiscounters 434.2 507.9 (14.5)
Masswarehouse 393.1 439.1 (10.5)
Massbuild 166.1 161.9 2.6
Masscash 290.5 283.1 2.6
Trading Profit before tax 1 283.9 1 392.0 (7.8)
Trading profit excludes foreign exchange gains and losses

Tax Charge
2009 2008
Total tax R345m R378m
Tax rate 31.9% 29.7%
Non-deductible IFRS 2 charges increase this tax rate by 2.2% (2008: 1.5%)
Includes STC on dividends 2.8% (2008: 2.1%)
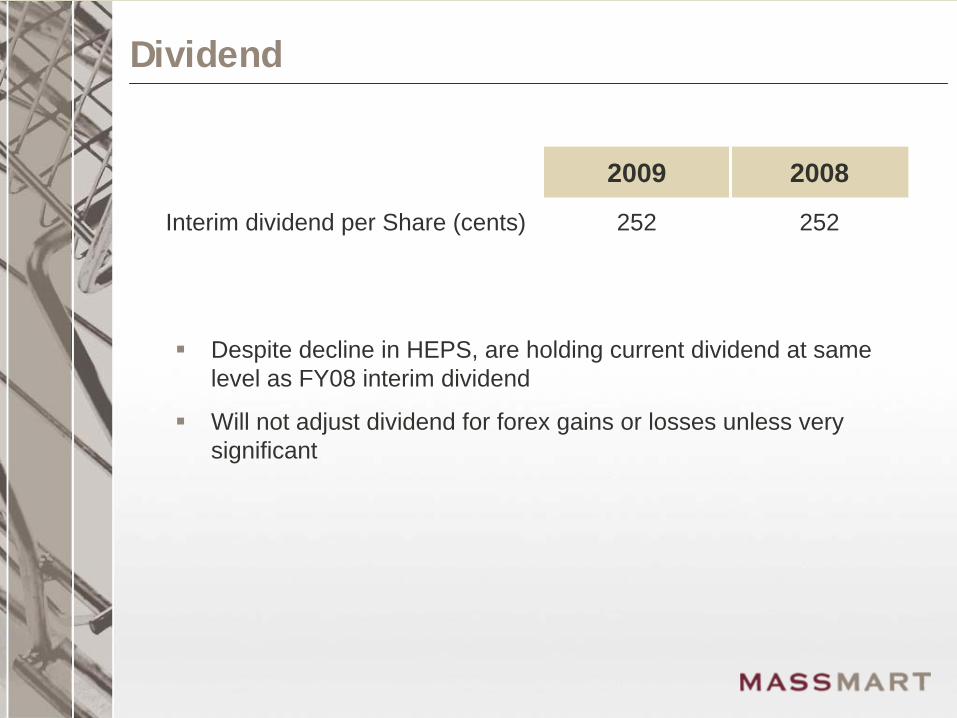
Dividend
2009 2008
Interim dividend per Share (cents) 252 252
Despite decline in HEPS, are holding current dividend at same level as FY08 interim dividend
Will not adjust dividend for forex gains or losses unless very significant
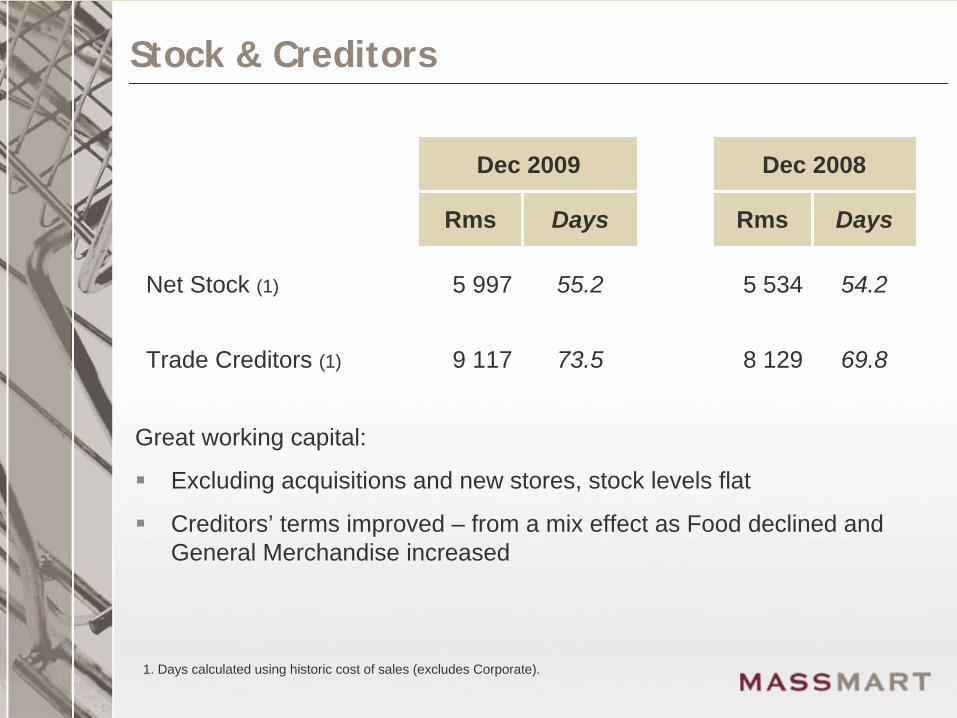
Stock & Creditors
Dec 2009 Dec 2008
Rms Days Rms Days
Net Stock (1) 5 997 55.2 5 534 54.2
Trade Creditors (1) 9 117 73.5 8 129 69.8
1. Days calculated using historic cost of sales (excludes Corporate).
Great working capital:
Excluding acquisitions and new stores, stock levels flat
Creditors’ terms improved – from a mix effect as Food declined and General Merchandise increased
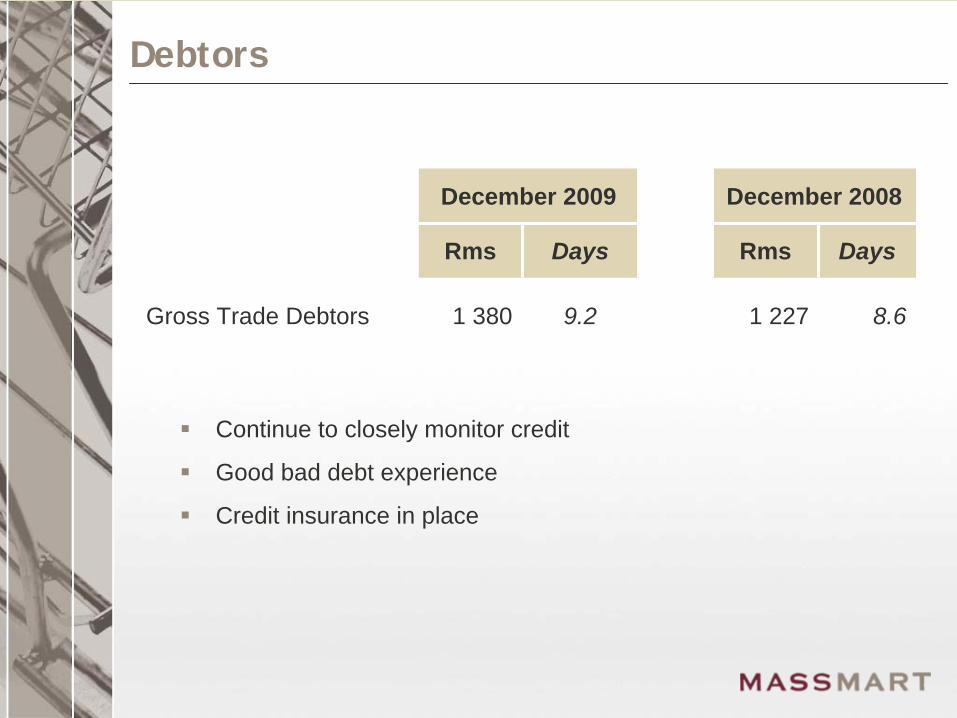
Debtors
December 2009 December 2008
Rms Days Rms Days
Gross Trade Debtors 1 380 9.2 1 227 8.6
Continue to closely monitor credit
Good bad debt experience
Credit insurance in place

Net Capital Expenditure
Rm’s Dec 2009 Dec 2008
Replacement Capex 138 124
Investment Capex 154 215
Total Capex 292 339
Depreciation & amortisation 187 171
Businesses acquired 146 147
Major replacement items: IT and refurbs
Major investment items: new stores R108m
Acquired seven businesses with 25 stores
Group Gearing
Average Group net borrowings R295m (2008: R213m), calculated using net interest paid.
Average net gearing of 8% (2008: 7%), ignoring property leases
Making some progress with selected property acquisitions, both for new sites and existing leased properties
Continue to explore possible acquisition opportunities
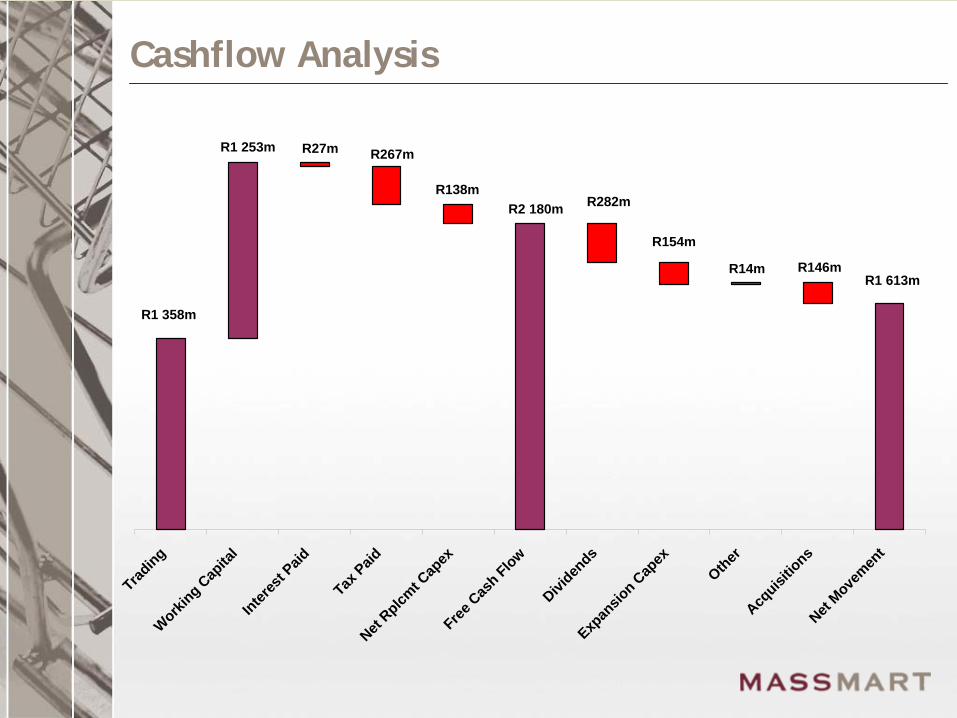
Cashflow Analysis
Trading
Working C
apita
lInter
est P
aid
Tax Paid
Net Rplcm
t Cap
exFree
Cas
h Flow
Dividen
dsExp
ansio
n Cap
ex
OtherAcq
uisitio
nsNet
Movemen
t
R1 358m
R138m
R267mR1 253m
R1 613m
R282m
R154m
R14m
R2 180m
R27m
R146m
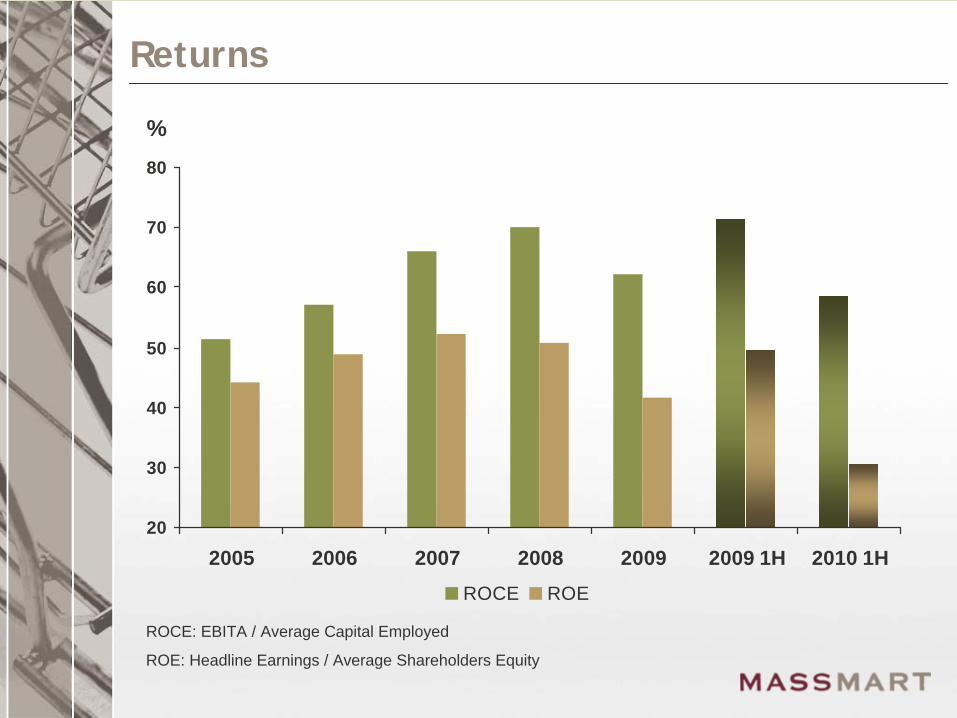
Returns
ROCE: EBITA / Average Capital Employed
ROE: Headline Earnings / Average Shareholders Equity
20
30
40
50
60
70
80
2005 2006 2007 2008 2009 2009 1H 2010 1H
%
ROCE ROE
Thuthukani BEE Staff Issue
Effective 1 October 2006. Remaining total Staff Scheme IFRS 2 charge R132m:
Still to be expensed over two years (six in total)
Estimated total charge for 2010: R70m
Non-cash and no tax relief
BEE Scheme Dividend: now 100% of ordinary dividend
In 2009 (calendar) 10 480 participating employees received an average dividend of R3 700 each
Associated IFRS 2 charge & Scheme dividend affected HEPS by 27.6 cents (2008: 21.3 cents)
First vesting (33%) this year in October at strike price R49.98
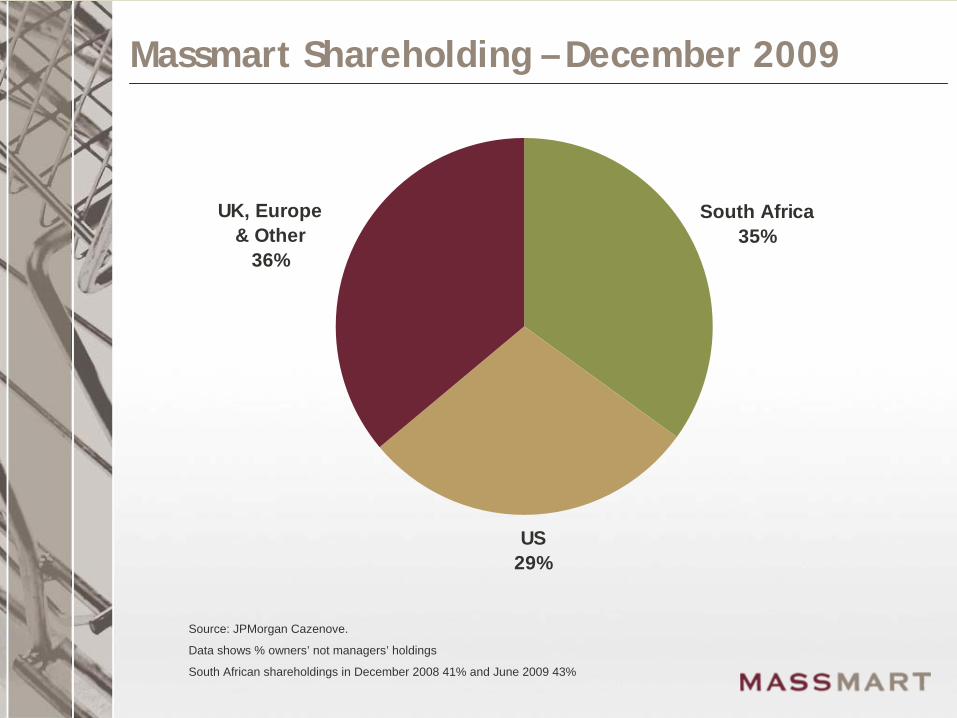
Massmart Shareholding – December 2009
South Africa35%
US29%
UK, Europe& Other
36%
Source: JPMorgan Cazenove.
Data shows % owners’ not managers’ holdings
South African shareholdings in December 2008 41% and June 2009 43%
December 2009 Divisional Financial Performance

Massdiscounters
2009 % changeSales R 6 114m 0.4%
PBT excl Forex R434m -14.5%
PBT margin 7.1%
Game SA: good sales growth and profit higher than FY09 1H
Higher promotional sales mix – negatively affected gross margins
Excluding new stores, stock levels below December 2008
New Gauteng RDC opening July 2010 – will cause a new R30m lease-smoothing charge in FY11
Africa:
FY09 saw super-profits: strong local sales & Rand weakness
Rand sales declined 25% and local currency sales declined 5%
Stronger Rand caused R7m forex loss (2008: R21m gain) in 1H
A R128m forex charge in FY09 2H – unlikely to be repeated
Repatriation of cash only a problem in one country
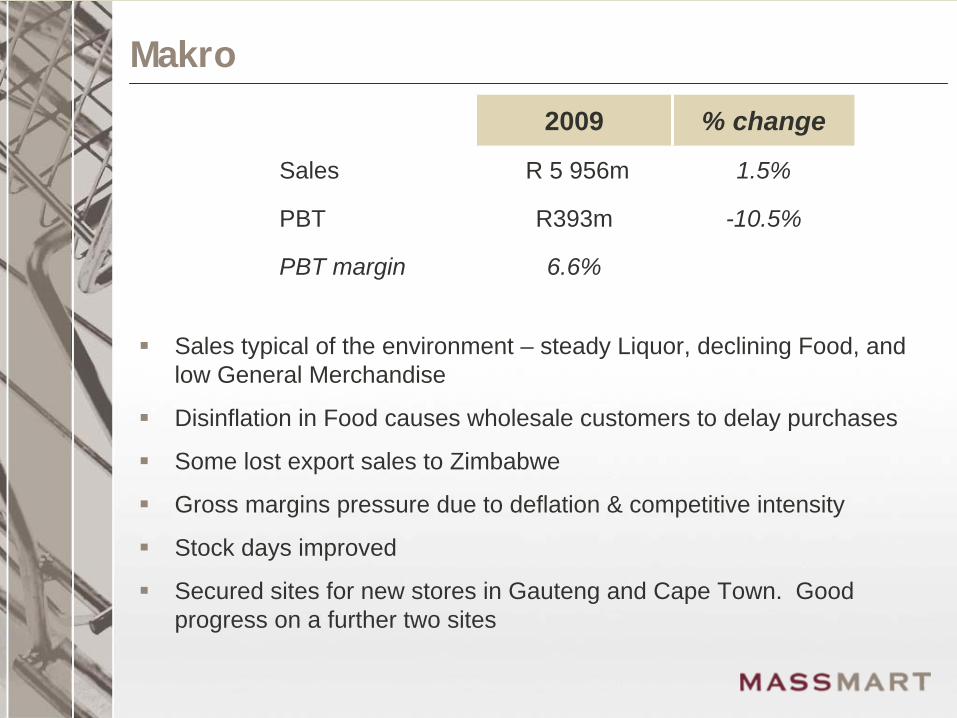
Makro
2009 % change
Sales R 5 956m 1.5%
PBT R393m -10.5%
PBT margin 6.6%
Sales typical of the environment – steady Liquor, declining Food, and low General Merchandise
Disinflation in Food causes wholesale customers to delay purchases
Some lost export sales to Zimbabwe
Gross margins pressure due to deflation & competitive intensity
Stock days improved
Secured sites for new stores in Gauteng and Cape Town. Good progress on a further two sites
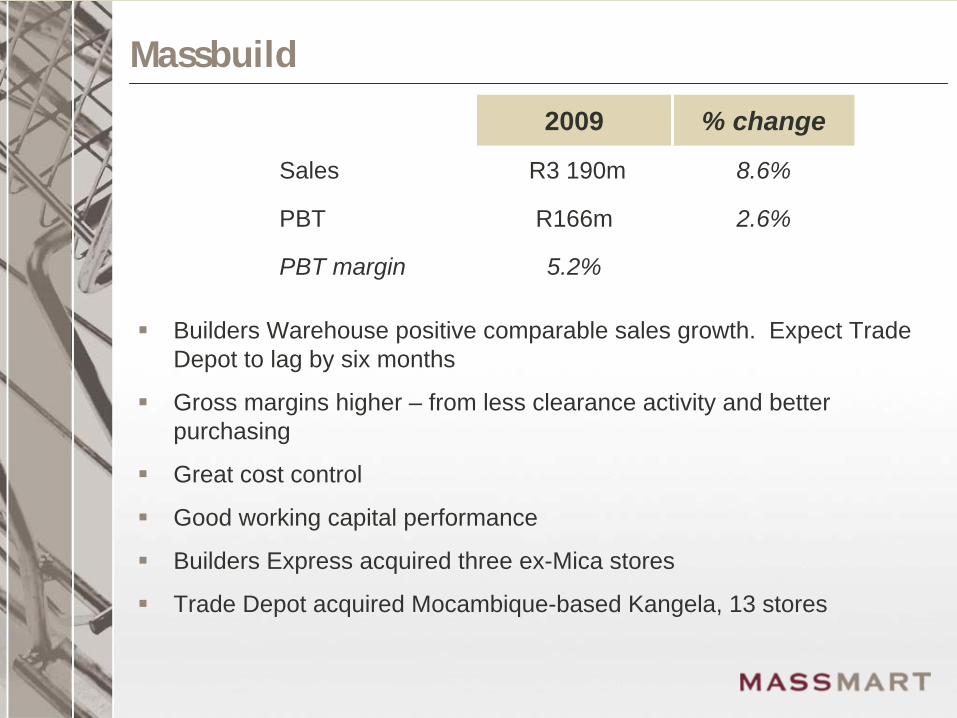
Massbuild
2009 % change
Sales R3 190m 8.6%
PBT R166m 2.6%
PBT margin 5.2%
Builders Warehouse positive comparable sales growth. Expect Trade Depot to lag by six months
Gross margins higher – from less clearance activity and better purchasing
Great cost control
Good working capital performance
Builders Express acquired three ex-Mica stores
Trade Depot acquired Mocambique-based Kangela, 13 stores
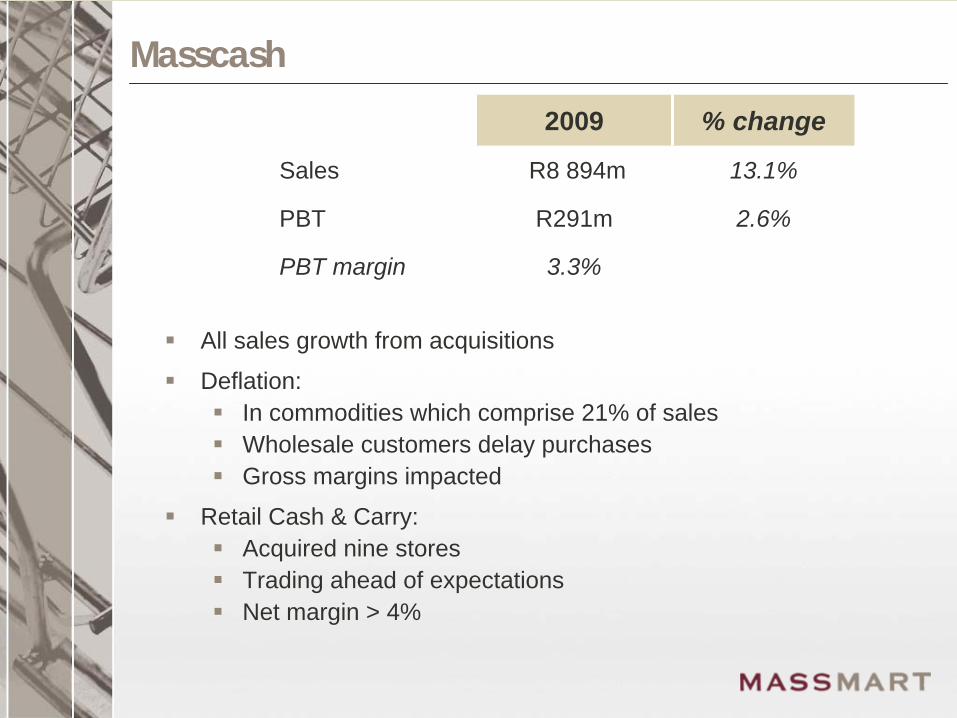
Masscash
2009 % change
Sales R8 894m 13.1%
PBT R291m 2.6%
PBT margin 3.3%
All sales growth from acquisitions
Deflation:
In commodities which comprise 21% of sales
Wholesale customers delay purchases
Gross margins impacted
Retail Cash & Carry:
Acquired nine stores
Trading ahead of expectations
Net margin > 4%

Highlights of the Operational Performance

Group Operating Performance Highlights
Dec 09
Total Sales growth +6.1% 7.3% Additional space
Comparable Sales growth -0.5% Low inflation and negative volumes
Comparable store expense growth +2.5% Great expense control
Decrease in Trading Profit excl Forex -7.8% Negative operating leverage
Increase in Inventories +8.4% Like for like Inventories flat
Increase in Cash Generated by Ops +2.2% Core business intact
Good progress with Retail Cash and Carry R2.5bn * Building a team and learning
BEE scorecard 66% 2 years ahead of plan
* Annualised
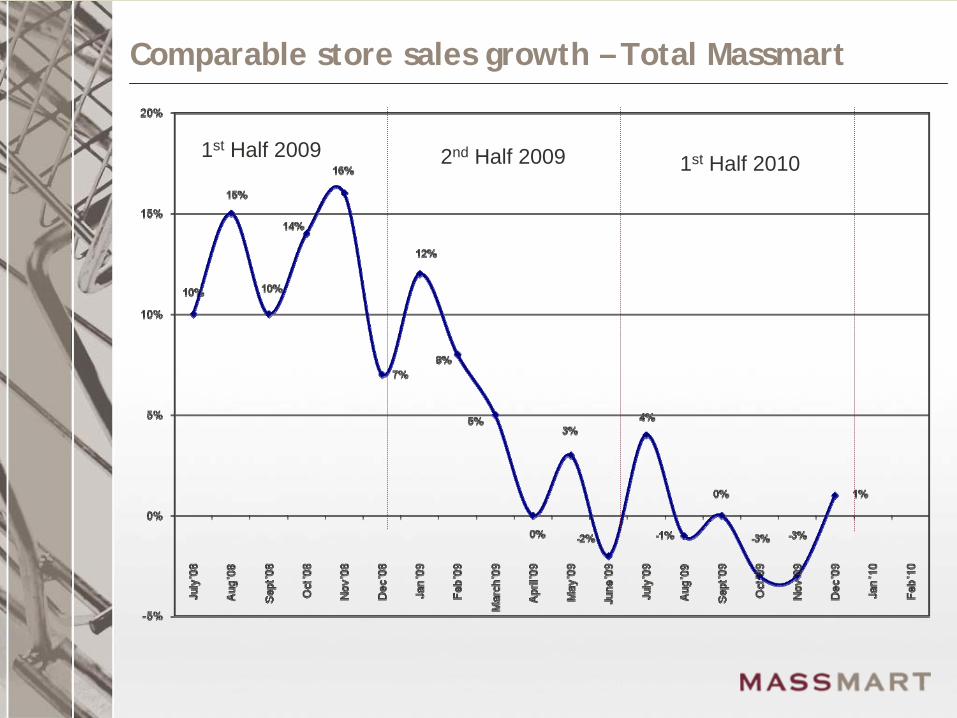
Comparable store sales growth – Total Massmart
1st Half 2009 2nd Half 2009 1st Half 2010
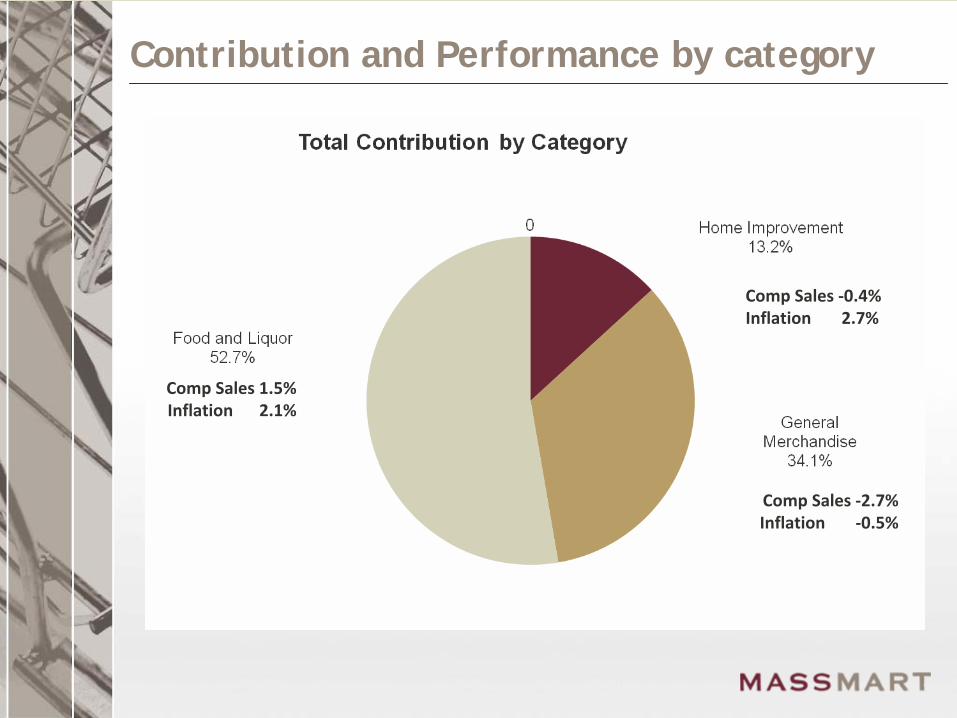
Contribution and Performance by category
Comp Sales 1.5%Inflation
2.1%
Comp Sales ‐2.7%Inflation
‐0.5%
Comp Sales ‐0.4%Inflation
2.7%

December 2009 Divisional Financial Performance
Massdiscounters
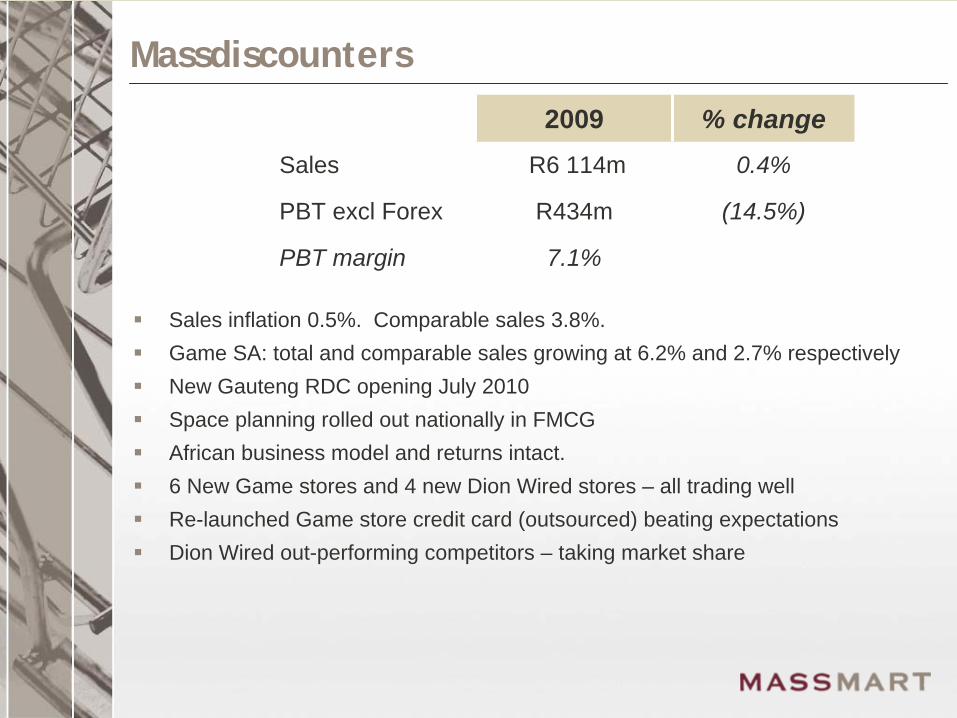
2009 % changeSales R6 114m 0.4%
PBT excl Forex R434m (14.5%)
PBT margin 7.1%
Sales inflation 0.5%. Comparable sales 3.8%.
Game SA: total and comparable sales growing at 6.2% and 2.7% respectively
New Gauteng RDC opening July 2010
Space planning rolled out nationally in FMCG
African business model and returns intact.
6 New Game stores and 4 new Dion Wired stores – all trading well
Re-launched Game store credit card (outsourced) beating expectations
Dion Wired out-performing competitors – taking market share

Makro
2009 % change
Sales R5 956m 1.5%
PBT R393m (10.5%)
PBT margin 6.6%
Sales inflation 5.1%. Comparable sales +1.5%.
Volumes under pressure in food as wholesale customers delay purchases in expectation of lower prices. Margins under pressure.
Great performance in liquor – taking market share.
General merchandise suffering with little inflation and volume growth.
Stock and costs well controlled.
Good progress on sites in Gauteng and Cape Town. Started building a new store in Vanderbijlpark – new layout.
Massbuild
2009 % change
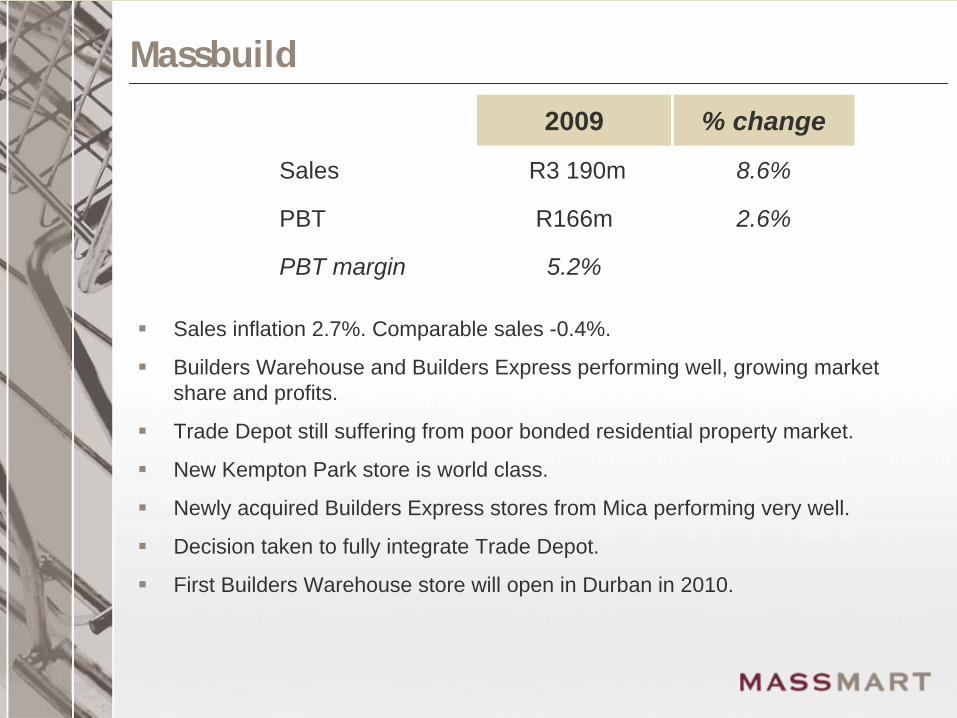
Sales R3 190m 8.6%
PBT R166m 2.6%
PBT margin 5.2%
Sales inflation 2.7%. Comparable sales -0.4%.
Builders Warehouse and Builders Express performing well, growing market share and profits.
Trade Depot still suffering from poor bonded residential property market.
New Kempton Park store is world class.
Newly acquired Builders Express stores from Mica performing very well.
Decision taken to fully integrate Trade Depot.
First Builders Warehouse store will open in Durban in 2010.

Masscash
2009 % change
Sales R8 894m 13.1%
PBT R291m 2.6%
PBT margin 3.3%
Sales inflation -0.4%. Comparable sales 0.1%. Inflation slowing. Deflation in some commodities.
Cash and Carry business suffering low food inflation and volumes.
Great operating performance with costs well controlled.
New Retail Cash and Carry business growing fast and should comfortably exceed R2bn target this year.
Deal and new-store pipeline growing.
Decision on National brand later this year.
Now have a food business in Mozambique.

Masscash Cont.
Retail
Number of Stores – 20
Space – 50,500 m2
Annualised turnover – R2.5bn
Average equity held – 55%
New acquisitions Astor, Sunshine, Top Spot and Kawena
First new store opened in Jabulani in Feb with 5 more in progress
Management team being assembled with now 8 Executives and Senior Managers in place
Environment
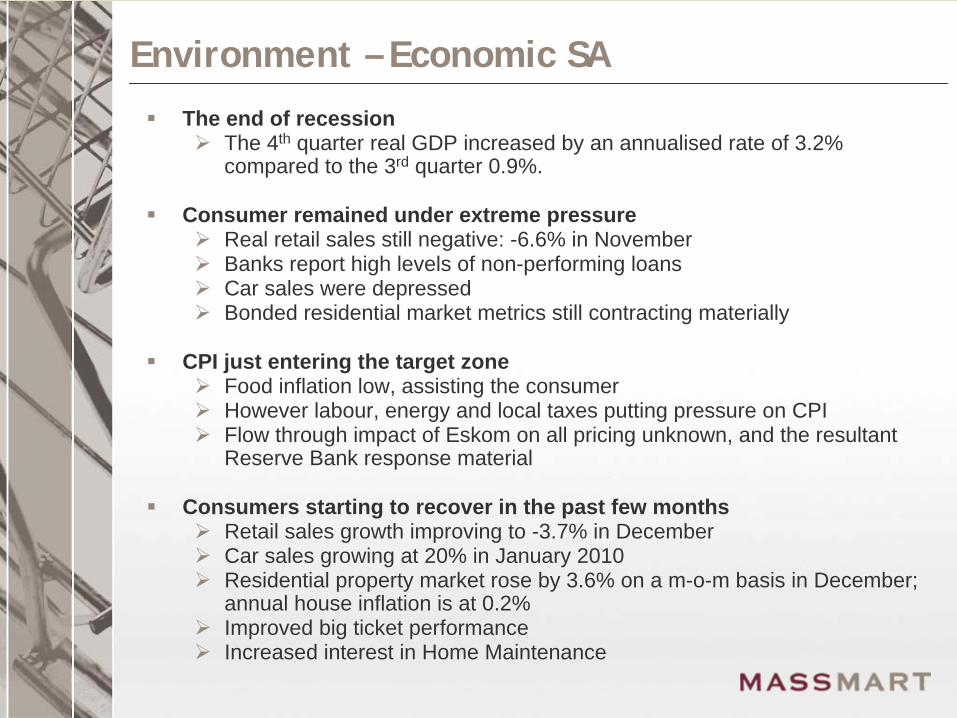
Environment – Economic SA
The end of recession
The 4th quarter real GDP increased by an annualised rate of 3.2% compared to the 3rd quarter 0.9%.
Consumer remained under extreme pressure
Real retail sales still negative: -6.6% in November
Banks report high levels of non-performing loans
Car sales were depressed
Bonded residential market metrics still contracting materially
CPI just entering the target zone
Food inflation low, assisting the consumer
However labour, energy and local taxes putting pressure on CPI
Flow through impact of Eskom on all pricing unknown, and the resultant Reserve Bank response material
Consumers starting to recover in the past few months
Retail sales growth improving to -3.7% in December
Car sales growing at 20% in January 2010
Residential property market rose by 3.6% on a m-o-m basis in December; annual house inflation is at 0.2%
Improved big ticket performance
Increased interest in Home Maintenance

Environment – Economic Africa
Impact of global crisis certainly evident in our Africa business
Currencies stabilising at weaker levels
Currency availability did not worsen, perhaps pointing to continued investment from China
Comparable local currency sales stabilised by December
CPI on imported goods in Africa greater than 20%, changing spending patterns significantly
Africa contribution to Massmart profit materially down

Environment – Competition Commission
We will be making a submission to the Commission in March in response to their subpoena.
Four allegations1. Market Concentration – rebates, discounts, slotting fees etc2. Long Leases with exclusivity clauses3. Category Captains4. Information Sharing
No allegations of “prohibitive acts”.
Investigation under “rule of reason” section.
Without pre-judging the outcome, we have not found any reportable transgressions in our own internal reviews.
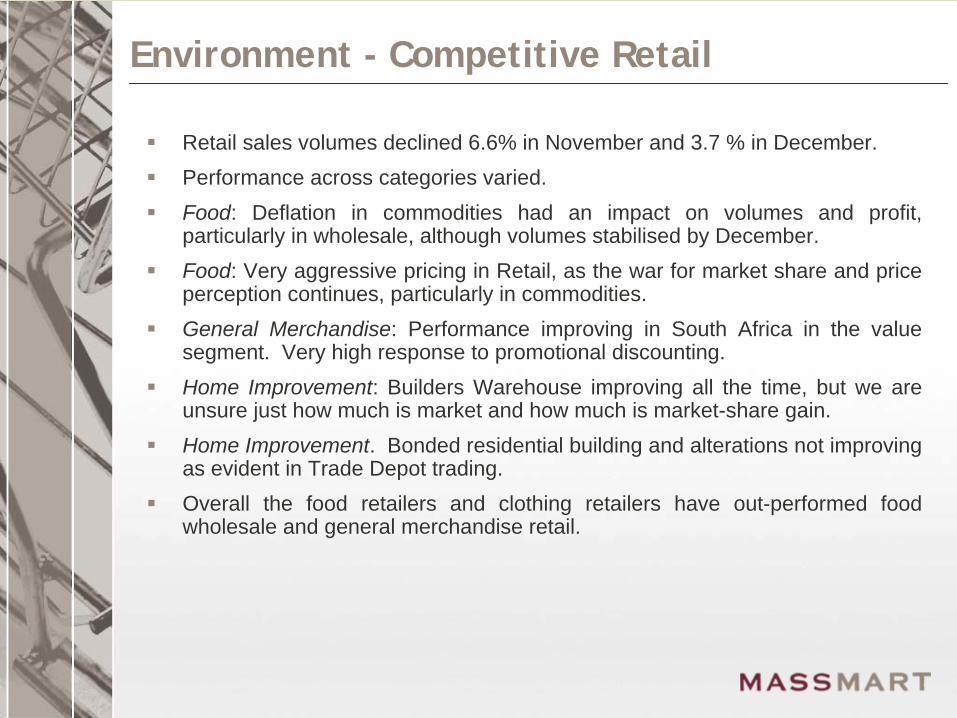
Environment - Competitive Retail
Retail sales volumes declined 6.6% in November and 3.7 % in December.
Performance across categories varied.
Food: Deflation in commodities had an impact on volumes and profit, particularly in wholesale, although volumes stabilised by December.
Food: Very aggressive pricing in Retail, as the war for market share and price perception continues, particularly in commodities.
General Merchandise: Performance improving in South Africa in the value segment. Very high response to promotional discounting.
Home Improvement: Builders Warehouse improving all the time, but we are unsure just how much is market and how much is market-share gain.
Home Improvement. Bonded residential building and alterations not improving as evident in Trade Depot trading.
Overall the food retailers and clothing retailers have out-performed food wholesale and general merchandise retail.
Vision for Growth 2012

Leadership and Transformation
Growth of the core business
New stores (expanding footprint)
New formats and categories
Acquisitions
Sustainability
Update on Vision for Growth 2012

A new group of 43 Graduates, 97% PDI, recruited and in training. 70% of prior year appointed or in the process of being appointed.
Massmart University EDP, MDP, LDP 2010 programs initiated.
Supply Chain and Private Label now imbedded in core Group processes and philosophy.
Begun process to put Financial Services into Massbuild.
7.3% space opened or acquired. Retail Cash and Carry business growth gaining momentum and ahead of expectations.
BEE scorecard up to 66% - with 100% of purchases from us qualifying as BEE procurement.
Vision for Growth 2012 - Progress
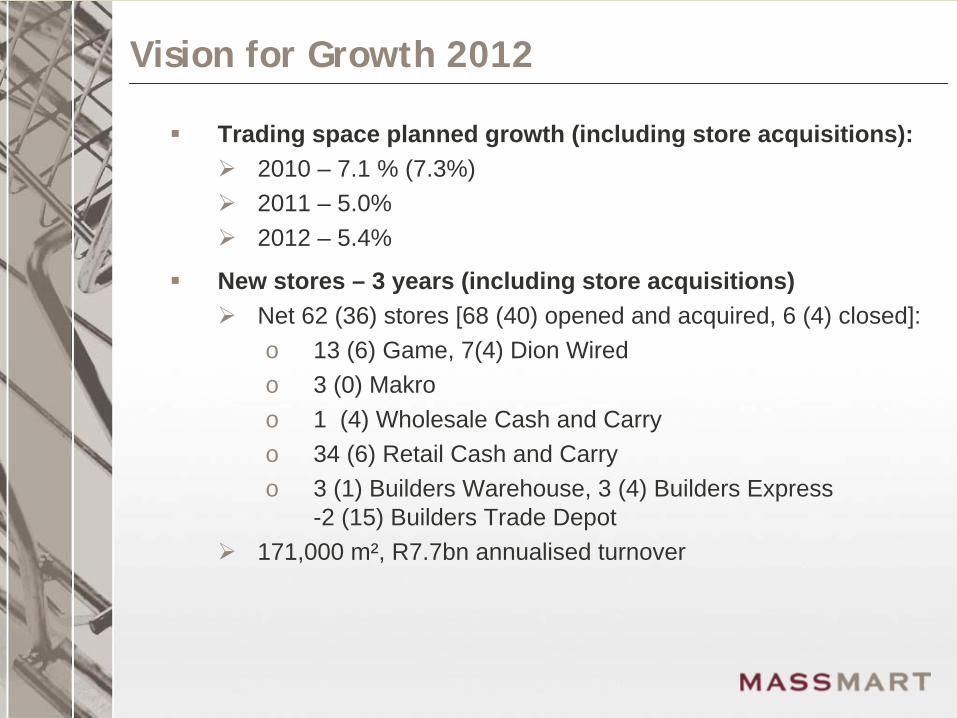
Trading space planned growth (including store acquisitions):
2010 – 7.1 % (7.3%)
2011 – 5.0%
2012 – 5.4%
New stores – 3 years (including store acquisitions)
Net 62 (36) stores [68 (40) opened and acquired, 6 (4) closed]: o 13 (6) Game, 7(4) Dion Wiredo 3 (0) Makroo 1 (4) Wholesale Cash and Carryo 34 (6) Retail Cash and Carryo 3 (1) Builders Warehouse, 3 (4) Builders Express
-2 (15) Builders Trade Depot
171,000 m², R7.7bn annualised turnover
Vision for Growth 2012
Vision for Growth 2013 A New Focus

Coming to the end of my first 3 years in “Office”.
Investment in systems, infrastructure and competency has been material and will continue.
We have a fantastic portfolio: Human Capital, Property Assets, Culture, Competencies and Brands.
We have been inwardly focussed for the past 12 months
With the worst behind us our attentions will be on growing market share through great retail innovation and discipline.
We have fantastic opportunities in new revised formats and categories.
Over the next six months we will develop and approve a new Strategic Action Plan for Vision for Growth 2013.
Communicate in August 2010.
Vision for Growth 2013 – A New Focus

Risks & Prospects
Massmart’s 2010 Prospects
The worst appears to be behind us
Last 8 weeks comparable sales growth of 3.4%.

Comparable store sales growth – Total Massmart
7%
10%
15%
10%
14%
16%
12%
8%
5%
0%
3%
-2%
4%
-1%
0%
-3% -3%
1%
3%
5%
-5%
0%
5%
10%
15%
20%
July
'08
Aug
'08
Sept
'08
Oct
'08
Nov
'08
Dec
'08
Jan
'09
Feb
'09
Mar
ch '0
9
April
'09
May
'09
June
'09
July
'09
Aug
'09
Sept
'09
Oct
'09
Nov
'09
Dec
'09
Jan
'10
Feb
'10
1st Half 2009 2nd Half 2009 1st Half 2010
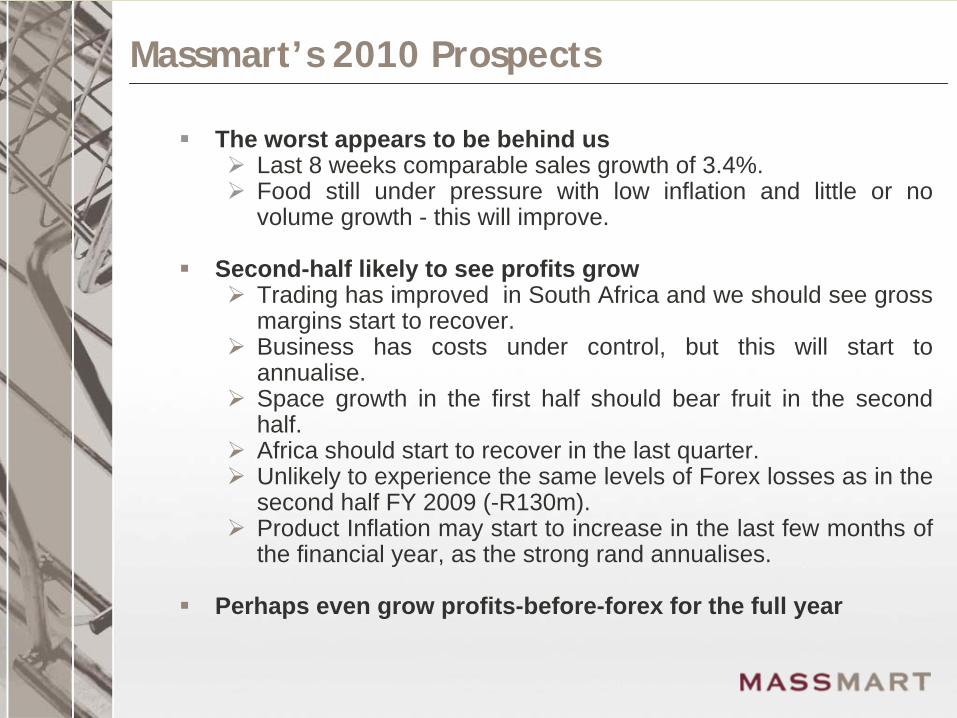
Massmart’s 2010 Prospects
The worst appears to be behind us
Last 8 weeks comparable sales growth of 3.4%.
Food still under pressure with low inflation and little or no volume growth - this will improve.
Second-half likely to see profits grow
Trading has improved in South Africa and we should see gross margins start to recover.
Business has costs under control, but this will start to annualise.
Space growth in the first half should bear fruit in the second half.
Africa should start to recover in the last quarter.
Unlikely to experience the same levels of Forex losses as in the second half FY 2009 (-R130m).
Product Inflation may start to increase in the last few months of the financial year, as the strong rand annualises.
Perhaps even grow profits-before-forex for the full year
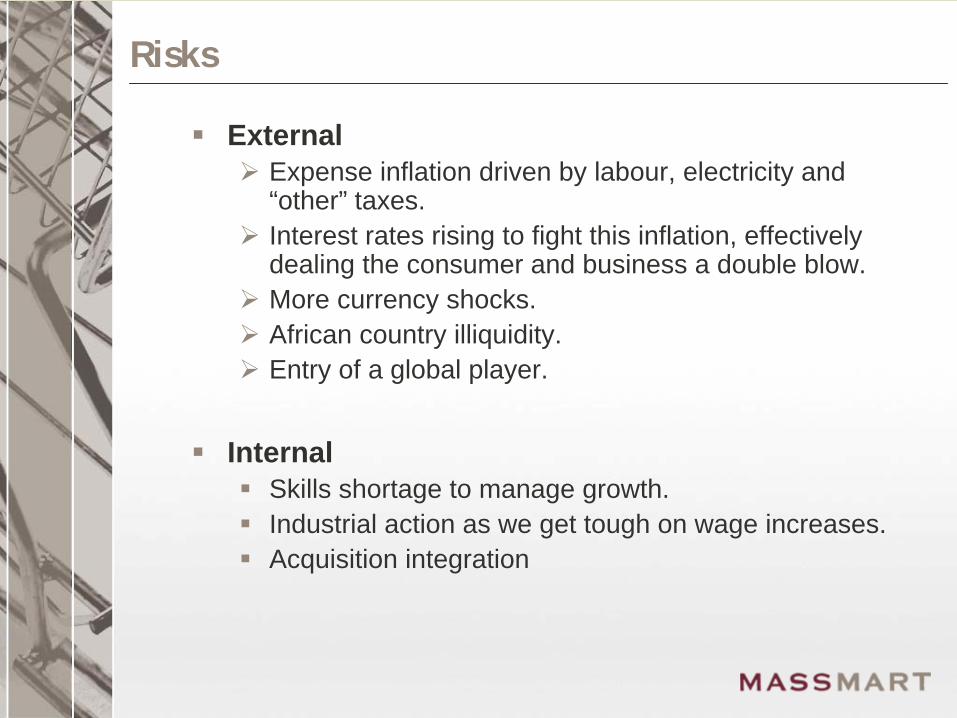
Risks
External
Expense inflation driven by labour, electricity and “other” taxes.
Interest rates rising to fight this inflation, effectively dealing the consumer and business a double blow.
More currency shocks.
African country illiquidity.
Entry of a global player.
Internal
Skills shortage to manage growth.
Industrial action as we get tough on wage increases.
Acquisition integration

Conclusion
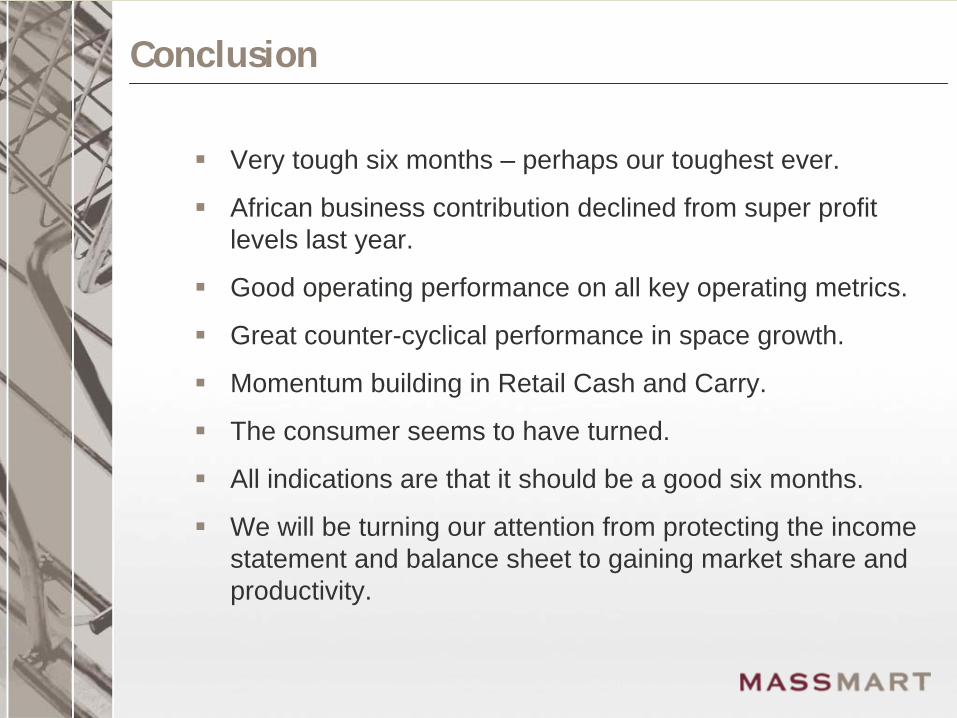
Conclusion
Very tough six months – perhaps our toughest ever.
African business contribution declined from super profit levels last year.
Good operating performance on all key operating metrics.
Great counter-cyclical performance in space growth.
Momentum building in Retail Cash and Carry.
The consumer seems to have turned.
All indications are that it should be a good six months.
We will be turning our attention from protecting the income statement and balance sheet to gaining market share and productivity.
Additional Financial Data
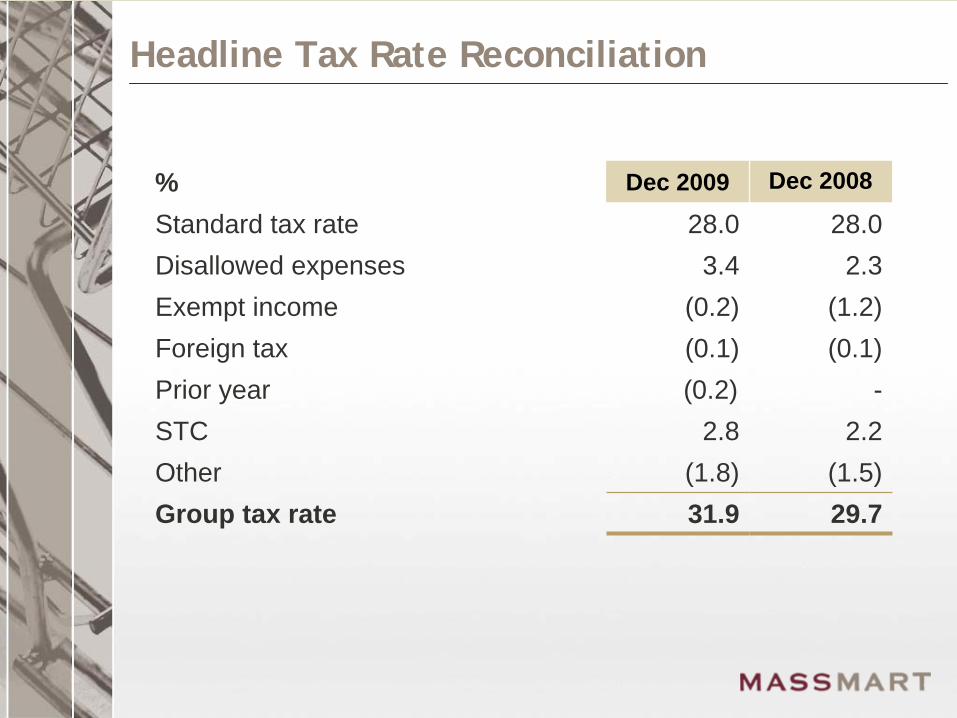
Headline Tax Rate Reconciliation
% Dec 2009 Dec 2008
Standard tax rate 28.0 28.0Disallowed expenses 3.4 2.3Exempt income (0.2) (1.2)Foreign tax (0.1) (0.1)Prior year (0.2) -STC 2.8 2.2Other (1.8) (1.5)Group tax rate 31.9 29.7

Analysis of Tax Charge
Rm’s Dec 2009 Dec 2008
SA tax 256.4 289.6
STC 21.0 32.4
Deferred tax 34.2 2.6
Foreign tax 28.7 40.6
Foreign deferred tax 4.7 13.0
Income Statement Charge 345.0 378.2

Capital Expenditure
Rm’s Dec 2009 Dec 2008
Land & buildings 5.8 9.9
Leasehold improvements 38.0 39.5
PPE 166.9 195.3
Computers 71.0 70.6
Motor vehicles 12.3 15.9
Sub-total 294.0 331.2
Goodwill & trademarks 0.1 11.0
Total 294.0 342.2

Headline Earnings Reconciliation
Rm Dec 2009 Dec 2008
Attributable earnings 693.7 868.3
Loss on fixed asset disposals 0.9 0.6
Profit on sale of Consumer Book - (7.0)
Tax effects on adjustments (0.3) 0.7
Headline earnings 694.3 862.6

Number of Shares
(000’s)
At June 2009 201 303
Shares issued 67
At December 2009 201 370
Weighted-average for period 200 367
Fully-diluted weighted average 206 545
IAS 33 requires the fully-diluted weighted-average shares calculation to be based on the extent to which the BEE shares are in-the-money. This must take into account the strike price, the associated IFRS 2 charge and average annual share price for the past financial year. This calculation produces the additional 6.2m shares that are now included in the fully-diluted weighted-average number of shares.

Targets
Group Annual ROS > 5.5%
Int-bearing Debt : Equity < 30%
Return on Capital Employed > 45%
Return on Equity > 35%
(ROCE = EBITA / Average capital employed, excluding goodwill and deferred tax assets)
(ROE = Headline Earnings / Average shareholders equity, excluding goodwill and deferred tax assets)
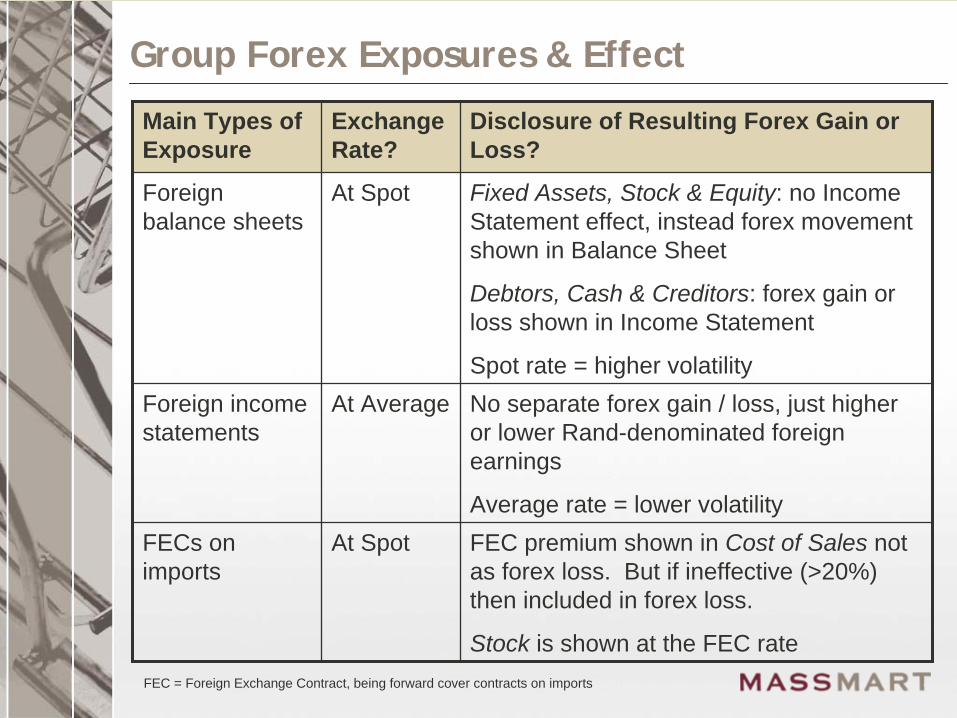
Group Forex Exposures & Effect
Main Types of Exposure
Exchange Rate?
Disclosure of Resulting Forex Gain or Loss?
Foreign balance sheets
At Spot Fixed Assets, Stock & Equity: no Income Statement effect, instead forex movement shown in Balance Sheet
Debtors, Cash & Creditors: forex gain or loss shown in Income Statement
Spot rate = higher volatility Foreign income statements
At Average No separate forex gain / loss, just higher or lower Rand-denominated foreign earnings
Average rate = lower volatility FECs on imports
At Spot FEC premium shown in Cost of Sales not as forex loss. But if ineffective (>20%) then included in forex loss.
Stock is shown at the FEC rateFEC = Foreign Exchange Contract, being forward cover contracts on imports

Dedicated to Value
Dedicated to Shareholder Value
www.massmart.co.za