Massmart Holdings Reviewed Interim Results for the 26 ... · Massmart Holdings Reviewed Interim...
50
Massmart Holdings Reviewed Interim Results for the 26 weeks ended 29 June 2014 PRESENTED IN AUGUST 2014
Transcript of Massmart Holdings Reviewed Interim Results for the 26 ... · Massmart Holdings Reviewed Interim...

Massmart Holdings Reviewed Interim Results for the 26 weeks ended 29 June 2014
PRESENTED IN AUGUST 2014

CEO Review

Performance Overview
The weak South African consumer environment requires us to:
> Focus on bringing value to the customer
> Be innovative
> Aggressively control costs
> Address areas of underperformance
> Not losing sight of the longer-term growth imperative
> Being clear in our strategic intent
We achieved much of this, across most Divisions
Interim Results to June 20143

Divisional Performance

Massdiscounters
Game SA:
> Tough SA consumer environment. Declining SA Durables‘ sales growth
> Total & comparable sales growth low: 5.4% and 0.4% respectively
> Stock clearance impacted margin
Game Africa:
> Strong performance (total sales +20%, own currency +13%)
> 19% sales participation
> Profit growth below sales growth. Expense drag from new stores
DionWired:
> Very good performance (total sales +13%)
> Profit growth exceeded sales growth
Interim Results to June 20145
June2014
Totalgrowth
Comparablegrowth Inflation
Sales R8,226m 8.0% 4.0% 3.1%
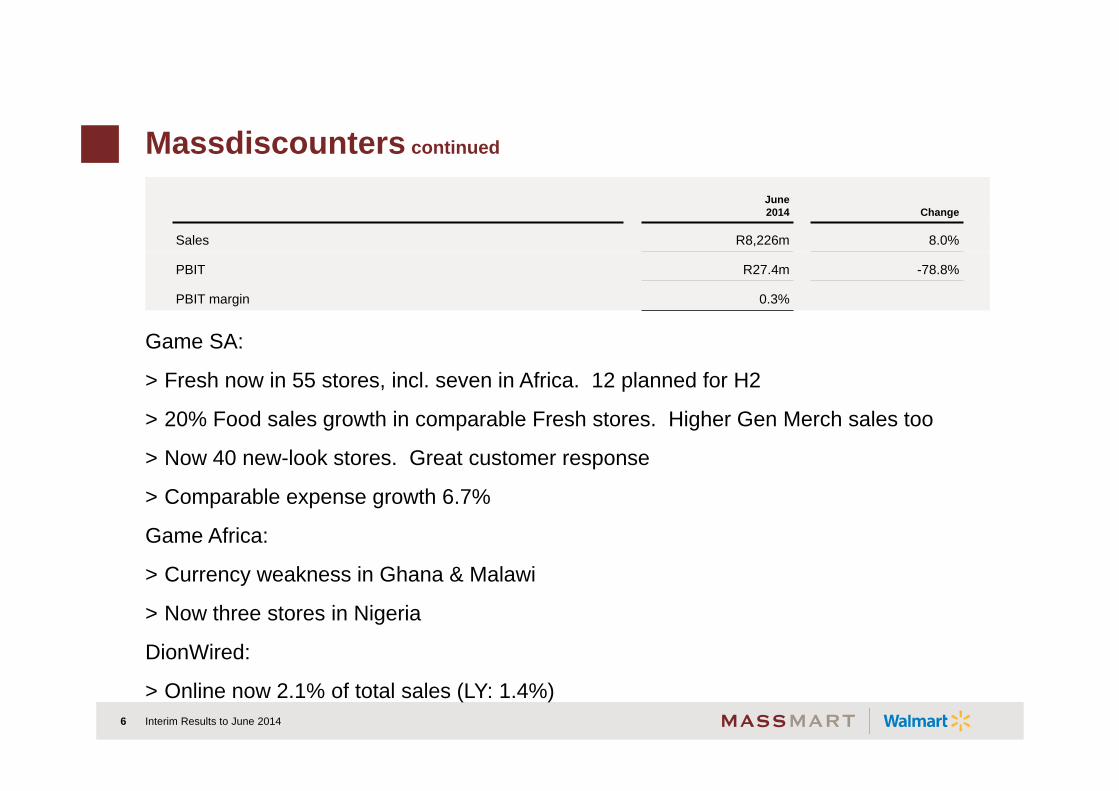
Massdiscounters continued
Game SA:
> Fresh now in 55 stores, incl. seven in Africa. 12 planned for H2
> 20% Food sales growth in comparable Fresh stores. Higher Gen Merch sales too
> Now 40 new-look stores. Great customer response
> Comparable expense growth 6.7%
Game Africa:
> Currency weakness in Ghana & Malawi
> Now three stores in Nigeria
DionWired:
> Online now 2.1% of total sales (LY: 1.4%) Interim Results to June 20146
June2014 Change
Sales R8,226m 8.0%
PBIT R27.4m -78.8%
PBIT margin 0.3%

Game: A Difficult Consumer Environment from 2013
Interim Results to June 20147
Y-on-Y % Q1 ‘13 Q2 ‘13 Q3 ‘13 Q4 ‘13 Q1 ‘14 Q2 ‘14
General Dealers 8.1 6.4 5.4 6.3 7.0 8.2
Food, Beverages & Tobacco 4.8 6.1 6.7 5.4 4.7 8.1
Pharma, Medical & Cosmetics 3.2 4.4 2.9 5.3 6.0 5.0
Textiles, Clothing & Footwear 10.6 10.9 11.1 10.9 13.5 7.5
Furniture, Appliances & Equipment -3.1 -2.0 -4.7 -8.9 0.1 -0.8
Hardware, Paint & Glass 8.6 10.8 10.1 12.9 9.2 7.0
All Other 7.5 10.3 5.2 2.6 3.9 5.5
Total 7.3 7.5 6.3 6.4 7.5 7.0
Source: Econometrix / Stats SA June 2014 National Retail Sales
Retail Sales per Type of Dealer at Current Prices:

Masswarehouse
> Very good trading performance in tough environment. Strong comparable sales growth in all categories
> Accelerating sales in stores opened in 2012-13. Sales growth +19%
> Gaining market share in Liquor wholesale & retail
> The Fruitspot sales up 23%
> General Merchandise launched online March ’14. Good learnings. Liquor next
> First R100 promotion: sales of R200m, saved customers R40m
Interim Results to June 20148
June2014
Totalgrowth
Comparablegrowth Inflation
Sales R9,659m 12.2% 9.4% 5.5%

Masswarehouse continued
> Good profit performance given the environment
> Comparable expense growth 6.8%
> Food Retail / Fresh offering now in 16 stores. Great customer response
> Innovating around Commercial customer
> Profit growth lagged sales growth due to new & relocated stores in 2013
> Electricity consumption growth -2% despite 10% new space
> No new stores in FY14
Interim Results to June 20149
June2014 Change
Sales R9,664m 12.3%
PBIT R406.5m 7.8%
PBIT margin 4.2%

Massbuild
> Great performances in Builders Warehouse & Builders Express: comp sales growth 12% & 18% respectively
> Non-SA stores performing strongly
> Trade Depot struggled following SAP implementation & store closures in Q4 2013
> New format Superstore doing well: satisfactory sales & margin. Testing merchandise categories
> New Builders Warehouse Rivonia store: best DIY store in the world! Innovation!
> RDC opened in Q1 2013 doing well. Costs annualised
> Comparable expense growth 5.4%
Interim Results to June 201410
June2014
Totalgrowth
Comparablegrowth Inflation
Sales R4,848m 14.2% 8.8% 5.3%

Massbuild continued
South Africa:
> Market share & new stores
> Focus on contractor / commercial customers
> Roof Truss plants across SA
Africa:
> Closed Kangela stores & ops
> Builders Warehouse performing well in Botswana (two) and Mozambique (two)
> Matola store opened July 2014. Great trading to date …
Interim Results to June 201411
June2014 Change
Sales R4,848m 14.2%
PBIT R186.2m 16.4%
PBIT margin 3.8%

Masscash
Very tough trading environment: intense competition, struggling lower-income consumers, mining sector unrest & other recent strike action
Wholesale:
> Comparable sales growth 6.7%
> Total sales growth in SA Wholesale 1.4% & Africa 12%
> Non-SA sales 16% participation
> Tobacco category sales down 11% due to illicit cigarettes
> After modest inflation, commodities now in deflation
> Comparable expense growth 6%
Interim Results to June 201412
June2014
Totalgrowth
Comparablegrowth Inflation
Sales R12,927m 8.7% 6.8% 5.0%

Masscash continued
Retail:
> Comparable sales growth 9.6%
> Gaining market share
> Strong customer price-perception
> Closed three stores. Two great openings in H1
> Rhino integration underway
> 14 new stores in 2015
Interim Results to June 201413
June2014 Change
Sales R12,927m 8.7%
PBIT R109.8m 48.4%
PBIT margin 0.8%

Financial Performance
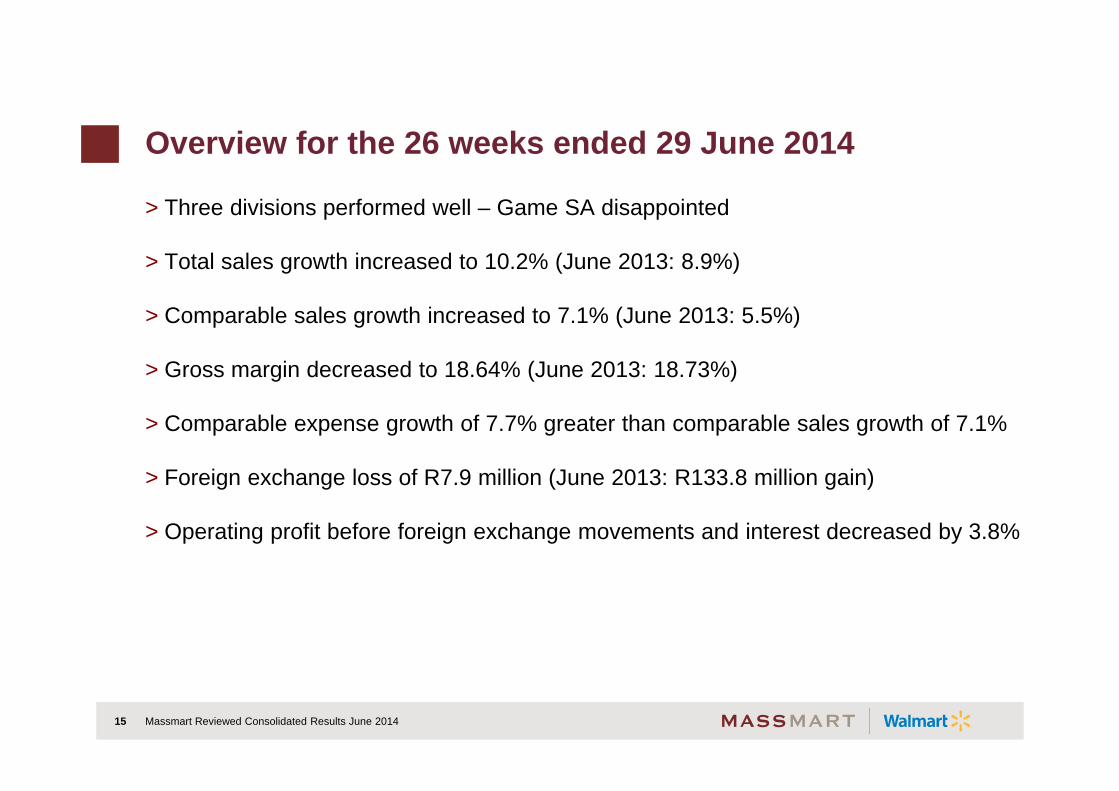
Overview for the 26 weeks ended 29 June 2014
> Three divisions performed well – Game SA disappointed
> Total sales growth increased to 10.2% (June 2013: 8.9%)
> Comparable sales growth increased to 7.1% (June 2013: 5.5%)
> Gross margin decreased to 18.64% (June 2013: 18.73%)
> Comparable expense growth of 7.7% greater than comparable sales growth of 7.1%
> Foreign exchange loss of R7.9 million (June 2013: R133.8 million gain)
> Operating profit before foreign exchange movements and interest decreased by 3.8%
Massmart Reviewed Consolidated Results June 201415

Sales
> Real comparable volume growth
> Rest of Africa businesses’ sales growth:– Sales in ZAR grew by 16.7%
Massmart Reviewed Consolidated Results June 201416
June2014
Rm
June2013
Rm
TotalGrowth
%
ComparableGrowth
%Inflation
%
Massdiscounters 8,225.8 7,618.1 8.0 4.0 3.1
Masswarehouse 9,659.4 8,608.9 12.2 9.4 5.5
Massbuild 4,847.9 4,246.9 14.2 8.8 5.3
Masscash 12,926.7 11,895.5 8.7 6.8 5.0
Total 35,659.8 32,369.4 10.2 7.1 4.8
92%
8%
S.A. Sales
Rest of AfricaSales

Sales Inflation
> Higher inflation in General Merchandise and Home Improvement
> Indicators of food deflation, specifically food commodities
Massmart Reviewed Consolidated Results June 201417
YTD Sales Inflation to June 2014June 2014
%June 2013
%General Merchandise 4.7 0.2
Home Improvement 5.3 3.1
Food and Liquor 4.5 4.4
Total 4.8 2.9

Massmart Reviewed Consolidated Results June 201418
Gross Profit
> Gross Profit performance is a combination of:– Increased margins in Massbuild and Cambridge due to better trading;
Offset by– Food margins under pressure;– Greater Food contribution across the Group at a lower gross margin; and– A poor margin performance in Massdiscounters despite the increased Africa
contribution
June2014
June2013
Gross Profit (Rm) 6,649.6 6,063.0Gross Profit as a % of sales 18.64 18.73

Operating Costs (excluding forex)
> Operating Costs (excl. forex) increased by 11.3%:– Employment Costs increased by 12.9%; and– Depreciation and Occupancy Costs increased by 14.5% and 7.9%, respectively
> Comparable expenses increased by 7.7%
Massmart Reviewed Consolidated Results June 201419
June2014
June2013
Operating Costs (Rm) 6,043.4 5,429.3Operating Costs as a % of sales 16.9 16.8
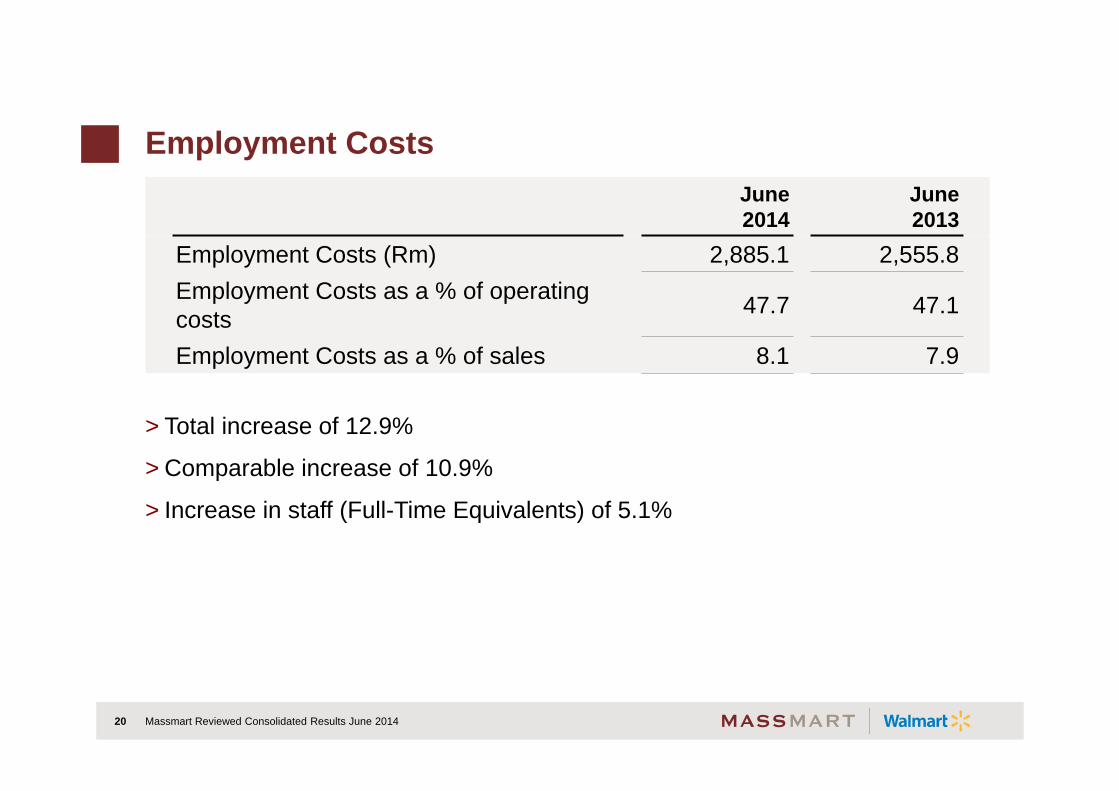
Employment Costs
> Total increase of 12.9%
> Comparable increase of 10.9%
> Increase in staff (Full-Time Equivalents) of 5.1%
Massmart Reviewed Consolidated Results June 201420
June2014
June2013
Employment Costs (Rm) 2,885.1 2,555.8Employment Costs as a % of operating costs 47.7 47.1
Employment Costs as a % of sales 8.1 7.9

Occupancy Costs
> Total increase of 7.9%
> Comparable increase of 8.3%
> 1.3% net new trading space to a total of 1,499,928m²
> High inflation - rates, services and electricity
> Good performance – costs reducing as a % of sales
Massmart Reviewed Consolidated Results June 201421
June2014
June2013
Occupancy Costs (Rm) 1,311.0 1,215.2Occupancy Costs as a % of operating costs 21.7 22.4
Occupancy Costs as a % of sales 3.7 3.8

Depreciation and Amortisation
> Depreciation growth of 14.5% greater than sales growth of 10.2%
> Opening of new stores, DC’s and the acquisition of key properties - increased depreciation charge
Massmart Reviewed Consolidated Results June 201422
June2014
June2013
Depreciation and amortisation (Rm) 409.2 357.4Depreciation and amortisation as a % of operating costs 6.8 6.6
Depreciation and amortisation as a % of sales 1.15 1.10
-
1 000
2 000
3 000
4 000
5 000
6 000
7 000
0.20%
0.40%
0.60%
0.80%
1.00%
1.20%
June 2010 June 2011 June 2012 June 2013 June 2014
Rm
Property, Plant and Equipment (Rm)
Depreciation and amortisation as a %of sales

Foreign Exchange Gains and Losses
> The Rand remained stable during the current period
> Ghanaian New Cedi and Malawian Kwacha weakened by 34.0% and 12.8% to the Rand respectively, in the current period
> In the prior period the Rand depreciated by more than 20% against the average African basket
Massmart Reviewed Consolidated Results June 201423
RmJune2014
June2013
Massdiscounters (2.9) 133.5
Other (5.0) 0.3
Total (loss) / profit (7.9) 133.8

EBITDA
Massmart Reviewed Consolidated Results June 201424
June2014
Rm
June2013
RmChange
%Operating profit before foreign exchange movements and interest 702.9 730.3 (3.8)
Depreciation and amortisation 409.2 357.4 14.5Impairment of assets 14.9 -EBITDA before forex 1,127.0 1,087.7 3.6

Tax Charge
> Lower effective tax rate
> Annual effective tax rate expected to normalise just below 30%
Massmart Reviewed Consolidated Results June 201425
June2014
June2013
Total tax (Rm) 164.1 230.2Effective tax rate % 30.4 31.1

Inventories and Creditors
> Inventories increased by 8.7% and Inventory Days marginally improved:– Massdiscounters remains overstocked; and– Masscash improved stock position
> Trade Creditors increased by 12.5% and Creditors’ Days marginally better
> Other than Massdiscounters, net working capital across the Group improved
Massmart Reviewed Consolidated Results June 201426
June2014
June2013
Inventories (Rm) 9,775 8,991Inventory Days 61 62Trade Creditors (Rm) 10,849 9,645Creditors’ Days 60 58

Debtors
> Trade Debtors increased by 12.2%
> Trade Debtors are well controlled throughout the Group
> No significant concentration of debtors
Massmart Reviewed Consolidated Results June 201427
June2014
June2013
Gross Trade Debtors (Rm) 1,929.7 1,720.0Bad Debts as a % of sales 0.04 0.05Debtors’ Days 8.6 8.5

Owned stores sales = 26.7% at June 2014 (June 2013: 19.8%).
June 2014
Owned
Capital Expansion
Massmart Reviewed Consolidated Results June 201428
Sales split between owned and leased Assets
26.7%
June 2013
19.8%

Cash Flow Statement
Massmart Reviewed Consolidated Results June 201429
RmJune2014
June2013
Operating cash before working capital movements 1,137.5 1,266.6
Working capital movements (2,519.3) (1,901.8)
Cash utilised by operations (1,381.8) (635.2)
Net interest and tax paid (616.0) (488.6)
Net investment to maintain operations (312.5) (257.7)
Free cash flow (2,310.3) (1,381.5)
Dividends paid (597.0) (595.9)Investment to expand operations and other net investing activities (269.7) (941.3)
Cash outflow before financing activities (3,177.0) (2,918.7)
Working capital impact of ± R700 million due to the calendar close being one week later

Store Portfolio
> Massdiscounters:– Opened six Game stores (one in Nigeria) and one DionWired store– Closed one Game store and one DionWired store
> Massbuild:– Opened one Builders Warehouse store, two Builders Express stores and one Builders Superstore– Closed one Builders Warehouse store and two Builders Express stores
> Masscash:– Opened two and closed three Retail stores
> Forecast for the remainder of the year:– 13 new stores resulting in an additional 2.5% net new trading space
Massmart Reviewed Consolidated Results June 201430
Massdiscounters Masswarehouse Massbuild Masscash Total
December 2013 143 19 92 122 376
Opened 7 - 4 2 13
Closed -2 - -3 -3 -8
June 2014 148 19 93 121 381

Forecast stores: June 2014 – June 2016
Massmart Reviewed Consolidated Results June 201431
Massdiscounters Masswarehouse Massbuild Masscash Total
June 2014 (no of stores) 148 19 93 121 381
June 2014 trading space (m2) 491,767 195,794 413,905 398,462 1,499,928
July 2014 – Jun 2016
No of stores* 20 1 31 19 71
Trading space (m2) 73,750 12,000 116,000 44,750 246,500
% increase (m2) 15.0% 6.1% 28.0% 11.2% 16.4%
June 2016 (no of stores) 168 20 124 140 452
June 2016 trading space(m2) 565,517 207,794 529,905 443,212 1,746,428
> Game SA: 10, DionWired: 5, Game Africa: 5 (Ghana 1, Mozambique 1, Namibia 1, Nigeria 1 and Zambia 1)> Makro: 1> BW SA: 5, BEX: 5, BTD: 2, BSS: 13, BW Africa: 6 (Botswana 1, Mozambique 2, Namibia 1 and Zambia 2)> Retail: 16, Wholesale SA: 1, Wholesale Africa: 2 (Mozambique 2)
*

Environment

Environment
Economic:
> The five-month mining unrest affected our stores in those areas, and in areas with remittances
> Mid-month trading soft: smaller pack-sizes, private brands
> The “new normal”: soft volume growth, steady product inflation, likely higher expense inflation
> Unsecured-lending: probably affected general consumer confidence & spending. Game most impacted of our formats?
Competitive:
> Food Retail very competitive
> Wholesale / C&C turbulent. Independents reducing store footprints
> Turmoil in Credit Furniture sector likely positive for Game & Makro
Interim Results to June 201433

Legal & Risk
Lease Exclusivities:
> Multiple actual or threatened legal actions
> By three major South African food retailers
> Against Game. One against Game / Cambridge
> These actions are intuitively anti-competitive: restrict competition and limit choice & benefit for customers
> Will be lodging formal complaint with Competition Commission
Reinstatement of 503 Game employees:
> Recently made great progress and now almost 90% will have been reinstated
> Acknowledge role of Competition Commission, SACCAWU, and staff in bringing this to resolution
Interim Results to June 201434

StrategicPriorities

Massdiscounters Strategic PlansGame SA:
> Great retail footprint. Significant market shares. 4m customers monthly
> Food / Fresh rollout. Rebalance merchandise offering. Focus on core customer
> SAP implementation in 2015/16
Game Africa:
> More stores. More Food
> Valumart trial
DionWired:
> Online
> Manage store size and portfolio
Interim Results to June 201436

Masswarehouse Strategic Plans
> Drive performance of existing & new stores
> Enhance Food Retail offering
> Commercial customers
> Online
> One new store 2015-2016
Interim Results to June 201437

Massbuild Strategic Plans
> Retail innovation. Private label
> New stores in SA & Southern Africa
> Trade Depot: inventory range, SAP value extraction, contractors
> Focus on Trade Customers
Interim Results to June 201438
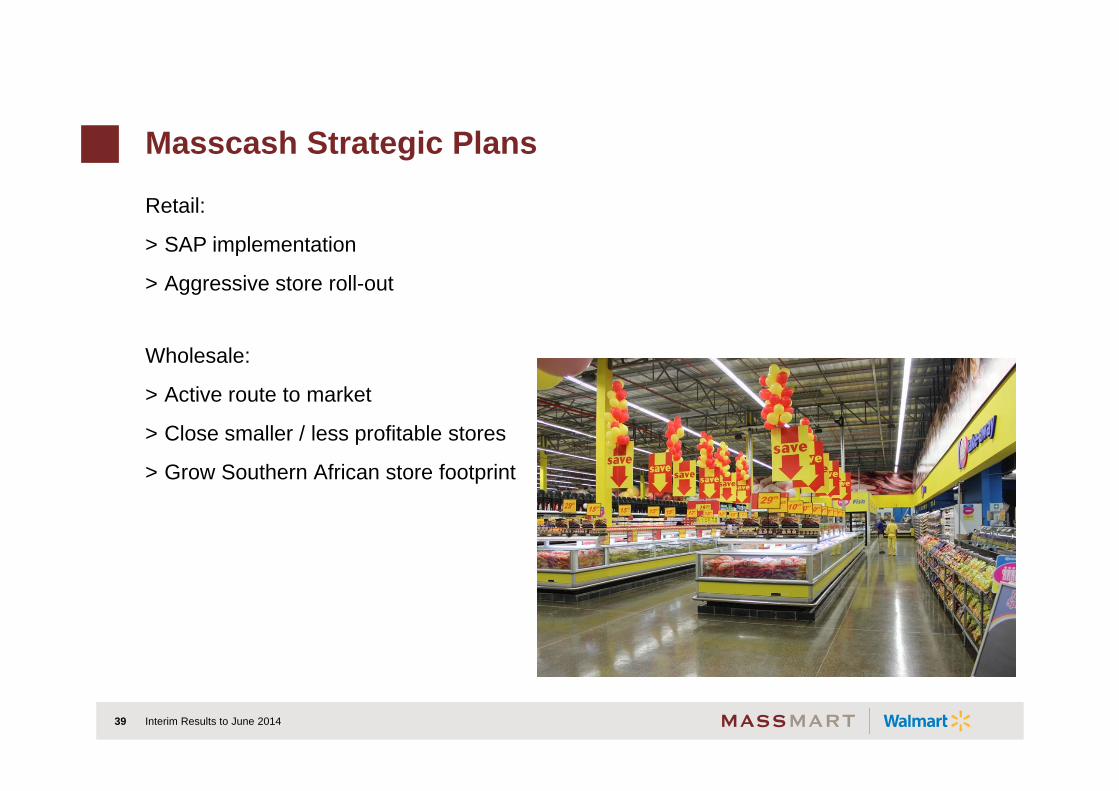
Masscash Strategic Plans
Retail:
> SAP implementation
> Aggressive store roll-out
Wholesale:
> Active route to market
> Close smaller / less profitable stores
> Grow Southern African store footprint
Interim Results to June 201439

Conclusion

Sales Update & Prospects
Looking ahead, we remain focused on:
> Bringing value to customers
> Innovation
> Cost-management
> Addressing underperformance
> Longer-term growth
> Strategic clarity & intent
For 34 weeks to 24 August 2014, the Group’s total sales grew by 10.0% and comparable sales by 7.1%
Likely that these sales trends will continue for the remainder of 2014 as we expect continuation of weak SA consumer environment
Interim Results to June 201441

Thank You

Additional FinancialData

Reviewed Results for the 26 Weeks Ended 29 June 2014
Massmart Reviewed Consolidated Results June 201444
RmJune2014
June2013 %
Revenue 35,756.5 32,466.0 10.1
Sales 35,659.8 32,369.4 10.2
Cost of sales (29,010.2) (26,306.4) (10.3)
Gross Profit 6,649.6 6,063.0 9.7
Other income 96.7 96.6 0.1
Depreciation and amortisation (409.2) (357.4) (14.5)
Impairment of assets (14.9) -
Employment costs (2,885.1) (2,555.8) (12.9)
Occupancy costs (1,311.0) (1,215.2) (7.9)
Other operating costs (1,423.2) (1,300.9) (9.4)
Operating profit before foreign exchange movements and interest 702.9 730.3 (3.8)
Foreign exchange (loss) / profit (7.9) 133.8
Operating profit before interest 695.0 864.1 (19.6)
Net finance costs (154.9) (124.3) (24.6)
Profit before taxation 540.1 739.8 (27.0)
Taxation (164.1) (230.2) 28.7
Profit for the period 376.0 509.6 (26.2)

Tax Rate Reconciliation
Massmart Reviewed Consolidated Results June 201445
%June2014
June2013
Standard tax rate 28.0 28.0
Disallowed expenses 4.8 4.2
Assessed loss not utilised 3.1 2.2
Non taxable income (1.5) (1.9)
Other – including foreign tax adjustments (4.0) (1.4)
Group tax rate 30.4 31.1

Headline Earnings Reconciliation
Massmart Reviewed Consolidated Results June 201446
RmJune2014
June2013 %
Attributable earnings 350.0 481.5
Impairment of assets 14.9 -
(Profit) / loss on disposal of fixed assets (1.3) 7.9
Loss on disposal of business - 1.8
Tax effects on adjustments 0.5 (2.7)
Headline earnings 364.1 488.5 (25.5)
Foreign exchange loss/(profit ) (taxed) 5.7 (96.3)
Headline earnings before foreign exchange (taxed) 369.8 392.2 (5.7)

Store Portfolio Including Location of Stores
Massmart Reviewed Consolidated Results June 201447
Massdiscounters Masswarehouse Massbuild Masscash Total
December 2013 143 19 92 122 376
Opened:7 - 4 2 13
Game: 1 Africa storeGame: 5 SA storesDionWired: 1 SA store
BWH: 1 SA storeBEX: 2 SA storesBSS: 1 SA store
Retail: 2 SA stores
Closed-2 - -3 -3 -8
Game: 1 SA storeDionWired; 1 SA store
BWH: 1 SA storeBEX; 2 SA stores Retail: 3 SA stores
June 2014 148 19 93 121 381

Forecast stores: June 2014 – June 2016
Massmart Reviewed Consolidated Results June 201448
No of stores Massdiscounters Masswarehouse Massbuild Masscash Total
June 2014 148 19 93 121 381
Forecast SA openings 2014 –2015*
8 - 11 8 27Game: 5
DionWired: 3BW: 2 BEX: 2
BTD: 2 BSS: 5Retail: 8
Wholesale: 0
Forecast “Rest-of-Africa” openings 2014-2015*
2 - 3 - 5Game: Namibia1
Zambia 1BW: Mozambique 2
Botswana 1
June 2015 158 19 107 129 413
Forecast SA openings 2015-2016*
7 1 14 9 31Game: 5
DionWired: 2BW: 3 BEX: 3
BTD: 0 BSS: 8Retail: 8
Wholesale: 1
Forecast “Rest-of-Africa” openings 2015-2016*
3 - 3 2 8Game: Ghana 1 Mozambique 1
Nigeria 1
BW: Namibia 1 Zambia 2
Wholesale: Mozambique: 2
June 2016 168 20 124 140 452
* July - June

Capex per category
Massmart Reviewed Consolidated Results June 201449
RmJune2014
June2013
Investment to expand operations 263.0 971.5
Land and buildings/leasehold improvements 85.6 660.4
Vehicles 7.5 21.2
Fixtures, fittings, plant and equipment 147.7 241.2
Computer hardware 6.0 14.0
Computer software 9.4 32.1
Other 6.8 2.6
Investment to maintain operations 332.2 265.0
Land and buildings/leasehold improvements 31.3 14.4
Vehicles 40.1 24.7
Fixtures, fittings, plant and equipment 196.7 159.0
Computer hardware 47.8 31.0
Computer software 16.3 35.9

Number of Shares
Massmart Reviewed Consolidated Results June 201450
‘000
At June 2013 217,039
Shares issued 78
At June 2014 217,117
Weighted-average at June 2014 216,951
Diluted weighted-average at June 2014 218,824