dedicated to being world class -...
35
BMO Nesbitt Burns Conference March 3, 2005 Saddlebrook Resort, Florida dedicated to being world class Kinross Gold Corporation Corporate Presentation
Transcript of dedicated to being world class -...

BMO Nesbitt Burns ConferenceMarch 3, 2005
Saddlebrook Resort, Florida
dedicated to beingworld class
Kinross Gold CorporationCorporate Presentation
Certain statements set forth in this presentation constitute"forward looking statements" within the meaning of the
United States Private Securities Litigation Reform Act of 1995. Such statements involve risks, uncertainties and
other factors that may cause the actual results, performance or achievements to differ from those expressed or implied by such forward looking statements. Such risks and uncertainties are
described in periodic filings made by Kinross Gold Corporation with the U.S. Securities and Exchange Commission and Canadian provincial
securities regulatory authorities.
All dollar amounts used throughout this presentation are expressed in US dollars, unless otherwise noted.
Forward Looking StatementForward Looking Statement
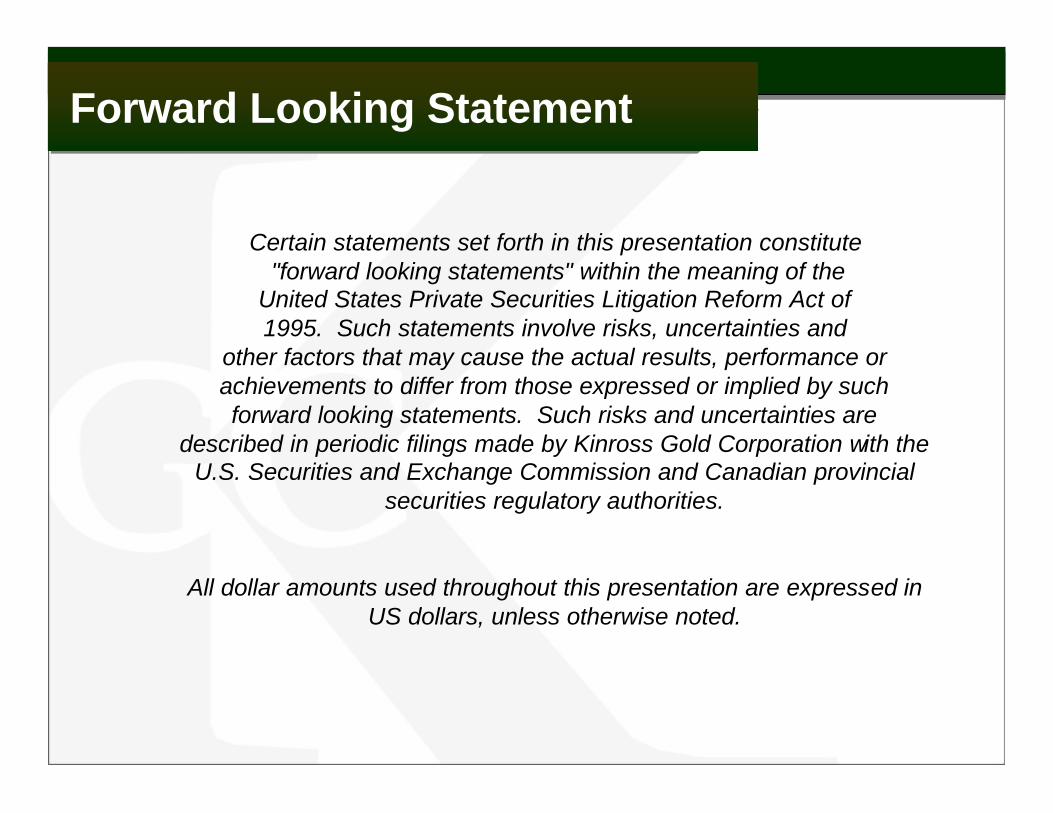
Key Facts
• Senior gold producer, 2005 estimated gold equivalent production of approx. 1.6 million ozs@ $250 to $255 per oz. total cash cost
• ~3,400 employees in 6 countries
• Straight forward balance sheet
Key Attributes
• Excellent spread of geopolitical risk
• Modern, low cost asset base
• Exciting pipeline of development projects and exploration targets
• Experienced management team
Kinross at a GlanceKinross at a Glance
challenging opportunities require innovative strategies
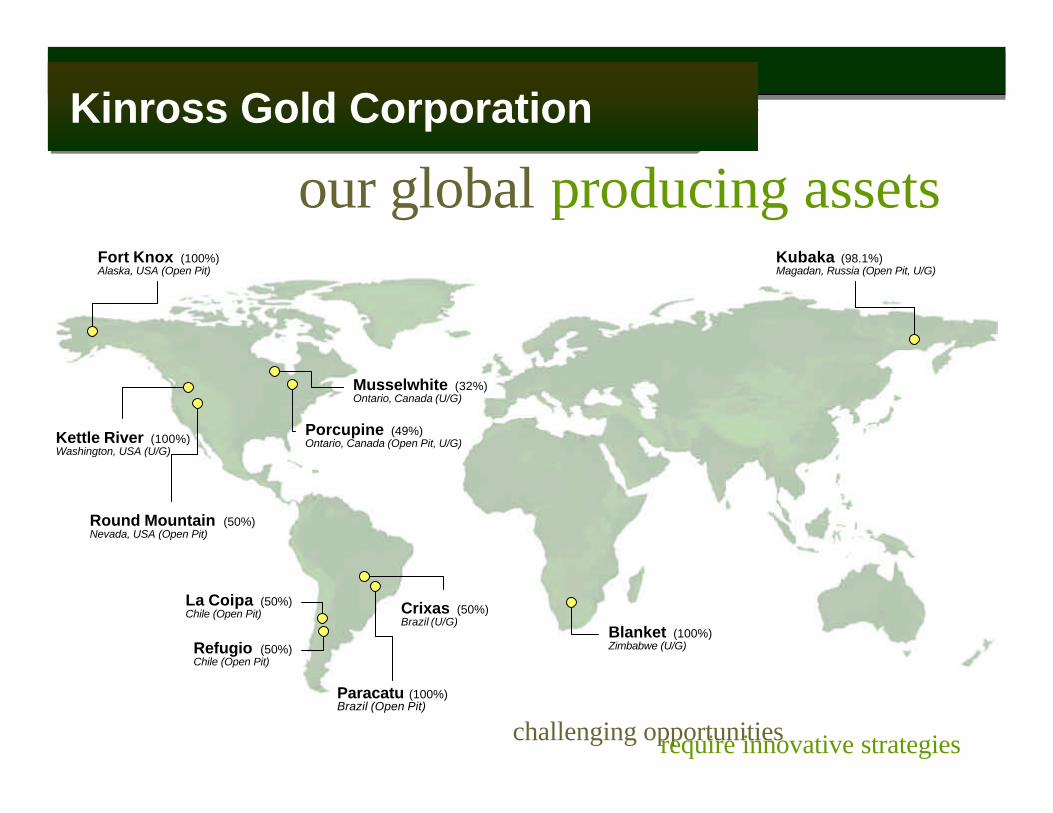
our global producing assetsKinross Gold CorporationKinross Gold Corporation
challenging opportunities require innovative strategies
Fort Knox (100%)Alaska, USA (Open Pit)
Musselwhite (32%)Ontario, Canada (U/G)
Porcupine (49%)Ontario, Canada (Open Pit, U/G)Kettle River (100%)
Washington, USA (U/G)
Round Mountain (50%)Nevada, USA (Open Pit)
La Coipa (50%)Chile (Open Pit)
Refugio (50%)Chile (Open Pit)
Paracatu (100%)Brazil (Open Pit)
Crixas (50%)Brazil (U/G)
Blanket (100%)Zimbabwe (U/G)
Kubaka (98.1%)Magadan, Russia (Open Pit, U/G)
Ø Be a Good Operator
Ø Sustainable Growth and Development
Ø Simplify the Company
Kinross GoalsKinross Goals
Ø Extend Mine Life
0
4
8
12
16
31-Dec-03($325)
Depletion Technical Additions
Acquisitions 31-Dec-04E($350)
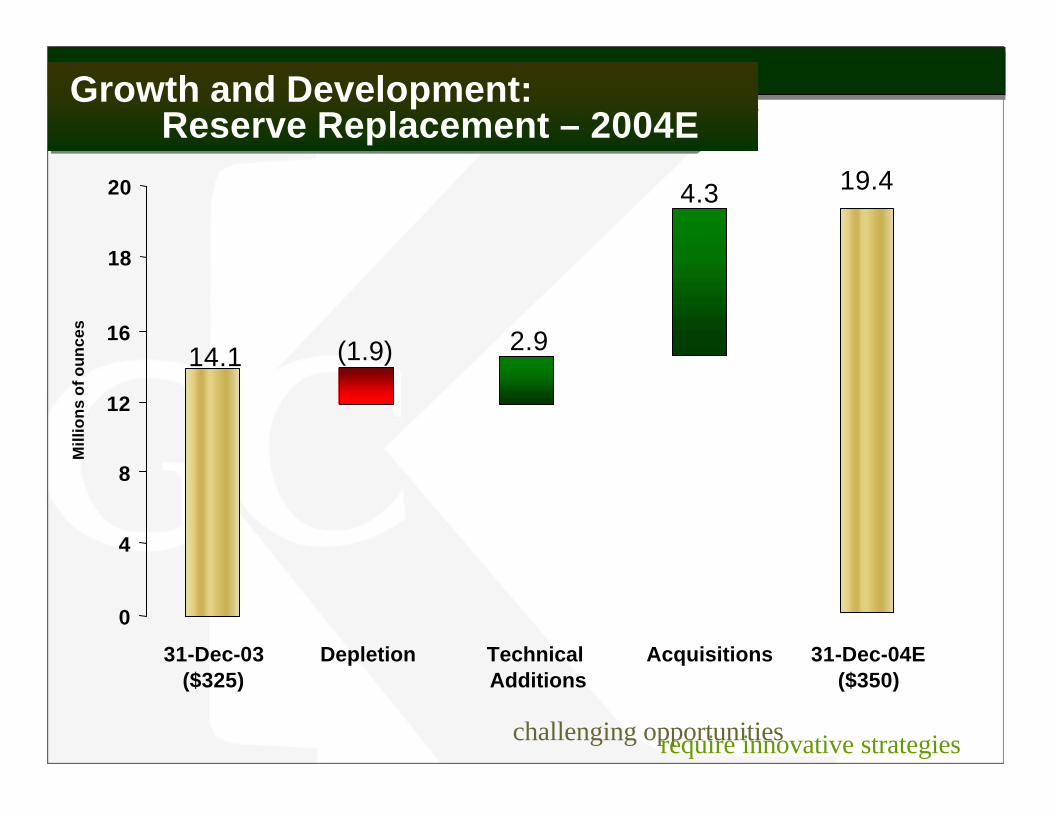
Growth and Development:Reserve Replacement – 2004E
Growth and Development:Reserve Replacement – 2004E
challenging opportunities require innovative strategies
14.1
19.4
(1.9) 2.9
4.3
Mill
ion
s o
f ou
nce
s
18
20
0 1000 2000 3000 4000 5000 6000 7000
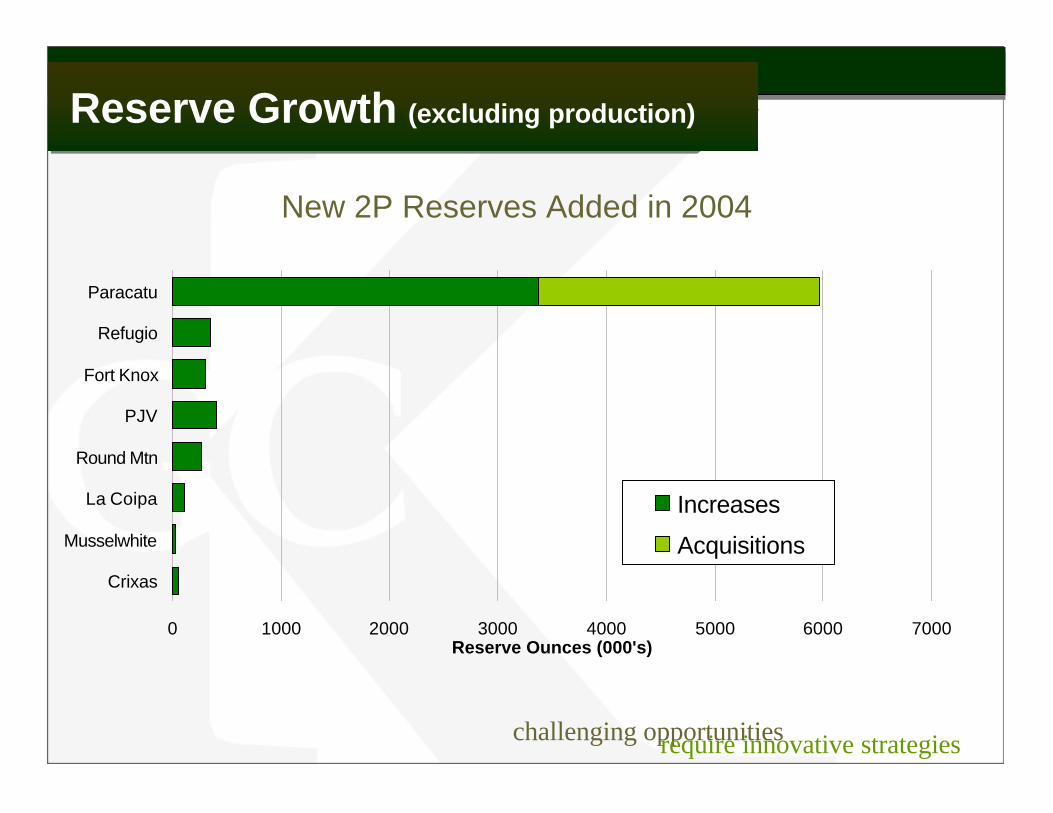
Crixas
Musselwhite
La Coipa
Round Mtn
PJV
Fort Knox
Refugio
Paracatu
Reserve Ounces (000's)
Increases
Acquisitions
New 2P Reserves Added in 2004
Reserve Growth (excluding production)Reserve Growth (excluding production)
challenging opportunities require innovative strategies

0
5
10
15
20
25
30
35
2000 2001 2002 2003 2004 2005e
Ou
nce
s (m
illio
ns)
Proven and Probable Measured and Indicated
Reserve and Resource HistoryReserve and Resource History
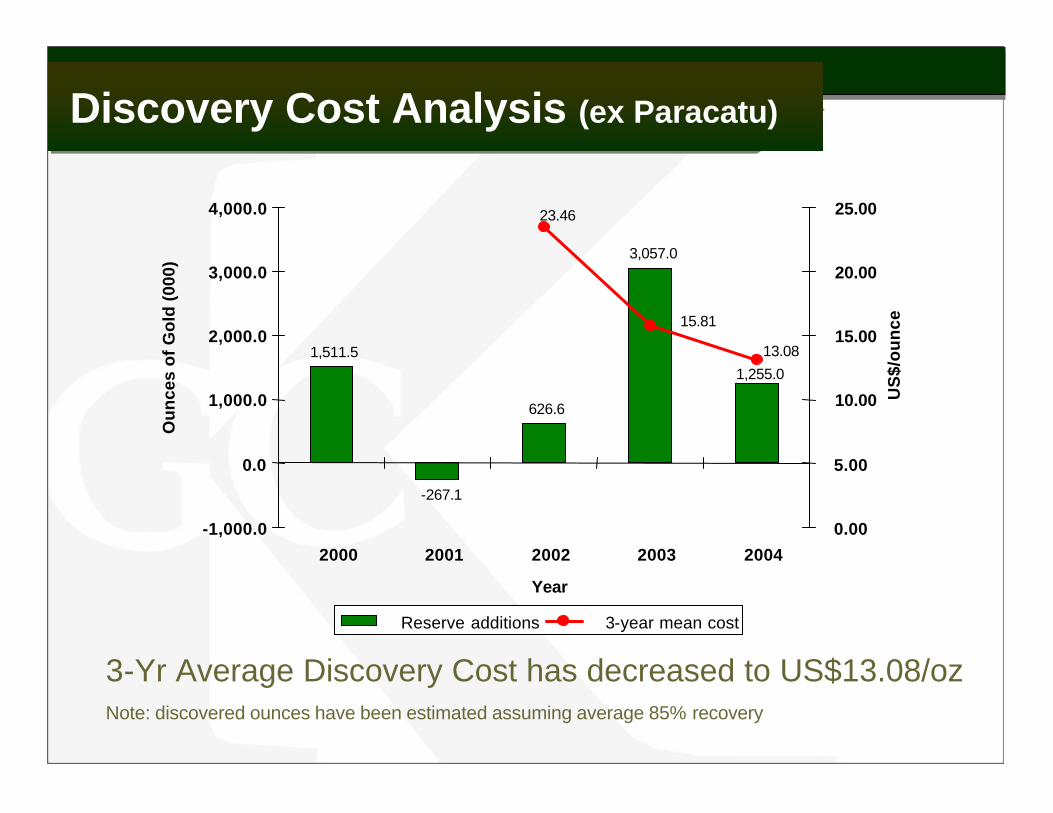
Discovery Cost Analysis (ex Paracatu)Discovery Cost Analysis (ex Paracatu)
3-Yr Average Discovery Cost has decreased to US$13.08/ozNote: discovered ounces have been estimated assuming average 85% recovery
1,511.5
-267.1
626.6
3,057.0
1,255.0
23.46
15.81
13.08
-1,000.0
0.0
1,000.0
2,000.0
3,000.0
4,000.0
2000 2001 2002 2003 2004
Year
Ou
nce
s o
f G
old
(00
0)
0.00
5.00
10.00
15.00
20.00
25.00
US
$/o
un
ce
Reserve additions 3-year mean cost
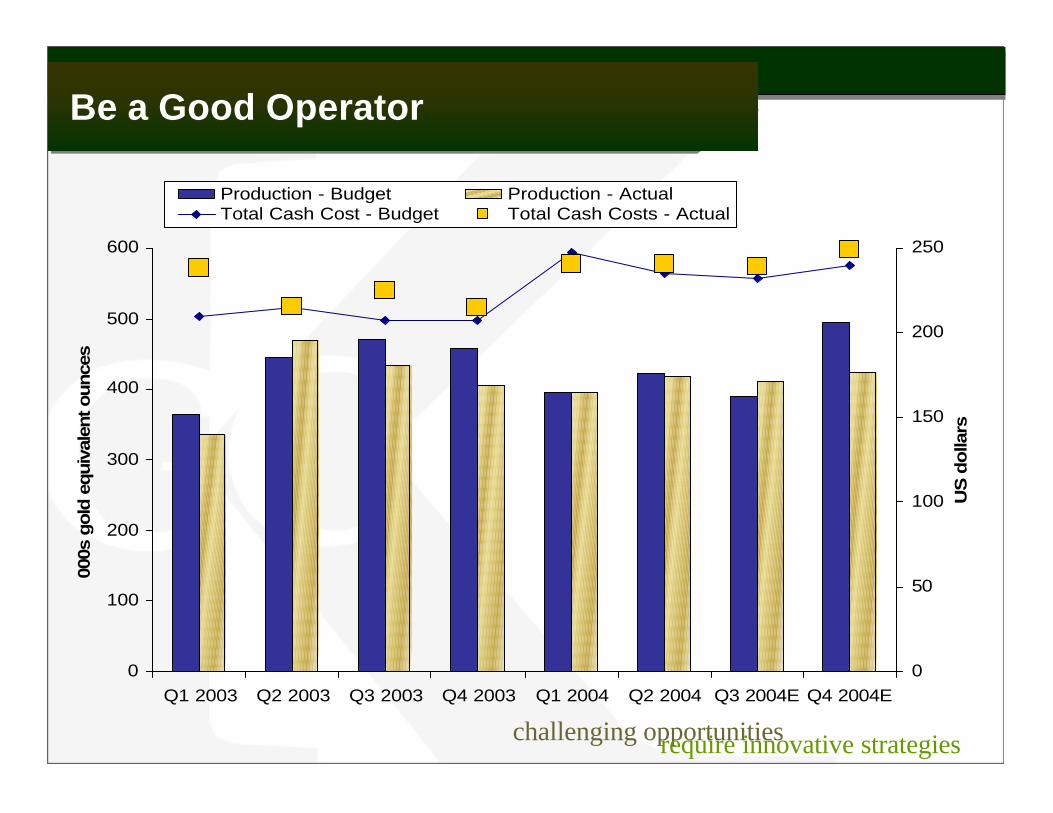
0
100
200
300
400
500
600
Q1 2003 Q2 2003 Q3 2003 Q4 2003 Q1 2004 Q2 2004 Q3 2004E Q4 2004E
000s
gold
equiv
alen
t ounce
s
0
50
100
150
200
250
US
do
llars
Production - Budget Production - ActualTotal Cash Cost - Budget Total Cash Costs - Actual
Be a Good OperatorBe a Good Operator
challenging opportunities require innovative strategies

2004 Budget2004 Actual2005 Estimate
2004 – 2005 Production2004 – 2005 Production
0
100
200
300
400
Fo
rt K
no
x
Ro
un
dM
ou
nta
in
Po
rcu
pin
e
Ku
bak
a
Par
acat
u
La
Co
ipa
Cri
xas
Mu
ssel
wh
ite
New
Bri
tan
nia
Ket
tle
Riv
er
Lupi
n
Ref
ugio
000s
oun
ces
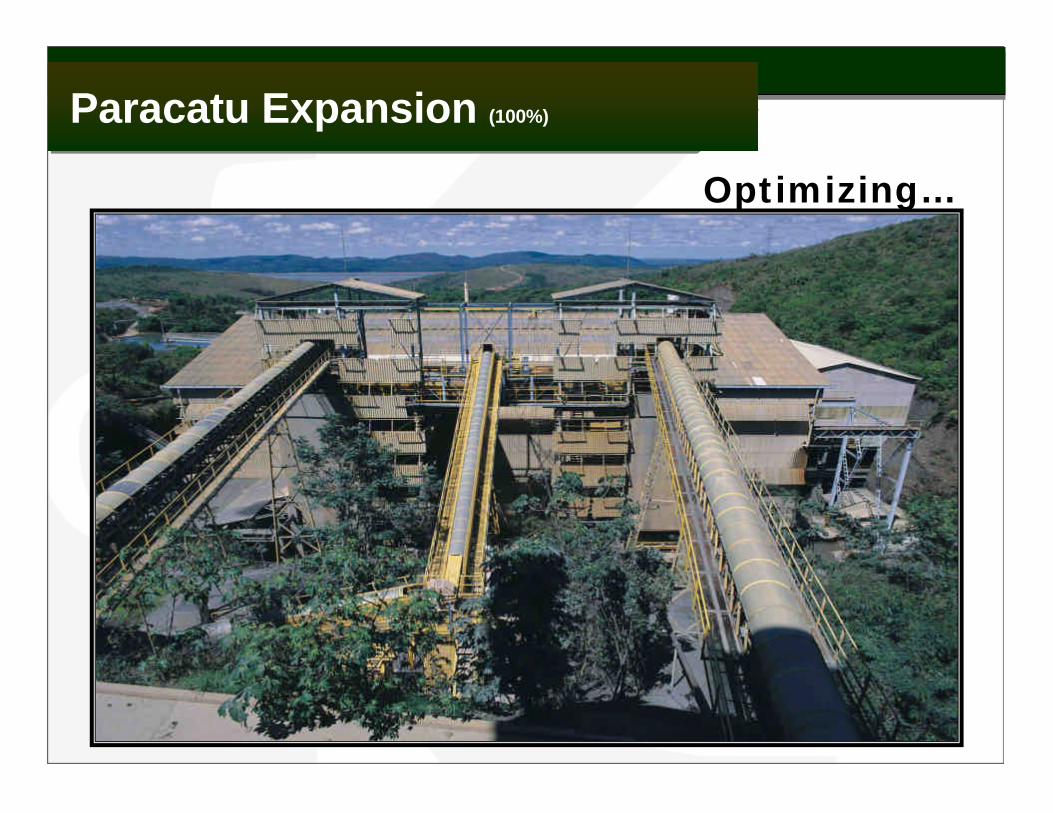
Paracatu Expansion (100%)Paracatu Expansion (100%)
Optimizing…
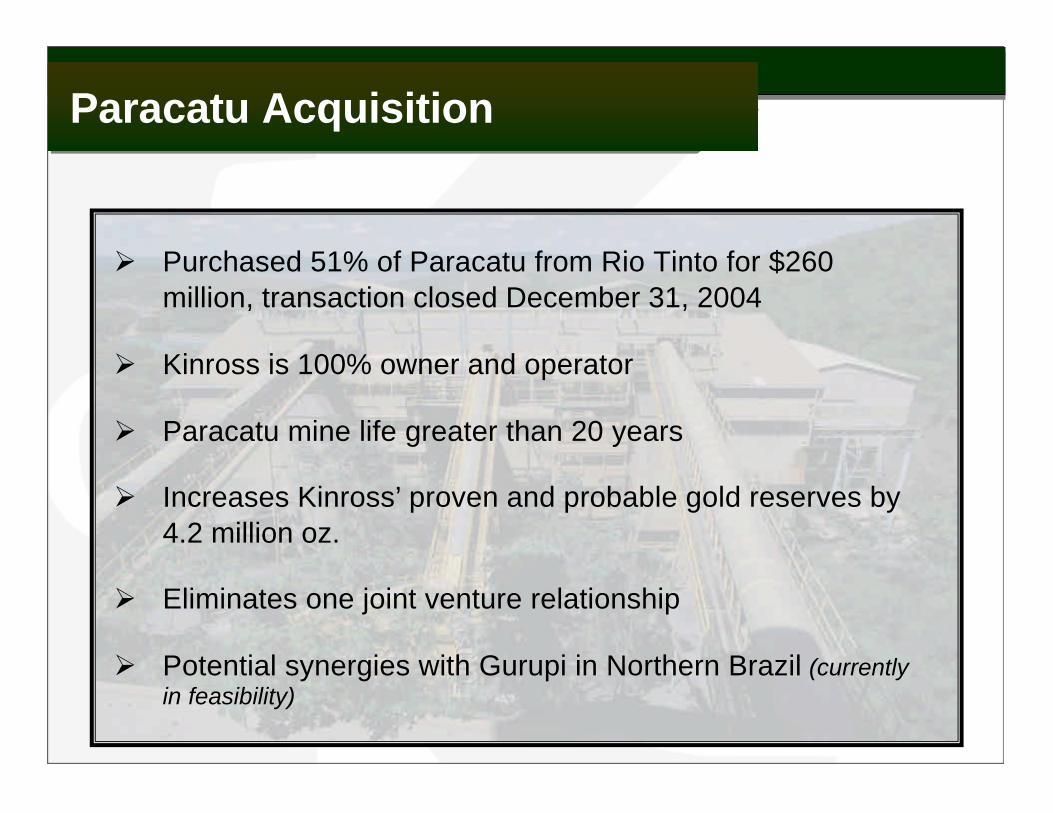
Ø Purchased 51% of Paracatu from Rio Tinto for $260 million, transaction closed December 31, 2004
Ø Kinross is 100% owner and operator
Ø Paracatu mine life greater than 20 years
Ø Increases Kinross’ proven and probable gold reserves by 4.2 million oz.
Ø Eliminates one joint venture relationship
Ø Potential synergies with Gurupi in Northern Brazil (currently in feasibility)
Paracatu AcquisitionParacatu Acquisition
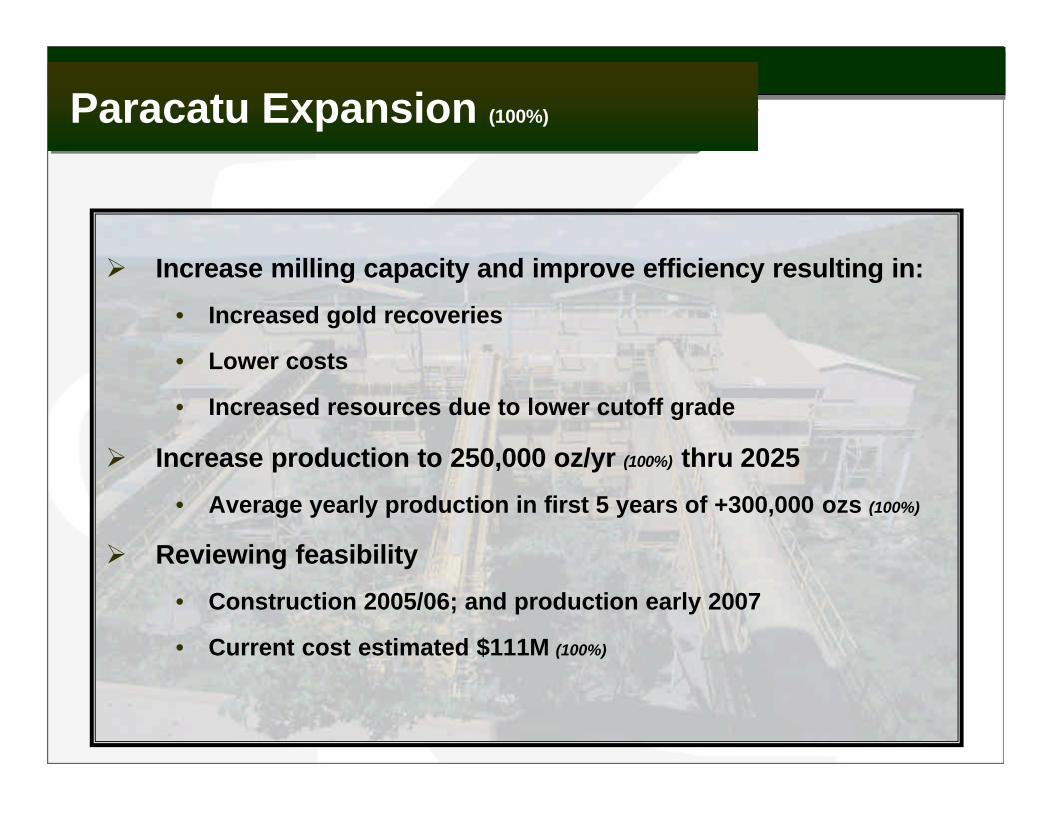
Paracatu Expansion (100%)Paracatu Expansion (100%)
Ø Increase milling capacity and improve efficiency resulting in:
• Increased gold recoveries
• Lower costs
• Increased resources due to lower cutoff grade
Ø Increase production to 250,000 oz/yr (100%) thru 2025
• Average yearly production in first 5 years of +300,000 ozs (100%)
Ø Reviewing feasibility
• Construction 2005/06; and production early 2007
• Current cost estimated $111M (100%)
18 Mtpa
Existing Ball Mills
To Flotation and Cyanidation
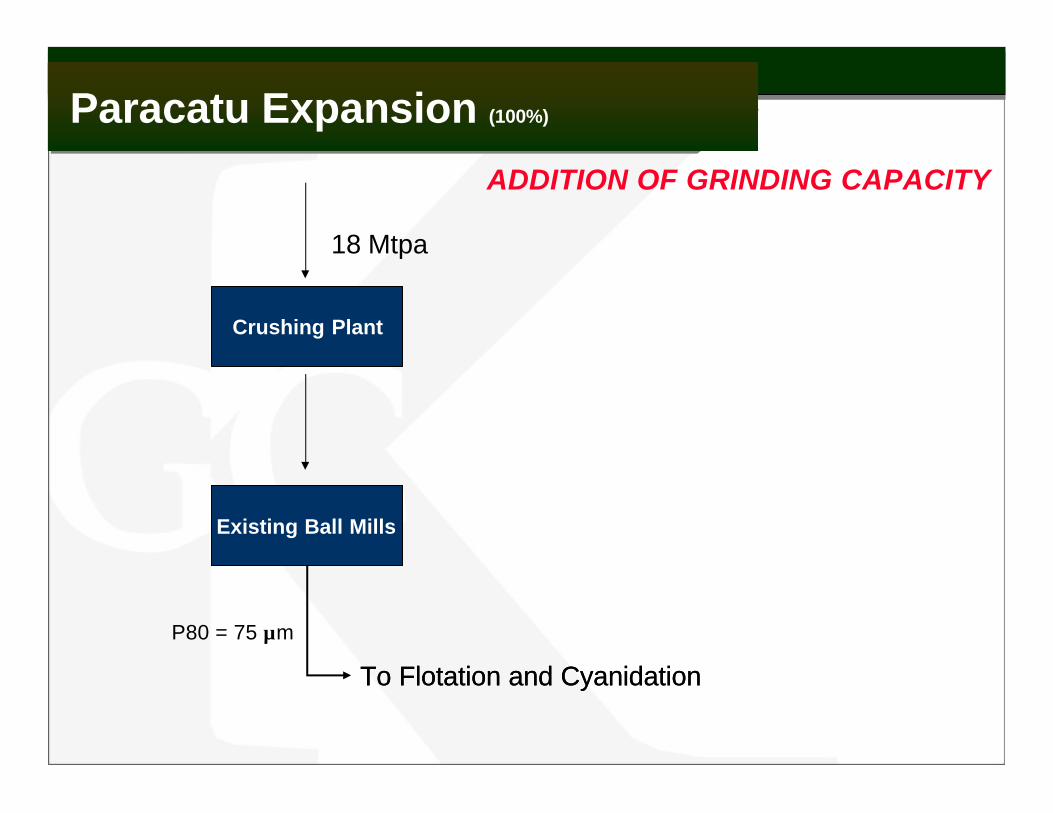
Paracatu Expansion (100%)Paracatu Expansion (100%)
Crushing Plant
Existing Ball Mills
To Flotation and Cyanidation
P80 = 75 µm
ADDITION OF GRINDING CAPACITY

Paracatu Expansion (100%)Paracatu Expansion (100%)
Existing Ball Mills
To Flotation and Cyanidation
Existing Ball Mills
To Flotation and Cyanidation
30 Mtpa
P80 = 75 µm
ADDITION OF GRINDING CAPACITY
Crushing Plant38 ft SAG
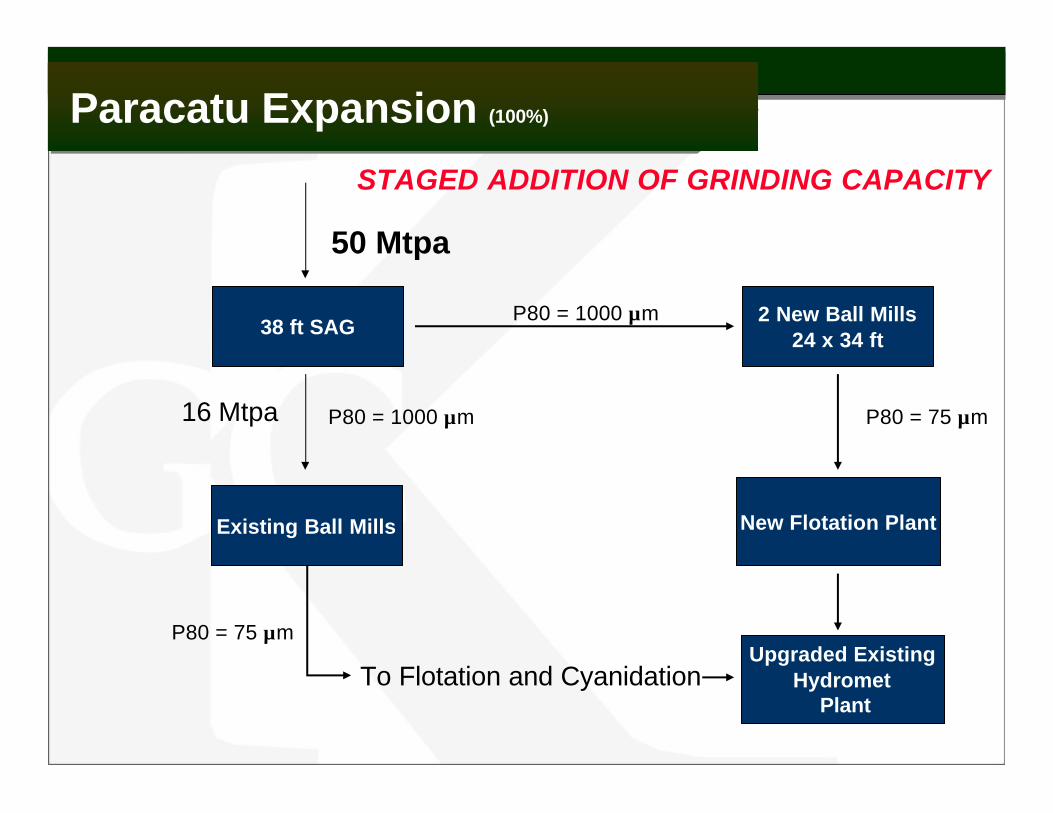
STAGED ADDITION OF GRINDING CAPACITY
Paracatu Expansion (100%)Paracatu Expansion (100%)
Existing Ball Mills
P80 = 75 µm
To Flotation and Cyanidation
38 ft SAG
50 Mtpa
P80 = 1000 µm16 Mtpa
Upgraded ExistingHydromet
Plant
2 New Ball Mills24 x 34 ft
P80 = 75 µm
P80 = 1000 µm
New Flotation Plant
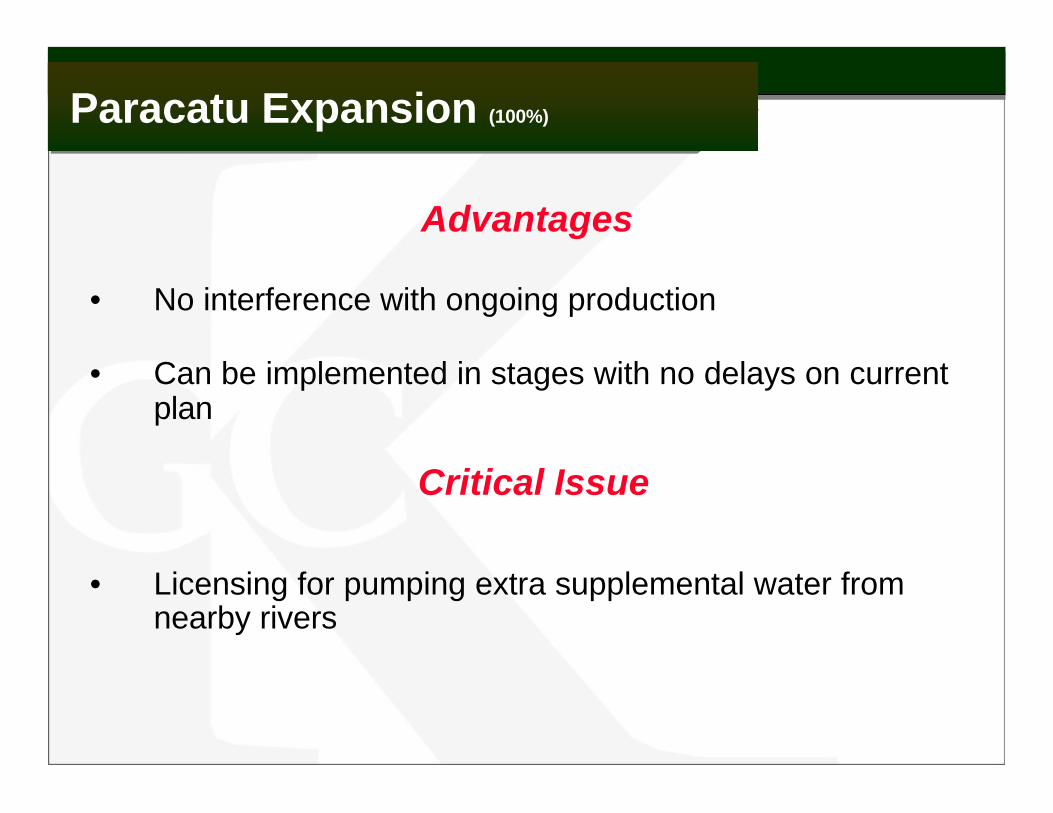
Advantages
• No interference with ongoing production
• Can be implemented in stages with no delays on current plan
• Licensing for pumping extra supplemental water from nearby rivers
Critical Issue
Paracatu Expansion (100%)Paracatu Expansion (100%)
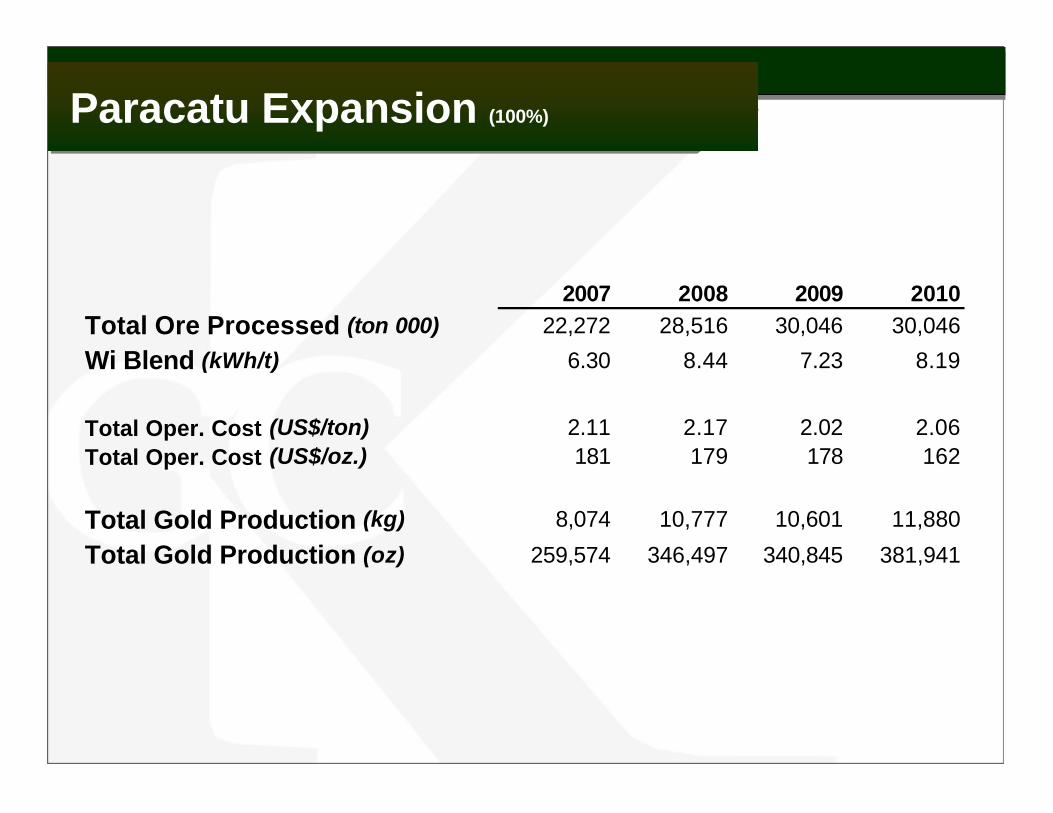
2007 2008 2009 2010Total Ore Processed (ton 000) 22,272 28,516 30,046 30,046
Wi Blend (kWh/t) 6.30 8.44 7.23 8.19
Total Oper. Cost (US$/ton) 2.11 2.17 2.02 2.06Total Oper. Cost (US$/oz.) 181 179 178 162
Total Gold Production (kg) 8,074 10,777 10,601 11,880
Total Gold Production (oz) 259,574 346,497 340,845 381,941
Paracatu Expansion (100%)Paracatu Expansion (100%)
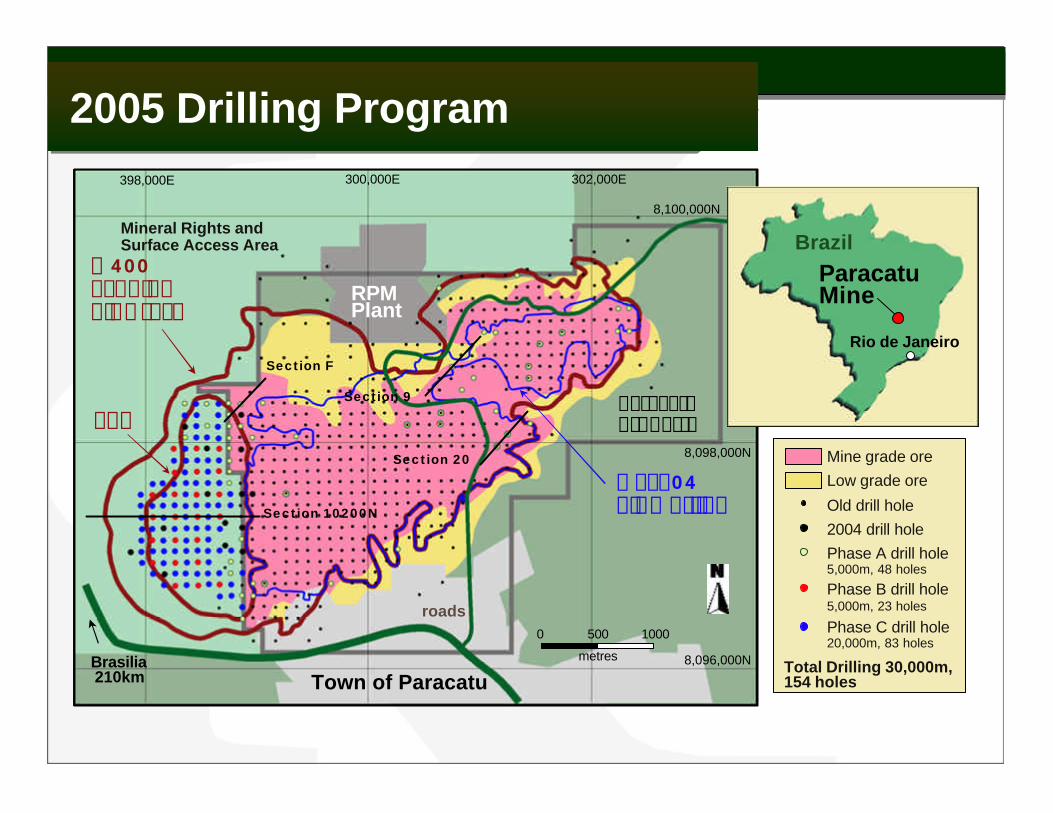
Paracatu Mine
Brazil
Rio de Janeiro
Town of Paracatu
398,000E
8,100,000N
Brasilia210km
$400 Scoping Pit Crest
ParacatuProperty
roads
Mine grade oreLow grade ore
Old drill hole2004 drill holePhase A drill hole5,000m, 48 holes
Phase B drill hole5,000m, 23 holes
Phase C drill hole20,000m, 83 holes
Mineral Rights andSurface Access Area
300,000E 302,000E
8,098,000N
8,096,000N
Dec.04 Pit Outline
0 500 1000
metres
RPMPlant
Toe
Section 10200N
Section F
Section 9
Section 20
Total Drilling 30,000m, 154 holes
2005 Drilling Program 2005 Drilling Program
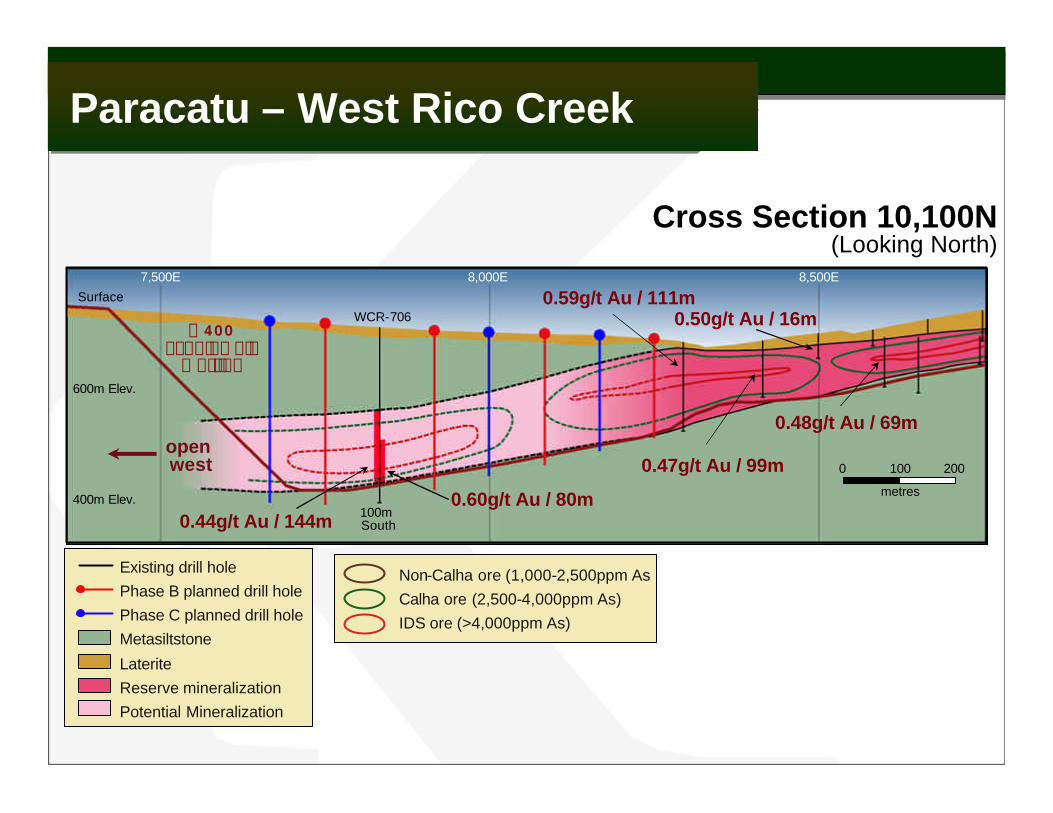
Cross Section 10,100N(Looking North)
Paracatu – West Rico CreekParacatu – West Rico Creek
7,500E 8,000E 8,500E
600m Elev.
400m Elev.
$400 Scoping Pit
Outline
0 100 200
metres
Existing drill holePhase B planned drill holePhase C planned drill holeMetasiltstone
LateriteReserve mineralizationPotential Mineralization
Surface
WCR-706
0.60g/t Au / 80m100m South
Non-Calha ore (1,000-2,500ppm AsCalha ore (2,500-4,000ppm As)IDS ore (>4,000ppm As)
0.59g/t Au / 111m
0.47g/t Au / 99m
0.50g/t Au / 16m
0.48g/t Au / 69m
0.44g/t Au / 144m
open west
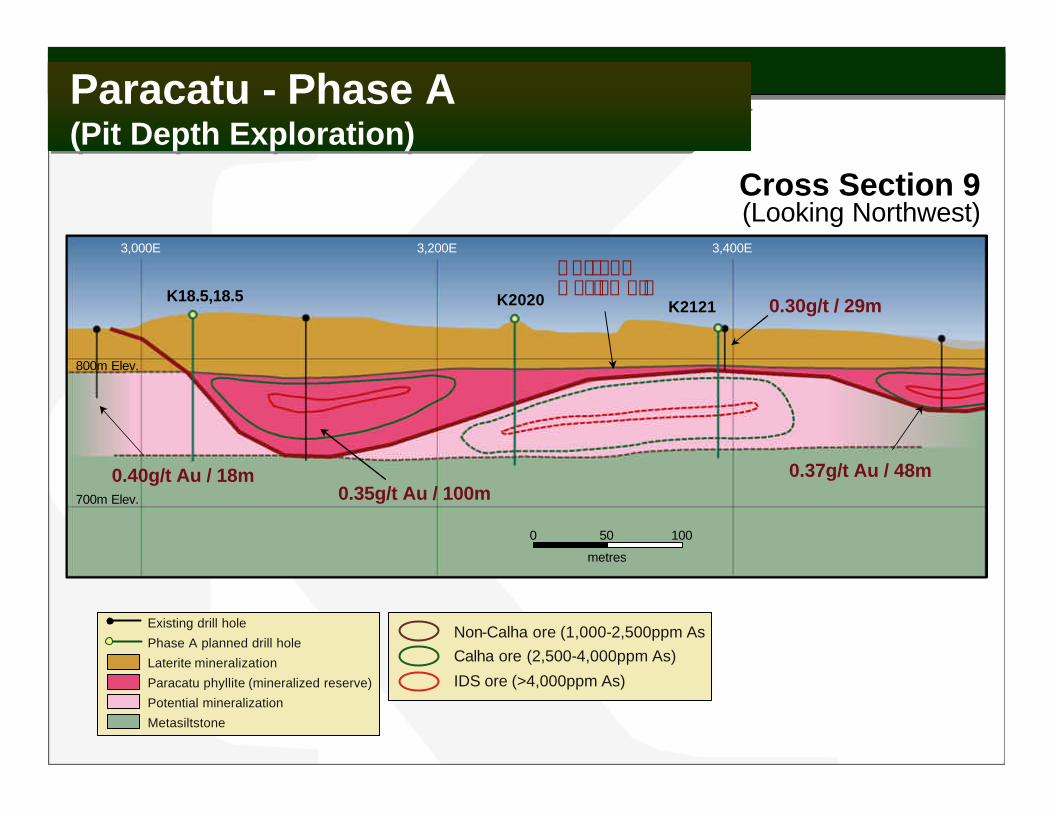
Cross Section 9(Looking Northwest)
Paracatu - Phase A (Pit Depth Exploration)Paracatu - Phase A (Pit Depth Exploration)
3,000E 3,200E 3,400E
800m Elev.
700m Elev. 0.35g/t Au / 100m
0.30g/t / 29m
0 50 100
metres
K2020
Existing drill hole
Phase A planned drill hole
Laterite mineralization
Paracatu phyllite (mineralized reserve)
Potential mineralization
Metasiltstone
Non-Calha ore (1,000-2,500ppm AsCalha ore (2,500-4,000ppm As)
IDS ore (>4,000ppm As)
0.40g/t Au / 18m 0.37g/t Au / 48m
CurrentDesign Pit
K2121K18.5,18.5

Fort Knox (100%)Fort Knox (100%)

Fort Knox – 7,600E (looking west)Fort Knox – 7,600E (looking west)
9,000E 10,000E 11,000E
2,000 ft.
1,000 ft.
Current Pit
$400 Pit Shell
0.100opt Au/35ft.
South North
FFC-04-727
0.291opt Au/15ft.
0.031opt Au/10ft.0. 048opt Au/10ft.
0.031opt Au/10ft.
0.038opt Au/120ft. 0.106opt Au/20ft.
GraniteSchistMineralized zoneOld exploration drill holeKinross drill hole
0 250 500
feet
UltimatePit
Open

Nice Photo of Round Mountain?Round Mountain (50%)Round Mountain (50%)
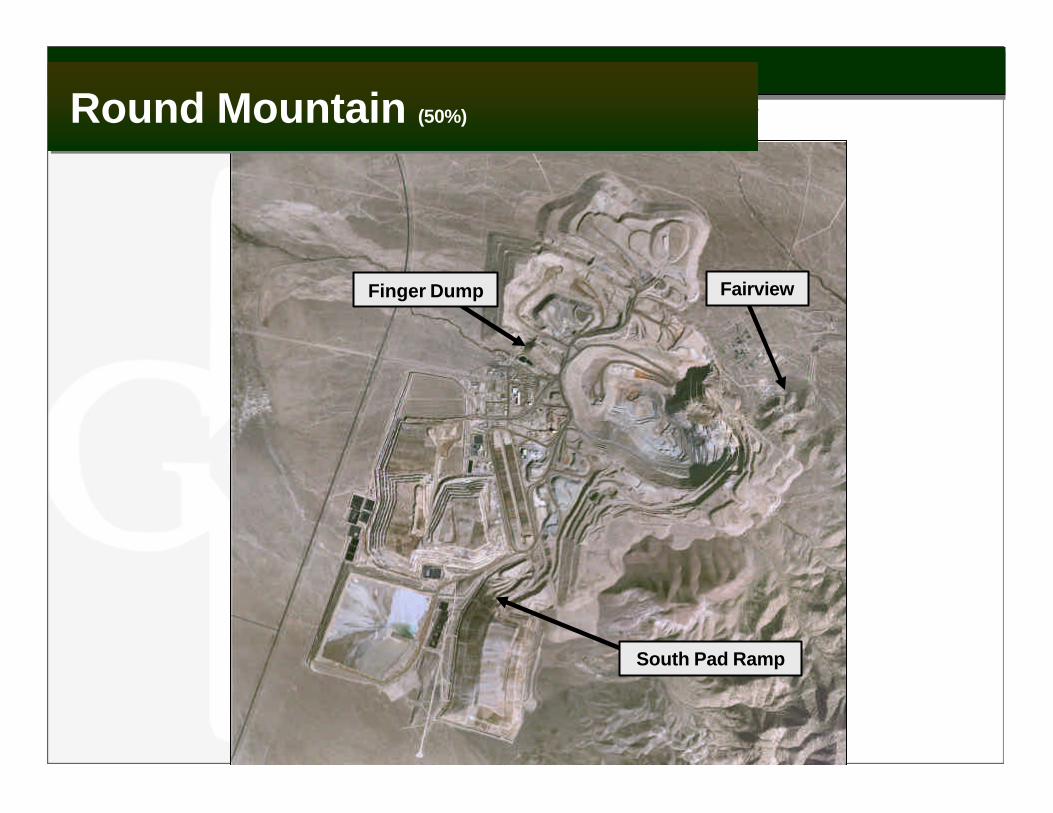
FairviewFinger Dump
South Pad Ramp
Round Mountain (50%)Round Mountain (50%)
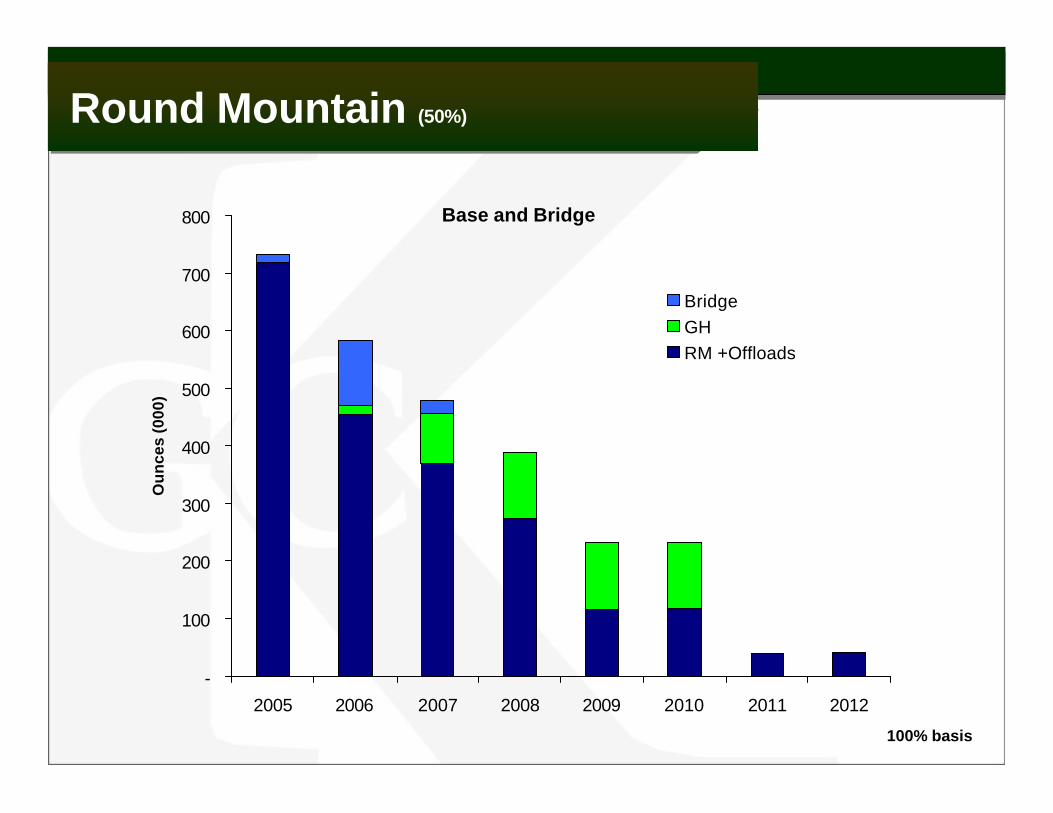
Gold Production Estimate
Base and Bridge
-
100
200
300
400
500
600
700
800
2005 2006 2007 2008 2009 2010 2011 2012
Ou
nce
s (0
00)
BridgeGHRM +Offloads
Round Mountain (50%)Round Mountain (50%)
100% basis
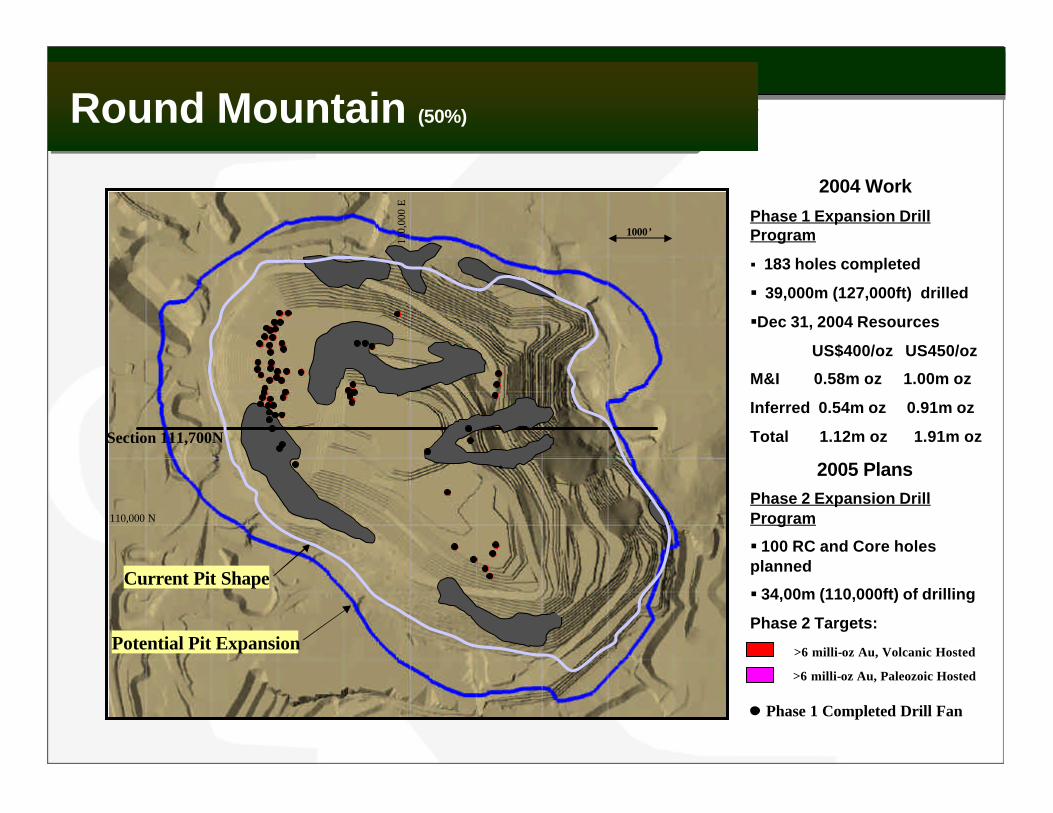
Round Mountain (50%)Round Mountain (50%)
>6 milli-oz Au, Paleozoic Hosted
>6 milli-oz Au, Volcanic Hosted
2004 Work
Phase 1 Expansion Drill Program
§ 183 holes completed
§ 39,000m (127,000ft) drilled
§Dec 31, 2004 Resources
US$400/oz US450/oz
M&I 0.58m oz 1.00m oz
Inferred 0.54m oz 0.91m oz
Total 1.12m oz 1.91m oz
2005 PlansPhase 2 Expansion Drill Program
§ 100 RC and Core holes planned
§ 34,00m (110,000ft) of drilling
Phase 2 Targets:Potential Pit Expansion
110,
000
E
110,000 N
1000’
Phase 1 Completed Drill Fan
Current Pit Shape
Section 111,700N

Round Mountain, Pit Expansion
108,000E
6,000 ft.
4,000 ft.
Current Pit
Phase 2Potential Pit Expansion
0 1000 2000
feet
110,000E 112,000EW E
Cross Section 111,700N, Looking North
?
Current Planned Pit
?
?
?
Alluvium
Volcanic sediments
Type 1 (welded tuff)
Type 2 (non-welded tuff)
Type 9 (transition)
Type 3 (welded lithic tuff)
Type 4 (Paleozoic sediments)
Granite + Paleozoic sediments
Ore reserve
Potential reserve addition
Mineralized envelope
Fault
Round Mountain (50%)Round Mountain (50%)

Gold Production EstimateRound Mountain (50%)Round Mountain (50%)
Base and Bridge
-
100
200
300
400
500
600
700
800
2005 2006 2007 2008 2009 2010 2011 2012
Ou
nce
s (0
00)
UGRM EXPBridgeGHRM +Offloads
100% basis
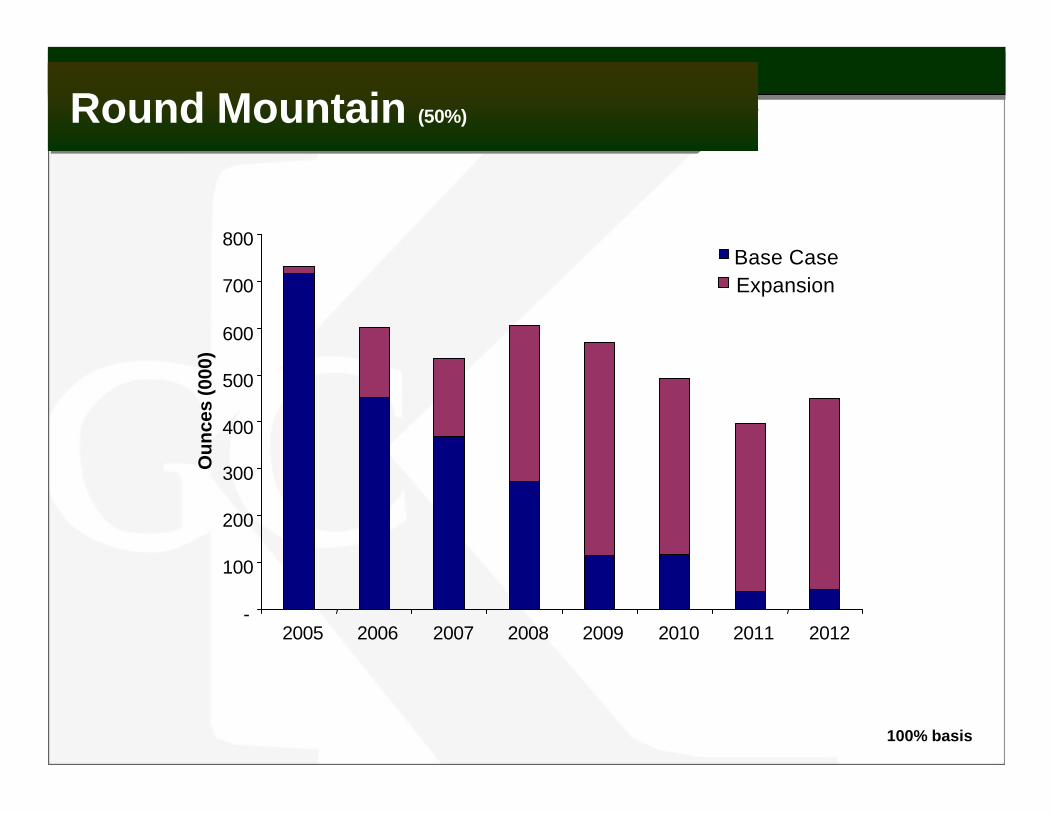
Gold Ounce ProductionRound Mountain (50%)Round Mountain (50%)
Expansion
-
100
200
300
400
500
600
700
800
2005 2006 2007 2008 2009 2010 2011 2012
Ou
nce
s (0
00)
Base Case
100% basis
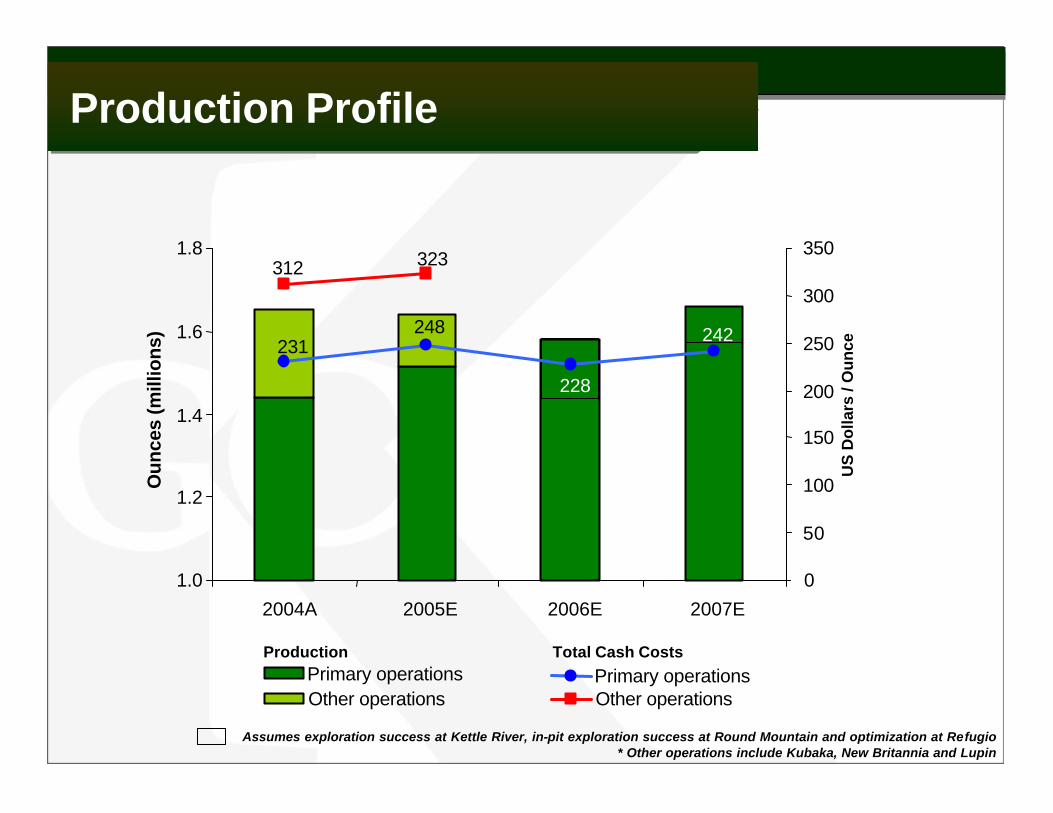
Production ProfileProduction Profile
323312
1.0
1.2
1.4
1.6
1.8
2004A 2005E 2006E 2007E
Ou
nce
s (m
illio
ns)
0
50
100
150
200
250
300
350
US
Do
llars
/ O
un
ce
Other operations Other operationsPrimary operations
Total Cash CostsPrimary operations
Production
Assumes exploration success at Kettle River, in-pit exploration success at Round Mountain and optimization at Refugio * Other operations include Kubaka, New Britannia and Lupin
242
228
248231

SummarySummary
Ø Paracatu – excellent potential to increase reserves and production rates
Ø Fort Knox – continuing to replace reserves
Ø Round Mountain – Feasibility of pit layback and U/G extend life
Ø Other opportunities – Crixas, La Coipa
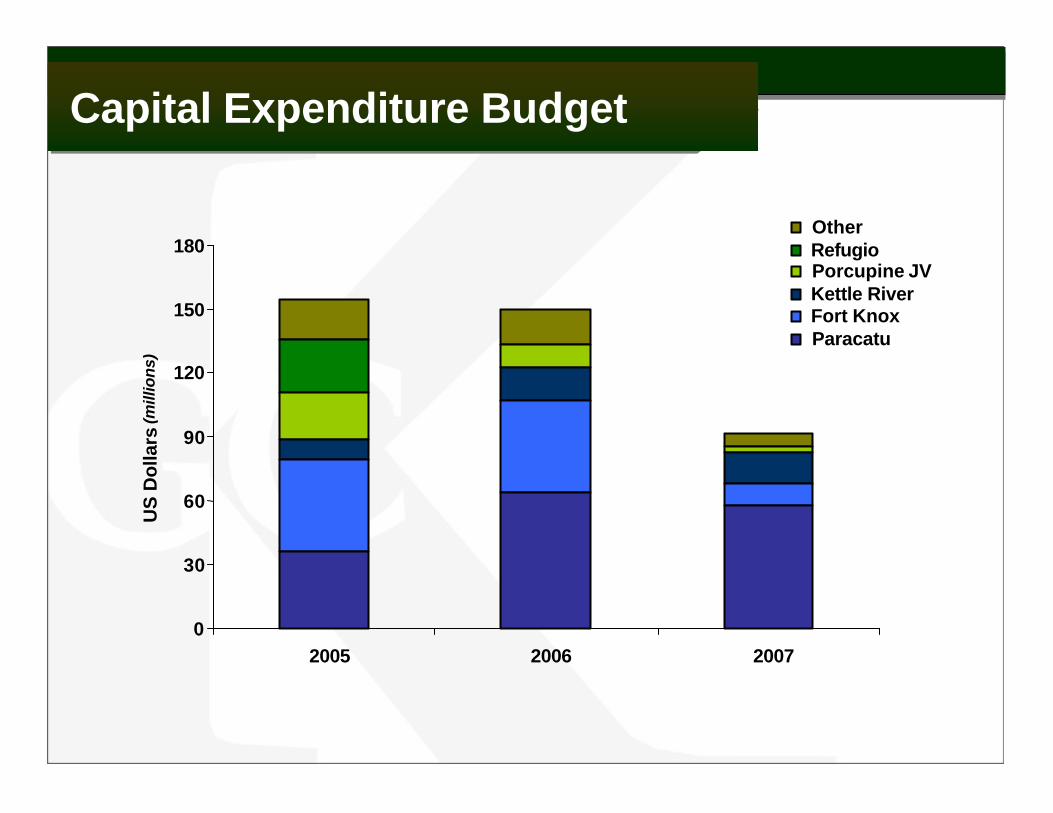
Capital Expenditure BudgetCapital Expenditure Budget
0
30
60
90
120
150
180
2005 2006 2007
US
Do
llars
(mill
ions
)
OtherRefugioPorcupine JVKettle RiverFort KnoxParacatu

dedicated tobeing world class
Kinross Gold Corporation40 King Street West, 52nd Floor
Scotia PlazaToronto, ON M5H 3Y2
416-365-5123416-363-6622866-561-3636
Shares outstanding: 346.6 millionMarket cap.: US$2.9 billion
KGC: NYSE K: TSXK.U: TSX (US dollar trading symbol)K.WT: TSX
www.kinross.com