DECLARATION OF ORIGINALITY - University of...
56
i DECLARATION OF ORIGINALITY FACULTY/ SCHOOL/ INSTITUTE: Engineering DEPARTMENT: Electrical and Information Engineering COURSE NAME: Bachelor of Science in Electrical & Electronic Engineering TITLE OF NAME OF STUDENT: Kimani Paul Njoroge REGISTRATION NUMBER: F17/2442/2008 COLLEGE: Architecture and Engineering WORK: MICROCONTROLLER-BASED IRRIGATION SYSTEM 1) I understand what plagiarism is and I am aware of the university policy in this regard. 2) I declare that this final year project report is my original work and has not been submitted elsewhere for examination, award of a degree or publication. Where other people’s work or my own work has been used, this has properly been acknowledged and referenced in accordance with the University of Nairobi’s requirements. 3) I have not sought or used the services of any professional agencies to produce this work. 4) I have not allowed, and shall not allow anyone to copy my work with the intention of passing it off as his/her own work. 5) I understand that any false claim in respect of this work shall result in disciplinary action, in accordance with University anti-plagiarism policy. Signature: ……………………………………………………………………………………… Date: ……………………………………………………………………………………………
Transcript of DECLARATION OF ORIGINALITY - University of...
i
DECLARATION OF ORIGINALITY
FACULTY/ SCHOOL/ INSTITUTE: Engineering
DEPARTMENT: Electrical and Information Engineering
COURSE NAME: Bachelor of Science in Electrical & Electronic Engineering
TITLE OF NAME OF STUDENT: Kimani Paul Njoroge
REGISTRATION NUMBER: F17/2442/2008
COLLEGE: Architecture and Engineering
WORK: MICROCONTROLLER-BASED IRRIGATION SYSTEM
1) I understand what plagiarism is and I am aware of the university policy in this regard.
2) I declare that this final year project report is my original work and has not been submitted
elsewhere for examination, award of a degree or publication. Where other people’s work
or my own work has been used, this has properly been acknowledged and referenced in
accordance with the University of Nairobi’s requirements.
3) I have not sought or used the services of any professional agencies to produce this work.
4) I have not allowed, and shall not allow anyone to copy my work with the intention of
passing it off as his/her own work.
5) I understand that any false claim in respect of this work shall result in disciplinary
action, in accordance with University anti-plagiarism policy.
Signature: ………………………………………………………………………………………
Date: ……………………………………………………………………………………………
ii
DEDICATION
This project is dedicated to my late parents who taught me the value of honesty and hard work at
an early age. May God rest their souls in eternal peace.

iii
ACKNOWLEDGEMENT
First and foremost, I would like to acknowledge the Almighty God for giving me physical and
spiritual strength during my studies.
Sincere thanks also goes to the Chairman-Department of Electrical and Information Engineering
and all my lecturers in the University of Nairobi including the supporting staff for the impact
they have had to my life and also for providing the conducive and enabling environment for
learning
Special appreciation to my supervisor, Dr G. N Kamucha for the critical comments and valuable
advice that guided me immensely throughout my project work and also in the lectures he
undertook with me within the five year course work.
Finally, I extend my appreciation to my family and friends for the support they offered me
during my study at the University.
iv
LIST OF FIGURES
Figure 2.1.Home made soil moisture sensor ................................................................................... 7
Figure 2.2. Schematic of an electrical resistance block and meter ................................................. 8
Figure 2.3 Diagram of a tensiometer ............................................................................................ 11
Figure 2.4 Tensiometer installation .............................................................................................. 11
Figure 2.5 YL-69 Sensor............................................................................................................... 12
Figure 2.6 YL-69 PCB ................................................................................................................. 13
Figure 2.7 Digipot schematic ........................................................................................................ 13
Figure 2.8 P3362 Electronic potentiometer .................................................................................. 14
Figure 2.9 Operational amplifier................................................................................................... 14
Figure 2.10 LM 393 Comparator .................................................................................................. 15
Figure 2.11 LM393 pin configuration .......................................................................................... 15
Figure 2.12.Installation of flat probe SMS.................................................................................... 17
Figure 2.13. SMSs with node probes installation ......................................................................... 18
Figure 2.14 Different types of arduino ......................................................................................... 21
Figure 2.15 Parts of arduino uno................................................................................................... 21
Figure 2.16 Atmega 328 microcontroller pin configuration ......................................................... 22
Figure 2.17 LCD (16X2)............................................................................................................... 23
Figure 2.18 The TRIAC ................................................................................................................ 25
Figure 2.19 5VDC Coil Relay ...................................................................................................... 26
Figure 2.20 Inside a SPST relay ................................................................................................... 27
Figure 2.21Simple relay interfacing ............................................................................................. 27
Figure 3.1 Arduino Uno ................................................................................................................ 28
Figure 3.2 YL-69 Connection to arduino board .......................................................................... 30
Figure 3.3 LCD Connection to arduino board .............................................................................. 31
Figure 3.4 LEDs Connection to arduino board ............................................................................. 32
Figure 3.5 Relay interfacing of arduino to the 240VAC pump .................................................... 34
Figure 3.6 Printed Circuit Board design ....................................................................................... 35
Figure 3.7 Circuit with all the components and parts ................................................................... 36
Figure 3.8 The program flow Diagram ......................................................................................... 38
Graph 3.1....................................................................................................................................... 40

v
LIST OF TABLES
Table 2-1 YL-69 specifications .................................................................................................... 13
Table 2-2 8 LM 393 Comparator specifications ........................................................................... 15
Table 2-3. YL-69 sensor value description ................................................................................... 18
Table 2-4 LCD Pin configuration ................................................................................................. 24
Table 3-1 Important pins in arduino ............................................................................................. 29
Table 3-2 Selected pins on arduino ............................................................................................... 29
Table 3-3 YL-69 PCB pins .......................................................................................................... 30
Table 4-1 Sensor values ................................................................................................................ 39
vi
LIST OF ABBREVIATIONS
SMS –Soil Moisture Sensor
VWC -Volumetric Water Content
TDR -Time Domain Reflectometry
FDR -Frequency Domain Reflectometry
RDAC -Resistive Digital-To-Analog Converters
PIC -Programmable Interface Controllers
LCD -Liquid crystal Display
ADC -Analog to Digital Converter
DAC –Digital to Analog Converter
LED -Light Emitting Diode
SPST -Single Pole Single Throw
SPDT - Single Pole Double Throw
DPST -Double Pole Single Throw
PCB –Printed Circuit Board
vii
ABSTRACT
In crop production a healthy water balance is essential for high quality yields. Under-watered
crops suffer from nutrient deficiencies while over-watered plants are more susceptible to diseases
pressure and can in some cases lead to root death through suffocation. Also over-watered plants
are not able to withstand dry spells during dry season.
The aim of this project is to use control engineering principles and concepts to provide a
microcontroller based irrigation system. The system will help in saving money and water and at
the same time increasing crops production. The automated irrigation system is controlled using
ATmega328 micro controller based on arduino platform. The system is programmed via the
microcontroller to give interrupt signal to the irrigation system (drip, sprinkler, ditch etc)
depending on the soil moisture levels. The soil moisture/humidity levels are checked using soil
moisture sensor. Whenever there is a change in moisture/humidity in the soil this sensor senses
the change and gives an interrupt signal to the micro-controller and thus the watering system is
activated or deactivated.
viii
Contents DECLARATION OF ORIGINALITY ............................................................................................ i
DEDICATION ................................................................................................................................ ii
ACKNOWLEDGEMENT ............................................................................................................. iii
LIST OF FIGURES ....................................................................................................................... iv
LIST OF TABLES .......................................................................................................................... v
LIST OF ABBREVIATIONS ........................................................................................................ vi
ABSTRACT .................................................................................................................................. vii
1. INTRODUCTION .................................................................................................................. 1
1.1 Brief Background ............................................................................................................. 1
1.2 Types of irrigation ............................................................................................................ 1
1.3 Problem statement ............................................................................................................ 2
1.4 Main objectives ................................................................................................................ 2
1.5 Project justification .......................................................................................................... 3
1.6 Project scope .................................................................................................................... 3
1.7 Project organization.......................................................................................................... 3
2 LITRATURE REVIEW .......................................................................................................... 5
2.1 Sensors ............................................................................................................................. 5
2.1.1 Soil moisture sensors ................................................................................................ 5
2.1.2 Soil Moisture calculation .......................................................................................... 5
2.1.3 Types of soil moisture sensors .................................................................................. 6
2.1.4 Sensor Selection ...................................................................................................... 16
When deciding on which sensor to use the following factors should be put into
consideration: [4][8].............................................................................................................. 16
2.1.5 Sensor Calibration ................................................................................................... 18
2.2 Microcontroller............................................................................................................... 18
2.2.1 Types of Microcontrollers....................................................................................... 19
2.2.2 Arduino ................................................................................................................... 20
2.2.3 Types of arduino boards.......................................................................................... 20
ix
2.3 Liquid Crystal Display (LCD)........................................................................................ 23
2.4 Automatic switching circuits .......................................................................................... 24
2.4.1 The Triac Switching circuit .................................................................................... 24
2.4.2 Relay switching circuit ........................................................................................... 25
3 DESIGN AND IMPLEMENTATION ................................................................................. 28
3.1 Hardware design ............................................................................................................. 28
3.1.1 Control Unit: ATMega328 microcontroller on arduino platform ........................... 28
3.1.2 Sensing Unit: ........................................................................................................... 30
3.1.3 YL-69 soil moisture sensor connection to arduino ................................................. 30
3.1.4 Output Units ............................................................................................................ 31
3.1.5 Printed Circuit Board (PCB) ................................................................................... 34
3.2 Software design .............................................................................................................. 36
3.2.1 Program Pseudo code .............................................................................................. 37
4 RESULTS ANALYSIS AND DISCUSSIONS .................................................................... 39
4.1 Results ............................................................................................................................ 39
4.2 Discussion ...................................................................................................................... 39
5 CONCLUSION AND RECOMMENDATIONS ................................................................. 41
5.1 CONCLUSION .............................................................................................................. 41
5.2 RECOMMENDATIONS ............................................................................................... 41
REFERENCES ............................................................................................................................. 42
6 APPENDIX ........................................................................................................................... 43
6.1 Microcontroller code ...................................................................................................... 43
6.2 KSP2222A datasheet ...................................................................................................... 46
6.3 SONGLE RELAY .......................................................................................................... 47
1
1. INTRODUCTION
1.1 Brief Background
The continuous increase in food demand requires a rapid improvement in food production
technologies. Food insecurity is a major challenge in developing countries. In a country like
Kenya where the economy is mainly agriculture based, use of technology to improve on yields is
paramount.
Agriculture in Kenya is mainly rain fed. Global warming has led to climate changing thus
rendering the rain fed agricultural systems unreliable. This has resulted on more land being put
under irrigation to meet the food demand for the growing population.
In Kenya approximately 125,000 hectares of land is under irrigation out of the estimated
potential of 1.3 million hectares. Only 30% of the 1.3 million hectares potential irrigation land
has available water resources while the other 70% require water harnessing for irrigation to be
realized. [10]
Irrigation is the process of artificial application of water to land to aid crops growth. It is mainly
used during dry seasons or in dry areas where rainfall is scarce.
1.2 Types of irrigation
1.2.1.1 Ditch Irrigation
This is one of the earliest irrigation methods to be used. Ditches/trenches are dug out and crops
are planted along the ditches in rows.
1.2.1.2 Terrace Irrigation
The land is shaped into steps. Crops are planted on the flat areas. Water flows down the steps
watering each of the flat areas. This method is both time and labour intensive in building the
terraces.
1.2.1.3 Drip Irrigation
This is one of the most effective and efficient method of irrigation as water is dripped at the crop
root zone. The method saves water from runoff and evaporation.
2
1.2.1.4 Sprinkler irrigation
This method uses overhead sprinklers. Each sprinkler irrigates a given area. During installation
care should be taken to avoid over or under watering some areas. If poorly installed a lot of water
is wasted via runoff.
1.2.1.5 Rotary Systems
This is an improvement of sprinkler irrigation method where sprinklers are mechanically moving
in a rotary/circular manner. This method is best suited for huge tracks of land. This method is
more efficient than the basic sprinkler method.
This project presents a microcontroller based irrigation system which monitor and control the
soil moisture content so as to optimize the application of water. Good water balance leads to
maximum crop production. The system presented automates irrigation systems with the use of
low cost sensor, microcontroller and the simple circuitry, thereby making it a low cost.
1.3 Problem statement
Over the last decades, empirical experience has shown that irrigation increases yield of most
crops by between 100 and 400%. It is expected that, over the next 30 years, 70% of the grain
production will be from irrigated land in the world. The Food and Agriculture Organization
estimates that irrigated land in developing countries will increase by 27%t in the next 20
years, but the amount of water expected to be available for agricultural production will only
increase by a mere 12 per cent. The available water resource for irrigation has to be put to
optimal use through appropriate technology.
This project aims at automating irrigation systems using a micro-controller to improve on water
management. This will increase yields, improve crop quality, and most importantly conserve
water thus saving money.
1.4 Main objectives
The system is expected to monitor moisture/humidity levels in the soil and switch on/off the
watering system according to set moisture levels.
3
1.5 Project justification
The increasing world population has lead to exponential increase in food demand. This event has
necessitated the need for more land to be cultivated. Due to change of weather patterns brought
about by global warming, irrigation remains as the only reliable method of crops production.
With more and more land now being under irrigation there is a need for optimal use of water.[2]
Over the last few years knowledge in electronics and computation has been used to solve present
day challenges. In the forefront of the electronics revolution has been the microcontroller. The
microcontroller has been used together with various sensors to measure and control physical
quantities like temperature, humidity, heat and light. By controlling this physical quantities using
the microcontroller; automatic systems have been achieved.
Irrigation systems in crop production can and has also been automated. This solves the challenge
brought about by the unreliability of climate changes thus need for water optimization.
Automation of the irrigation systems is one of the most convenient, efficient and effective
method of water optimization. The systems helps in saving water and thus more land can be
brought under irrigation. Crops grown under controlled conditions tend to be healthier and thus
give more yields. Controlled watering system results in reduction of fertilizer use and thus
fertilizer costs go down.
1.6 Project scope
The scope of this project entails the design and implementation of a micro controlled irrigation
system, depending on the soil moisture content. Humidly/moisture sensor will be the input of the
system and an electric water pump will be the output of the microcontroller.
1.7 Project organization
This project report is organized into five chapters:
Chapter one gives the introduction to the project, the project objectives and the scope.
Chapter Two is the literature review which describes the system and the components used
in the design.
Chapter Three gives a complete technical aspect of the design.
Chapter Four analyses and discusses the project.
4
Chapter Five gives the conclusion of the whole project, if the objective and scope of the
project were achieved. This chapter also includes appendices and the references used.
5
2 LITRATURE REVIEW
2.1 Sensors
A sensor is a device that detects and measures a physical quantity from the environment and
converts it into an electronic signal. The physical quantity could be moisture, temperature,
motion, light or any other physical phenomenon. Examples of sensors include: oxygen sensors,
temperature sensors, infra red sensors, humidly sensors, soil moisture sensors and motion
detection sensors. The output of the sensors is usually charge, current or voltage. Of interest in
this paper is the soil moisture sensor. [4]
2.1.1 Soil moisture sensors
A soil moisture sensor is a device that measures the volumetric water content (VWC) of soil.
Mathematically VWC, θ, is given as follows;
Equation 2-1: mathematical representation of VWC
Where: Vw is the water volume and VT is the total volume (soil volume + water volume).
Soil moisture sensors are classified according to how they measure the soil moisture content.
2.1.2 Soil Moisture calculation
Two methods are used in determining the volumetric water content (VWC); direct and indirect.
The direct method entails drying a known volume of soil in an oven and weighing it. [4]The
direct method of measuring VWC is done using the following mathematical notation:
6
Equation 2-2 Soil Moisture calculation
Where:
Mwet is soil sample before drying in the oven
Mdry is soil sample after drying in the oven
ρw is water density
Vb is the volume of soil sample before drying
Indirect method is based on correlating soil physical and chemical properties with water content.
Three techniques are used in this method namely: chemical titrations, geophysical sensing and
satellite remote sensing.
Chemical titration determines the moisture loss in sample soil after freeze drying or heating.
Satellite remote sensing uses microwave radiation to check on the difference in dielectric
properties of dry and wet soils. Geophysical sensing uses physical devices which are inserted in
the soil to determine the soil moisture content. Techniques used in this method include: electrical
resistance, electrical conductivity, soil dielectric, soil tension, TDR, FDR, soil capacitance
among others.
2.1.3 Types of soil moisture sensors
2.1.3.1 Electrical resistance blocks Sensors
These sensors are made up of two electrodes made from a porous substance like sand ceramic
mixture or gypsum. The two electrodes are imbedded in the soil during installation. [4] Moisture
is allowed to move freely in and out of the sensors electrodes as the soil becomes moist or dries
up. The resistance of the electrodes to the flow current is correlated with moisture content. To
measure this resistance the electrodes are biased (energized) with a dc voltage and the current
flowing through them measured. Applying Ohm’s law;
7
R=V/I
Where: R is resistance (Unknown) (Ω)
V is biasing voltage (3.3V to 5.0V)
I is the current flowing through the electrodes (Amps)
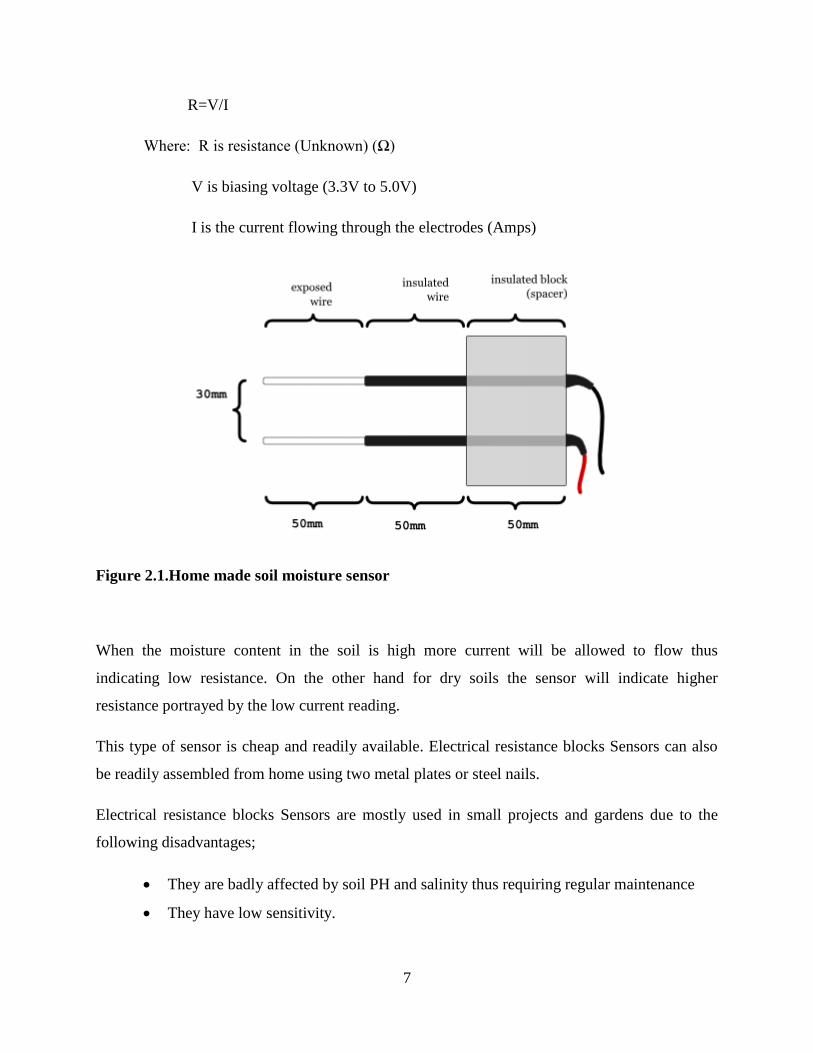
Figure 2.1.Home made soil moisture sensor
When the moisture content in the soil is high more current will be allowed to flow thus
indicating low resistance. On the other hand for dry soils the sensor will indicate higher
resistance portrayed by the low current reading.
This type of sensor is cheap and readily available. Electrical resistance blocks Sensors can also
be readily assembled from home using two metal plates or steel nails.
Electrical resistance blocks Sensors are mostly used in small projects and gardens due to the
following disadvantages;
They are badly affected by soil PH and salinity thus requiring regular maintenance
They have low sensitivity.
8
The electrodes; especially which provides a constant source of ions; do not dry at the
same rate as the soil surrounding it.
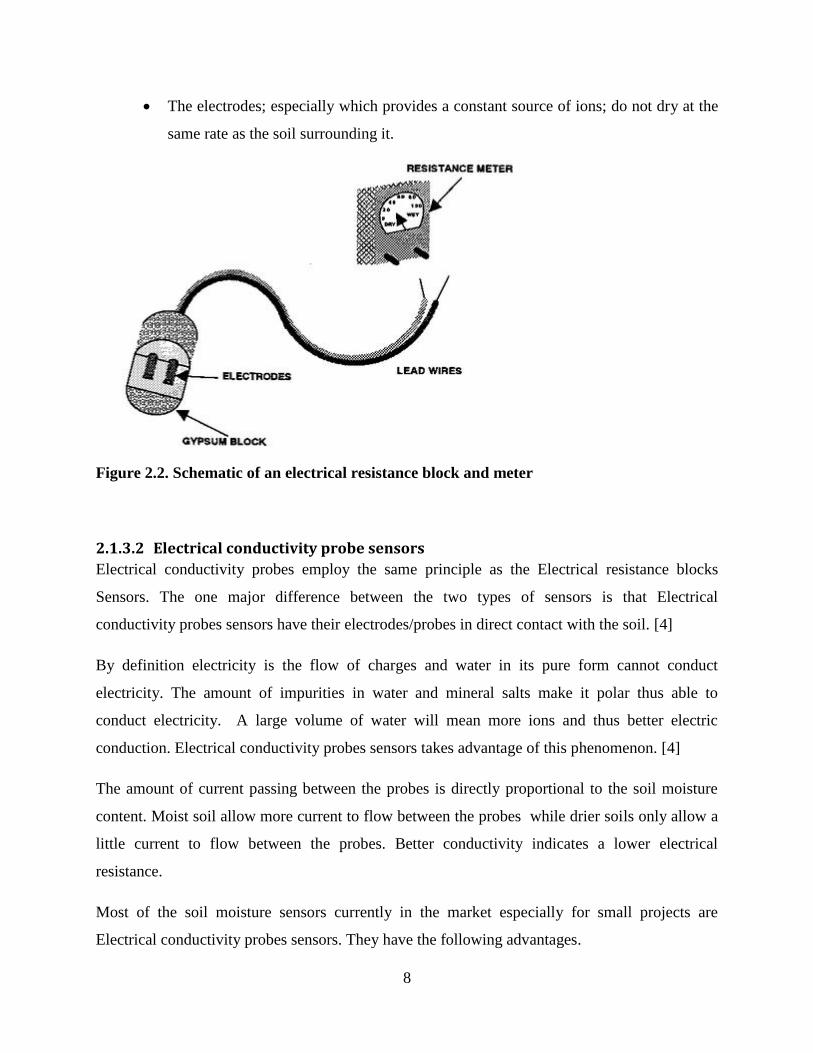
Figure 2.2. Schematic of an electrical resistance block and meter
2.1.3.2 Electrical conductivity probe sensors
Electrical conductivity probes employ the same principle as the Electrical resistance blocks
Sensors. The one major difference between the two types of sensors is that Electrical
conductivity probes sensors have their electrodes/probes in direct contact with the soil. [4]
By definition electricity is the flow of charges and water in its pure form cannot conduct
electricity. The amount of impurities in water and mineral salts make it polar thus able to
conduct electricity. A large volume of water will mean more ions and thus better electric
conduction. Electrical conductivity probes sensors takes advantage of this phenomenon. [4]
The amount of current passing between the probes is directly proportional to the soil moisture
content. Moist soil allow more current to flow between the probes while drier soils only allow a
little current to flow between the probes. Better conductivity indicates a lower electrical
resistance.
Most of the soil moisture sensors currently in the market especially for small projects are
Electrical conductivity probes sensors. They have the following advantages.
9
They are cheap
They are readily available
Easy to calibrate and install
2.1.3.3 Dielectric sensors
Dielectric sensors measure the soil water content in the soil by measuring the dielectric
permittivity of the soil. A dielectric material is substance that does not conductor electricity, but
supports electrostatic field s efficiently. At some cases dielectric substance are referred to as
insulators. The volume of water in the soil influences the dielectric permittivity of soil. [4]The
dielectric of water which is 80.4 is greater than other soil constituents. Therefore change in the
amount of water in the soil will directly lead to change in the soil dielectric permittivity.
Dielectric sensors are very complex to build thus making them very expensive. These sensors are
mostly used in scientific research owing to their high accuracy and cost
Dielectric sensors are classified into two types namely: Capacitance sensors and Time Domain
Reflectometry (TDR) sensors. These sensors do not measure electrical conductivity while
measuring soil moisture. [7]
2.1.3.4 Capacitance sensors
Capacitance sensors use frequency domain reflectometry (FDR).Frequency domain
reflectometry is the measure of signal reflections through a medium across frequency.
Capacitance sensors contain two electrodes which are separated by a dielectric material.
The soil becomes the dielectric component after the electrodes are inserted into the soil; it could
even be inserted into the access tube in the soil to achieve the same results. A high oscillating
frequency is thereafter applied to the electrodes to induce a resonant frequency. The magnitude
of the resonant frequency is dependent on the dielectric constant of the soil which in turns
depends on or can change to the soil’s moisture content. The change of the frequency as a result
of the soil’s moisture content is converted into the measurement of the soil moisture.
2.1.3.5 Time Domain Reflectometry (TDR) sensors
Time Domain Reflectometry uses the principle of waveguides. The actual content of water in the
soil is measured under this technology and not the water potential.[7] The TDR device sends
signals to the rods inserted in the soil. The time required for an electromagnetic signal to travel
10
along the wave guide is measured. The rate at which the send signal returns is used to measure
the water content in the soil. The return rate is dependent on the dielectric properties of the soil.
The signal takes longer time in moisture soils and shorter time in dry soil. This pulse signal is
then converted into soil moisture measurement. [4] TDR sensors give accurate readings faster
and require very little maintenance. The major disadvantage of TDR sensors is that they require
they require different calibrations depending on different soil types.
2.1.3.6 Heat dissipation sensors
Heat dissipation sensors measure the soil moisture content by measuring the amount of heat
dissipated from a medium which is of ceramic kind in most cases. The water contained in the
medium spaces is directly proportional to the heat dissipated from the medium. [8]The less the
water contained in the medium the less the heat dissipated and more heat is dissipated if the
water contained in the medium is high. More heat dissipated leads to lower reading on the sensor
and less heat dissipated leads to higher reading on the sensor.
The sensor uses the principle of capillarity. Capillary forces influence movement of water
between the sensor medium and the surrounding soil. Heat dissipation sensors are independent
of soil salinity thus not affected by soil type. They require minimum or no calibration at all. On
the downside this type of sensors are very expensive.
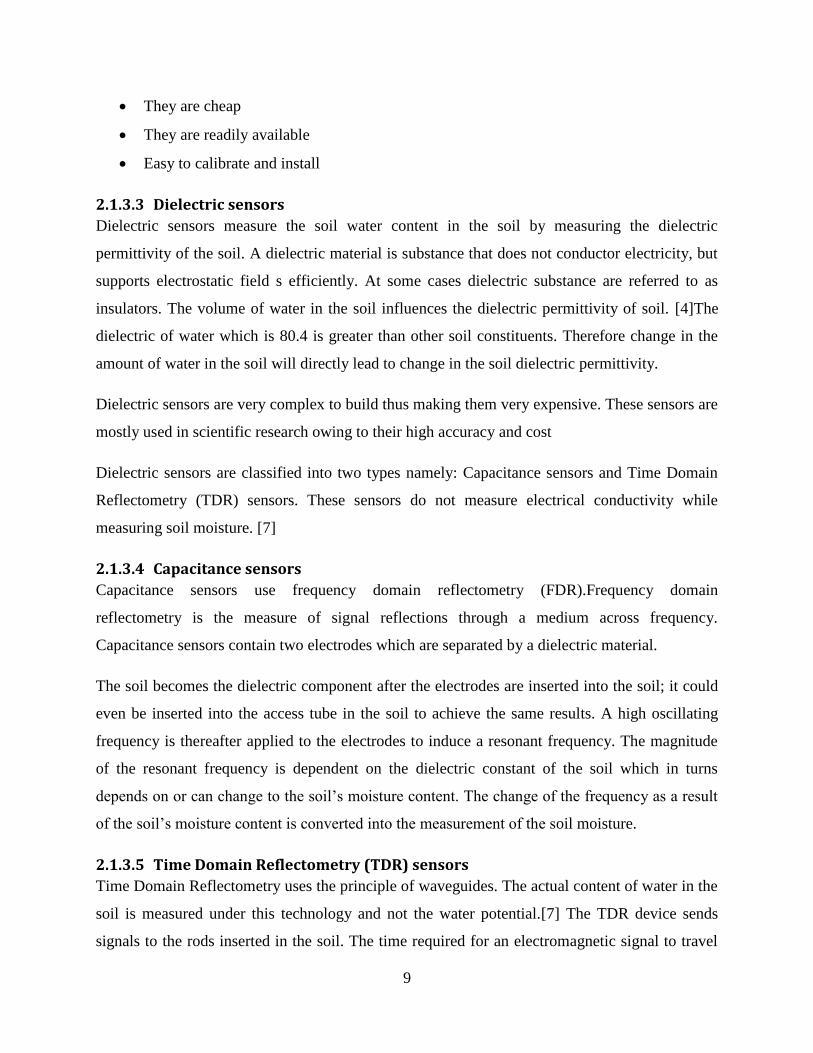
2.1.3.7 Tensiometer Sensors
Tensiometers sensors measure the soil moisture content in the soil by measuring the moisture
tension/suction in the soil. Tensiometers sensors is made up of two major parts; a plastic tube
which has a ceramic porous medium at its tip and a vacuum gauge on the opposite end. [7]
During installation the ceramic tip is buried in the soil at the calibrated depth which should be as
near as possible to the plants root area. The vacuum gauge measures the effort the plants roots
have to put to extract water from the soil.[4]This is the measure of the soil measure tension
which is measured in centibars.
11
Figure 2.3 Diagram of a tensiometer
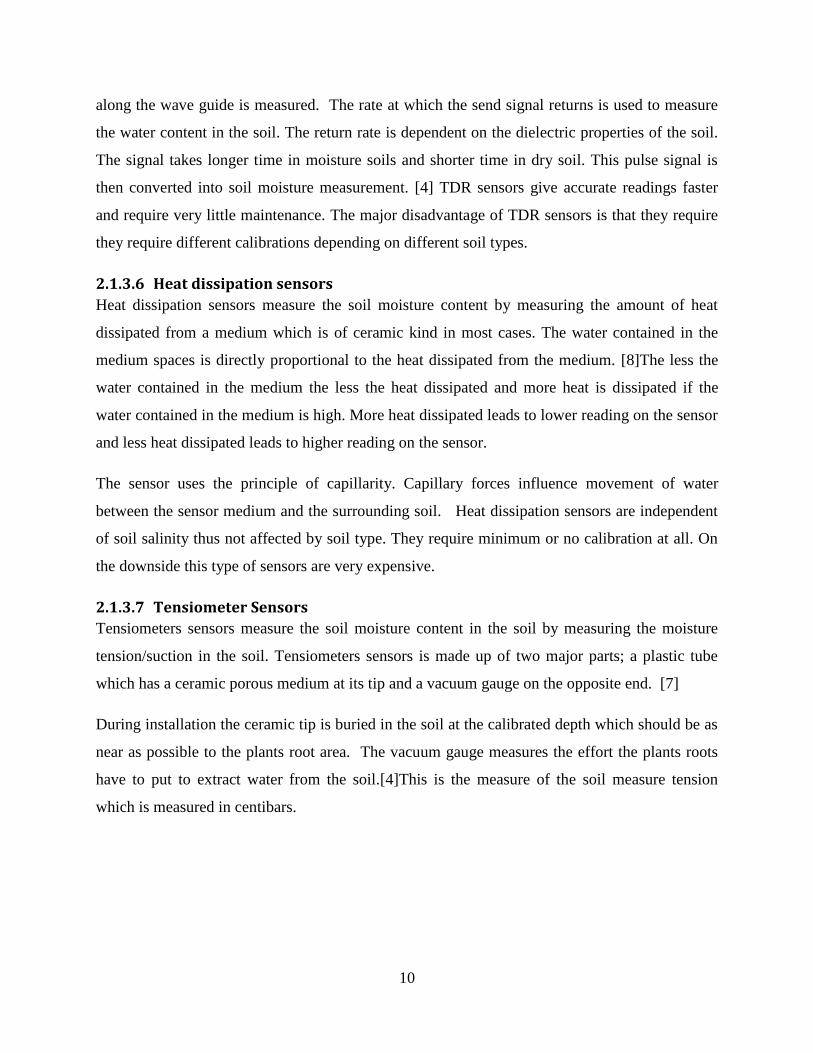
If the soil moisture content is low the roots work harder to extract water from the soil. The
reading on the sensor is high. When water is more available in the soil the roots works less and
thus lower reading is indicated on the sensor.[8]
Figure 2.4 Tensiometer installation
12
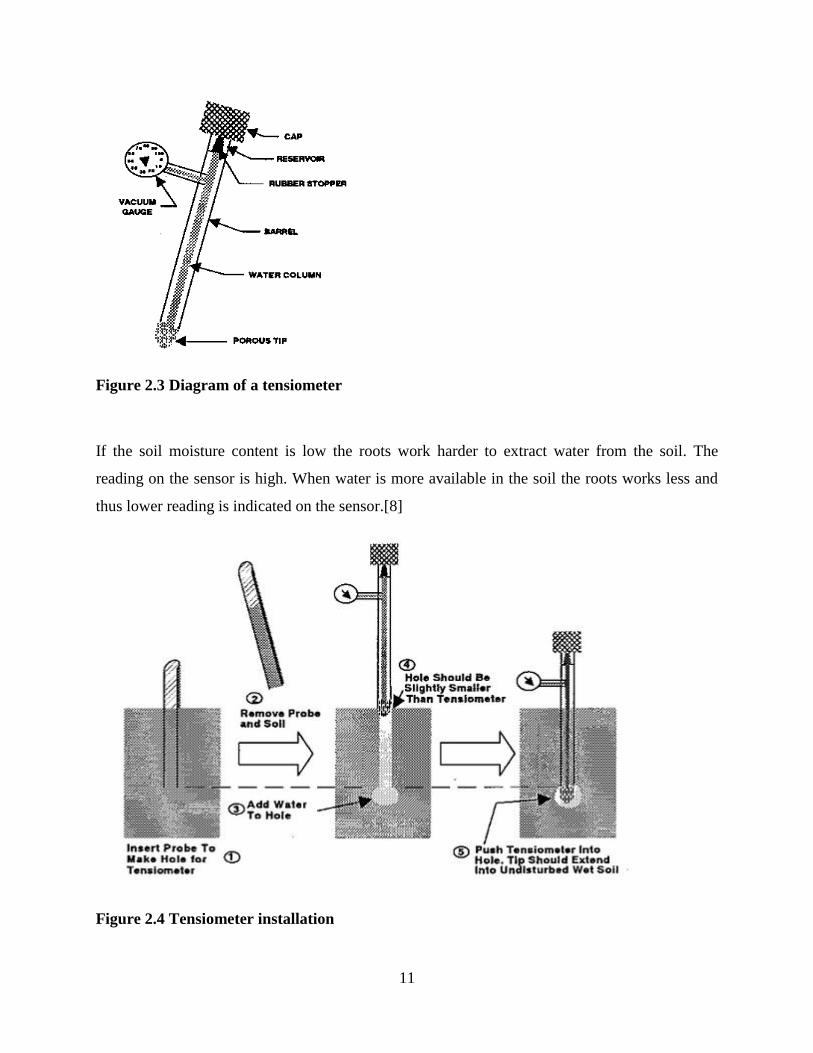
2.1.3.8 YL-69 Moisture Sensor
This is an Electrical resistance Sensor. The sensor is made up of two electrodes. This soil
moisture sensor reads the moisture content around it. A current is passed across the electrodes
through the soil and the resistance to the current in the soil determines the soil moisture. If the
soil has more water resistance will be low and thus more current will pass through. On the other
hand when the soil moisture is low the sensor module outputs a high level of resistance. [7]This
sensor has both digital and analogue outputs. Digital output is simple to use but is not as accurate
as the analogue output.
Figure 2.5 YL-69 Sensor
YL-69 soil moisture sensor has the following specifications: [7]
Vcc power supply 3.3V or 5V
Current 35mA
Signal output voltage 0-4.2V
Digital Outputs 0 or 1
Analog Resistance (Ω)
Panel Dimension 3.0cm by 1.6cm
Probe Dimension 6.0cm by 3.0cm
GND Connected to ground
13
Table 2-1 YL-69 specifications
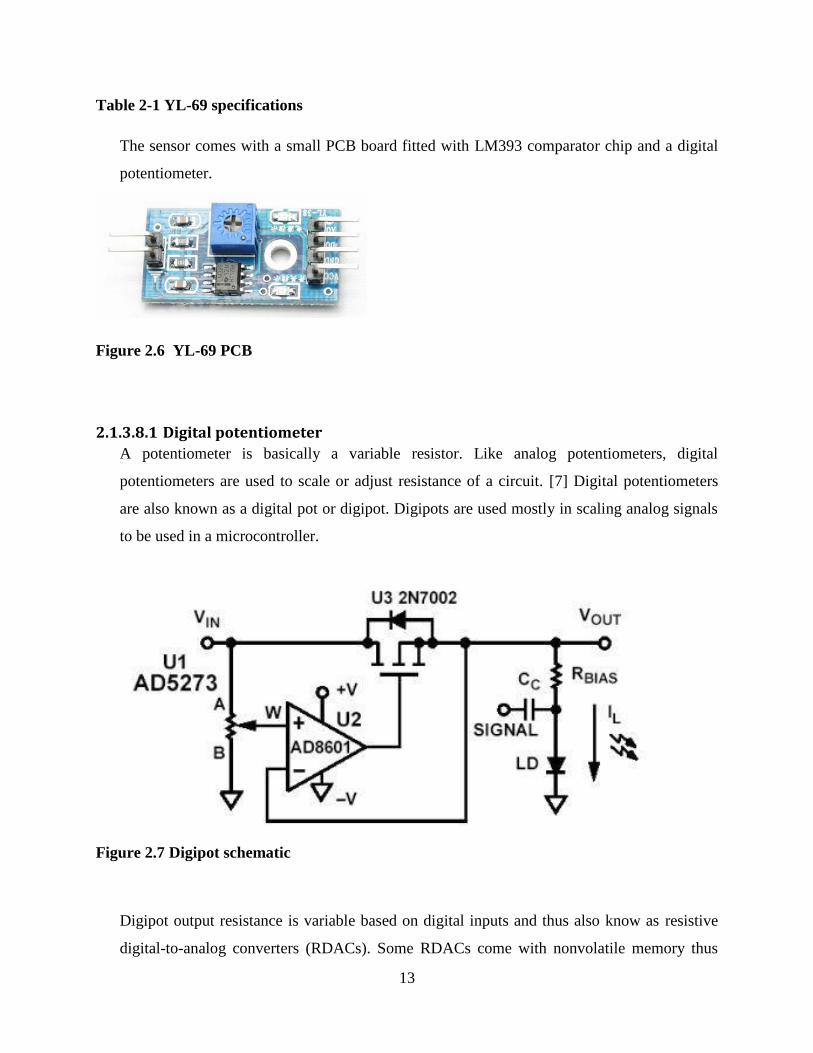
The sensor comes with a small PCB board fitted with LM393 comparator chip and a digital
potentiometer.
Figure 2.6 YL-69 PCB
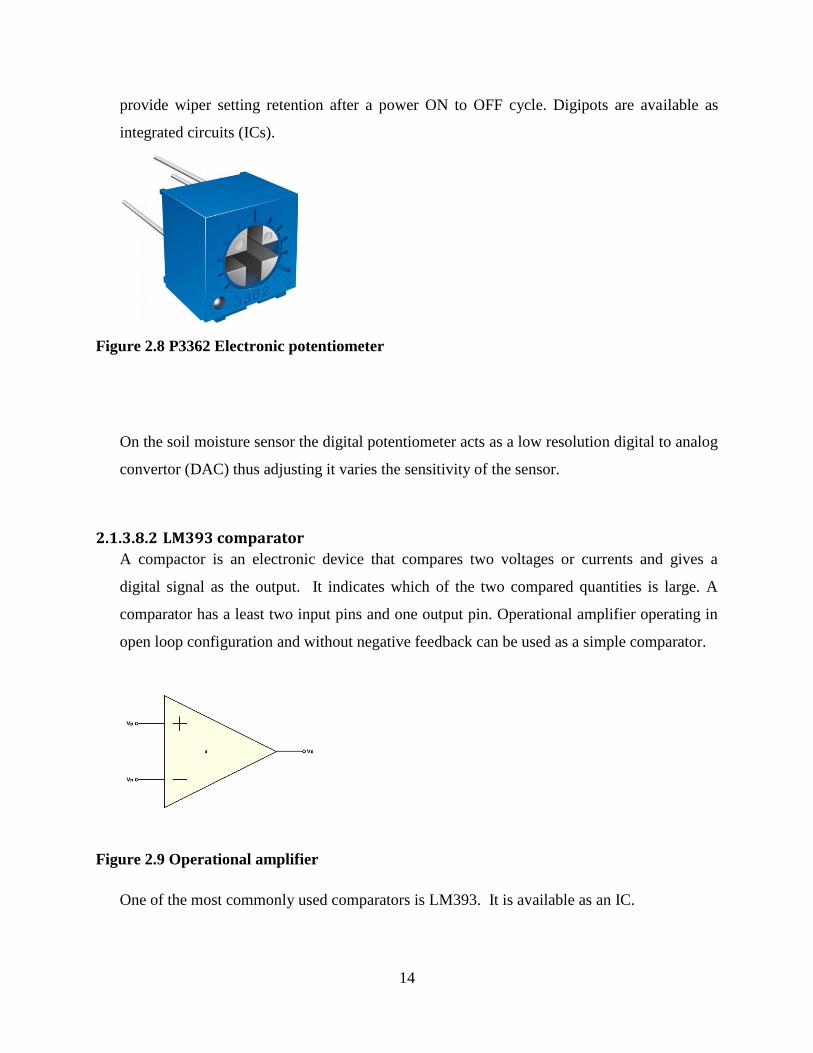
2.1.3.8.1 Digital potentiometer
A potentiometer is basically a variable resistor. Like analog potentiometers, digital
potentiometers are used to scale or adjust resistance of a circuit. [7] Digital potentiometers
are also known as a digital pot or digipot. Digipots are used mostly in scaling analog signals
to be used in a microcontroller.
Figure 2.7 Digipot schematic
Digipot output resistance is variable based on digital inputs and thus also know as resistive
digital-to-analog converters (RDACs). Some RDACs come with nonvolatile memory thus
14
provide wiper setting retention after a power ON to OFF cycle. Digipots are available as
integrated circuits (ICs).
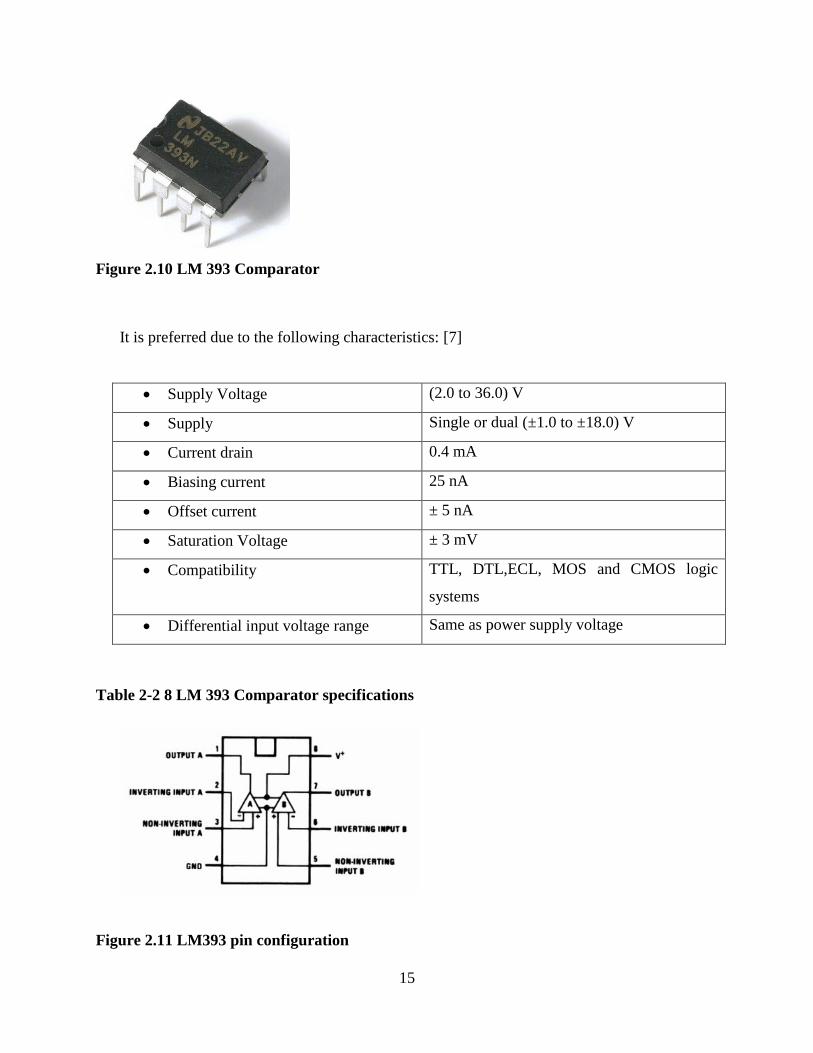
Figure 2.8 P3362 Electronic potentiometer
On the soil moisture sensor the digital potentiometer acts as a low resolution digital to analog
convertor (DAC) thus adjusting it varies the sensitivity of the sensor.
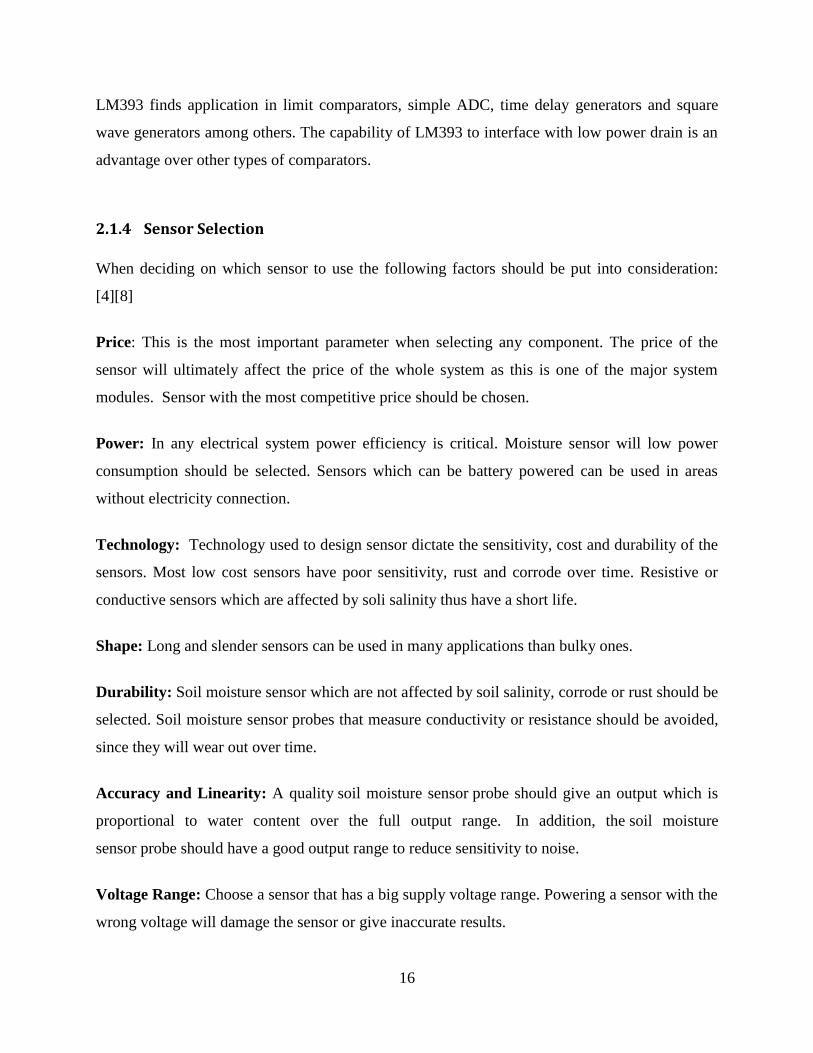
2.1.3.8.2 LM393 comparator
A compactor is an electronic device that compares two voltages or currents and gives a
digital signal as the output. It indicates which of the two compared quantities is large. A
comparator has a least two input pins and one output pin. Operational amplifier operating in
open loop configuration and without negative feedback can be used as a simple comparator.
Figure 2.9 Operational amplifier
One of the most commonly used comparators is LM393. It is available as an IC.
15
Figure 2.10 LM 393 Comparator
It is preferred due to the following characteristics: [7]
Supply Voltage (2.0 to 36.0) V
Supply Single or dual (±1.0 to ±18.0) V
Current drain 0.4 mA
Biasing current 25 nA
Offset current ± 5 nA
Saturation Voltage ± 3 mV
Compatibility TTL, DTL,ECL, MOS and CMOS logic
systems
Differential input voltage range Same as power supply voltage
Table 2-2 8 LM 393 Comparator specifications
Figure 2.11 LM393 pin configuration
16
LM393 finds application in limit comparators, simple ADC, time delay generators and square
wave generators among others. The capability of LM393 to interface with low power drain is an
advantage over other types of comparators.
2.1.4 Sensor Selection
When deciding on which sensor to use the following factors should be put into consideration:
[4][8]
Price: This is the most important parameter when selecting any component. The price of the
sensor will ultimately affect the price of the whole system as this is one of the major system
modules. Sensor with the most competitive price should be chosen.
Power: In any electrical system power efficiency is critical. Moisture sensor will low power
consumption should be selected. Sensors which can be battery powered can be used in areas
without electricity connection.
Technology: Technology used to design sensor dictate the sensitivity, cost and durability of the
sensors. Most low cost sensors have poor sensitivity, rust and corrode over time. Resistive or
conductive sensors which are affected by soli salinity thus have a short life.
Shape: Long and slender sensors can be used in many applications than bulky ones.
Durability: Soil moisture sensor which are not affected by soil salinity, corrode or rust should be
selected. Soil moisture sensor probes that measure conductivity or resistance should be avoided,
since they will wear out over time.
Accuracy and Linearity: A quality soil moisture sensor probe should give an output which is
proportional to water content over the full output range. In addition, the soil moisture
sensor probe should have a good output range to reduce sensitivity to noise.
Voltage Range: Choose a sensor that has a big supply voltage range. Powering a sensor with the
wrong voltage will damage the sensor or give inaccurate results.
17
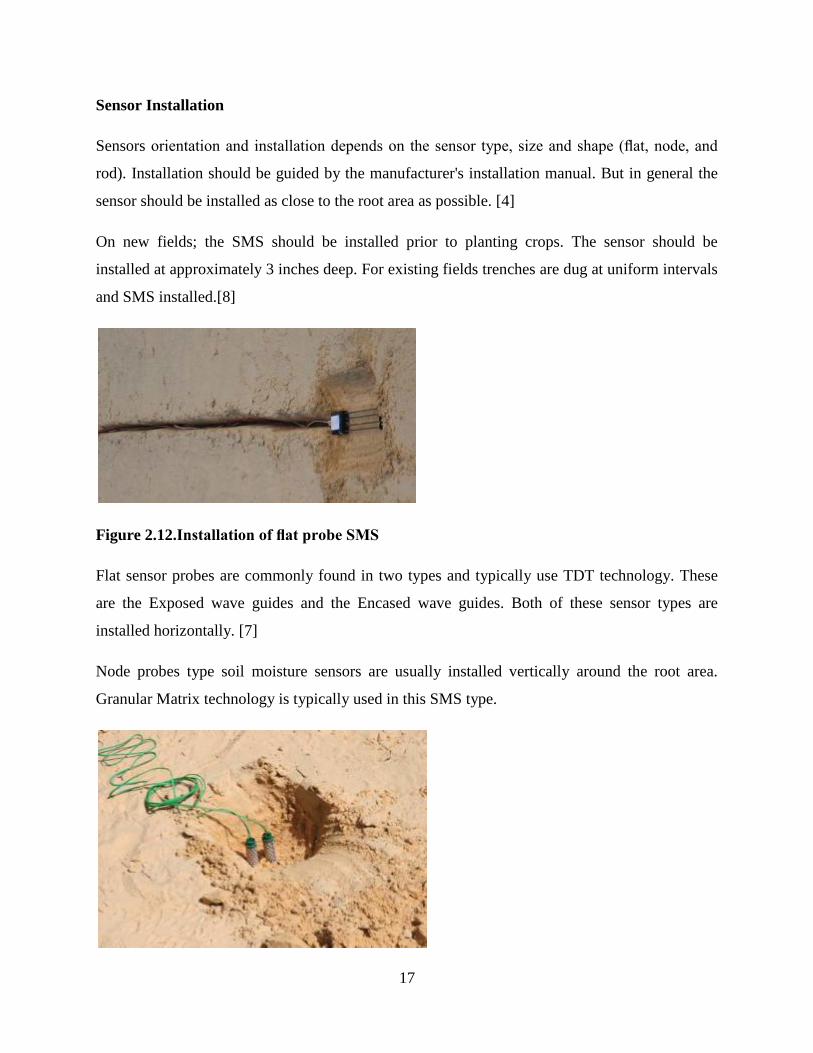
Sensor Installation
Sensors orientation and installation depends on the sensor type, size and shape (flat, node, and
rod). Installation should be guided by the manufacturer's installation manual. But in general the
sensor should be installed as close to the root area as possible. [4]
On new fields; the SMS should be installed prior to planting crops. The sensor should be
installed at approximately 3 inches deep. For existing fields trenches are dug at uniform intervals
and SMS installed.[8]
Figure 2.12.Installation of flat probe SMS
Flat sensor probes are commonly found in two types and typically use TDT technology. These
are the Exposed wave guides and the Encased wave guides. Both of these sensor types are
installed horizontally. [7]
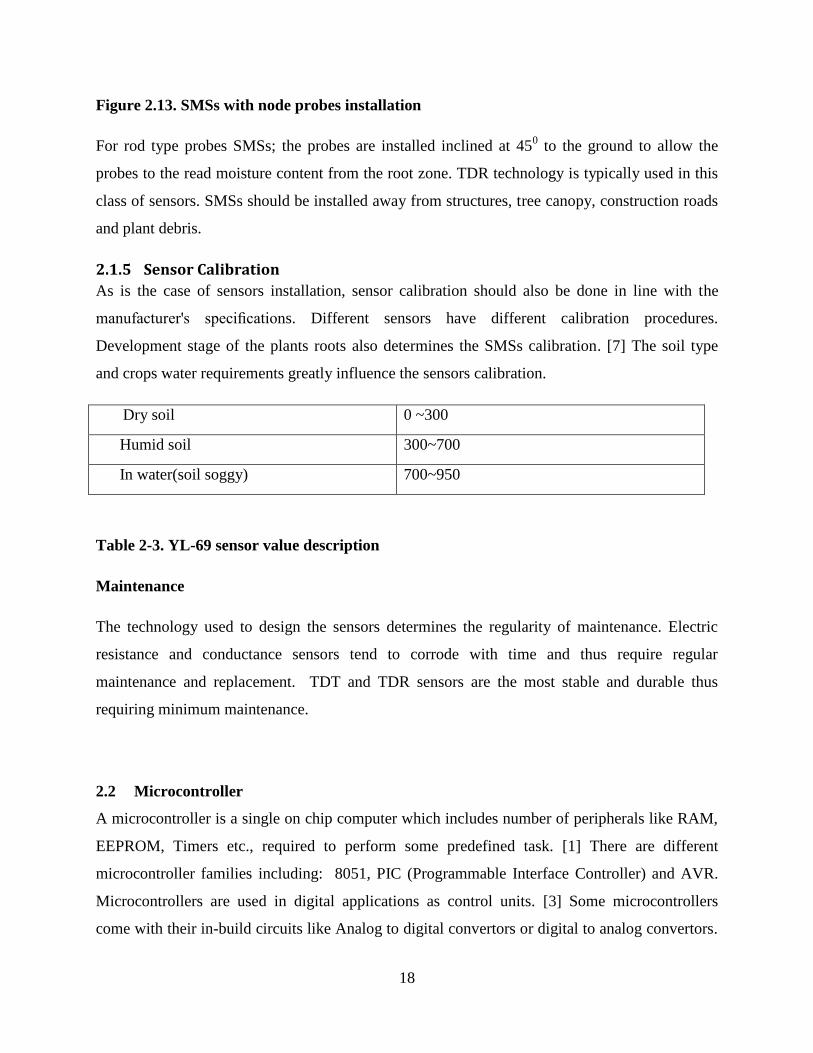
Node probes type soil moisture sensors are usually installed vertically around the root area.
Granular Matrix technology is typically used in this SMS type.
18
Figure 2.13. SMSs with node probes installation
For rod type probes SMSs; the probes are installed inclined at 450 to the ground to allow the
probes to the read moisture content from the root zone. TDR technology is typically used in this
class of sensors. SMSs should be installed away from structures, tree canopy, construction roads
and plant debris.
2.1.5 Sensor Calibration
As is the case of sensors installation, sensor calibration should also be done in line with the
manufacturer's specifications. Different sensors have different calibration procedures.
Development stage of the plants roots also determines the SMSs calibration. [7] The soil type
and crops water requirements greatly influence the sensors calibration.
Dry soil 0 ~300
Humid soil 300~700
In water(soil soggy) 700~950
Table 2-3. YL-69 sensor value description
Maintenance
The technology used to design the sensors determines the regularity of maintenance. Electric
resistance and conductance sensors tend to corrode with time and thus require regular
maintenance and replacement. TDT and TDR sensors are the most stable and durable thus
requiring minimum maintenance.
2.2 Microcontroller
A microcontroller is a single on chip computer which includes number of peripherals like RAM,
EEPROM, Timers etc., required to perform some predefined task. [1] There are different
microcontroller families including: 8051, PIC (Programmable Interface Controller) and AVR.
Microcontrollers are used in digital applications as control units. [3] Some microcontrollers
come with their in-build circuits like Analog to digital convertors or digital to analog convertors.
19
Microcontrollers are mostly programmed using assembly language but in recent years high level
languages like C, C++ PASCAL and java have been used. [5] High level programming of
microcontrollers brings the advantage of not having a different program for each microcontroller
manufacturer. High level programming is also neat, easy to document and maintain and user
friendly.
2.2.1 Types of Microcontrollers
2.2.1.1 8051
These are among the earlier microcontrollers to be fabricated. Due to superiority in technology in
the newer versions, very few companies still fabricate 8051. Earlier types of 8051 have 12 clocks
per instruction whereas the newer versions have 6 clocks per instruction. 8051 microcontroller
does not have an in built memory bus and ADC. First 8051 microcontroller to be fabricated with
Harvard architecture was done in 1980 by Intel. [1]
2.2.1.2 Programmable Interface Controller (PIC)
Programmable Interface Controllers are commonly referred to as PIC. PICs are slightly older
than 8051 microcontrollers. PICs are preferred to 8051 because of their small low pin count
devices. PICs perform better and are affordable than 8051. [3] The Microchip technology
fabricated the single chip microcontroller PIC with Harvard architecture. The only major
downside of PIC is its programming part is very tedious. PICs are hence not recommended for
beginners.
2.2.1.3 AVR:
In 1996, Atmel fabricated this single chip microcontroller with a modified Harvard Architecture.
This chip is loaded with C- compiler and a free IDE. Like PIC, AVR microcontrollers are
difficult for the beginners to work with. AVR microcontroller has on-chip boot-loader thus AVR
can be programmed easily without any external programmer. [3] AVR controllers has number of
I/O ports, timers/counters, interrupts, A/D converters, USART, I2C interfaces, PWM channels,
on-chip analog comparators.[8]
20
2.2.2 Arduino
Arduino is an open-source electronics design platform. The Arduino board is specially designed
for programming and prototyping with Atmel microcontrollers. [5] An arduino interacts with
physical world via sensors. Using arduino; electric equipments can be designed to respond to
change in physical elements like temperature, humidity, heat or even light. [5] This is the
automation process. For example, reading a humidity sensor and turning on and off of an
automatic irrigation system. There several types of arduino boards.
The open-source Arduino environment allows one to write code and load it onto the
Arduino board's memory. The development environment is written in Java and based on
Processing, AVR-GCC, and other open source software. [5] The Arduino programming
language is an implementation of Wiring, a similar physical computing platform, which is
based on the Processing multimedia programming environment. The arduino software is
published as open source tools, available for extension by experienced programmers. The
language can be expanded through C++ libraries, and people wanting to understand the
technical details can make the leap from Arduino to the AVR C programming language on
which it's based. Similarly, AVR-C code can be added directly into the Arduino programs if one
so wishes.[5]
2.2.3 Types of arduino boards
2.2.3.1 Legacy Versions
Arduino legacy versions include Arduino NG, Diecimila, and the Duemilanove. These arduinos
use ATMEGA168 chips. They require manual selection of either USB or battery power.[5] For
Arduino NG one is required to hold the rest button on the board for a few seconds before
uploading a program on to it.
21
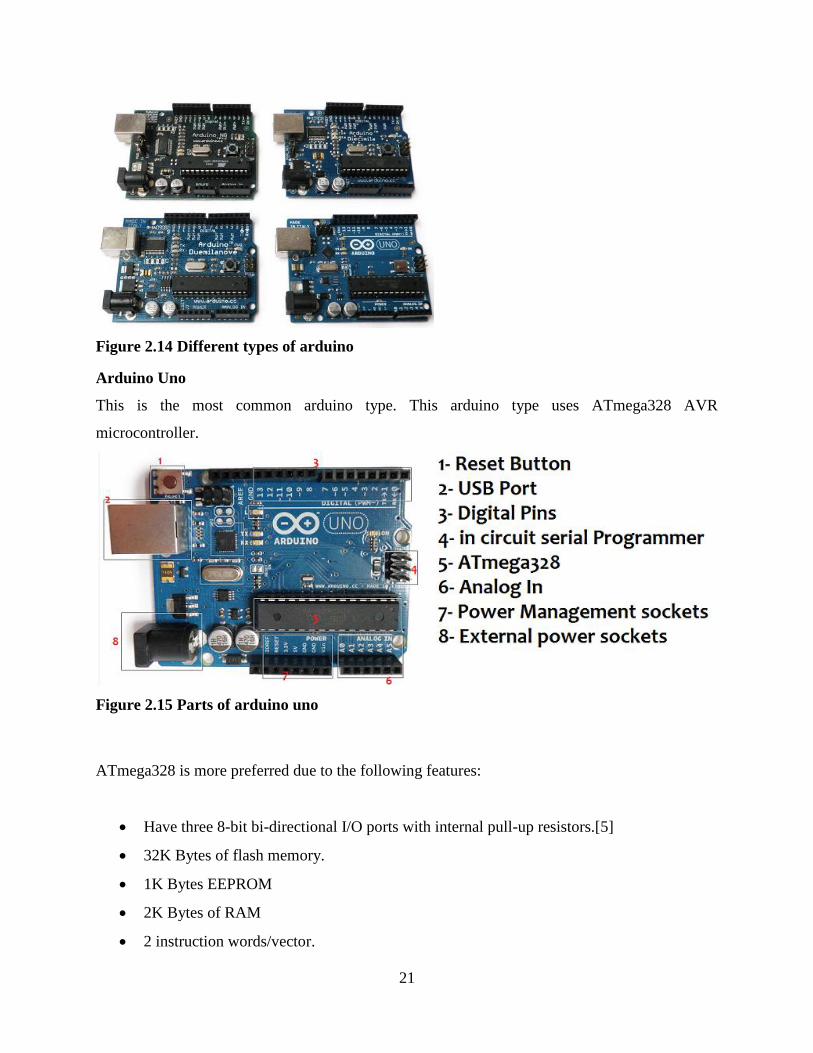
Figure 2.14 Different types of arduino
Arduino Uno
This is the most common arduino type. This arduino type uses ATmega328 AVR
microcontroller.
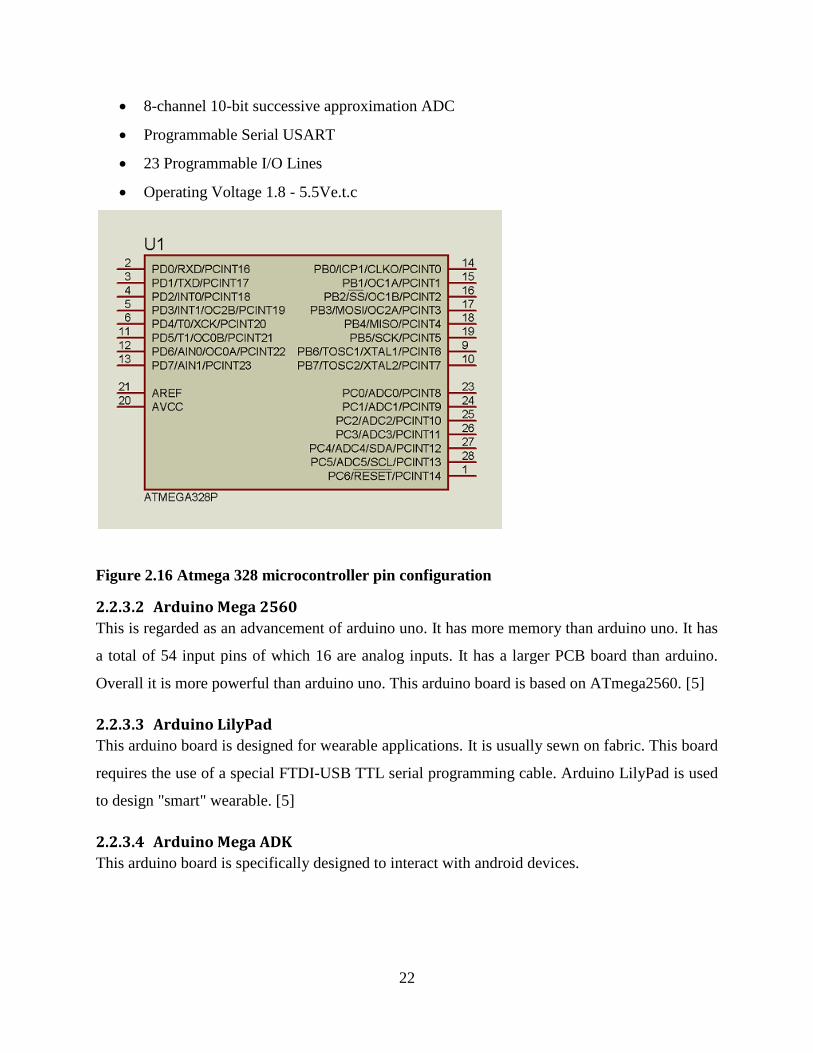
Figure 2.15 Parts of arduino uno
ATmega328 is more preferred due to the following features:
Have three 8-bit bi-directional I/O ports with internal pull-up resistors.[5]
32K Bytes of flash memory.
1K Bytes EEPROM
2K Bytes of RAM
2 instruction words/vector.
22
8-channel 10-bit successive approximation ADC
Programmable Serial USART
23 Programmable I/O Lines
Operating Voltage 1.8 - 5.5Ve.t.c
Figure 2.16 Atmega 328 microcontroller pin configuration
2.2.3.2 Arduino Mega 2560
This is regarded as an advancement of arduino uno. It has more memory than arduino uno. It has
a total of 54 input pins of which 16 are analog inputs. It has a larger PCB board than arduino.
Overall it is more powerful than arduino uno. This arduino board is based on ATmega2560. [5]
2.2.3.3 Arduino LilyPad
This arduino board is designed for wearable applications. It is usually sewn on fabric. This board
requires the use of a special FTDI-USB TTL serial programming cable. Arduino LilyPad is used
to design "smart" wearable. [5]
2.2.3.4 Arduino Mega ADK
This arduino board is specifically designed to interact with android devices.
23
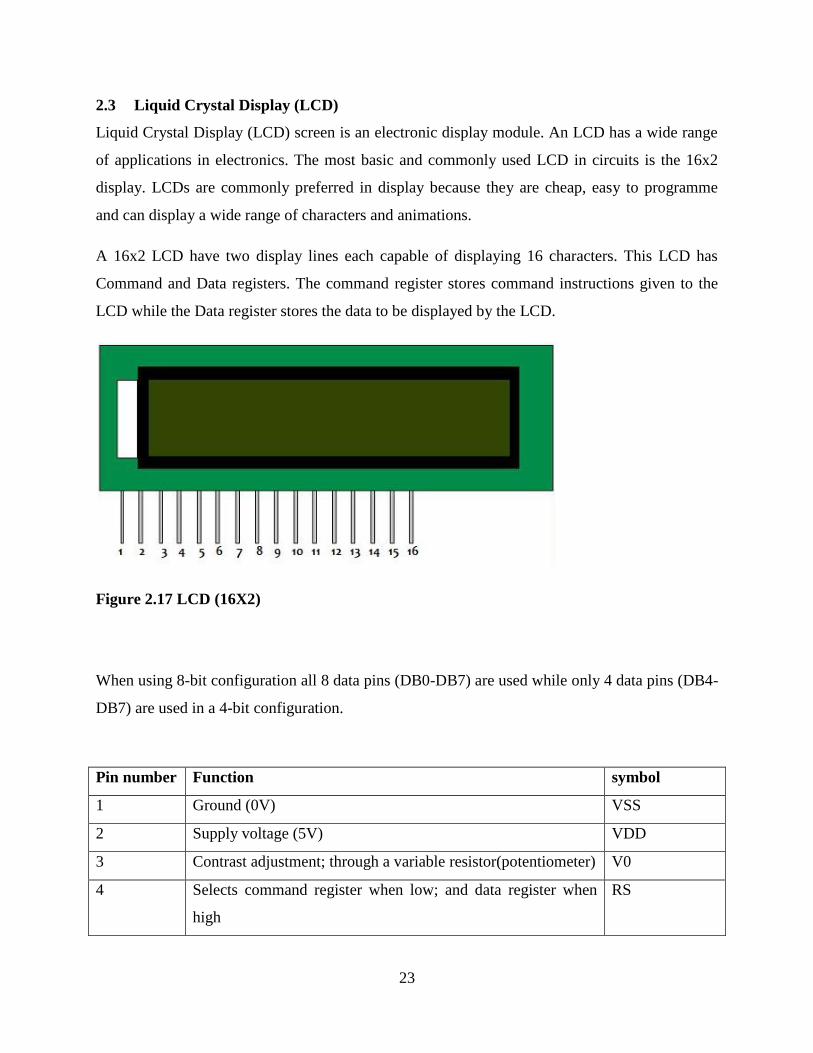
2.3 Liquid Crystal Display (LCD)
Liquid Crystal Display (LCD) screen is an electronic display module. An LCD has a wide range
of applications in electronics. The most basic and commonly used LCD in circuits is the 16x2
display. LCDs are commonly preferred in display because they are cheap, easy to programme
and can display a wide range of characters and animations.
A 16x2 LCD have two display lines each capable of displaying 16 characters. This LCD has
Command and Data registers. The command register stores command instructions given to the
LCD while the Data register stores the data to be displayed by the LCD.
Figure 2.17 LCD (16X2)
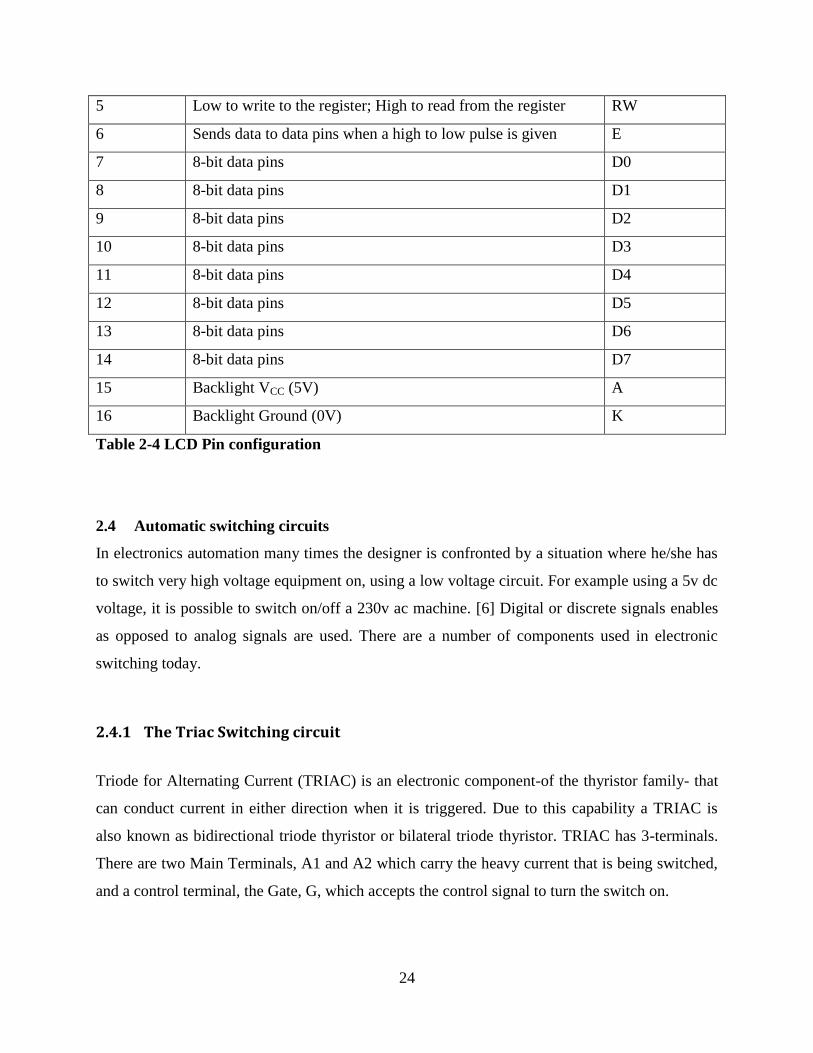
When using 8-bit configuration all 8 data pins (DB0-DB7) are used while only 4 data pins (DB4-
DB7) are used in a 4-bit configuration.
Pin number Function symbol
1 Ground (0V) VSS
2 Supply voltage (5V) VDD
3 Contrast adjustment; through a variable resistor(potentiometer) V0
4 Selects command register when low; and data register when
high
RS
24
5 Low to write to the register; High to read from the register RW
6 Sends data to data pins when a high to low pulse is given E
7 8-bit data pins D0
8 8-bit data pins D1
9 8-bit data pins D2
10 8-bit data pins D3
11 8-bit data pins D4
12 8-bit data pins D5
13 8-bit data pins D6
14 8-bit data pins D7
15 Backlight VCC (5V) A
16 Backlight Ground (0V) K
Table 2-4 LCD Pin configuration
2.4 Automatic switching circuits
In electronics automation many times the designer is confronted by a situation where he/she has
to switch very high voltage equipment on, using a low voltage circuit. For example using a 5v dc
voltage, it is possible to switch on/off a 230v ac machine. [6] Digital or discrete signals enables
as opposed to analog signals are used. There are a number of components used in electronic
switching today.
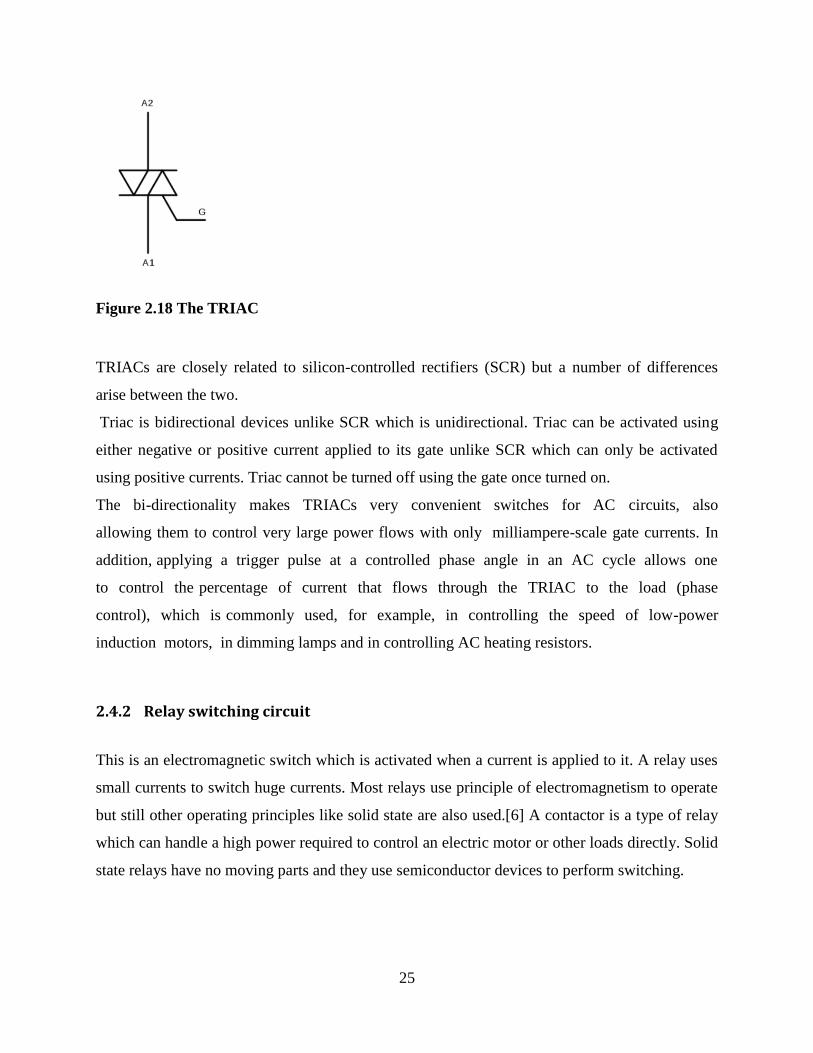
2.4.1 The Triac Switching circuit
Triode for Alternating Current (TRIAC) is an electronic component-of the thyristor family- that
can conduct current in either direction when it is triggered. Due to this capability a TRIAC is
also known as bidirectional triode thyristor or bilateral triode thyristor. TRIAC has 3-terminals.
There are two Main Terminals, A1 and A2 which carry the heavy current that is being switched,
and a control terminal, the Gate, G, which accepts the control signal to turn the switch on.
25
Figure 2.18 The TRIAC
TRIACs are closely related to silicon-controlled rectifiers (SCR) but a number of differences
arise between the two.
Triac is bidirectional devices unlike SCR which is unidirectional. Triac can be activated using
either negative or positive current applied to its gate unlike SCR which can only be activated
using positive currents. Triac cannot be turned off using the gate once turned on.
The bi-directionality makes TRIACs very convenient switches for AC circuits, also
allowing them to control very large power flows with only milliampere-scale gate currents. In
addition, applying a trigger pulse at a controlled phase angle in an AC cycle allows one
to control the percentage of current that flows through the TRIAC to the load (phase
control), which is commonly used, for example, in controlling the speed of low-power
induction motors, in dimming lamps and in controlling AC heating resistors.
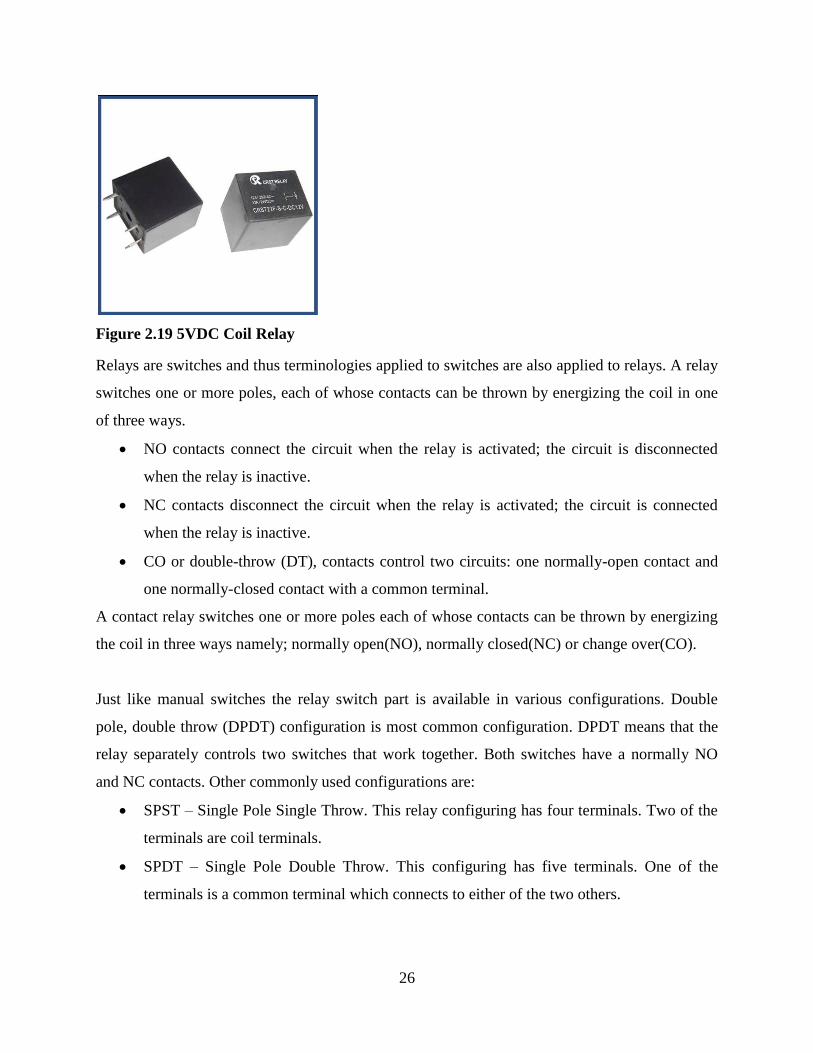
2.4.2 Relay switching circuit
This is an electromagnetic switch which is activated when a current is applied to it. A relay uses
small currents to switch huge currents. Most relays use principle of electromagnetism to operate
but still other operating principles like solid state are also used.[6] A contactor is a type of relay
which can handle a high power required to control an electric motor or other loads directly. Solid
state relays have no moving parts and they use semiconductor devices to perform switching.
26
Figure 2.19 5VDC Coil Relay
Relays are switches and thus terminologies applied to switches are also applied to relays. A relay
switches one or more poles, each of whose contacts can be thrown by energizing the coil in one
of three ways.
NO contacts connect the circuit when the relay is activated; the circuit is disconnected
when the relay is inactive.
NC contacts disconnect the circuit when the relay is activated; the circuit is connected
when the relay is inactive.
CO or double-throw (DT), contacts control two circuits: one normally-open contact and
one normally-closed contact with a common terminal.
A contact relay switches one or more poles each of whose contacts can be thrown by energizing
the coil in three ways namely; normally open(NO), normally closed(NC) or change over(CO).
Just like manual switches the relay switch part is available in various configurations. Double
pole, double throw (DPDT) configuration is most common configuration. DPDT means that the
relay separately controls two switches that work together. Both switches have a normally NO
and NC contacts. Other commonly used configurations are:
SPST – Single Pole Single Throw. This relay configuring has four terminals. Two of the
terminals are coil terminals.
SPDT – Single Pole Double Throw. This configuring has five terminals. One of the
terminals is a common terminal which connects to either of the two others.
27
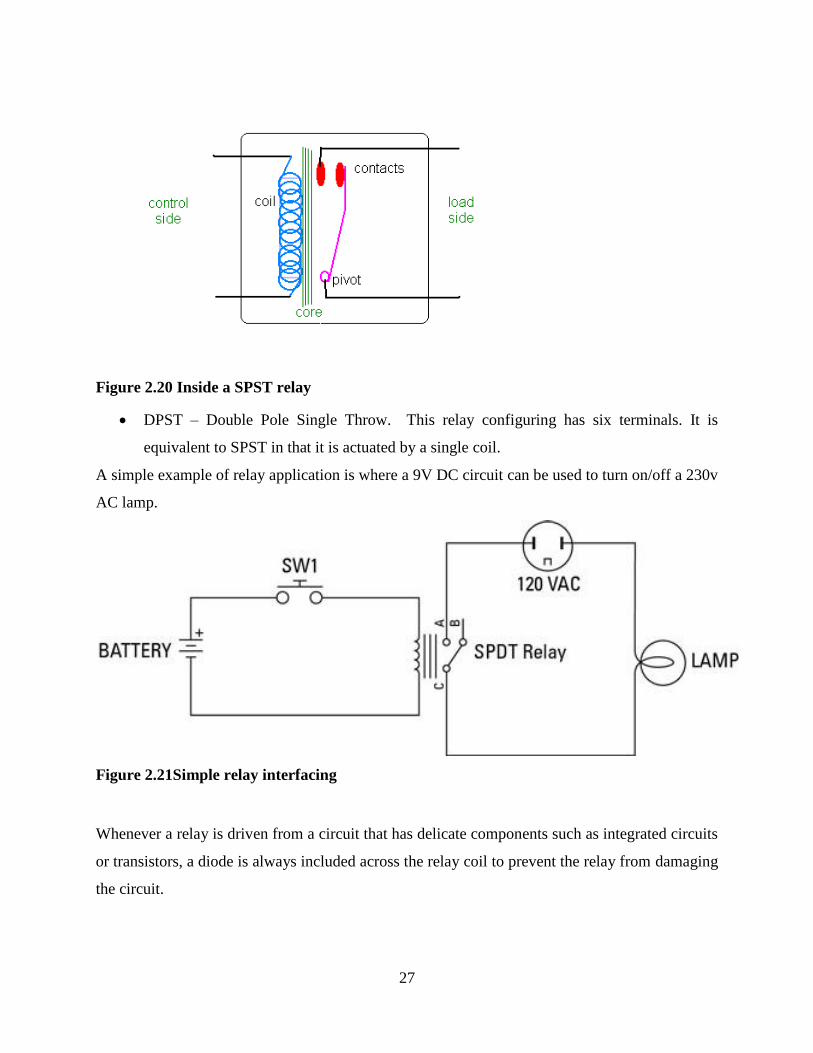
Figure 2.20 Inside a SPST relay
DPST – Double Pole Single Throw. This relay configuring has six terminals. It is
equivalent to SPST in that it is actuated by a single coil.
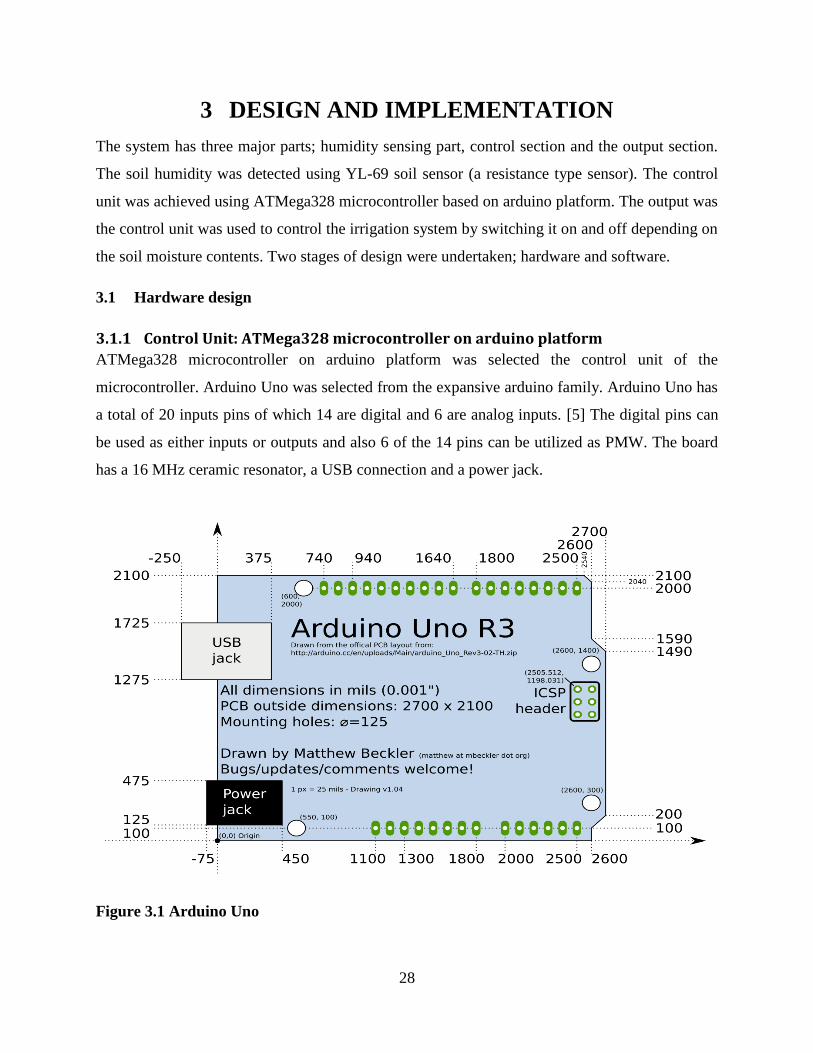
A simple example of relay application is where a 9V DC circuit can be used to turn on/off a 230v
AC lamp.
Figure 2.21Simple relay interfacing
Whenever a relay is driven from a circuit that has delicate components such as integrated circuits
or transistors, a diode is always included across the relay coil to prevent the relay from damaging
the circuit.
28
3 DESIGN AND IMPLEMENTATION
The system has three major parts; humidity sensing part, control section and the output section.
The soil humidity was detected using YL-69 soil sensor (a resistance type sensor). The control
unit was achieved using ATMega328 microcontroller based on arduino platform. The output was
the control unit was used to control the irrigation system by switching it on and off depending on
the soil moisture contents. Two stages of design were undertaken; hardware and software.
3.1 Hardware design
3.1.1 Control Unit: ATMega328 microcontroller on arduino platform
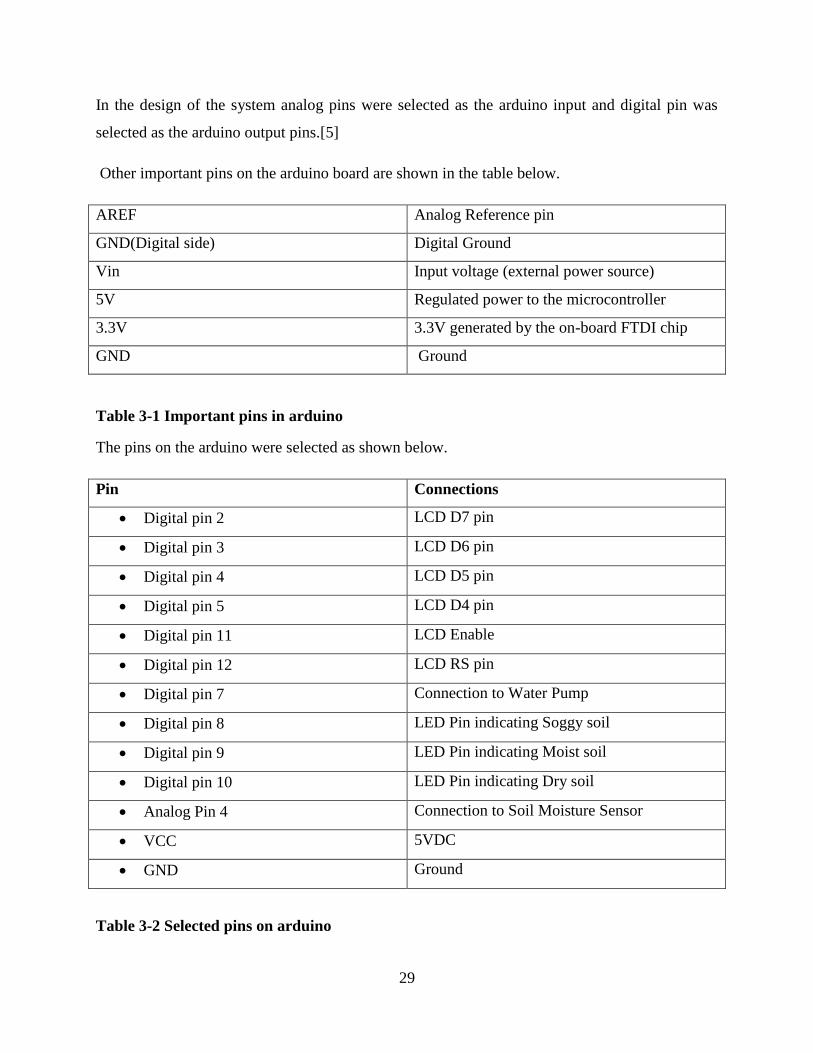
ATMega328 microcontroller on arduino platform was selected the control unit of the
microcontroller. Arduino Uno was selected from the expansive arduino family. Arduino Uno has
a total of 20 inputs pins of which 14 are digital and 6 are analog inputs. [5] The digital pins can
be used as either inputs or outputs and also 6 of the 14 pins can be utilized as PMW. The board
has a 16 MHz ceramic resonator, a USB connection and a power jack.
Figure 3.1 Arduino Uno
29
In the design of the system analog pins were selected as the arduino input and digital pin was
selected as the arduino output pins.[5]
Other important pins on the arduino board are shown in the table below.
AREF Analog Reference pin
GND(Digital side) Digital Ground
Vin Input voltage (external power source)
5V Regulated power to the microcontroller
3.3V 3.3V generated by the on-board FTDI chip
GND Ground
Table 3-1 Important pins in arduino
The pins on the arduino were selected as shown below.
Pin Connections
Digital pin 2 LCD D7 pin
Digital pin 3 LCD D6 pin
Digital pin 4 LCD D5 pin
Digital pin 5 LCD D4 pin
Digital pin 11 LCD Enable
Digital pin 12 LCD RS pin
Digital pin 7 Connection to Water Pump
Digital pin 8 LED Pin indicating Soggy soil
Digital pin 9 LED Pin indicating Moist soil
Digital pin 10 LED Pin indicating Dry soil
Analog Pin 4 Connection to Soil Moisture Sensor
VCC 5VDC
GND Ground
Table 3-2 Selected pins on arduino
30
3.1.2 Sensing Unit:
3.1.3 YL-69 soil moisture sensor connection to arduino
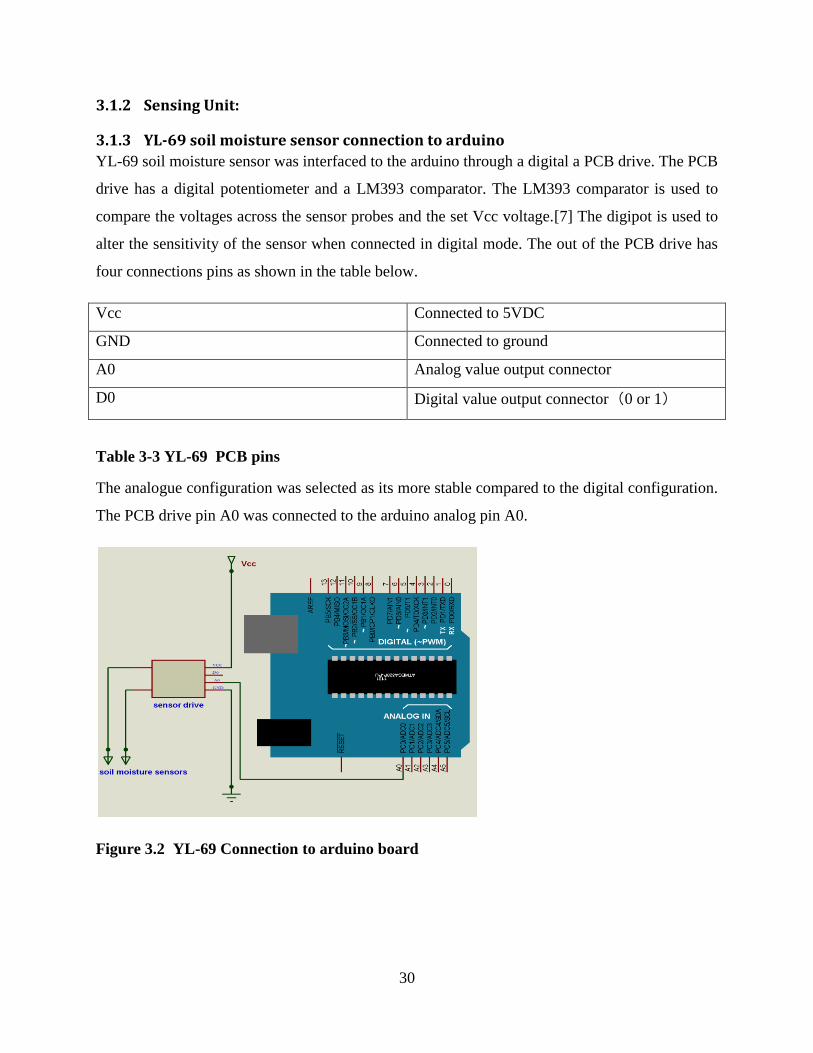
YL-69 soil moisture sensor was interfaced to the arduino through a digital a PCB drive. The PCB
drive has a digital potentiometer and a LM393 comparator. The LM393 comparator is used to
compare the voltages across the sensor probes and the set Vcc voltage.[7] The digipot is used to
alter the sensitivity of the sensor when connected in digital mode. The out of the PCB drive has
four connections pins as shown in the table below.
Vcc Connected to 5VDC
GND Connected to ground
A0 Analog value output connector
D0 Digital value output connector(0 or 1)
Table 3-3 YL-69 PCB pins
The analogue configuration was selected as its more stable compared to the digital configuration.
The PCB drive pin A0 was connected to the arduino analog pin A0.
Figure 3.2 YL-69 Connection to arduino board
31
The output of the sensor to the arduino analog pin A0 was resistance. The resistance to flow of
current between the sensor probes changes with soil moisture level and soil type. The current
passing through the sensor probes (Iout) for different soils and different soil moisture levels was
calculated as shown below:
Iout = Vcc / Soil Resistance value (RS)
Equation 3-1 YL-69 Current calculation
3.1.4 Output Units
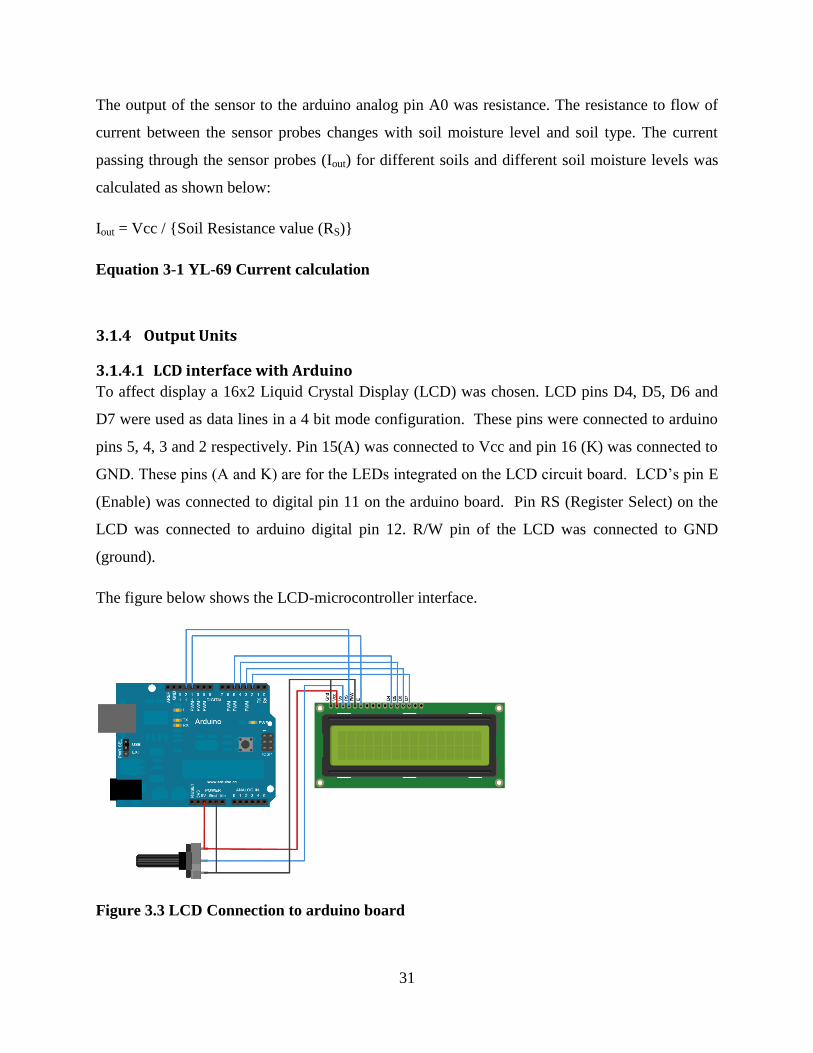
3.1.4.1 LCD interface with Arduino
To affect display a 16x2 Liquid Crystal Display (LCD) was chosen. LCD pins D4, D5, D6 and
D7 were used as data lines in a 4 bit mode configuration. These pins were connected to arduino
pins 5, 4, 3 and 2 respectively. Pin 15(A) was connected to Vcc and pin 16 (K) was connected to
GND. These pins (A and K) are for the LEDs integrated on the LCD circuit board. LCD’s pin E
(Enable) was connected to digital pin 11 on the arduino board. Pin RS (Register Select) on the
LCD was connected to arduino digital pin 12. R/W pin of the LCD was connected to GND
(ground).
The figure below shows the LCD-microcontroller interface.
Figure 3.3 LCD Connection to arduino board
32
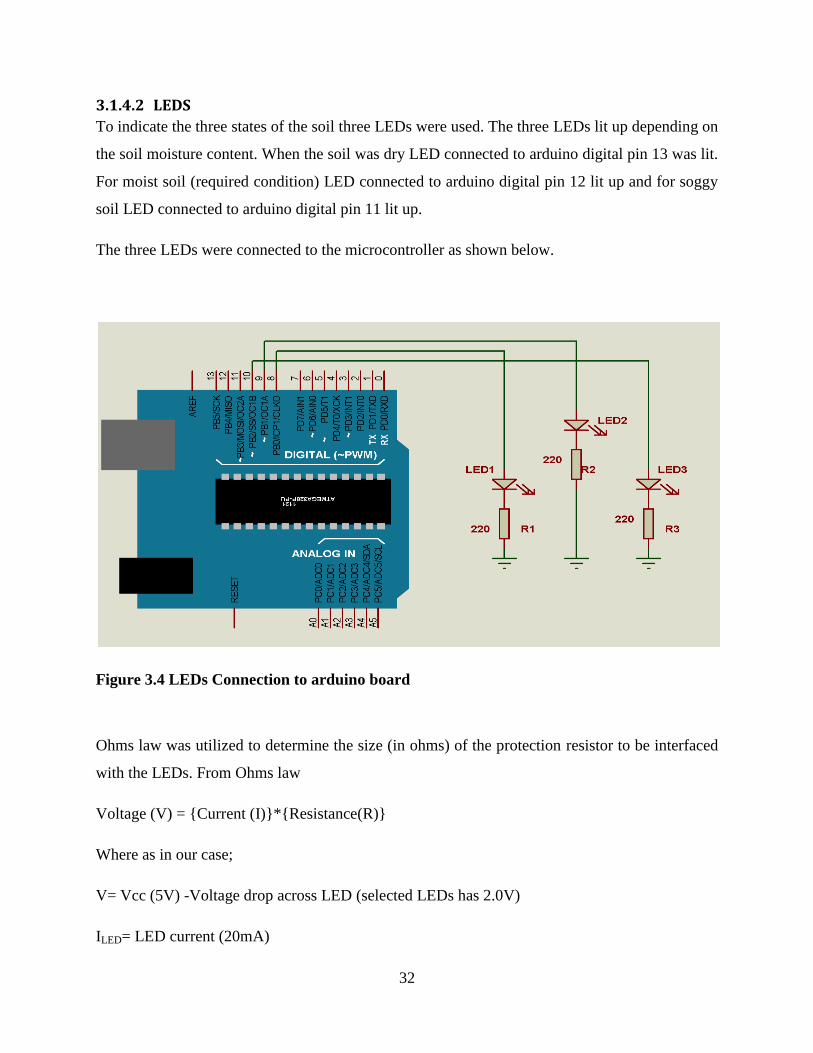
3.1.4.2 LEDS
To indicate the three states of the soil three LEDs were used. The three LEDs lit up depending on
the soil moisture content. When the soil was dry LED connected to arduino digital pin 13 was lit.
For moist soil (required condition) LED connected to arduino digital pin 12 lit up and for soggy
soil LED connected to arduino digital pin 11 lit up.
The three LEDs were connected to the microcontroller as shown below.
Figure 3.4 LEDs Connection to arduino board
Ohms law was utilized to determine the size (in ohms) of the protection resistor to be interfaced
with the LEDs. From Ohms law
Voltage (V) = Current (I)*Resistance(R)
Where as in our case;
V= Vcc (5V) -Voltage drop across LED (selected LEDs has 2.0V)
ILED= LED current (20mA)
33
VLED = LED Voltage drop (red in colour) (2V)
R= minimum required resistance value
Therefore
Rmin = (5-2) V/ 20mA =150 Ω
To achieve current limitation a resistance value higher than the calculated Rmin was selected. A
220Ω resistor was used and thus only 13.6mA current was allowed to pass through each of the
three LEDs.
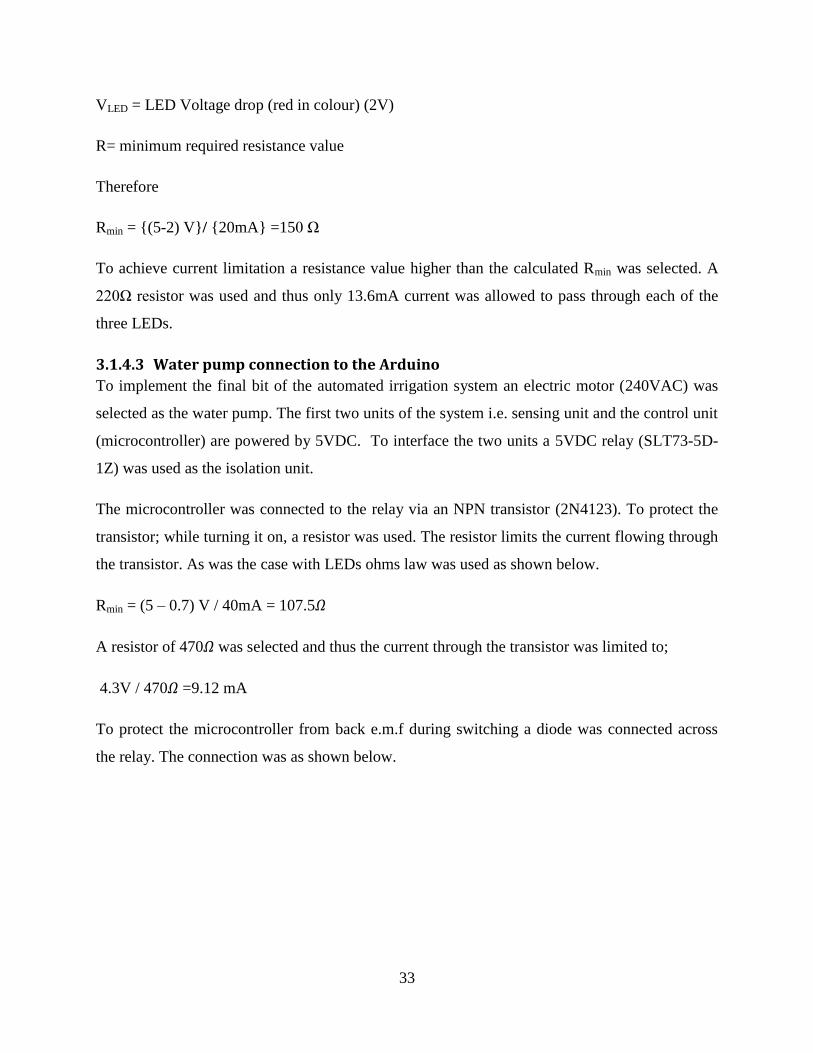
3.1.4.3 Water pump connection to the Arduino
To implement the final bit of the automated irrigation system an electric motor (240VAC) was
selected as the water pump. The first two units of the system i.e. sensing unit and the control unit
(microcontroller) are powered by 5VDC. To interface the two units a 5VDC relay (SLT73-5D-
1Z) was used as the isolation unit.
The microcontroller was connected to the relay via an NPN transistor (2N4123). To protect the
transistor; while turning it on, a resistor was used. The resistor limits the current flowing through
the transistor. As was the case with LEDs ohms law was used as shown below.
Rmin = (5 – 0.7) V / 40mA = 107.5𝛺
A resistor of 470𝛺 was selected and thus the current through the transistor was limited to;
4.3V / 470𝛺 =9.12 mA
To protect the microcontroller from back e.m.f during switching a diode was connected across
the relay. The connection was as shown below.
34
Figure 3.5 Relay interfacing of arduino to the 240VAC pump
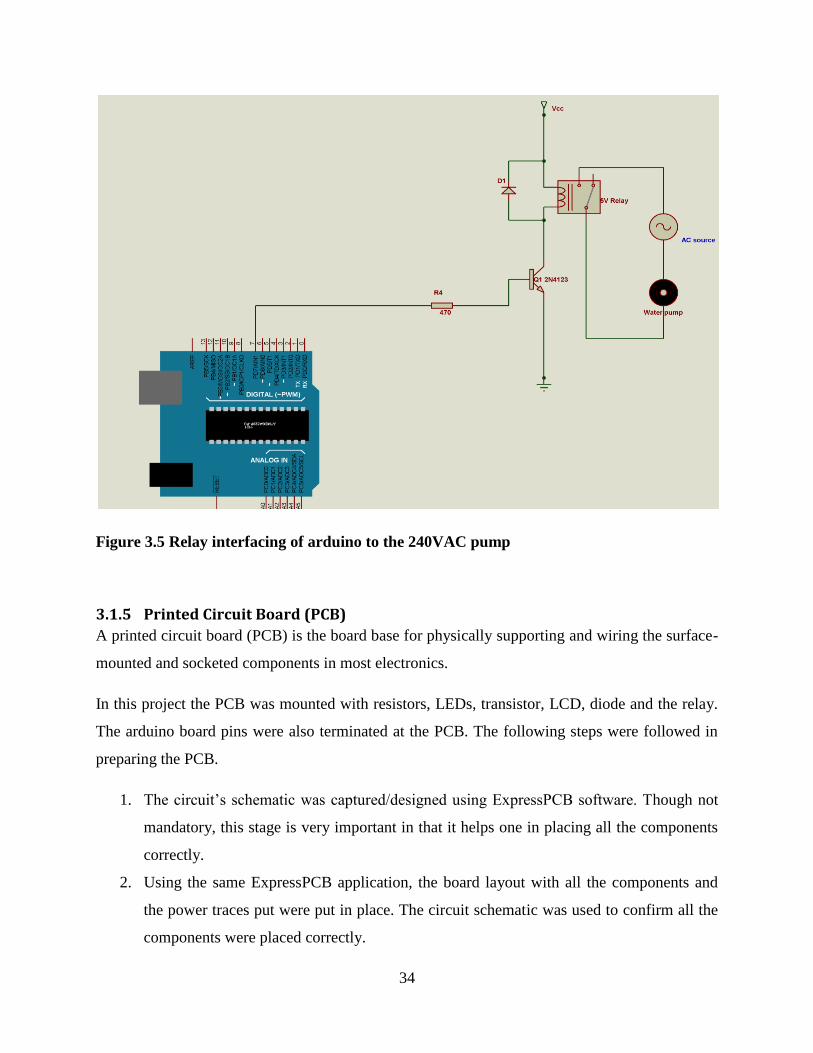
3.1.5 Printed Circuit Board (PCB)
A printed circuit board (PCB) is the board base for physically supporting and wiring the surface-
mounted and socketed components in most electronics.
In this project the PCB was mounted with resistors, LEDs, transistor, LCD, diode and the relay.
The arduino board pins were also terminated at the PCB. The following steps were followed in
preparing the PCB.
1. The circuit’s schematic was captured/designed using ExpressPCB software. Though not
mandatory, this stage is very important in that it helps one in placing all the components
correctly.
2. Using the same ExpressPCB application, the board layout with all the components and
the power traces put were put in place. The circuit schematic was used to confirm all the
components were placed correctly.
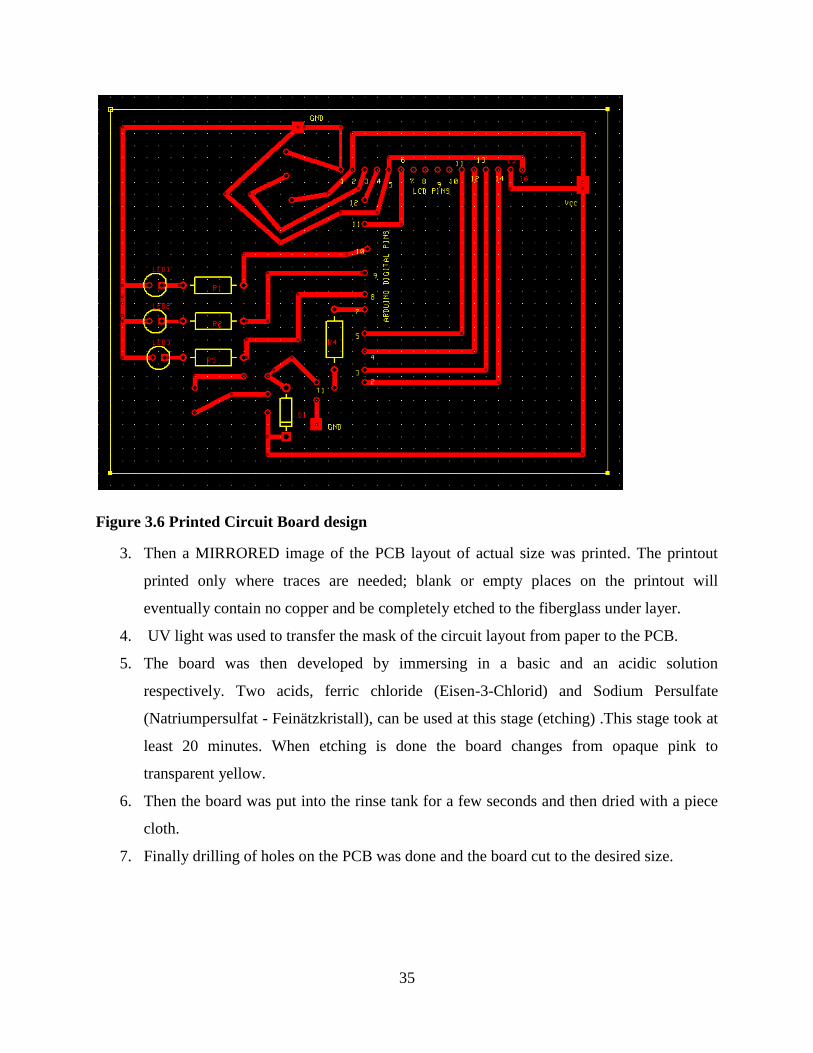
35
Figure 3.6 Printed Circuit Board design
3. Then a MIRRORED image of the PCB layout of actual size was printed. The printout
printed only where traces are needed; blank or empty places on the printout will
eventually contain no copper and be completely etched to the fiberglass under layer.
4. UV light was used to transfer the mask of the circuit layout from paper to the PCB.
5. The board was then developed by immersing in a basic and an acidic solution
respectively. Two acids, ferric chloride (Eisen-3-Chlorid) and Sodium Persulfate
(Natriumpersulfat - Feinätzkristall), can be used at this stage (etching) .This stage took at
least 20 minutes. When etching is done the board changes from opaque pink to
transparent yellow.
6. Then the board was put into the rinse tank for a few seconds and then dried with a piece
cloth.
7. Finally drilling of holes on the PCB was done and the board cut to the desired size.

36
Figure 3.7 Circuit with all the components and parts
3.2 Software design
To be able to interpret the different states of the soil as prompted by the soil sensor the
microcontroller was programmed. The arduino integrated development environment (IDE) was
used. The idea is based on C++ and thus can be extended using C++ libraries. Arduino programs
(sketches) are cross platform, Simple, clear and at the same time flexible for advanced
programmers.
The project sketch is attached at the appendices page.
37
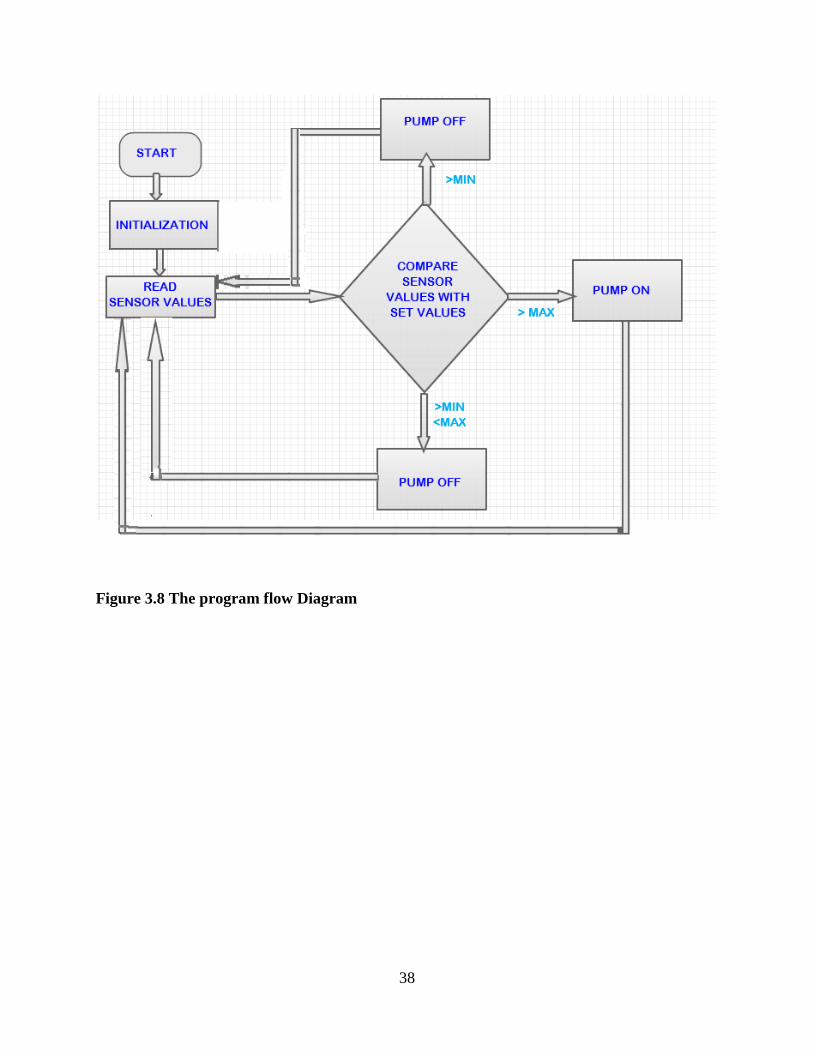
3.2.1 Program Pseudo code
READ sensorvalue
COMPARE sensorvalue with set threshold
IF sensorvalue > maximum set value
TURN-ON pump
DISPLAY soil condition on LCD
LIGHT dry soil LED
ELSE IF sensorvalue < maximum set value > minimum set value
TURN-OFF pump
DISPLAY soil condition on LCD
LIGHT moist soil LED
ELSE IF sensorvalue < minimum set value
TURN-OFF pump
DISPLAY soil condition on LCD
LIGHT soggy soil LED
38
Figure 3.8 The program flow Diagram
39
4 RESULTS ANALYSIS AND DISCUSSIONS
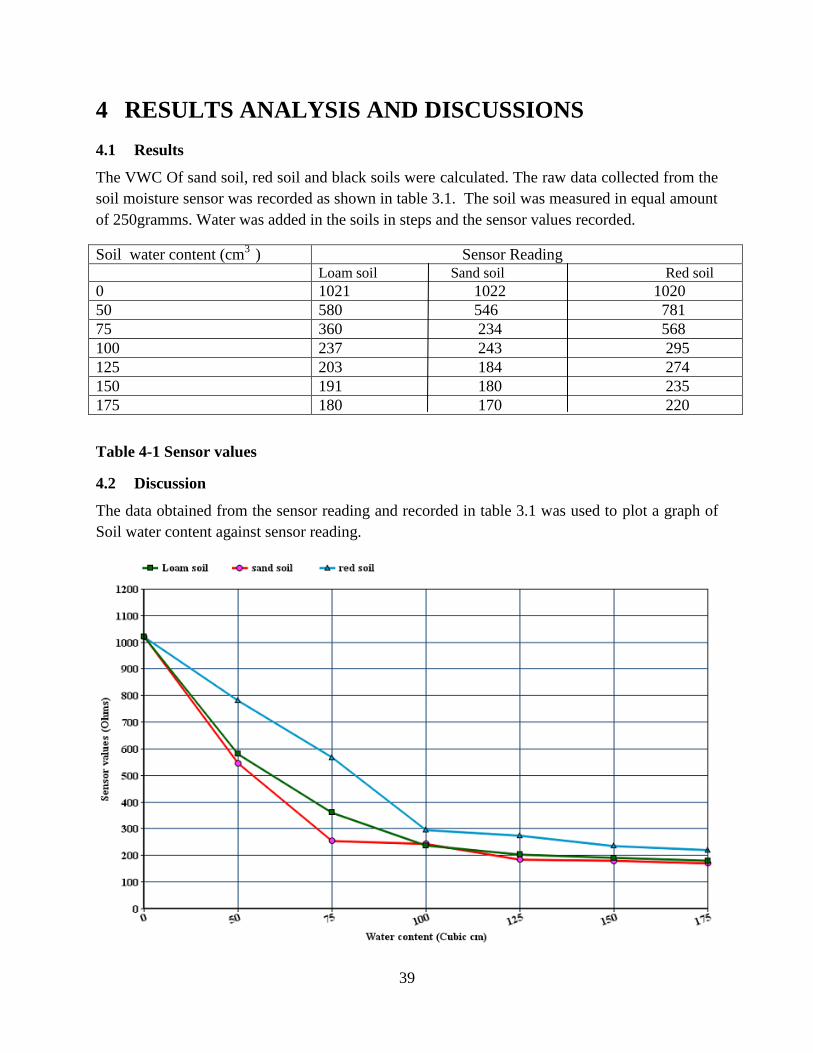
4.1 Results
The VWC Of sand soil, red soil and black soils were calculated. The raw data collected from the
soil moisture sensor was recorded as shown in table 3.1. The soil was measured in equal amount
of 250gramms. Water was added in the soils in steps and the sensor values recorded.
Soil water content (cm3
) Sensor Reading Loam soil Sand soil Red soil
0 1021 1022 1020
50 580 546 781
75 360 234 568
100 237 243 295
125 203 184 274
150 191 180 235
175 180 170 220
Table 4-1 Sensor values
4.2 Discussion
The data obtained from the sensor reading and recorded in table 3.1 was used to plot a graph of
Soil water content against sensor reading.
40
Graph 3.1
The SMS (YL-69) used is a resistance sensor type. Its output is the resistance in the soil between
the two SMS probes. The obtained graph is an exponential one. The value of the soil resistance
decreases with increase in water content to a certain point.
To come up with the results the three soils were dried using a frying pan until all the moisture
content was lost. 250 grams was measured for the red soil, black soil and the sand soil. Water
was added in steps of 25cm3 and sensor value recorded.
The value of soil sensor at dry soil was almost equal for the three soils at 1021, 1022, 1020 for
black soil, sand soil and red soil respectively. On adding 50cm3
the resistance value reduced
drastically to the range of 500. On adding more water the resistance value kept reducing. At
around 100cm3 of water the reduction on the soil resistance stated reducing at a much lower rate.
This is because at this point the soil is now becoming saturated with water and thus adding more
water has a small effect on the soil resistance.
The sensor was calibrated and three states defined. The states are soggy, moist and dry. When
the dry state was achieved the control unit (micro controller) switched the water pump on via a
relay circuit. The three states were indicated using three different LEDs and an LCD. The LCD
also indicated when the pump was running.
The control circuit and the sensor circuit were powered using a 9V alkaline battery which was
connected via a voltage regulator with an output of 5V.
41
5 CONCLUSION AND RECOMMENDATIONS
5.1 CONCLUSION
A system to monitor moisture levels in the soil was designed. The system was used to switch
on/off the watering system/pump according to set soil moisture levels. The control unit the
prototype was implemented using a microcontroller on arduino platform while the sensing bit
was implemented using a SMS YL-69.
Three LEDs and an LCD were used to implement the display of the three soil states i.e. soggy
soil, moist soil and the dry soil states. To switch between the control and the irrigation systems a
relay switching circuit was used.
5.2 RECOMMENDATIONS
To improve on the effectiveness and efficiency of the system the following recommendations
can be put into considerations:
Cost effective techniques to overcome the limitation of requiring a soil specific
calibration should be employed.
Integrating GSM technology can be used, such that whenever the water pump switches
ON/OFF, an SMS is sent to the concerned person regarding the status of the pump.
The pump should also be controlled via SMS.
The system can be integrated with temperature and humidity sensors to monitor the
weather conditions in the farm.
42
REFERENCES
[1] Massimo Banzi, Getting started with Arduino, Second Edition, O’Reilly Media, Inc, 2011
[2] Francis Z. Karina and Alex Wambua Mwaniki, irrigation agriculture in Kenya, Nairobi,
Kenya, 2011
[3] Allan Trevennor, Practical AVR Microcontrollers, New York , USA, Springer Science +
Business Media, 2012
[4] Clemmens, A.J. Feedback Control for Surface Irrigation Management, ASAE
Publication 04 -90, 1990.
[5] www.arduino.cc Accessed on 6th
Dec,2013 , 25th
Dec,2013 and 17th
Jan,2014
[6] Songle relay Datasheet
[7] Soil moisture sensor datasheet
[8] W. C. Dunn, Introduction to Instrumentation Sensors, and Process Control, British Library
Cataloguing, 2005
[9] General Purpose Transistors NPN Silicon (KSP2222A) datasheet
[10] http://www.vision2030.go.ke/ accessed on 12th
January 2014
43
6 APPENDIX
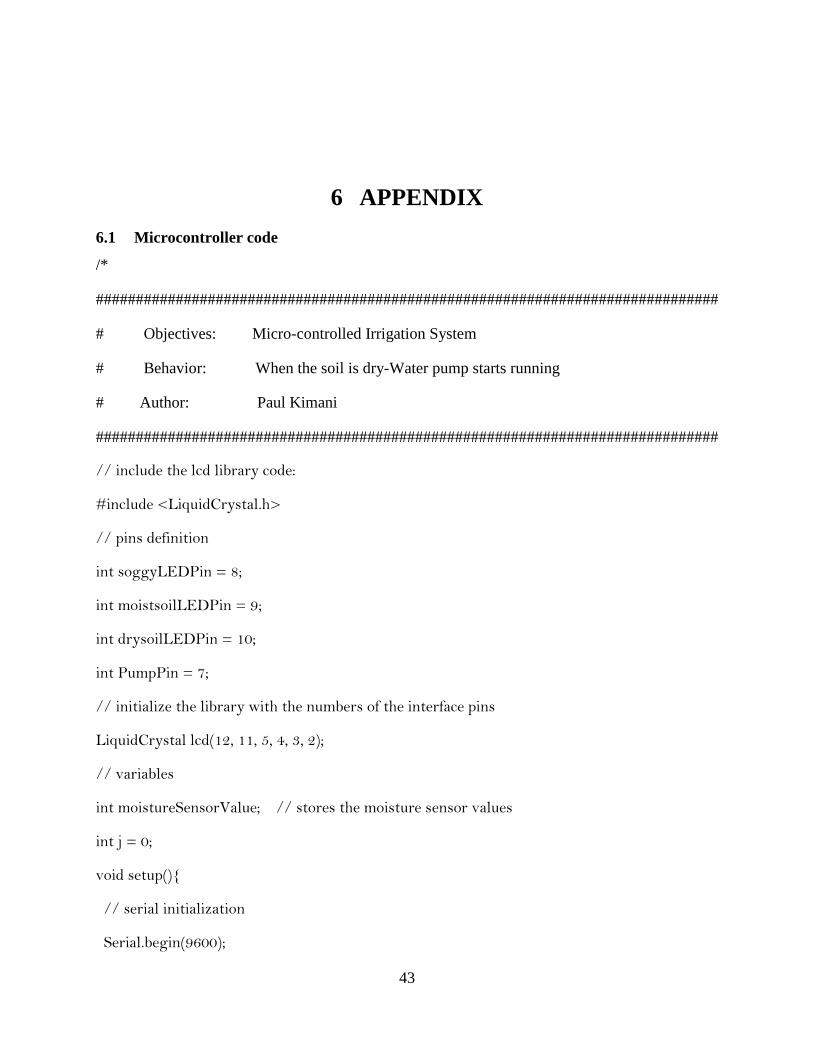
6.1 Microcontroller code
/*
##############################################################################
# Objectives: Micro-controlled Irrigation System
# Behavior: When the soil is dry-Water pump starts running
# Author: Paul Kimani
##############################################################################
// include the lcd library code:
#include <LiquidCrystal.h>
// pins definition
int soggyLEDPin = 8;
int moistsoilLEDPin = 9;
int drysoilLEDPin = 10;
int PumpPin = 7;
// initialize the library with the numbers of the interface pins
LiquidCrystal lcd(12, 11, 5, 4, 3, 2);
// variables
int moistureSensorValue; // stores the moisture sensor values
int j = 0;
void setup()
// serial initialization
Serial.begin(9600);
44
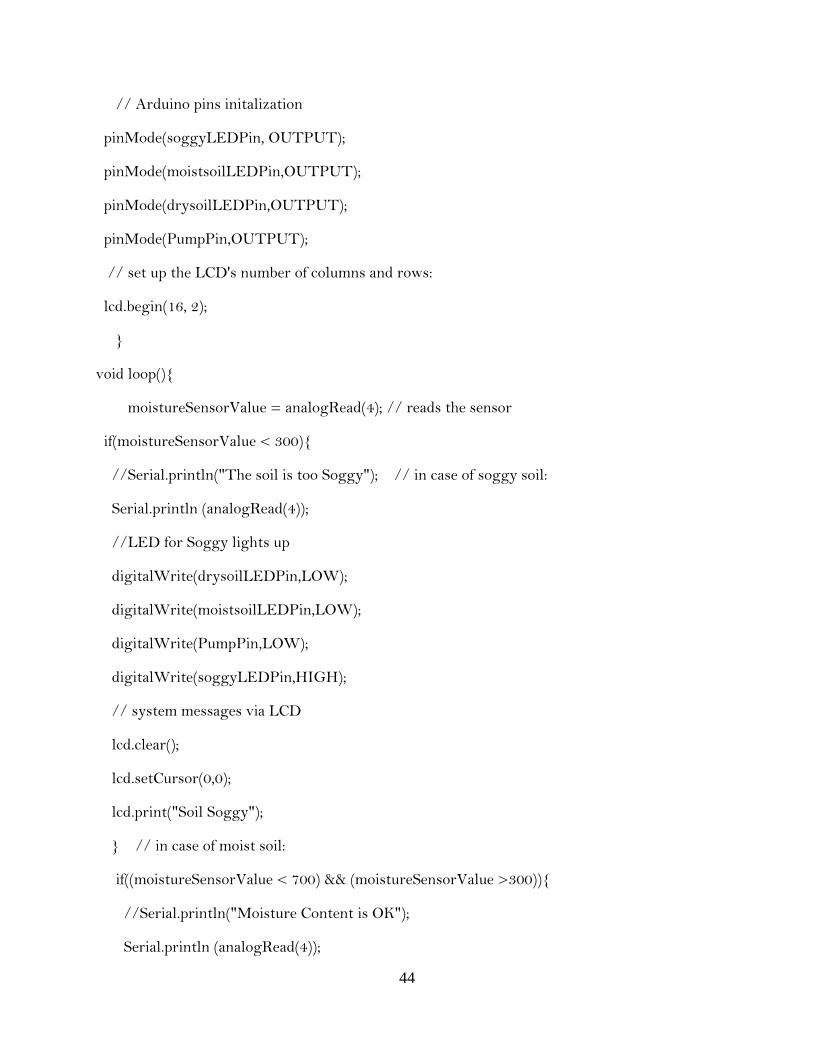
// Arduino pins initalization
pinMode(soggyLEDPin, OUTPUT);
pinMode(moistsoilLEDPin,OUTPUT);
pinMode(drysoilLEDPin,OUTPUT);
pinMode(PumpPin,OUTPUT);
// set up the LCD's number of columns and rows:
lcd.begin(16, 2);
void loop()
moistureSensorValue = analogRead(4); // reads the sensor
if(moistureSensorValue < 300)
//Serial.println("The soil is too Soggy"); // in case of soggy soil:
Serial.println (analogRead(4));
//LED for Soggy lights up
digitalWrite(drysoilLEDPin,LOW);
digitalWrite(moistsoilLEDPin,LOW);
digitalWrite(PumpPin,LOW);
digitalWrite(soggyLEDPin,HIGH);
// system messages via LCD
lcd.clear();
lcd.setCursor(0,0);
lcd.print("Soil Soggy");
// in case of moist soil:
if((moistureSensorValue < 700) && (moistureSensorValue >300))
//Serial.println("Moisture Content is OK");
Serial.println (analogRead(4));
45
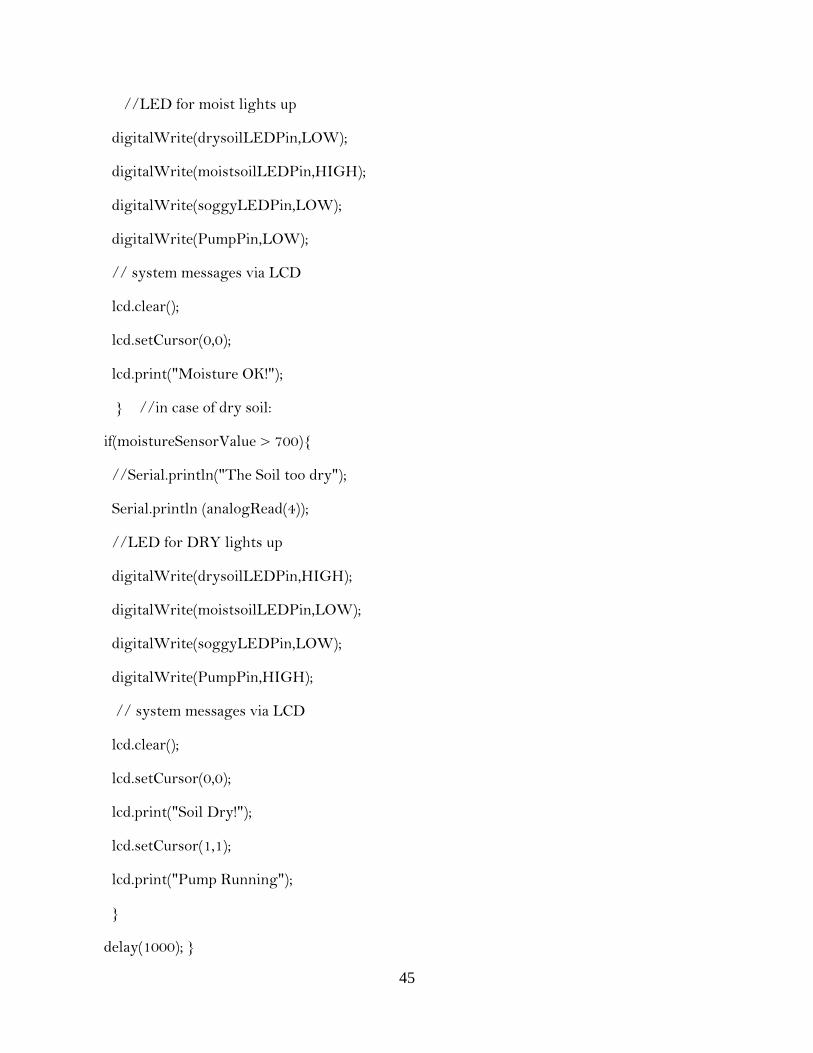
//LED for moist lights up
digitalWrite(drysoilLEDPin,LOW);
digitalWrite(moistsoilLEDPin,HIGH);
digitalWrite(soggyLEDPin,LOW);
digitalWrite(PumpPin,LOW);
// system messages via LCD
lcd.clear();
lcd.setCursor(0,0);
lcd.print("Moisture OK!");
//in case of dry soil:
if(moistureSensorValue > 700)
//Serial.println("The Soil too dry");
Serial.println (analogRead(4));
//LED for DRY lights up
digitalWrite(drysoilLEDPin,HIGH);
digitalWrite(moistsoilLEDPin,LOW);
digitalWrite(soggyLEDPin,LOW);
digitalWrite(PumpPin,HIGH);
// system messages via LCD
lcd.clear();
lcd.setCursor(0,0);
lcd.print("Soil Dry!");
lcd.setCursor(1,1);
lcd.print("Pump Running");
delay(1000);
46
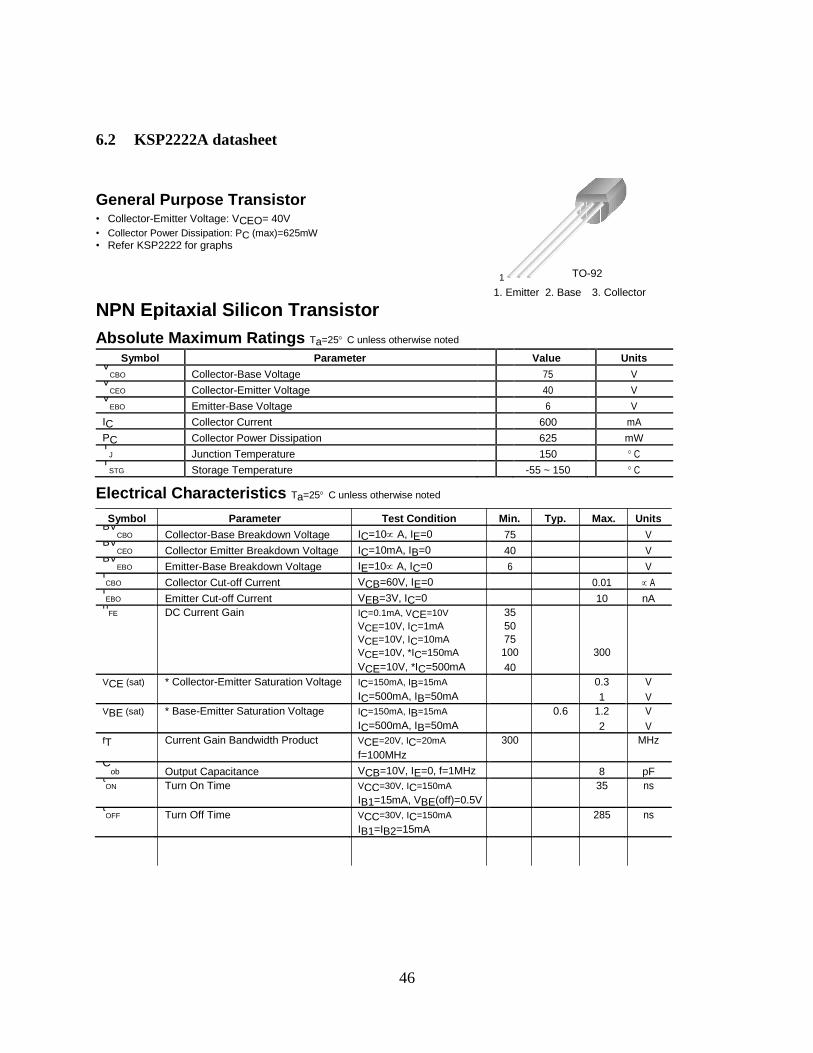
6.2 KSP2222A datasheet
General Purpose Transistor • Collector-Emitter Voltage: VCEO= 40V
• Collector Power Dissipation: PC (max)=625mW • Refer KSP2222 for graphs
1 TO-92
NPN Epitaxial Silicon Transistor
1. Emitter 2. Base 3. Collector
Absolute Maximum Ratings Ta=25 C unless otherwise noted
Symbol Parameter Value Units
VCBO Collector-Base Voltage 75 V
VCEO Collector-Emitter Voltage 40 V
VEBO Emitter-Base Voltage 6 V
IC Collector Current 600 mA
PC Collector Power Dissipation 625 mW
TJ Junction Temperature 150 C
TSTG Storage Temperature -55 ~ 150 C
Electrical Characteristics Ta=25 C unless otherwise noted
Symbol Parameter Test Condition Min. Typ. Max. Units BV
CBO Collector-Base Breakdown Voltage IC=10 A, IE=0 75 V BV
CEO Collector Emitter Breakdown Voltage IC=10mA, IB=0 40 V BV
EBO Emitter-Base Breakdown Voltage IE=10 A, IC=0 6 V ICBO Collector Cut-off Current VCB=60V, IE=0 0.01 A
IEBO Emitter Cut-off Current VEB=3V, IC=0 10 nA
hFE DC Current Gain IC=0.1mA, VCE=10V 35
VCE=10V, IC=1mA 50
VCE=10V, IC=10mA 75
VCE=10V, *IC=150mA 100 300
VCE=10V, *IC=500mA 40
VCE (sat) * Collector-Emitter Saturation Voltage IC=150mA, IB=15mA 0.3 V IC=500mA, IB=50mA 1 V
VBE (sat) * Base-Emitter Saturation Voltage IC=150mA, IB=15mA 0.6 1.2 V IC=500mA, IB=50mA 2 V
fT Current Gain Bandwidth Product VCE=20V, IC=20mA 300 MHz f=100MHz
Cob Output Capacitance VCB=10V, IE=0, f=1MHz 8 pF
tON Turn On Time VCC=30V, IC=150mA 35 ns
IB1=15mA, VBE(off)=0.5V tOFF Turn Off Time VCC=30V, IC=150mA 285 ns
IB1=IB2=15mA
47
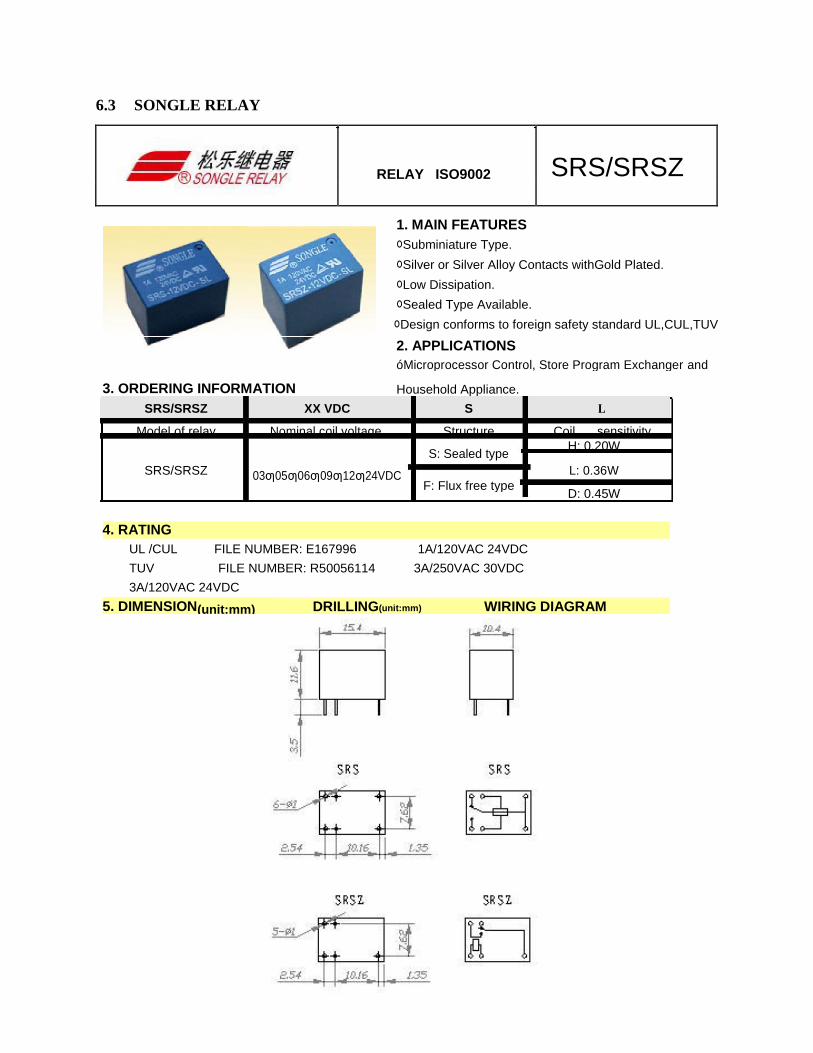
6.3 SONGLE RELAY
RELAY ISO9002 SRS/SRSZ
1. MAIN FEATURES ᄋSubminiature Type. ᄋSilver or Silver Alloy Contacts withGold Plated. ᄋLow Dissipation. ᄋSealed Type Available. ᄋDesign conforms to foreign safety standard UL,CUL,TUV
2. APPLICATIONS óMicroprocessor Control, Store Program Exchanger and
3. ORDERING INFORMATION Household Appliance. SRS/SRSZ XX VDC S L
Model of relay Nominal coil voltage Structure Coil sensitivity
S: Sealed type
H: 0.20W
SRS/SRSZ 03ƣ05ƣ06ƣ09ƣ12ƣ24VDC L: 0.36W
F: Flux free type
D: 0.45W
4. RATING
UL /CUL FILE NUMBER: E167996 1A/120VAC 24VDC
TUV FILE NUMBER: R50056114 3A/250VAC 30VDC
3A/120VAC 24VDC
5. DIMENSION(unit:mm) DRILLING(unit:mm) WIRING DIAGRAM