David C. Wynn · Khadidja Grebici · P. John Clarkson
15
Modelling the evolution of uncertainty levels during design Wynn et al. (2011) Page 1 of 15 The final publication is available at www.springerlink.com. DOI 10.1007/s12008-011-0131-y Modelling the evolution of uncertainty levels during design David C. Wynn · Khadidja Grebici · P. John Clarkson Cite this article as: Wynn, DC, Grebici, K and Clarkson, PJ (2011) “Modelling the evolution of uncertainty levels during design” International Journal on Interactive Design and Manufacturing, Vol. 5, No. 3, pp. 187-202. DOI 10.1007/s12008-011-0131-y The final publication is available at www.springerlink.com Abstract Design work involves uncertainty that arises from, and influences, the progressive development of solutions. This paper analyses the influences of evolving uncertainty levels on the design process. We focus on uncertainties associated with choosing the values of design parameters, and do not consider in detail the issues that arise when parameters must first be identified. Aspects of uncertainty and its evolution are discussed, and a new task-based model is introduced to describe process behaviour in terms of changing uncertainty levels. The model is applied to study two process configuration problems based on aircraft wing design: one using an analytical solution and one using Monte- Carlo simulation. The applications show that modelling uncertainty levels during design can help assess management policies, such as how many concepts should be considered during design and to what level of accuracy. Keywords Uncertainty levels · Design process model · Discrete-event simulation 1 Introduction The design process can be viewed as a system of interrelated activities that are performed to increase knowledge—or to reduce uncertainty—about the design solution. This paper explores how design processes are influenced by changing levels of uncertainty in the emerging design. We focus on situations where the solution principles are well-established and the architectures of the product and its design process vary only incrementally from previous projects. In these cases the key design parameters and models are usually known from the outset, and the processes by which their values are determined can often be described. Prior to a more detailed analysis in forthcoming sections, we use the term ‘uncertainty’ in a high-level sense to encompass many different issues, including: lack of definition, lack of knowledge and lack of trust in knowledge. We draw on an example of aircraft wing design to argue that design processes can be enhanced by better understanding the evolution of uncertainty levels associated with the emerging design. A task-based simulation model is introduced based on the assumptions that (1) reducing uncertainty about the design is an objective of the design process; and (2) levels of uncertainty influence how the process unfolds. We discuss how tasks in the design process can be influenced by the uncertainty levels associated with their inputs, and explain how these levels and influences can be incorporated in a design process simulation. Two illustrative applications show how the modelling approach can help understand the impact of uncertainty levels on a design process, and show how the uncertainty-oriented simulation can be used to assess potential process improvements. 2 Case study: aircraft wing design The arguments throughout this paper are illustrated using a case study: the design of an aircraft wing. Wing design provides a good example of a complex engineering process, in which multi-disciplinary teams resolve design problems where the main parameters (but not their values) are well-defined from the beginning. We draw on interviews with stress engineers and designers working on structural analysis in a major aircraft manufacturer [1]. However, most features of wing design described here are common across the industry as discussed by other authors (e.g., [2]). 2.1 Overview of the design problem Wing design requires many parameters to be determined, ranging from high-level configuration to low-level parameters such as the thickness of the skin. Choices made while designing other aircraft sub-systems, such as the fuselage, landing gear and engines, impact on the wing design and vice versa. Interface management is thus
Transcript of David C. Wynn · Khadidja Grebici · P. John Clarkson
Modelling the evolution of uncertainty levels during design Wynn et al. (2011)
Page 1 of 15 The final publication is available at www.springerlink.com. DOI 10.1007/s12008-011-0131-y
Modelling the evolution of uncertainty levels during design
David C. Wynn · Khadidja Grebici · P. John Clarkson
Cite this article as:
Wynn, DC, Grebici, K and Clarkson, PJ (2011) “Modelling the evolution of uncertainty levels during design” International
Journal on Interactive Design and Manufacturing, Vol. 5, No. 3, pp. 187-202. DOI 10.1007/s12008-011-0131-y
The final publication is available at www.springerlink.com
Abstract Design work involves uncertainty that arises
from, and influences, the progressive development of
solutions. This paper analyses the influences of evolving
uncertainty levels on the design process. We focus on
uncertainties associated with choosing the values of
design parameters, and do not consider in detail the
issues that arise when parameters must first be identified.
Aspects of uncertainty and its evolution are discussed,
and a new task-based model is introduced to describe
process behaviour in terms of changing uncertainty
levels. The model is applied to study two process
configuration problems based on aircraft wing design:
one using an analytical solution and one using Monte-
Carlo simulation. The applications show that modelling
uncertainty levels during design can help assess
management policies, such as how many concepts should
be considered during design and to what level of
accuracy.
Keywords Uncertainty levels · Design process model ·
Discrete-event simulation
1 Introduction
The design process can be viewed as a system of
interrelated activities that are performed to increase
knowledge—or to reduce uncertainty—about the design
solution. This paper explores how design processes are
influenced by changing levels of uncertainty in the
emerging design. We focus on situations where the
solution principles are well-established and the
architectures of the product and its design process vary
only incrementally from previous projects. In these cases
the key design parameters and models are usually known
from the outset, and the processes by which their values
are determined can often be described. Prior to a more
detailed analysis in forthcoming sections, we use the
term ‘uncertainty’ in a high-level sense to encompass
many different issues, including: lack of definition, lack
of knowledge and lack of trust in knowledge.
We draw on an example of aircraft wing design to
argue that design processes can be enhanced by better
understanding the evolution of uncertainty levels
associated with the emerging design. A task-based
simulation model is introduced based on the assumptions
that (1) reducing uncertainty about the design is an
objective of the design process; and (2) levels of
uncertainty influence how the process unfolds. We
discuss how tasks in the design process can be influenced
by the uncertainty levels associated with their inputs, and
explain how these levels and influences can be
incorporated in a design process simulation. Two
illustrative applications show how the modelling
approach can help understand the impact of uncertainty
levels on a design process, and show how the
uncertainty-oriented simulation can be used to assess
potential process improvements.
2 Case study: aircraft wing design
The arguments throughout this paper are illustrated using
a case study: the design of an aircraft wing. Wing design
provides a good example of a complex engineering
process, in which multi-disciplinary teams resolve design
problems where the main parameters (but not their
values) are well-defined from the beginning. We draw on
interviews with stress engineers and designers working
on structural analysis in a major aircraft manufacturer
[1]. However, most features of wing design described
here are common across the industry as discussed by
other authors (e.g., [2]).
2.1 Overview of the design problem
Wing design requires many parameters to be determined,
ranging from high-level configuration to low-level
parameters such as the thickness of the skin. Choices
made while designing other aircraft sub-systems, such as
the fuselage, landing gear and engines, impact on the
wing design and vice versa. Interface management is thus
Modelling the evolution of uncertainty levels during design Wynn et al. (2011)
Page 2 of 15 The final publication is available at www.springerlink.com. DOI 10.1007/s12008-011-0131-y
an important challenge during design. Changes in
interface parameters, or in requirements, can occur at any
time and necessitate rework.
One of the main challenges faced by the engineers
interviewed during the study is to design a structure that
can resist loads without buckling. In overview, two main
types of load must be considered. Surface forces or
external loads act upon the skin, and body forces or
internal loads act over the volume of the structure. Loads
derive from sources including the wing weight and the
pressure distribution over the surface. They result in
direct loads, bending, shear and torsion in all parts of the
structure. Designers must consider not only of the static
structure of parts and their interfaces, but also the
dynamic behaviour of the wing. For instance, stresses on
the leading edge must be considered under the combined
effect of pressure loads and movement loads.
Most design decisions must consider multiple
operating scenarios, such as steady flight, manoeuvre and
gust conditions. Many other requirements and constraints
must also be considered. These include weight and
certification requirements, as well as design constraints
such as material properties and production tolerances.
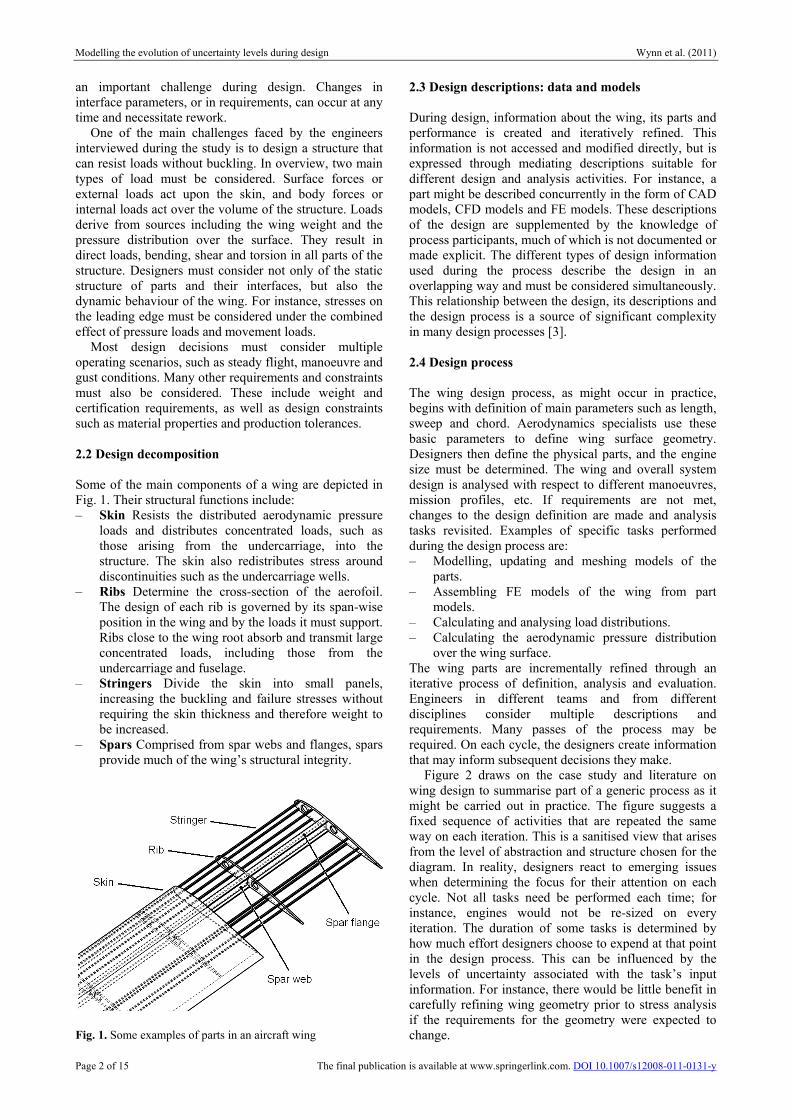
2.2 Design decomposition
Some of the main components of a wing are depicted in
Fig. 1. Their structural functions include:
– Skin Resists the distributed aerodynamic pressure
loads and distributes concentrated loads, such as
those arising from the undercarriage, into the
structure. The skin also redistributes stress around
discontinuities such as the undercarriage wells.
– Ribs Determine the cross-section of the aerofoil.
The design of each rib is governed by its span-wise
position in the wing and by the loads it must support.
Ribs close to the wing root absorb and transmit large
concentrated loads, including those from the
undercarriage and fuselage.
– Stringers Divide the skin into small panels,
increasing the buckling and failure stresses without
requiring the skin thickness and therefore weight to
be increased.
– Spars Comprised from spar webs and flanges, spars
provide much of the wing’s structural integrity.
Fig. 1. Some examples of parts in an aircraft wing
2.3 Design descriptions: data and models
During design, information about the wing, its parts and
performance is created and iteratively refined. This
information is not accessed and modified directly, but is
expressed through mediating descriptions suitable for
different design and analysis activities. For instance, a
part might be described concurrently in the form of CAD
models, CFD models and FE models. These descriptions
of the design are supplemented by the knowledge of
process participants, much of which is not documented or
made explicit. The different types of design information
used during the process describe the design in an
overlapping way and must be considered simultaneously.
This relationship between the design, its descriptions and
the design process is a source of significant complexity
in many design processes [3].
2.4 Design process
The wing design process, as might occur in practice,
begins with definition of main parameters such as length,
sweep and chord. Aerodynamics specialists use these
basic parameters to define wing surface geometry.
Designers then define the physical parts, and the engine
size must be determined. The wing and overall system
design is analysed with respect to different manoeuvres,
mission profiles, etc. If requirements are not met,
changes to the design definition are made and analysis
tasks revisited. Examples of specific tasks performed
during the design process are:
– Modelling, updating and meshing models of the
parts.
– Assembling FE models of the wing from part
models.
– Calculating and analysing load distributions.
– Calculating the aerodynamic pressure distribution
over the wing surface.
The wing parts are incrementally refined through an
iterative process of definition, analysis and evaluation.
Engineers in different teams and from different
disciplines consider multiple descriptions and
requirements. Many passes of the process may be
required. On each cycle, the designers create information
that may inform subsequent decisions they make.
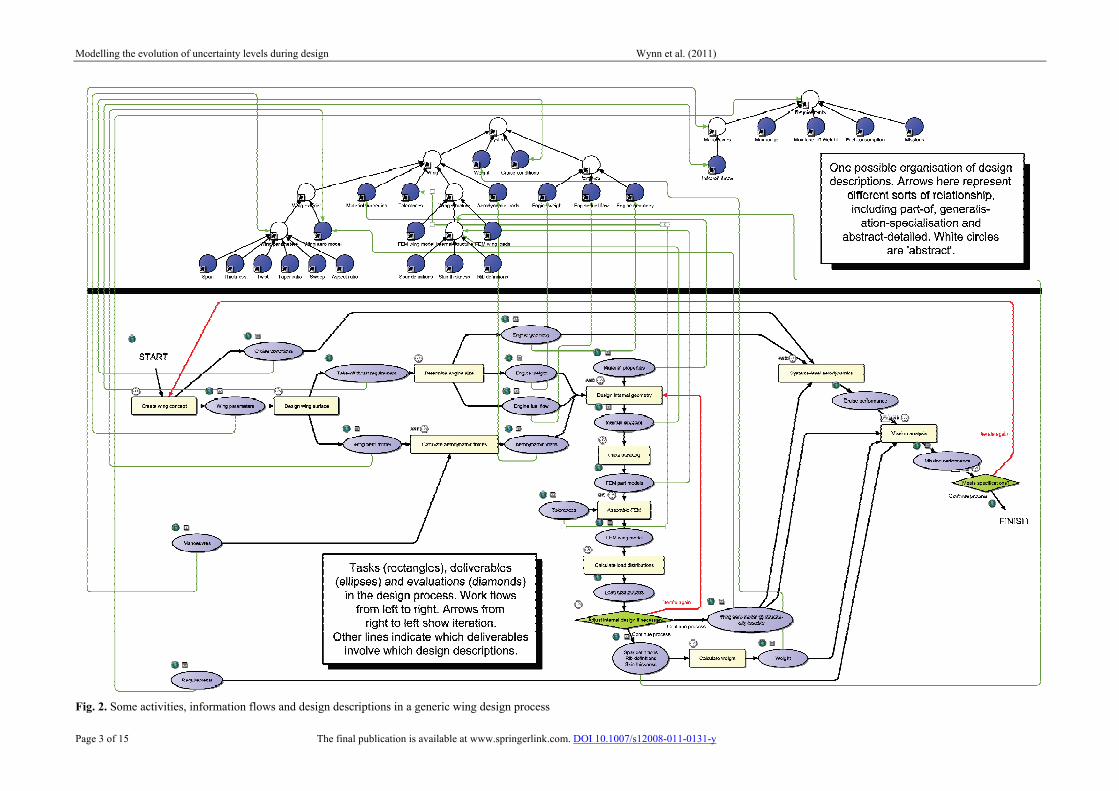
Figure 2 draws on the case study and literature on
wing design to summarise part of a generic process as it
might be carried out in practice. The figure suggests a
fixed sequence of activities that are repeated the same
way on each iteration. This is a sanitised view that arises
from the level of abstraction and structure chosen for the
diagram. In reality, designers react to emerging issues
when determining the focus for their attention on each
cycle. Not all tasks need be performed each time; for
instance, engines would not be re-sized on every
iteration. The duration of some tasks is determined by
how much effort designers choose to expend at that point
in the design process. This can be influenced by the
levels of uncertainty associated with the task’s input
information. For instance, there would be little benefit in
carefully refining wing geometry prior to stress analysis
if the requirements for the geometry were expected to
change.
Modelling the evolution of uncertainty levels during design Wynn et al. (2011)
Page 3 of 15 The final publication is available at www.springerlink.com. DOI 10.1007/s12008-011-0131-y
Fig. 2. Some activities, information flows and design descriptions in a generic wing design process
Modelling the evolution of uncertainty levels during design Wynn et al. (2011)
Page 4 of 15 The final publication is available at www.springerlink.com. DOI 10.1007/s12008-011-0131-y
Many tasks in the design process may also be
undertaken using one of multiple methods. For example,
early in the design process simple correlations may be
used to estimate design performance. Later, when a more
precise design definition is available, more sophisticated
tools can be applied to perform the same task with better
results. The methods used in a particular iteration of a
task can also depend on the design context at that time.
For instance, they can even be created on-the-fly to
reflect the needs of a particular analysis and the
information available when analysis is undertaken [4].
In a complex design process it can be difficult to
identify and coordinate all information flows, especially
those involving other sub-systems. Process participants
often begin activities based upon assumptions, which
may subsequently require corrective iterations when
updated information becomes available. This illustrates
yet another situation in which designers provide and
receive information known to be uncertain, and that can
cause additional complexity in the design process.
In summary, the cost and duration of the wing design
process is determined by the methods that are used, the
sequence in which tasks are attempted, the degree of
concurrency and the strategies for managing unplanned
flows, changes and iterations. The effort dedicated to
tasks at each point in the process is influenced by the
perceived levels of uncertainty, and consequently the
dynamic organisation of the process is affected by
uncertainty levels. The remainder of this paper draws on
the wing design example to show that insights to support
process management can be gained by modelling how
processes unfold according to uncertainty within them.
3 Uncertainty in engineering design
There is no clear consensus or single definition of
uncertainty in the engineering literature [5]. However,
many definitions of uncertainty in engineering apply to
“predictions of future events, to physical measurements
already made, or to the unknown” [6]. In this paper, we
use the term ‘uncertainty’ to refer to everything that
contributes to a lack of definition, lack of knowledge or
lack of trust in knowledge. This may differ from
colloquial usage of the term but is consistent with much
of the literature (e.g., [7,8]). Some of the main concepts
found in this literature are outlined below.
3.1 Epistemic and aleatory uncertainties
One of the main distinctions regarding types of
uncertainty in engineering design is made between
epistemic and aleatory uncertainties (e.g., [9,10]):
Epistemic uncertainty. Sometimes called subjective
uncertainty, epistemic uncertainty is derived from
ignorance or incomplete information. Some epistemic
uncertainty is reducible, for instance by trade studies,
measurements or consultation with experts.
Epistemic uncertainty can be viewed as arising from
lack of knowledge or lack of definition. According to
Hastings and McManus, lack of knowledge refers to
“facts that are not known, or are known only imprecisely,
that are needed to complete the system architecture in a
rational way” [11]. Lack of definition reflects “things
about the system in question that have not been decided
or specified yet” [11]. Since they are epistemic in nature,
both lack of knowledge and lack of definition may be
reducible.
Similar to lack of definition, in many situations it may
be difficult or impossible to reason about uncertainty
because the events or parameters with which it is
associated are not yet known or do not yet exist [5]. For
instance, this may occur in design if the choice of
product architecture ‘creates’ the need for certain module
interface parameters.
Aleatory uncertainty. Sometimes termed objective or
stochastic uncertainty, aleatory uncertainty describes the
inherent variation associated with a physical system or
environment—such as dimensional variation in
manufactured components. Aleatory uncertainty cannot
be reduced using the methods described above, although
gaining knowledge about variability may allow its
influence to be mitigated through design of systems to be
adaptable, robust, flexible, etc. [12].
3.2 Uncertainty in information and description
McManus and Hastings [11] discuss how uncertainty
may concern information (e.g., incompleteness,
inconsistency or limited measurement quality) and may
also be associated with how the information is described
or modelled (e.g., due to ambiguity of description,
information omitted when modelling or lack of clarity in
the model’s scope). This classification is similar to
Eversheim et al.’s [13] categorisation of uncertainty:
content-uncertainty (incompleteness, imprecision and
vagueness) and context-uncertainty (unreliability,
invalidity and instability).
Uncertainty concerning information may be aleatory
or epistemic in nature. Uncertainty associated with
description is primarily a type of epistemic uncertainty
that arises from assumptions or lack of knowledge while
modelling [14].
3.3 Uncertainty in abstraction and interpretation
The quality of any description is subject to the view an
observer has of the target system and any related
phenomena about which judgments are to be made. This
arises since the systems or phenomena cannot be
considered directly by the observer [15], but are
processed through conceptual apparatus that provides
ways of thinking about and terminology for describing
aspects of the system.
Considering this issue, Pons and Raine [8] discuss
abstraction uncertainty in engineering. Abstraction
uncertainty arises from how descriptions are interpreted
and used by engineers. It thus depends on the subjective
perceptions of process participants and can be reduced
during the design process as more details become known.
The concept of uncertainty in abstraction also has
implications regarding how uncertainty can be described
and analysed. There is no general approach to
representing and reasoning about the uncertainty
associated with a design but rather several different
Modelling the evolution of uncertainty levels during design Wynn et al. (2011)
Page 5 of 15 The final publication is available at www.springerlink.com. DOI 10.1007/s12008-011-0131-y
methods [15]. For example, probability theory provides
concepts such as variance to describe uncertainty levels
whereas fuzzy set theory provides membership functions.
Smithson [7] provides a taxonomy of formalisms for
handling uncertainty in design according to the sources
of ignorance.
However, no single method is able to model all types
of uncertainty equally well [7]. The most appropriate
approach should be determined by the modelling context.
This includes the causes of uncertainty; how uncertainty
is understood; the available information; and the purpose
for modelling.
3.4 Uncertainty associated with complexity
Uncertainty is also associated with the complex system
of interrelated models found in design [3]. Uncertainty
levels associated with different descriptions of the
emerging design evolve in an interdependent way,
because the descriptions are related to one another
through the structure of the design process system within
which they are embedded.
Building on the analysis of complexity in design
developed by Earl et al. [3], we consider the structure of
information use in design to comprise: (1) the
decomposition of the design into the abstract structure of
information that defines it; (2) the representation of this
abstract information as multiple, overlapping
descriptions that exist as objects or data in the real world;
and (3) the behaviour and organisation of activities that
create and manipulate descriptions during design. In
following sub-sections we argue that interdependencies
between uncertainty levels depend upon this system
structure, and that it also creates sources of uncertainty
that impact upon design descriptions and their
interpretation (Fig. 3).
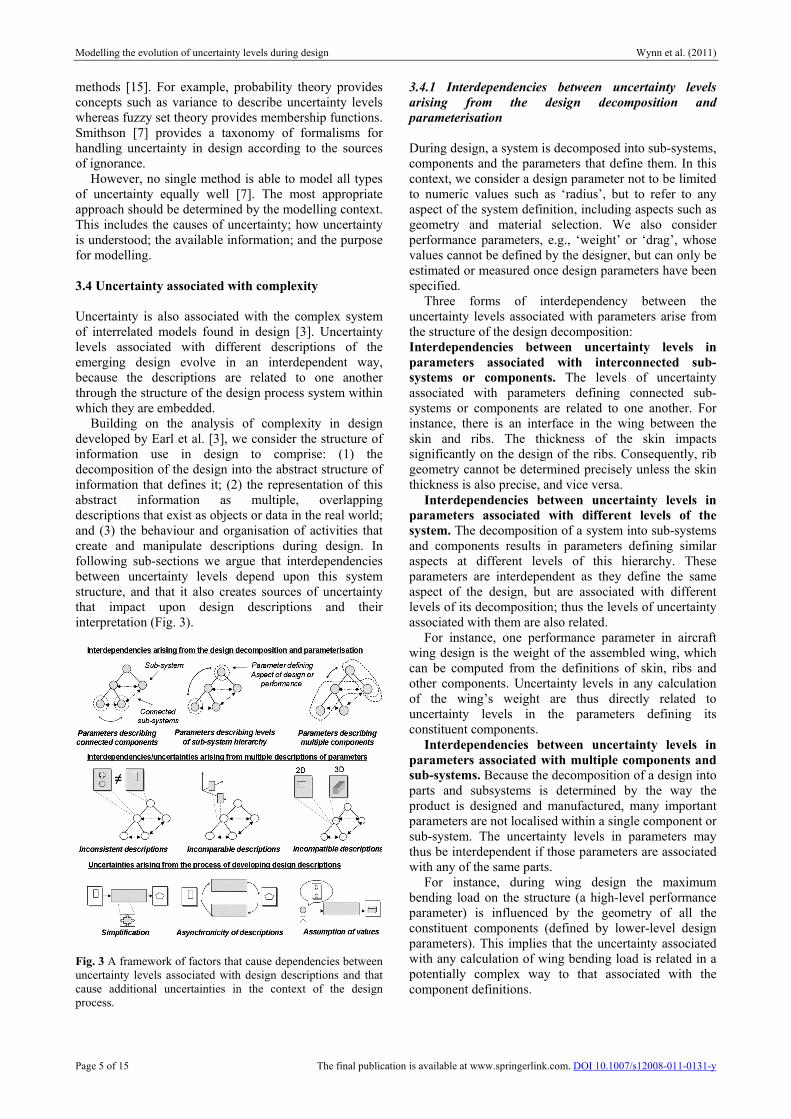
Fig. 3 A framework of factors that cause dependencies between
uncertainty levels associated with design descriptions and that
cause additional uncertainties in the context of the design
process.
3.4.1 Interdependencies between uncertainty levels
arising from the design decomposition and
parameterisation
During design, a system is decomposed into sub-systems,
components and the parameters that define them. In this
context, we consider a design parameter not to be limited
to numeric values such as ‘radius’, but to refer to any
aspect of the system definition, including aspects such as
geometry and material selection. We also consider
performance parameters, e.g., ‘weight’ or ‘drag’, whose
values cannot be defined by the designer, but can only be
estimated or measured once design parameters have been
specified.
Three forms of interdependency between the
uncertainty levels associated with parameters arise from
the structure of the design decomposition:
Interdependencies between uncertainty levels in
parameters associated with interconnected sub-
systems or components. The levels of uncertainty
associated with parameters defining connected sub-
systems or components are related to one another. For
instance, there is an interface in the wing between the
skin and ribs. The thickness of the skin impacts
significantly on the design of the ribs. Consequently, rib
geometry cannot be determined precisely unless the skin
thickness is also precise, and vice versa.
Interdependencies between uncertainty levels in
parameters associated with different levels of the
system. The decomposition of a system into sub-systems
and components results in parameters defining similar
aspects at different levels of this hierarchy. These
parameters are interdependent as they define the same
aspect of the design, but are associated with different
levels of its decomposition; thus the levels of uncertainty
associated with them are also related.
For instance, one performance parameter in aircraft
wing design is the weight of the assembled wing, which
can be computed from the definitions of skin, ribs and
other components. Uncertainty levels in any calculation
of the wing’s weight are thus directly related to
uncertainty levels in the parameters defining its
constituent components.
Interdependencies between uncertainty levels in
parameters associated with multiple components and
sub-systems. Because the decomposition of a design into
parts and subsystems is determined by the way the
product is designed and manufactured, many important
parameters are not localised within a single component or
sub-system. The uncertainty levels in parameters may
thus be interdependent if those parameters are associated
with any of the same parts.
For instance, during wing design the maximum
bending load on the structure (a high-level performance
parameter) is influenced by the geometry of all the
constituent components (defined by lower-level design
parameters). This implies that the uncertainty associated
with any calculation of wing bending load is related in a
potentially complex way to that associated with the
component definitions.
Modelling the evolution of uncertainty levels during design Wynn et al. (2011)
Page 6 of 15 The final publication is available at www.springerlink.com. DOI 10.1007/s12008-011-0131-y
3.4.2 Interdependencies and additional uncertainties
arising from multiple descriptions of parameters
Information is not modified directly while designing—
the process operates upon multiple descriptions or
models, each of which represents one or more
parameters. If the scopes of several descriptions overlap,
the uncertainty levels associated with them will thus be
interdependent.
Uncertainty also arises from how parameters are
represented during the process. In particular, use of
multiple representations and multiple forms of
representation introduces variation in how the design is
perceived:
Uncertainty arising from inconsistent descriptions.
Descriptions used during design often embody different
values of the same information. This can introduce
uncertainty if designers must make decisions based on
inconsistent representations, or if different designers
knowingly or unknowingly work with inconsistent
representations. In practice, inconsistency is often
inevitable and can be managed if its possibility is
recognised. For instance, models that are considered old
in terms of the ‘iterative speed’ of the process are often
not trusted, and can be checked prior to use. On the other
hand, unrecognised inconsistency can lead to mistakes
that are integrated into the design and may require
expensive rework to correct later.
Inconsistency may arise from the different types and
formats of representation used during design as described
below, or from the complexity of the design process and
need to make assumptions, as discussed in Sect. 3.4.3.
Potential for inconsistency arising from
incomparable descriptions. Any aspect of the design
may be simultaneously represented in several different
formats suitable for different tasks. For instance, consider
the concurrent representation of geometry in data formats
used by different tools. If the formats are not possible to
compare using the available tools, inconsistency may
exist but may not be recognised—or the recognised
potential for inconsistency may lead to lack of trust in the
data.
Potential for inconsistency arising from
incompatible descriptions. Different tasks consider
descriptions that represent the design definition in
different levels and forms of abstraction—such as 2D
geometry versus 3D geometry. Such models can be
‘incompatible’ in that they omit significant and different
aspects of the design definition that is represented, again
leading to potential for inconsistency. Similar issues
occur when representations of the design are viewed or
interpreted in different ways, or when different aspects
are considered important by different stakeholders.
3.4.3 Interdependencies and additional uncertainties
arising from the process of developing design
descriptions
Since descriptions are processed by activities in the
design process, the uncertainty levels associated with
descriptions created by a task are related to those
associated with descriptions used as input to that task.
For instance, analysis based on design descriptions that
are believed to be out-of-date will lead to results that are
also not trusted. Descriptions are also interrelated
indirectly through the process network, since analysis
results influence design decisions that are subsequently
integrated into the workflow. For instance, levels of
uncertainty in many downstream descriptions may
increase if the information on which an analysis was
based is subsequently changed.
In addition to these interdependencies, the properties
of each task and the organisation of the process introduce
further sources of uncertainty:
Uncertainty arising from models and
simplifications. Many design and analysis tasks use a
physics model to derive descriptions of performance
parameters from descriptions of design parameters.
Assumptions in these models introduce uncertainty in
analysis results additional to that which is propagated
from the input. For instance, CFD models may use
simple approximations in place of sophisticated
turbulence models. Geometry is also often simplified and
defeatured in different ways when preprocessing for
different analysis tools, objectives and boundary
conditions. Ordaz-Hernandez et al. [16] discuss how
model simplifications should be considered according to
the modelling context; trade-offs may be required
between accuracy and speed of the user interactions
required to perform the task.
Potential for inconsistency arising from the
complex organisation of activities. Design processes
are organised into concurrent streams of work that are
complex and difficult to understand in their own right,
and this complexity is exacerbated by the iterations that
occur within and across workflows. Due in part to this
complexity, participants often have limited overview of
information flows and dependencies in the process. As a
result descriptions and models used during design may
become desynchronised and inconsistent.
Potential for inconsistency arising from introduced
assumptions. The dependencies between design
parameters constrain the order in which they can be
determined, such that a given parameter cannot be
finalised until all the values on which it depends have
also been determined. In practice, there are often many
cyclic dependencies between parameters, so that it is not
possible to identify a sequence of determination.
Assumptions must then be made about the values of
parameters and design must proceed knowing that later
rework may be required. Similarly, the need to divide
work among many participants leads to artificially
concurrent work streams with limited information flows
between them, necessitating additional assumptions and
potential for inconsistency that may or may not be
recognised.
3.5 Uncertainty associated with lack of trust in
knowledge
The previous subsection explains how designers must
cope with an overabundance of information, including
conflicting or difficult-to-compare representations of the
same systems or phenomena. As a result, stakeholders
may be uncertain about an issue because they don’t trust
the available information. For instance, an engineer may
Modelling the evolution of uncertainty levels during design Wynn et al. (2011)
Page 7 of 15 The final publication is available at www.springerlink.com. DOI 10.1007/s12008-011-0131-y
not trust certain information if they don’t know who
generated it; if that person is inexperienced; if they don’t
know when the information was generated; or if the
information is considered old enough that it could need
updating.
4 Modelling the evolution of uncertainty
during design
Task-based models offer a way to analyse the evolution
of uncertainty levels during design, because they capture
the progression of distinct activities over time, along with
the creation and modification of inputs and outputs.
Most task-based design process models in the
literature are based on graphical activity networks (e.g.,
[17]) or Dependency Structure Matrices (e.g., [18]).
These models assume that once the input information for
a task is known, the output information can be calculated
or deduced and the next task may be identified and
attempted in turn. Some task-based models allow
simulation of a process; in these approaches, the duration
of each task is generally modelled either as a precise
value or as a probability density function. Such models
can be used to investigate the impact of uncertainty on
project performance—for instance, by exploring the
situations in which delays encountered while completing
certain tasks will propagate to the end of the process.
However, they do not represent the evolving uncertainty
associated with the design itself.
Other task-based models do relate aspects of product-
related uncertainty to process behaviour. For instance,
Krishnan et al. [19] model situations in which tasks
release preliminary outputs to their successors before
work is finalised. They consider preliminary releases to
be intervals within which the final value must lie.
Simulation models that consider product-related
uncertainty include Signposting [20] and the adaptive
product development process (APDP) [21]. These
approaches qualify the information that tasks require and
produce by describing different aspects of its maturity. In
Signposting, a single item of maturity metadata described
as ‘confidence’ is associated with each design parameter,
used to represent designers’ belief in the quality of
information. In the APDP model, the meta-data relates to
the risk that the design will not meet technical
performance measures (TPMs). Both models assume that
tasks are attempted when sufficient maturity is reached in
all inputs. Completing a task causes maturity in its
outputs to increase, or to reduce if the task reveals a need
for rework.
These models focus primarily on the effect of maturity
levels on task sequencing and on the appropriate choice
of methods to perform each task. However, in design-by-
analysis processes such as wing design, the sequence of
tasks is largely fixed by data flow constraints between
design tools. We therefore seek to model how the
iterative dynamics of the process vary given a fixed
structure of activities, and how this is governed by
evolving uncertainty levels. Furthermore, existing
approaches do not support modelling the different forms
of uncertainty discussed in Sect. 3.
4.1 A task-based model considering uncertainty levels
An enhanced task-based modelling approach was
developed to study the impact of evolving uncertainty
levels on the design process. The approach is based on a
graphical Input–Process–Output notation in which each
task produces deliverables that are consumed by
successors. The properties o each task are specified as
functions of the uncertainty levels associated with input
descriptions. Task properties treated in this way are (1)
duration; (2) propensity to generate iteration; and (3)
uncertainty levels associated with the output descriptions
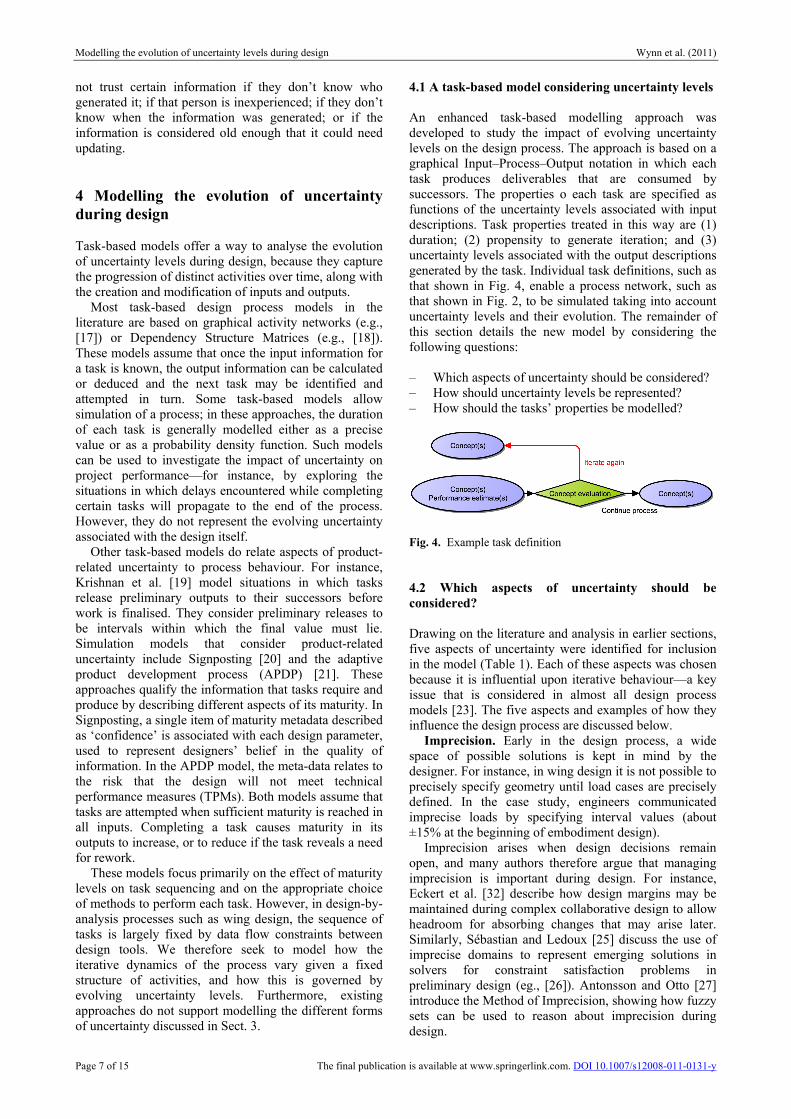
generated by the task. Individual task definitions, such as
that shown in Fig. 4, enable a process network, such as
that shown in Fig. 2, to be simulated taking into account
uncertainty levels and their evolution. The remainder of
this section details the new model by considering the
following questions:
– Which aspects of uncertainty should be considered?
– How should uncertainty levels be represented?
– How should the tasks’ properties be modelled?
Fig. 4. Example task definition
4.2 Which aspects of uncertainty should be
considered?
Drawing on the literature and analysis in earlier sections,
five aspects of uncertainty were identified for inclusion
in the model (Table 1). Each of these aspects was chosen
because it is influential upon iterative behaviour—a key
issue that is considered in almost all design process
models [23]. The five aspects and examples of how they
influence the design process are discussed below.
Imprecision. Early in the design process, a wide
space of possible solutions is kept in mind by the
designer. For instance, in wing design it is not possible to
precisely specify geometry until load cases are precisely
defined. In the case study, engineers communicated
imprecise loads by specifying interval values (about
±15% at the beginning of embodiment design).
Imprecision arises when design decisions remain
open, and many authors therefore argue that managing
imprecision is important during design. For instance,
Eckert et al. [32] describe how design margins may be
maintained during complex collaborative design to allow
headroom for absorbing changes that may arise later.
Similarly, Sébastian and Ledoux [25] discuss the use of
imprecise domains to represent emerging solutions in
solvers for constraint satisfaction problems in
preliminary design (eg., [26]). Antonsson and Otto [27]
introduce the Method of Imprecision, showing how fuzzy
sets can be used to reason about imprecision during
design.

Modelling the evolution of uncertainty levels during design Wynn et al. (2011)
Page 8 of 15 The final publication is available at www.springerlink.com. DOI 10.1007/s12008-011-0131-y
Table 1. Levels of up to five aspects of uncertainty may be associated with each description in the model
Name Description and example of use in the model
Imprecision Description: The ‘range’ within which information could lie [24]. As design decisions are made imprecision
tends to progressively reduce until a final, precise value is determined [27]
Example: Greater precision justifies application of more sophisticated design tools and methods, which may
require progressively greater effort [28]
Inconsistency Description: Different descriptions provide inconsistent views of the same design parameters
Example: Potential for inconsistency is introduced by tasks that make assumptions to resolve cyclic
dependencies or to perform work concurrently [29]. Rework must be undertaken to reconcile inconsistency
when revealed by integration or evaluation tasks
Inaccuracy Description: Expected discrepancy between the predicted values of performance parameters and their actual
values, which could be estimated from evidence gained through tests [24]
Example: As more sophisticated analysis methods are brought to bear during the design process they lend
progressively greater accuracy to the estimated design performance [30]
Indecision Description: A range of alternative options may be represented or held in mind. Qualitatively different to
imprecision as the extent of each option may be small while the range of the entire selection may be large
Example: Set-based design advocates considering multiple options during design, with progressive
convergence towards a single option [34]. The duration of many tasks may depend on the number of, and
extent of differentiation between the options
Instability Description: More unstable descriptions are more likely to change
Example: Instability may be increased by events that increase the likelihood that rework will be required; for
instance, the receipt of a change request could increase expected instability in many design descriptions,
which may require knock-on change [32]
Inconsistency. As discussed in Sect. 3.4.3,
inconsistency between the different descriptions used
during design may arise from several sources including
assumptions made in the design process, simplifications
in modelling and lack of overview. The potential for
creating inconsistency should be considered in cases
where multiple descriptions of the same information are
created; where simplifications or transformations of
models are made; or where work is divided into
concurrent streams. Inconsistency may be revealed by
integration or testing tasks, requiring iteration to correct.
(Expected) Inaccuracy. Design involves tools and
methods that lend increasing levels of fidelity to the
information they create [28]. For instance, the fidelity of
preliminary aeroengine gas path design can be
quantifiably related to the tools used at each step in the
design process [30]. Designers can thus assess the
accuracy of their performance estimates with respect to
the values that might later be determined through
experiment or more accurate analysis methods. The
inaccuracy believed to be associated with particular
descriptions reflects designers’ confidence in their
estimates and thus the effort they will dedicate to refining
the design at any point in time.
In our model, expected inaccuracy aggregates many
sources and types of uncertainty discussed in Sect. 3,
such as simplification in calculations and uncertainty
associated with absence of data. The concept of expected
inaccuracy used here should be distinguished from actual
inaccuracy and from insufficiency—both of which we
view as process information rather than aspects of
uncertainty. Actual inaccuracy refers to the difference
between a given estimate and an actual value, whereas
insufficiency refers to the inability of the design to
deliver required performance [7]. Expected inaccuracy
may be revealed as insufficiency and/or actual
inaccuracy through test or analysis.
Indecision. When a satisfactory solution cannot be
identified by sequential execution of tasks, an iterative
process must be used to converge upon a solution [28].
This typically involves both divergence and convergence
of the solution space [17]. When the solution space
diverges, designers hold in mind multiple alternatives
which are subsequently evaluated prior to selecting the
most promising to take forward. Indecision between
alternatives is used in our model to represent this. In
general, the greater the indecision associated with a
description, the more time a task that requires
consideration of all the options is likely to take.
Instability. The instability associated with design
descriptions can influence how designers approach their
tasks. For instance, if every designer spends little effort
on their tasks because they believe the input information
is likely to change, many fast iterations will be required
to complete the design. In contrast, if assumptions are not
expected to change, the process may be organised into a
smaller number of more time-consuming iterations. This
may incur lower co-ordination overhead, although it may
also result in additional rework if change is required. The
process may also be less agile, as infrequent information
transfer suggests there are fewer opportunities to
recognise and respond to problems and opportunities that
arise during design. Events such as the decision to freeze
aspects of the design or the receipt of a change request
may impact upon levels of perceived instability and thus
influence the dynamic structure of the design process.
In summary, each design description incorporated in
the model may be qualified with the levels of one or
more of these five aspects of uncertainty. The levels that
should be modelled for a given description will depend
upon the context in which it is used—in general, only
information that is progressively developed and involved
in design iteration need be considered. Apart from design
descriptions, uncertainty levels may also be associated
with other information or knowledge that influences the
design process. For instance, it may be appropriate to
model the uncertainty associated with aspects of design
space understanding, because understanding impacts on
the quality of decisions and can thus affect the rate of
design convergence.
Modelling the evolution of uncertainty levels during design Wynn et al. (2011)
Page 9 of 15 The final publication is available at www.springerlink.com. DOI 10.1007/s12008-011-0131-y
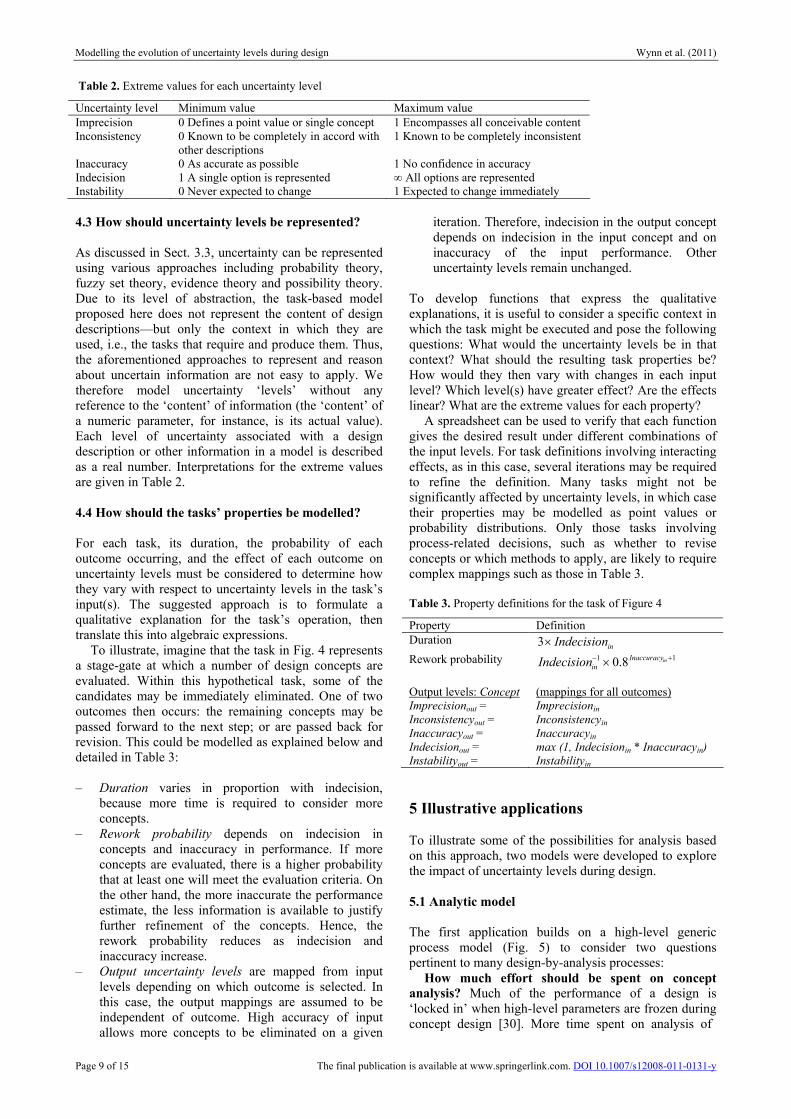
Table 2. Extreme values for each uncertainty level
Uncertainty level Minimum value Maximum value
Imprecision 0 Defines a point value or single concept 1 Encompasses all conceivable content
Inconsistency 0 Known to be completely in accord with
other descriptions
1 Known to be completely inconsistent
Inaccuracy 0 As accurate as possible 1 No confidence in accuracy
Indecision 1 A single option is represented ∞ All options are represented
Instability 0 Never expected to change 1 Expected to change immediately
4.3 How should uncertainty levels be represented?
As discussed in Sect. 3.3, uncertainty can be represented
using various approaches including probability theory,
fuzzy set theory, evidence theory and possibility theory.
Due to its level of abstraction, the task-based model
proposed here does not represent the content of design
descriptions—but only the context in which they are
used, i.e., the tasks that require and produce them. Thus,
the aforementioned approaches to represent and reason
about uncertain information are not easy to apply. We
therefore model uncertainty ‘levels’ without any
reference to the ‘content’ of information (the ‘content’ of
a numeric parameter, for instance, is its actual value).
Each level of uncertainty associated with a design
description or other information in a model is described
as a real number. Interpretations for the extreme values
are given in Table 2.
4.4 How should the tasks’ properties be modelled?
For each task, its duration, the probability of each
outcome occurring, and the effect of each outcome on
uncertainty levels must be considered to determine how
they vary with respect to uncertainty levels in the task’s
input(s). The suggested approach is to formulate a
qualitative explanation for the task’s operation, then
translate this into algebraic expressions.
To illustrate, imagine that the task in Fig. 4 represents
a stage-gate at which a number of design concepts are
evaluated. Within this hypothetical task, some of the
candidates may be immediately eliminated. One of two
outcomes then occurs: the remaining concepts may be
passed forward to the next step; or are passed back for
revision. This could be modelled as explained below and
detailed in Table 3:
– Duration varies in proportion with indecision,
because more time is required to consider more
concepts.
– Rework probability depends on indecision in
concepts and inaccuracy in performance. If more
concepts are evaluated, there is a higher probability
that at least one will meet the evaluation criteria. On
the other hand, the more inaccurate the performance
estimate, the less information is available to justify
further refinement of the concepts. Hence, the
rework probability reduces as indecision and
inaccuracy increase.
– Output uncertainty levels are mapped from input
levels depending on which outcome is selected. In
this case, the output mappings are assumed to be
independent of outcome. High accuracy of input
allows more concepts to be eliminated on a given
iteration. Therefore, indecision in the output concept
depends on indecision in the input concept and on
inaccuracy of the input performance. Other
uncertainty levels remain unchanged.
To develop functions that express the qualitative
explanations, it is useful to consider a specific context in
which the task might be executed and pose the following
questions: What would the uncertainty levels be in that
context? What should the resulting task properties be?
How would they then vary with changes in each input
level? Which level(s) have greater effect? Are the effects
linear? What are the extreme values for each property?
A spreadsheet can be used to verify that each function
gives the desired result under different combinations of
the input levels. For task definitions involving interacting
effects, as in this case, several iterations may be required
to refine the definition. Many tasks might not be
significantly affected by uncertainty levels, in which case
their properties may be modelled as point values or
probability distributions. Only those tasks involving
process-related decisions, such as whether to revise
concepts or which methods to apply, are likely to require
complex mappings such as those in Table 3.
Table 3. Property definitions for the task of Figure 4
Property Definition
Duration inIndecision×3
Rework probability 11 8.0+−
× inInaccuracy
inIndecision
Output levels: Concept (mappings for all outcomes)
Imprecisionout = Imprecisionin
Inconsistencyout = Inconsistencyin
Inaccuracyout = Inaccuracyin
Indecisionout = max (1, Indecisionin * Inaccuracyin)
Instabilityout = Instabilityin
5 Illustrative applications
To illustrate some of the possibilities for analysis based
on this approach, two models were developed to explore
the impact of uncertainty levels during design.
5.1 Analytic model
The first application builds on a high-level generic
process model (Fig. 5) to consider two questions
pertinent to many design-by-analysis processes:
How much effort should be spent on concept
analysis? Much of the performance of a design is
‘locked in’ when high-level parameters are frozen during
concept design [30]. More time spent on analysis of
Modelling the evolution of uncertainty levels during design Wynn et al. (2011)
Page 10 of 15 The final publication is available at www.springerlink.com. DOI 10.1007/s12008-011-0131-y
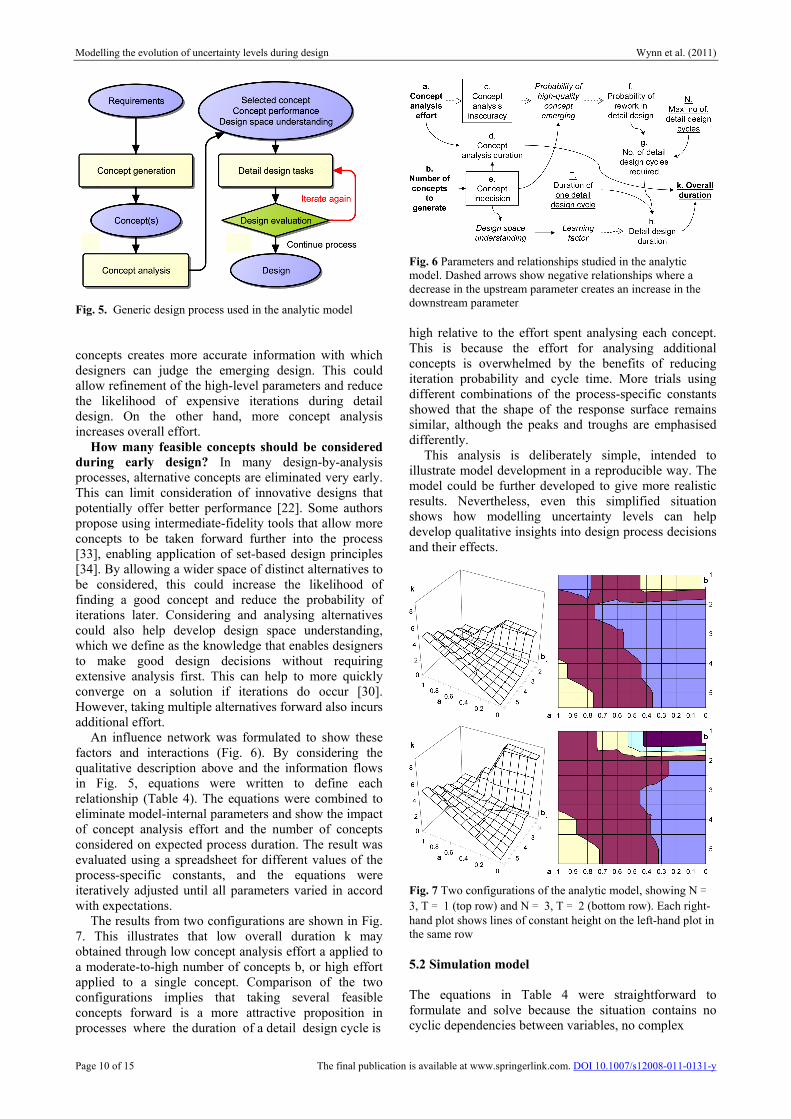
Fig. 5. Generic design process used in the analytic model
concepts creates more accurate information with which
designers can judge the emerging design. This could
allow refinement of the high-level parameters and reduce
the likelihood of expensive iterations during detail
design. On the other hand, more concept analysis
increases overall effort.
How many feasible concepts should be considered
during early design? In many design-by-analysis
processes, alternative concepts are eliminated very early.
This can limit consideration of innovative designs that
potentially offer better performance [22]. Some authors
propose using intermediate-fidelity tools that allow more
concepts to be taken forward further into the process
[33], enabling application of set-based design principles
[34]. By allowing a wider space of distinct alternatives to
be considered, this could increase the likelihood of
finding a good concept and reduce the probability of
iterations later. Considering and analysing alternatives
could also help develop design space understanding,
which we define as the knowledge that enables designers
to make good design decisions without requiring
extensive analysis first. This can help to more quickly
converge on a solution if iterations do occur [30].
However, taking multiple alternatives forward also incurs
additional effort.
An influence network was formulated to show these
factors and interactions (Fig. 6). By considering the
qualitative description above and the information flows
in Fig. 5, equations were written to define each
relationship (Table 4). The equations were combined to
eliminate model-internal parameters and show the impact
of concept analysis effort and the number of concepts
considered on expected process duration. The result was
evaluated using a spreadsheet for different values of the
process-specific constants, and the equations were
iteratively adjusted until all parameters varied in accord
with expectations.
The results from two configurations are shown in Fig.
7. This illustrates that low overall duration k may
obtained through low concept analysis effort a applied to
a moderate-to-high number of concepts b, or high effort
applied to a single concept. Comparison of the two
configurations implies that taking several feasible
concepts forward is a more attractive proposition in
processes where the duration of a detail design cycle is
Fig. 6 Parameters and relationships studied in the analytic
model. Dashed arrows show negative relationships where a
decrease in the upstream parameter creates an increase in the
downstream parameter
high relative to the effort spent analysing each concept.
This is because the effort for analysing additional
concepts is overwhelmed by the benefits of reducing
iteration probability and cycle time. More trials using
different combinations of the process-specific constants
showed that the shape of the response surface remains
similar, although the peaks and troughs are emphasised
differently.
This analysis is deliberately simple, intended to
illustrate model development in a reproducible way. The
model could be further developed to give more realistic
results. Nevertheless, even this simplified situation
shows how modelling uncertainty levels can help
develop qualitative insights into design process decisions
and their effects.
Fig. 7 Two configurations of the analytic model, showing N =
3, T = 1 (top row) and N = 3, T = 2 (bottom row). Each right-
hand plot shows lines of constant height on the left-hand plot in
the same row
5.2 Simulation model
The equations in Table 4 were straightforward to
formulate and solve because the situation contains no
cyclic dependencies between variables, no complex
Modelling the evolution of uncertainty levels during design Wynn et al. (2011)
Page 11 of 15 The final publication is available at www.springerlink.com. DOI 10.1007/s12008-011-0131-y
Table 4. Definitions for the relationships shown in Fig. 4
Definition Rationale
hdk += Overall duration k is sum of concept phase duration d and detail phase duration h
bad ×= Concept phase duration d is proportional to effort per concept a and no. of concepts b
∑ =
−−=
g
n
nbTh1
)1(
Baseline duration T reduces by learning factor that is inv. prop. to b, on each of g cycles
∑ =−=
N
n
nfceilg1
))0,2.0(max( Detail design will be complete in g cycles with 80% confidence, max. N cycles allowed
1)1( −×−= bcf
Probability f of detail design rework is proportional to concept analysis accuracy (1-c)
and inv. proportional to no. of concepts considered b 5.0ac =
Increases in effort a give diminishing returns to accuracy
The independent variables are a and b. The dependent variable is k. Process-specific constants are T and N (also 0.2 and 0.5). All
other parameters are internal to the model
flows between tasks, no resource dependencies, and
because uncertainty levels do not change over time.
The wing design process model shown in Fig. 2 was
revisited to show how discrete-event simulation can more
closely incorporate the features and complexity of a real-
life process. Most of this diagram maps to the right-hand
column of Fig. 5. To configure the more complex model
for simulation, the first step was to identify the main
factors that drive iterations. To do this we drew on the
work of Jarrett et al. [31], who explain how each method
used in a design-by- analysis process is suitable for a
given point in the design process, because it requires
certain confidence in input data and confers a particular
level of accuracy on the solution.
For a particular set of analyses, the candidate design
undergoes iterations to consider how changes impact a
particular set of objectives. During iterations,
performance levels can remain ‘stagnant’ but
understanding about the design space is progressively
generated. Eventually, the improved understanding
allows designers to make a change that creates a ‘surge’
in design performance [31]. For the next iterations,
additional objectives may be considered and more
accurate methods may be used.
To model this situation, the wing design process was
considered to comprise an execution process nested
within a management layer, and to execute in cycles. The
management layer defines the work that will be
performed on a given cycle. These instructions are
passed to the execution process, which determines how
long the work will take. The execution process will
repeat until enough design space understanding is
generated to meet the specified objectives. Control is
then passed back to the management layer, which sets up
the next cycle. This model is shown in Fig. 8. Our
modelling software allows the central box to be expanded
to show the detail of Fig. 2.
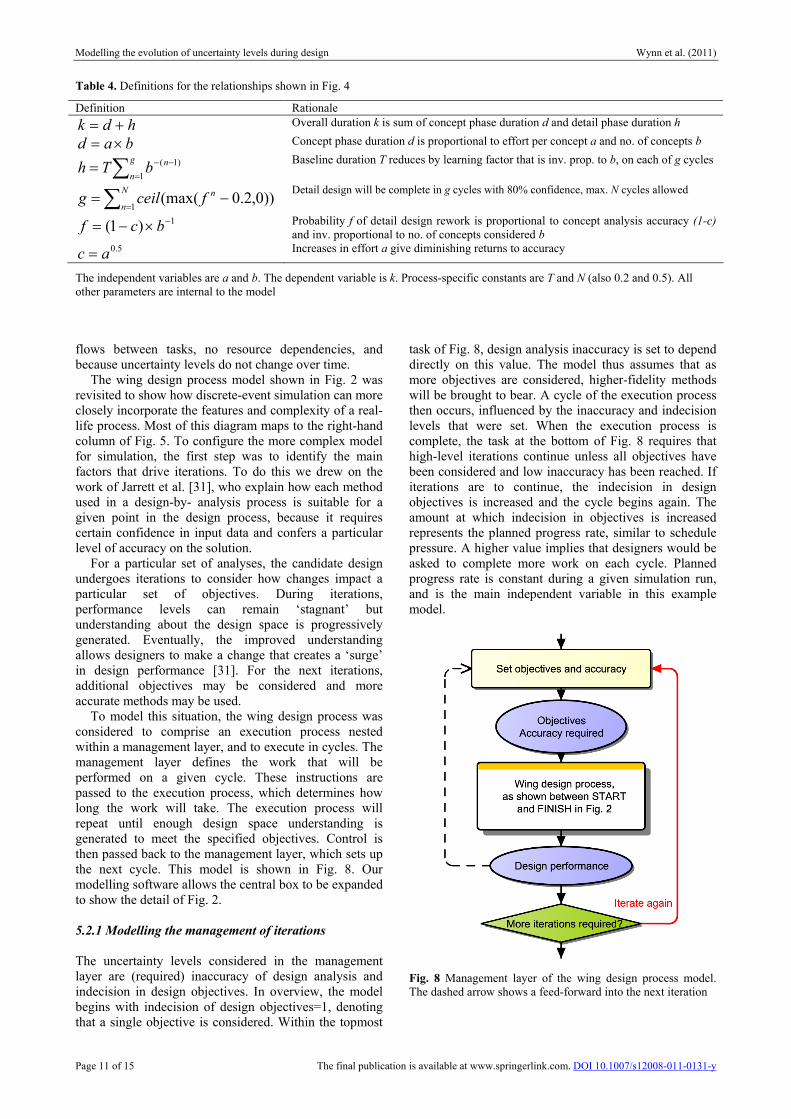
5.2.1 Modelling the management of iterations
The uncertainty levels considered in the management
layer are (required) inaccuracy of design analysis and
indecision in design objectives. In overview, the model
begins with indecision of design objectives=1, denoting
that a single objective is considered. Within the topmost
task of Fig. 8, design analysis inaccuracy is set to depend
directly on this value. The model thus assumes that as
more objectives are considered, higher-fidelity methods
will be brought to bear. A cycle of the execution process
then occurs, influenced by the inaccuracy and indecision
levels that were set. When the execution process is
complete, the task at the bottom of Fig. 8 requires that
high-level iterations continue unless all objectives have
been considered and low inaccuracy has been reached. If
iterations are to continue, the indecision in design
objectives is increased and the cycle begins again. The
amount at which indecision in objectives is increased
represents the planned progress rate, similar to schedule
pressure. A higher value implies that designers would be
asked to complete more work on each cycle. Planned
progress rate is constant during a given simulation run,
and is the main independent variable in this example
model.
Fig. 8 Management layer of the wing design process model.
The dashed arrow shows a feed-forward into the next iteration
Modelling the evolution of uncertainty levels during design Wynn et al. (2011)
Page 12 of 15 The final publication is available at www.springerlink.com. DOI 10.1007/s12008-011-0131-y
5.2.2 Modelling the execution of iterations
The behaviour of the execution process is governed by
the inaccuracy of design space understanding as well as
the two uncertainty levels discussed above. The first task
in Fig. 2 receives these uncertainty levels directly from
the management layer. These affect its outputs which are
passed to its successors, and so on.
Each task in Fig. 2 was considered to determine how
its properties would change according to its input
uncertainty levels. Higher levels of input indecision
generally require more time for design tasks because all
the issues must be considered by a designer. Lower levels
of input inaccuracy require more time for analysis tasks,
because computationally-expensive methods must be
used.
In reality, tasks that determine high-level parameters
are completed early in the process. We thus configured
these tasks to be executed only when inaccuracy of
design analysis is higher than a specified value. Certain
descriptions and their uncertainty levels are therefore
progressively ‘frozen’ once certain levels of inaccuracy
are reached. Those levels are then passed forward to all
future iterations. Similarly, some analysis tasks are only
attempted when the inaccuracy is low.
At the end of an execution process cycle, inaccuracy
in design space understanding is reduced. A formula was
defined assuming that design space understanding
relevant to meet the current objectives is a sum of
‘general design space understanding’ and ‘problem-
specific design space understanding’. The former
increases slowly, according to the number of execution
iterations undertaken in total until that point. The latter
increases more rapidly, according to the number of
iterations undertaken so far within the current cycle.
Inclusion of the ‘general design space understanding’
ensures that all cycles derive some benefit from the
knowledge gained in prior explorations. This is similar to
the learning factor incorporated in the analytic model
discussed previously.
If the design space understanding reaches the required
accuracy of design analysis, the execution process has
met its objective and passes control back to the
management layer. Otherwise, the execution process will
be repeated.
5.2.3 Simulation
A discrete-event Monte-Carlo simulation algorithm
based on the Applied Signposting approach [17] was
used to evaluate the model. In overview:
– All tasks for which every input exists, at least one
input is marked as ‘recently updated’, and for which
no ‘upstream’ work is pending, are identified to
start.
– The duration of each task thus identified is
determined according to the uncertainty levels in its
inputs. The task’s inputs are each marked as ‘already
considered’.
– The simulation clock is advanced to the next time at
which one or more tasks are marked for completion.
If no such tasks are found, the algorithm terminates.
– Each completing task is considered. If that task has
multiple outputs, a single output is chosen according
to the task definition and uncertainty levels in inputs.
All deliverables for the selected output are marked
as ‘recently updated’, and their uncertainty levels are
updated as specified in the task definition.
– The first step is revisited.
Simulation creates a profile of possible processes, each
indicating which tasks were in execution in which times
and how the uncertainty levels evolve. Alternative model
configurations may be generated and analysed to explore
many different issues relating to the process and its
management.
5.2.4 Illustrative analysis
In our example model, the planned progress rate
determines how quickly analysis of the different design
objectives should be factored into the process. If planned
progress rate is very high, many objectives are
considered from the outset of design. The model then
implies that design space understanding may initially be
insufficient to make decisions that meet those objectives.
Effort-intensive iterations considering the multiple
objectives will then be required to build up the
understanding. On the other hand, if the various
objectives are incorporated too slowly, effort may be
wasted if each iteration of the execution process is not
used to full capacity.
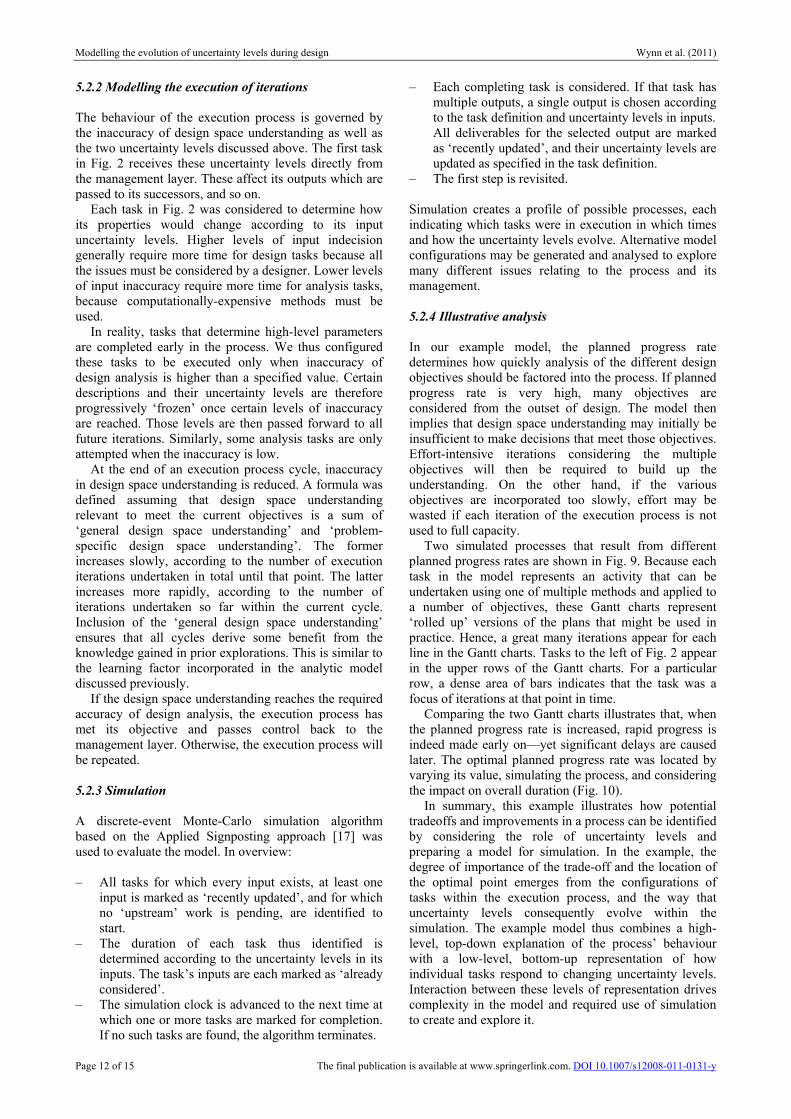
Two simulated processes that result from different
planned progress rates are shown in Fig. 9. Because each
task in the model represents an activity that can be
undertaken using one of multiple methods and applied to
a number of objectives, these Gantt charts represent
‘rolled up’ versions of the plans that might be used in
practice. Hence, a great many iterations appear for each
line in the Gantt charts. Tasks to the left of Fig. 2 appear
in the upper rows of the Gantt charts. For a particular
row, a dense area of bars indicates that the task was a
focus of iterations at that point in time.
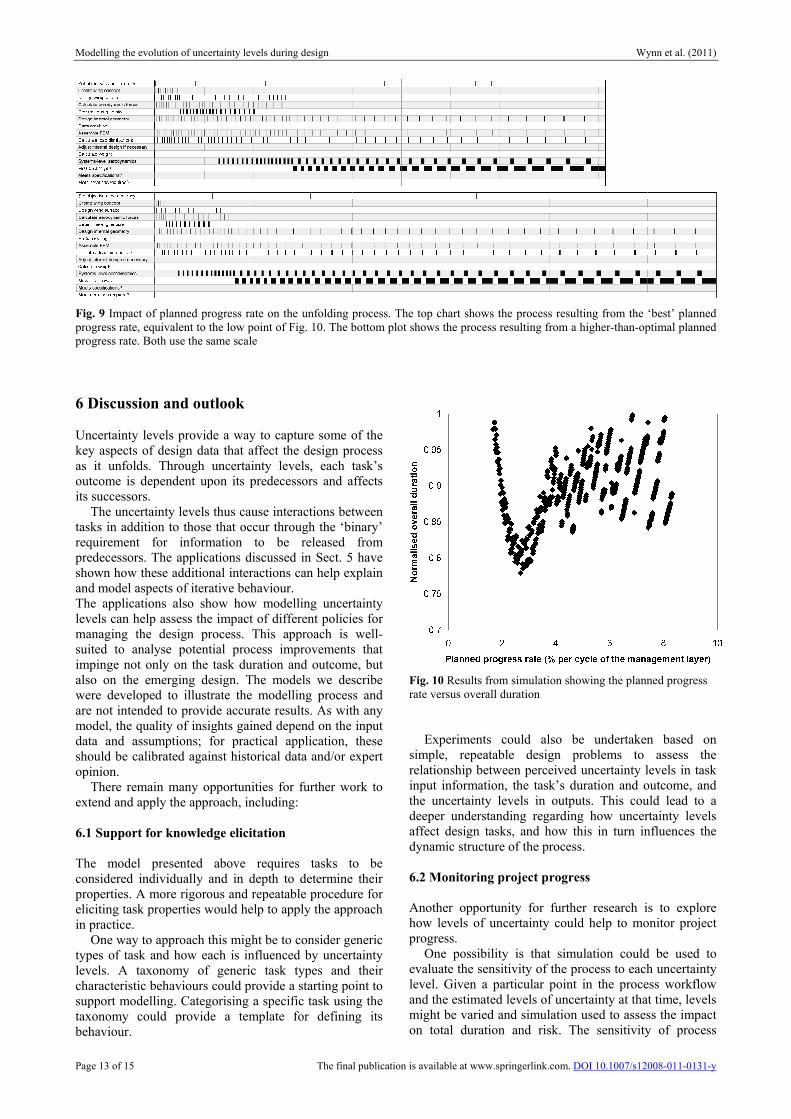
Comparing the two Gantt charts illustrates that, when
the planned progress rate is increased, rapid progress is
indeed made early on—yet significant delays are caused
later. The optimal planned progress rate was located by
varying its value, simulating the process, and considering
the impact on overall duration (Fig. 10).
In summary, this example illustrates how potential
tradeoffs and improvements in a process can be identified
by considering the role of uncertainty levels and
preparing a model for simulation. In the example, the
degree of importance of the trade-off and the location of
the optimal point emerges from the configurations of
tasks within the execution process, and the way that
uncertainty levels consequently evolve within the
simulation. The example model thus combines a high-
level, top-down explanation of the process’ behaviour
with a low-level, bottom-up representation of how
individual tasks respond to changing uncertainty levels.
Interaction between these levels of representation drives
complexity in the model and required use of simulation
to create and explore it.
Modelling the evolution of uncertainty levels during design Wynn et al. (2011)
Page 13 of 15 The final publication is available at www.springerlink.com. DOI 10.1007/s12008-011-0131-y
Fig. 9 Impact of planned progress rate on the unfolding process. The top chart shows the process resulting from the ‘best’ planned
progress rate, equivalent to the low point of Fig. 10. The bottom plot shows the process resulting from a higher-than-optimal planned
progress rate. Both use the same scale
6 Discussion and outlook
Uncertainty levels provide a way to capture some of the
key aspects of design data that affect the design process
as it unfolds. Through uncertainty levels, each task’s
outcome is dependent upon its predecessors and affects
its successors.
The uncertainty levels thus cause interactions between
tasks in addition to those that occur through the ‘binary’
requirement for information to be released from
predecessors. The applications discussed in Sect. 5 have
shown how these additional interactions can help explain
and model aspects of iterative behaviour.
The applications also show how modelling uncertainty
levels can help assess the impact of different policies for
managing the design process. This approach is well-
suited to analyse potential process improvements that
impinge not only on the task duration and outcome, but
also on the emerging design. The models we describe
were developed to illustrate the modelling process and
are not intended to provide accurate results. As with any
model, the quality of insights gained depend on the input
data and assumptions; for practical application, these
should be calibrated against historical data and/or expert
opinion.
There remain many opportunities for further work to
extend and apply the approach, including:
6.1 Support for knowledge elicitation
The model presented above requires tasks to be
considered individually and in depth to determine their
properties. A more rigorous and repeatable procedure for
eliciting task properties would help to apply the approach
in practice.
One way to approach this might be to consider generic
types of task and how each is influenced by uncertainty
levels. A taxonomy of generic task types and their
characteristic behaviours could provide a starting point to
support modelling. Categorising a specific task using the
taxonomy could provide a template for defining its
behaviour.
Fig. 10 Results from simulation showing the planned progress
rate versus overall duration
Experiments could also be undertaken based on
simple, repeatable design problems to assess the
relationship between perceived uncertainty levels in task
input information, the task’s duration and outcome, and
the uncertainty levels in outputs. This could lead to a
deeper understanding regarding how uncertainty levels
affect design tasks, and how this in turn influences the
dynamic structure of the process.
6.2 Monitoring project progress
Another opportunity for further research is to explore
how levels of uncertainty could help to monitor project
progress.
One possibility is that simulation could be used to
evaluate the sensitivity of the process to each uncertainty
level. Given a particular point in the process workflow
and the estimated levels of uncertainty at that time, levels
might be varied and simulation used to assess the impact
on total duration and risk. The sensitivity of process
Modelling the evolution of uncertainty levels during design Wynn et al. (2011)
Page 14 of 15 The final publication is available at www.springerlink.com. DOI 10.1007/s12008-011-0131-y
duration to change in a particular uncertainty level could
correspond to the criticality of that level at that point in
time.
This type of analysis could also offer opportunities to
improve project performance, through methods
analogous to critical path management. If critical
uncertainties could be reduced, i.e., by performing
additional design or analysis tasks, this might improve
the performance of the project. Conversely, expending
effort to reduce the levels of less critical uncertainties
might be best avoided.
6.3 Investigating iterative dynamics
Iteration is a key aspect of the design process that makes
it difficult to understand and manage [23]. Understanding
the relationship between observed progress, iterations
and project delivery is thus important to effective design
management.
We suggest this understanding could be improved by
using observations of how uncertainty levels evolve over
time to reveal the behaviour of iterations—for instance,
to assess whether a project is undergoing controlled
refinement iteration or uncontrolled rework. To illustrate,
periodic change in perceived levels of uncertainty might
suggest controlled refinement iterations in which a
design is repeatedly modified, analysed and improved. In
contrast, irregular changes in uncertainty levels might
indicate rework undertaken to correct design errors.
Such analysis could provide another indication of
where effort and resources should be focused to expedite
delivery. Knowing that a project is undergoing iteration
to explore the design space, it might be appropriate to
dedicate resource to analysing the design solutions in
order to more quickly identify a feasible concept.
However, if the dominant form of iteration was rework to
correct errors, effort might instead be focused on the
sources of low quality that initiate problems.
7 Conclusions
It is often very challenging to foresee the causes of
delays and iterations in design. This paper has argued
that iterative design processes unfold in a direction
influenced by the evolution of uncertainty levels within
them. Modelling the relationship between uncertainty
levels and design process outcomes can help understand
the causes of delays, and assist in identifying and
evaluating policies for managing the design process.
The paper makes two main contributions. First, a
conceptual framework highlights the different types of
interdependencies between evolving levels of uncertainty
in the design. Uncertainty levels evolve in a way
influenced by relationships between the aspects of the
design which descriptions represent, the use of multiple,
overlapping descriptions during the design process, and
the process of defining and refining the design.
The second contribution is to show how design
processes can be simulated using task network models
that take into account evolving uncertainty levels. We
propose that task behaviour can be modelled in terms of
the uncertainty levels associated with input descriptions
as well other information and knowledge used to perform
the task. The model captures the bidirectional
relationship between tasks and the uncertainty levels
associated with the emerging design—how the evolution
of uncertainty levels depends on the design process
organisation, and conversely how the process unfolds
dynamically depending upon the uncertainty levels when
decisions are made.
Our approach could provide a mechanism to explore
the impact of product-related uncertainty on design
process performance, and ultimately to better understand
how such risks could be managed. However, the research
reported here is in a relatively early stage, so there is still
much work remaining to refine the modelling approach
and explore potential applications.
Acknowledgments The authors would like to thank
members of the Bath IDMRC who collaborated on the
case study, as well as David Wyatt, Warren Kerley and
the anonymous reviewers.
References
1. Grebici, K., Goh, Y.M., McMahon, C.A.: Uncertainty
and risk reduction in engineering design embodiment
processes. In: Proceedings of the 10th International
Design Conference (2008)
2. Kesseler, E., Vankan, W.J.: Multidisciplinary design
analysis and multi-objective optimisation applied to
aircraft wing. WSEAS Trans. Syst. Control 2(1), 221–
227 (2006)
3. Earl, C.F., Eckert, C.M., Clarkson, P.J.: Predictability
of change in engineering: a complexity view. In:
Proceedings of the ASME International Design
Engineering Technical Conferences (2005)
4. Balachandran, L.K., Guenov,M.D.: Computational
workflow management for conceptual design of complex
systems. AIAA J. Aircr. 47(2), 699–704 (2010)
5. Thunnissen, D.P.: Propagating and Mitigating
uncertainty in the design of complex multidisciplinary
systems. Ph.D. thesis, California Institute of Technology
(2005)
6. Earl, C.F., Johnson, J., Eckert, C.M.: Complexity. In:
Clarkson, P.J., Eckert, C.M. (eds.) Design Process
Improvement—A Review of Current Practice, pp. 174–
197. Springer, London (2005)
7. Smithson, M.: Ignorance and Uncertainty: Emerging
Paradigms. Springer, New York (1989)
8. Pons, D.J., Raine, J.K.: Design with uncertain
qualitative variables under imperfect knowledge. Proc.
Inst. Mech. Eng. Part B J. Eng. Manuf. 218(8), 977–986
(2004)
9. Oberkampf, W.L., Helton, J.C., Joslyn, C.A.,
Wojtkiewicz, S.F., Ferson, S.: Challenge problems:
uncertainty in system response given uncertain
parameters. Reliab. Eng. Syst. Saf. 85(1–3), 11–19
(2004)
10. Mourelatos, Z., Zhou, J.: Reliability estimation and
design with insufficient data based on possibility theory.
AIAA J. 43(8), 1696–1705 (2005)
Modelling the evolution of uncertainty levels during design Wynn et al. (2011)
Page 15 of 15 The final publication is available at www.springerlink.com. DOI 10.1007/s12008-011-0131-y
11. McManus, H., Hastings, D.: A framework for
understanding uncertainty and its mitigation and
exploitation in complex systems. IEEE Eng. Manag. Rev.
34(3), 81–94 (2006)
12. Chalupnik, M.J., Wynn, D.C., Clarkson, P.J.:
Approaches to mitigate the impact of uncertainty in
development processes. In: Proceedings of the 17th
International Conference on Engineering Design, vol. 1,
pp. 459–570 (2009)
13. Eversheim, W., Roggatz, A., Zimmermann, H.-J.,
Derichs, T.: Information management for concurrent
engineering. Eur. J. Oper. Res. 100(2), 253–265 (1997)
14. Nilsen, T., Aven, T.: Models and model uncertainty
in the context of risk analysis. Reliab. Eng. Syst. Saf.
79(3), 309–317 (2003)
15. Zimmermann, H.J.: An application-oriented view of
modeling uncertainty. Eur. J. Oper. Res. 122(2), 190–198
(2000)
16. Ordaz-Hernandez, K., Fischer, X., Bennis, F.: A
mathematical representation for mechanical model
assessment: numerical model qualification method. Int. J.
Comput. Math. Sci. 1(4), 216– 226 (2007)
17. Wynn, D.C., Eckert C.M., Clarkson, P.J.: Applied
signposting: a modeling framework to support design
process improvement. In: Proceedings of the ASME
International Design Engineering Technical Conferences
(2006)
18. Browning, T.R., Eppinger, S.D.: Modeling impacts of
process architecture on cost and schedule risk in product
development. IEEE Trans. Eng. Manag. 49(4), 428–442
(2002)
19. Krishnan, V., Eppinger, S.D., Whitney, D.E.: A
model-based framework to overlap product development
activities. Manag. Sci. 43(4), 437–451 (1997)
20. O’Donovan, B.D., Eckert, C.M., Clarkson, P.J.:
Simulating design processes to assist in design process
planning. In: Proceedings of the ASME Design
Engineering Technical Conferences (2004)
21. Lévárdy, V., Browning, T.R.: An adaptive process
model to support product development project
management. IEEE Trans. Eng. Manag. 56(4), 600–620
(2009)
22. Wyatt, D.F., Wynn, D.C., Jarrett, J.P., Clarkson, P.J.:
Supporting product architecture design using
computational design synthesis using network structure
constraints. Res. Eng. Des. 23(1), 17–52 (2012).
23. Wynn, D.C., Eckert, C.M., Clarkson, P.J.: Modelling
iteration in engineering design. In: Proceedings of the
17th International Conference on Engineering Design
(2007)
24. Goh, Y.M., McMahon, C.A., Booker, J.: Improving
confidence in simulation-based design through error
functions. In: Proceedings of the ASME International
Design Engineering Technical Conferences (2007)
25. Sébastian, P., Ledoux, Y.: Decision support systems
in preliminary design. Int. J. Interact. Des. Manuf. 3(4),
223–226 (2009)
26. Sébastian, P., Chenouard, R., Nadeau, J.-P., Fischer,
X.: The embodiment design constraint satisfaction
problem of the BOOTSTRAP facing interval analysis
and genetic algorithm based decision support tools. Int. J.
Interact. Des. Manuf. 1(2), 99–106 (2007)
27. Antonsson, E., Otto, K.N.: Imprecision in
engineering design. ASME J. Mech. Des. 117(B), 25–32
(1995)
28. Evans, J.H.: Basic design concepts. J. Am. Soc. Nav.
Eng. 71(4), 671–678 (1959)
29. Eppinger, S.D.: Model-based approaches to
managing concurrent engineering. J. Eng. Des. 2(4),
283–290 (1991)
30. Jarrett, J.P., Dawes, W.N., Clarkson, P.J.: An
approach to integrated multi-disciplinary turbomachinery
design. ASME J. Turbomach. 129(3), 488–494 (2007)
31. Jarrett, J.P., Clarkson, P.J.: The surge-stagnate model
for complex design. J. Eng. Des. 13(3), 189–196 (2002)
32. Eckert, C.M., Clarkson, P.J., Zanker, W.: Change and
customization in complex engineering domains. Res.
Eng. Des. 15(1), 1–21 (2004)
33. Bell, C.P., Clarkson, P.J., Dawes,W.N.: Improving
the turbine cooling conceptual design process. In:
Proceedings of the ASME Turbo Expo 2008, Berlin,
Germany, 9–13 May 2008
34. Sobek, D.K. II., Ward, A.C., Liker, J.K.: Toyota’s
principles of set-based concurrent engineering. Sloan
Manag. Rev. 40(2), 67–83 (1999)