Datastream Chart Studio - Refinitiv
2
Datastream Chart Studio WHY SHOULD I USE THE APP? Datastream Chart Studio in Thomson Reuters Eikon simplifies the graphical exploration of trends and relationships between series. The intuitive interface of Datastream Chart Studio makes it easy to retrieve and analyse any of the series available in Datastream, from private equity indices to exchange traded funds to commodity prices. The Datastream Add-In for Microsoft Office (DFO) allows data series and charts to be transferred and edited in Excel, Word and PowerPoint. KEY FACTS • Datastream Chart Studio gives you access to the world’s most comprehensive historical numerical financial database, covering more than 360 million time series of multiple asset classes with history going back as far as 1950 for some economic series • Use different charts: scatter, pie, doughnut, bar, multi-pane, fan, and area • Create sophisticated charts with a wealth of features such as correlation, slicing, axis markers, recession bands, interactive annotations, substitutable text, add your own forecasts, user created indices and more • Vast library of fully customizable analytical functions & expressions • Apply pre-built or user created styles to your charts to easily match your in-house chart style • Store charts, styles and templates in the Library and share them with colleagues as required • Export refreshable charts to Microsoft Office applications • The Chartbook provides a unique repository of ready-to-use charts and analytical content. Created by experts, always up-to-date and not available anywhere else it covers more than 170 countries and regions as well as topical themes • Fully integrated into Eikon Create your own charts, save them to the Library, access Key Indicators, Chartbook and News in Charts Export charts and data to MS Office Find series, data-types and stored expressions Apply mathematical and statistical formulae with a mouse click
Transcript of Datastream Chart Studio - Refinitiv
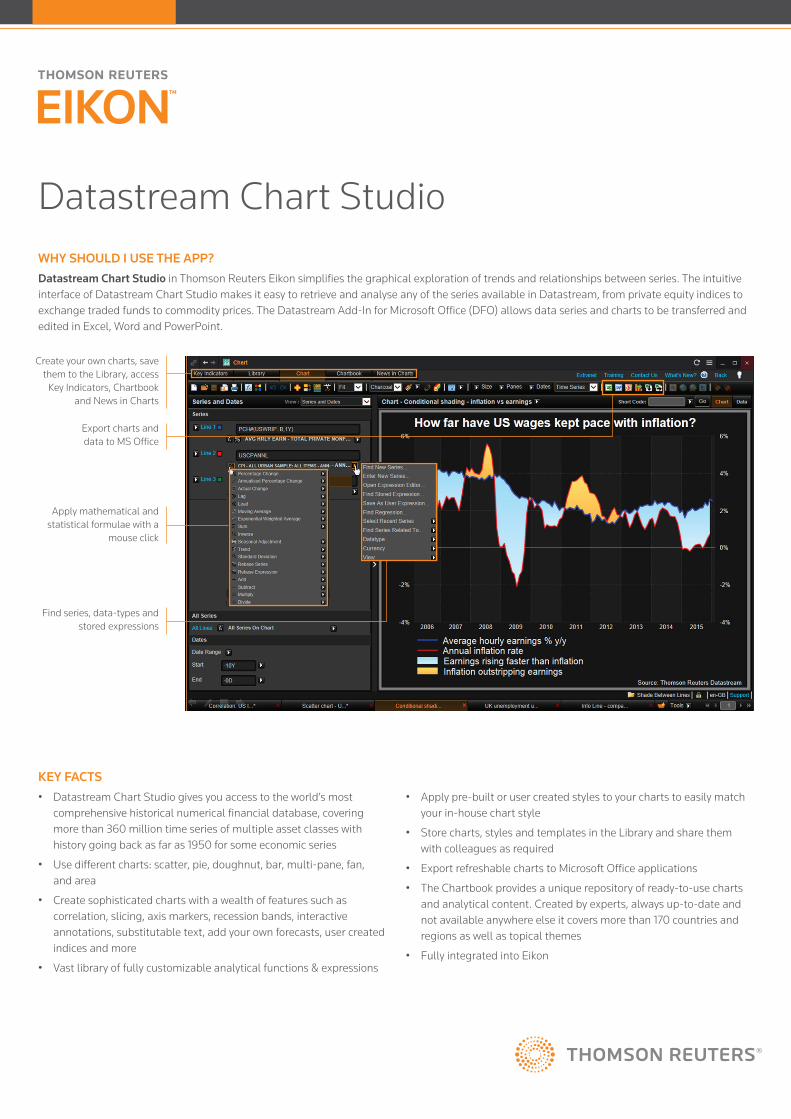
Datastream Chart StudioWHY SHOULD I USE THE APP?Datastream Chart Studio in Thomson Reuters Eikon simplifies the graphical exploration of trends and relationships between series. The intuitive interface of Datastream Chart Studio makes it easy to retrieve and analyse any of the series available in Datastream, from private equity indices to exchange traded funds to commodity prices. The Datastream Add-In for Microsoft Office (DFO) allows data series and charts to be transferred and edited in Excel, Word and PowerPoint.
KEY FACTS• Datastream Chart Studio gives you access to the world’s most
comprehensive historical numerical financial database, covering more than 360 million time series of multiple asset classes with history going back as far as 1950 for some economic series
• Use different charts: scatter, pie, doughnut, bar, multi-pane, fan, and area
• Create sophisticated charts with a wealth of features such as correlation, slicing, axis markers, recession bands, interactive annotations, substitutable text, add your own forecasts, user created indices and more
• Vast library of fully customizable analytical functions & expressions
• Apply pre-built or user created styles to your charts to easily match your in-house chart style
• Store charts, styles and templates in the Library and share them with colleagues as required
• Export refreshable charts to Microsoft Office applications
• The Chartbook provides a unique repository of ready-to-use charts and analytical content. Created by experts, always up-to-date and not available anywhere else it covers more than 170 countries and regions as well as topical themes
• Fully integrated into Eikon
Create your own charts, save them to the Library, access
Key Indicators, Chartbook and News in Charts
Export charts and data to MS Office
Find series, data-types and stored expressions
Apply mathematical and statistical formulae with a
mouse click

TOP TIPS ON HOW TO USE THE APP• To access Datastream Chart Studio enter “Chart Studio” in the
search box and select it from the search results.
• To find a series just type a word and select from the provided options:
• Chart Studies provide quick and easy access to commonly used valuation, performance, technical and fundamentals charts. Enter “Studies” in the search box and select it from the search results:
• Simply click on the chart to change titles, legends, formatting, substitutable text and more
• The correlation tool lets you uncover correlations between series with a few mouse clicks
• Use the Key Indicators tab to view the most important economic time series:
• To search the whole database hover over the flyout, select “Find New Series” and use the intuitive free text search: type your search terms and select from the results.
NEED HELP?You can contact us directly through Messenger using the Customer Support contact.
To learn more about Datastream: training.thomsonreuters.com/eikon4/?mkt=271
You can access our entire blended learning offer on the Training site: training.thomsonreuters.com/
Visit financial.tr.com/eikon
For more information, contact your representative or visit us online.
© 2016 Thomson Reuters. S032095 04/16.