DATA SERIES Safety performance indicators 2014 data
146
REPORT 2014s JUNE 2015 DATA SERIES Safety performance indicators – 2014 data
Transcript of DATA SERIES Safety performance indicators 2014 data

REPORT
2014sJUNE2015
DATA SERIES
Safety performance indicators – 2014 data

Disclaimer
Whilst every effort has been made to ensure the accuracy of the information contained in this publication, neither IOGP nor any of its Members past present or future warrants its accuracy or will, regardless of its or their negligence, assume liability for any foreseeable or unforeseeable use made thereof, which liability is hereby excluded. Consequently, such use is at the recipient’s own risk on the basis that any use by the recipient constitutes agreement to the terms of this disclaimer. The recipient is obliged to inform any subsequent recipient of such terms.
This publication is made available for information purposes and solely for the private use of the user. IOGP will not directly or indirectly endorse, approve or accredit the content of any course, event or otherwise where this publication will be reproduced.
Copyright notice
The contents of these pages are ©International Association of Oil & Gas Producers. Permission is given to reproduce this report in whole or in part provided (i) that the copyright of IOGP and (ii) the sources are acknowledged. All other rights are reserved. Any other use requires the prior written permission of IOGP.
These Terms and Conditions shall be governed by and construed in accordance with the laws of England and Wales. Disputes arising here from shall be exclusively subject to the jurisdiction of the courts of England and Wales.
AcknowledgementsSafety Committee
Photography used with permission courtesy of ©psphotograph/iStockphoto (Back cover)

Revision history
VERSION DATE AMENDMENTS
1.0 June 2015 First release
REPORT
2014sJUNE2015
DATA SERIES
Safety performance indicators – 2014 data

4Safety performance indicators – 2014 data
Contents
Contents 4
Contributing companies 6
Executive summary 7
Introduction and background 9
1. Summary of 2014 results 111.1 General 111.2 Fatalities 121.3 Total recordable injuries 151.4 Lost time injuries 16
2. Overall results 192.1 Fatalities 192.2 Fatal accident rate (FAR) 202.3 Fatalities by incident category and activity 222.4 Number of fatal incidents per 100 million work hours 282.5 Total recordable injury rate (TRIR) 302.6 Lost time injury frequency (LTIF) 322.7 Lost work day case categories and activities 342.8 Severity of lost work day cases 432.9 Severity of restricted work day cases 462.10 Incident triangles 492.11 Causal factors 522.12 Life-Saving Rules 58
3. Results by region 613.1 Fatalities 613.2 Fatal accident rate (FAR) 623.3 Total recordable injury rate (TRIR) 633.4 Lost time injury frequency (LTIF) 643.5 FAR, TRIR and LTIF 5-year rolling averages 653.6 Severity of lost work day cases 673.7 Individual country performance 693.8 Incident triangles by region 72
4. Results by function 764.1 Fatalities 764.2 FAR, LTIF and TRIR – five-year rolling averages 77

5
4.3 Severity of lost work day cases (LWDC) 794.4 Exploration performance 794.5 Drilling performance 824.6 Production performance 854.7 Construction performance 884.8 Unspecified performance 91
5. Results by company 945.1 Overall company results 945.2 Company results by function 102
Appendix A 104Database dimensions 104Proportion of database used in analysis 107
Appendix B - Data tables 109Section 1 Summary 110Section 2 Overall results 110Section 3 Results by region 114Section 4 Results by function 123Section 5 Results by company 129
Appendix C – Contributing companies 133
Appendix D – Countries represented 135
Appendix E – Glossary of terms 139

6Safety performance indicators – 2014 data
Contributing companies
The safety statistics for 2014 were derived from data provided by the following companies:
ADNOC
ANADARKO
BASHNEFT
BG GROUP
BHP BILLITON
BP
CAIRN ENERGY
CAIRN INDIA
CHEVRON
CNOOC
CONOCOPHILLIPS
DOLPHIN ENERGY
DONG E&P
E.ON
ENI
EXXONMOBIL
GALP
GDF SUEZ E&P INTERNATIONAL
GENEL
HESS CORPORATION
HUSKY
INPEX
KOSMOS
KUWAIT OIL COMPANY
MAERSK OIL
MARATHON OIL COMPANY
MOL
OIL SEARCH
OMV
ORIGIN
PAN AMERICAN ENERGY
PEMEX
PERENCO
PETROBRAS
PETRONAS CARIGALI SDN BHD
PLUSPETROL
PREMIER OIL
PTTEP
QATAR PETROLEUM
RASGAS
REPSOL
RWE DEA AG
SASOL
SHELL COMPANIES
STATOIL
SUNCOR
TALISMAN ENERGY
TOTAL
TULLOW OIL
WINTERSHALL
WOODSIDE
YEMEN LNG

7Executive summary
Executive summary
The 2014 IOGP Safety Performance Indicators show that the fatal accident rate for reporting companies has decreased by 51% compared with 2013. The number of fatalities has decreased from 80 in 2013 to 45 in 2014.
0
20
40
60
80
100
120
140
20142013201220112010200920082007200620050.0
0.5
1.0
1.5
2.0
2.5
3.0
3.5
4.0
4.5
2014201320122011201020092008200720062005
Num
ber o
f fat
aliti
es
FAR
fata
litie
s pe
r 100
mill
ion
hour
s w
orke
d
84
115 103
87
8880
45
99 94
65
Fatal accident rate (FAR)Fatalities
Figure 1: Number of fatalities and fatal accident rate (2005–2014)
Analysis of the 42 fatal incident descriptions in which there were 45 fatalities has shown that at least 78% of the fatal incidents reported in 2014 related to the OGP Life-Saving Rules published in March 2012, see IOGP Report 459.
Insufficient information to assign a Rule 17%
No appropriate Rule 5%
Supplementary Rule 40%
Core Rule 38%
Figure 2: Life-Saving Rules applicable to 2014 fatal incidents - % of total incidents reported in 2014

8Safety performance indicators – 2014 data
There are a number of common causal factors related to the fatal incidents and high potential events from 2010 to 2014. The following five causal factors appear consistently in the top ten for both fatal incidents and high potential events for each of the past five years.
• PROCESS (CONDITIONS): Organizational: Inadequate training/competence • PEOPLE (ACTS): Inattention/lack of awareness: Improper decision making or
lack of judgement• PROCESS (CONDITIONS): Organizational: Inadequate work standards/
procedures • PROCESS (CONDITIONS): Organizational: Inadequate supervision• PROCESS (CONDITIONS): Organizational: Inadequate hazard identification or
risk assessment.
The 4th most common causal factor for fatal incidents, which did not show in the top ten for high potential events was:
• PEOPLE (ACTS): Following procedures: Improper position (line of fire).
Personal injury performance shows the lost time injury frequency decreasing by 20% and the total recordable injury rate decreasing by 4% compared with 2013 results.
Five fatal incidents were as a result of process safety events.
0.0
0.5
1.0
1.5
2.0
2.5
3.0
3.5
2014201320122011201020092008200720062005
LTIF
and
TRI
R (p
er m
illio
n ho
urs
wor
ked)
Total recordable injury rate Lost time injury frequency
Figure 3: Lost time injury frequency vs. total recordable injury rate (2005–2014)

9Introduction & background
Introduction and background
The International Association of Oil & Gas Producers, IOGP, has been collecting safety incident data from its member companies globally since 1985. The data collected are entered into the IOGP safety database, which is the largest database of safety performance in the exploration and production (E&P) industry.
The principal purpose of the data collection and analysis is to record the global safety performance of the contributing IOGP member companies on an annual basis. The submission of data is voluntary and is not mandated by IOGP membership. The annual reports provide trend analysis, benchmarking and the identification of areas and activities on which efforts should be focused to bring about the greatest improvements in performance.
The IOGP incident reporting system covers worldwide E&P operations, both onshore and offshore, and includes incidents involving both member companies and their contractor employees.
The key indicators presented are: number of fatalities, fatal accident rate, fatal incident rate, total recordable injury rate, lost time injury frequency, number of lost work day cases and number of lost work days, number of restricted duty case and restricted duty days, and number of medical treatment cases. The report presents contributing IOGP Members’ global results for these indicators, which are then analysed by region, function and company. A code is used to preserve the anonymity of the reporting company, which will typically report its own data as well as that of its associated contractors (see Appendix C).
In 2010, data collection was initiated to capture 'causal factors' associated with fatal incidents and high potential events. These data are presented in section 2.11 of this report. Wherever practicable, results are presented graphically. The data underlying the charts are presented in Appendix B. The causal factors and chart data are available to IOGP Members in editable format from the Members’ area of the IOGP website.
This report is published with two separate addendums which provide the narrative descriptions for the fatal incidents and high potential events reported by participating IOGP member companies. These can be downloaded from the IOGP public website http://info.iogp.org/, as well as the IOGP Safety Zone website http://info.iogp.org/safety.

10Safety performance indicators – 2014 data
Scope of reporting and data validationThe data requested from participating IOGP member companies are published in an annual user guide in two parts:
• Part A contains definitions and the scope of the safety data submission. This document is published on the IOGP public website.
• Part B contains practical information for the company nominees submitting the data, copies of the data submission forms and a data submission checklist.
The safety data submission process is used for the collection of data relating to safety performance, process safety performance and motor vehicle crashes. The IOGP safety database has built-in data validation requirements and each company data submission is validated by the IOGP Secretariat and the work group (Safety Committee, Sub-committee, Task Force or Network) responsible for the data set in accordance with the IOGP data collection and reporting procedure. Any communication with reporting companies is conducted by the IOGP Secretariat and any data validated by an IOGP workgroup is blind coded to preserve the anonymity of the reporting companies.
A self-assessment questionnaire is included within the data submission process to determine the alignment between the requested data and the company submissions. The information provided in this questionnaire is also used in the validation process. Data that appear to be incorrect and that cannot be confirmed by the submitting company as correct may be excluded from the data set at the discretion of the Secretariat.
The scope of data included within this report is detailed in Appendix A.
Data seriesOther IOGP data reports published annually include:
• Environmental performance indicators• Health performance indicators• Process safety event data.
These are available from the IOGP website http://www.iogp.org/Our-library/

11Summary of 2014 results
1. Summary of 2014 results
Safety performance indicators – 2014 data summarizes the safety performance of contributing IOGP member companies for 2014.
The key performance indicators (KPI) used to benchmark safety performance are: number of fatalities, fatal accident and incident rates, total recordable injury rate and lost time injury frequency.
Third party fatalities are not included in this report.
1.1 GeneralThe safety performance of contributing IOGP member companies in 2014 is based on the analysis of 4 366 million work hours of data.
Submissions were made by 52 of the 58 operating company IOGP Members.
The data reported cover operations in 111 countries.
0
500
1000
1500
2000
2500
3000
3500
4000
4500
5000
201420102005200019951990198502468101214161820
Num
ber o
f wor
k ho
urs
(mill
ions
)
FAR
(fata
litie
s pe
r 100
mill
ion
hour
s w
orke
d)
Company Contractor Fatal accident rate
Figure 4: Reported work hours and fatal accident rate (1985–2014)
DefinitionsFatal accident rate (FAR): The number of company/contractor fatalities per 100 million hours worked
Lost time injury frequency (LTIF): The number of lost time injuries (fatalities + lost work day cases) per million hours worked.
Total recordable injury rate (TRIR): The number of recordable injuries (fatalities + lost work day cases + restricted work day cases + medical treatment cases) per million hours worked.

12Safety performance indicators – 2014 data
1.2 FatalitiesAgainst the background of a 16% increase in work hours reported, the number of fatalities has decreased from 80 in 2013 to 45 in 2014. The 45 fatalities occurred in 42 separate incidents. The resulting fatal accident rate (FAR) of 1.03 is 51% lower than last year’s figure (2.12). The company and contractor FAR are 0.53 and 1.17 respectively. Onshore and offshore FAR are 0.96 and 1.22 respectively.
Each reported fatal incident is allocated a work activity and incident category. The activity with the highest number of fatalities reported by the IOGP member companies is ‘drilling, workover, well services‘ (36%) with 16 fatalities as a result of 14 separate incidents. Six fatalities (13%) were reported in six separate incidents in the ‘construction, commissioning, decommissioning’ activity and also in the ‘lifting, crane, rigging, deck operations’ activity. Six fatalities (13%) were reported in five separate incidents in the ‘transport – land’ activity.
Other 2.2%
Water related 6.7%
Struck by 33.3%
Pressure release 2.2%
Falls 11.1%
Exposure electrical 6.7%
Explosions/burns 20.0%
Confined space 2.2%
Caught between 15.6%
Figure 5: Percentage of fatalities by incident category (2014)

13Summary of 2014 results
Category Number of fatalitiesAssault: Assault or violent act 0Caught between: Caught in, under or between 7Confined space: Confined space 1Cut: Cut, puncture, scrape 0Explosions/burns: Explosions or burns 9Exposure electrical: Exposure electrical 3Exposure N, C, B, V: Exposure noise, chemical, biological, vibration 0Falls: Falls from height 5Overexertion: Overexertion, strain 0Pressure release: Pressure release 1Slips/trips: Slips and trips (at same height) 0Struck by: Struck by 15Water related: Water related, drowning 3Other: Other 1
Table 1: Fatalities by incident category (2014)
With regard to the incident category, the largest proportion of the fatalities reported in 2014 were categorized as ‘struck by’ (15 fatalities in 15 separate incidents). Seven of those incidents were in the activity ‘drilling, workover, well services’, four were in ‘transport – land’, three were in the activity ‘lifting, crane, rigging, deck operations’ and one was the result of a tree felling incident in the ‘construction, commissioning, decommissioning’ activity. (13% of fatalities reported in 2013 were in the category ‘struck by’.)
Fatalities categorized as ‘explosions or burns’ were the second greatest contributors to the fatality statistics with nine fatalities in six separate incidents, accounting for 9% of the fatalities (5% in 2013).

14Safety performance indicators – 2014 data
Unspecified 2.2%
Transport – Water 4.4%
Transport – Land 13.3%
Seismic 2.2%
Production 6.7%
Maintenance 8.9%
Lifting 13.3%
Drilling 35.6%
Construction 13.3%
Figure 6: Percentage of fatalities by incident activity (2014)
Activity Number of fatalitiesConstruction: Construction, commissioning, decommissioning 6Diving: Diving, subsea, ROV 0Drilling: Drilling, workover, well services 16Lifting: Lifting, crane, rigging, deck operations 6Maintenance: Maintenance, inspection, testing 4Office: Office, warehouse, accommodation, catering 0Production: Production operations 3Seismic: Seismic/survey operations 1Transport – Air: Transport – Air 0Transport – Land: Transport – Land 6Transport – Water: Transport – Water, incl. marine activity 2Unspecified: Unspecified – other 1
Table 2: Fatalities by incident activity (2014)
The fatal accident rate for 2014 is 1.03, 51% lower than the 2013 rate (2.12). The company only FAR for 2014 is 0.53, 71% lower than the 2013 rate. The offshore FAR for 2014 is 1.22, 63% lower than the 2013 rate.

15Summary of 2014 results
0
1
2
3
4
5
2014201320122011201020092008200720062005Fata
l acc
iden
t rat
e (p
er 1
00 m
illio
n ho
urs
wor
ked) Company Contractor Overall
Figure 7: Fatal accident rate by company & contractor (2005–2014)
1.3 Total recordable injuriesThe rate for all recordable injuries (fatalities, lost work day cases, restricted work day cases and medical treatment cases) was 1.54 injuries per million hours worked (1.60 in 2013).
A notable reduction in TRIR from 2013 to 2014 was shown in FSU (37%) and South & Central America (11%).
0
1
2
3
4
2014201320122011201020092008200720062005
Tota
l rec
orda
ble
inju
ry ra
te (p
er m
illio
n ho
urs
wor
ked) Company Contractor Overall
Figure 8: Total recordable injury rate by company & contractor (2005–2014)

16Safety performance indicators – 2014 data
1.4 Lost time injuriesThe overall lost time injury frequency (LTIF) fell from 0.45 in 2013 to 0.36 in 2014. This represents a reduction of 20% compared with 2013 and 109 fewer lost time injuries.
This reduction is similar in both company and contractor performance. Both company and contractor LTIF show a reduction compared with 2013 (35% and 17% respectively). The onshore and offshore LTIF both also show a reduction compared with 2013 (15% and 32% respectively).
0.0
0.5
1.0
1.5
2.0
2014201320122011201020092008200720062005
Lost
tim
e in
jury
freq
uenc
y (p
er m
illio
n ho
urs
wor
ked) Company Contractor Overall
Figure 9: Lost time injury frequency by company & contractor (2005–2014)
There were 1518 reported injuries resulting in at least one day off work, 1277 incidents were contractor related and 241 were company related.
• IOGP member companies reported 45 527 days of work lost through injuries.• The greatest number of incidents was reported as ‘Struck by’ (353 cases
accounting for 23.0% of the total; 2013 results showed 367 cases, also accounting for 23.3% of the total).
• ‘Caught in, under or between’ accounted for 342 cases, 22.4% of the total (21% of the total in 2013).

17Summary of 2014 results
Other
Water related 0.1%
Struck by 23.3%
Slips/trips 18.2%
Pressure release 0.5%
Overexertion 6.1%
Falls 11.5%
Exposure N, C, B, V 0.9%
Exposure electrical 1.1%
Explosions/burns 3.6%Cut 4.9%
Confined space 0.1%
Caught between 22.5%
Assault 0.7%Other 6.7%
Figure 10: Percentage of lost work day cases by incident category (2014)
Category Number of LWDCAssault: Assault or violent act 10Caught between: Caught in, under or between 342Confined space: Confined space 1Cut: Cut, puncture, scrape 74Explosions/burns: Explosions or burns 55Exposure electrical: Exposure electrical 17Exposure N, C, B, V: Exposure noise, chemical, biological, vibration 14Falls: Falls from height 174Overexertion: Overexertion, strain 92Pressure release: Pressure release 7Slips/trips: Slips and trips (at same height) 276Struck by: Struck by 353Water related: Water related, drowning 1Other: Other 102
Table 3: Lost work day cases by incident category (2014)

18Safety performance indicators – 2014 data
Unspecified 8.1%
Transport – Water 5.1%
Transport – Land 3.0%Transport – Air 0.3%
Seismic 1.3%
Production 17.0%
Office 7.5%
Maintenance 15.8%
Lifting 7.2%
Drilling 25.0%
Diving 0.6%
Construction 9.1%
Figure 11: Percentage of lost work day cases by incident activity (2014)
Activity Number of LWDCConstruction: Construction, commissioning, decommissioning 138Diving: Diving, subsea, ROV 9Drilling: Drilling, workover, well services 380Lifting: Lifting, crane, rigging, deck operations 110Maintenance: Maintenance, inspection, testing 240Office: Office, warehouse, accommodation, catering 114Production: Production operations 258Seismic: Seismic/survey operations 19Transport – Air: Transport – Air 4Transport – Land: Transport – Land 46Transport – Water: Transport – Water, incl. marine activity 77Unspecified: Unspecified – other 123
Table 4: Lost work day cases by incident activity (2014)

192. Key performance indicators
2. Overall results
In this section the key performance indicators used to measure contributing IOGP Member companies’ safety performance are: the number and nature of fatalities, total recordable injury rate (TRIR), fatal accident rate (FAR), fatal incidents per 100 million work hours, and lost time injury frequency (LTIF).
Third party incidents are not included in this report.
2.1 Fatalities
Onshore Offshore Overall
2014 2013 2014 2013 2014 2013
Company 2 13 3 2 5 15
Contractor 28 34 12 31 40 65
Overall 30 47 15 33 45 80
Table 5: Number of fatalities (2013 & 2014)
Company/contractor fatalities• 45 company and contractor fatalities were reported in 2014. This is 35 fewer
than were reported in 2013 and 43 fewer than in 2012.• The 45 fatalities occurred in 42 separate incidents.
0
20
40
60
80
100
120
140
20142013201220112010200920082007200620050.0
0.5
1.0
1.5
2.0
2.5
3.0
3.5
4.0
4.5
2014201320122011201020092008200720062005
Num
ber o
f fat
aliti
es
FAR
(fata
litie
s pe
r 100
mill
ion
hour
s w
orke
d)
84
115 103
87
8880
45
99 94
65
Fatal accident rate (FAR)Fatalities
Figure 12: Number of fatalities and fatal accident rate (2005–2014)

20Safety performance indicators – 2014 data
2.2 Fatal accident rate (FAR)
Fatal accident rate (FAR)
2014 2013 2014 relative to 2013 FAR
Company 0.53 1.83 $ 71% lower
Contractor 1.17 2.20 $ 47% lower
Overall 1.03 2.12 $ 51% lower
Onshore 0.96 1.70 $ 44% lower
Offshore 1.22 3.27 $ 63% lower
Table 6: Fatal accident rate (2013 & 2014)
In 2014 there were five company fatalities (14 in 2013) as a result of three separate incidents.
In 2014 there were 40 contractor fatalities (65 in 2013).
The difference between the onshore and offshore FAR displays a large variation over the 10-year period shown. Neither is consistently lower. This is generally attributable to single transportation or fire and explosion incidents involving high numbers of fatalities.
0
1
2
3
4
5
2014201320122011201020092008200720062005Fata
l acc
iden
t rat
e (p
er 1
00 m
illio
n ho
urs
wor
ked) Company Contractor Overall
Figure 13: Fatal accident rate by company & contractor (2005–2014)

212. Key performance indicators
0
1
2
3
4
5
2014201320122011201020092008200720062005Fata
l acc
iden
t rat
e (p
er 1
00 m
illio
n ho
urs
wor
ked) Onshore Offshore Overall
Figure 14: Fatal accident rate by onshore & offshore operations (2005–2014)
DefinitionsFatal accident rate (FAR): The number of company/contractor fatalities per 100 million hours worked

22Safety performance indicators – 2014 data
2.3 Fatalities by incident category and activity
Activity
Incident category
Assa
ult o
r vio
lent
act
Caug
ht in
, und
er o
r bet
wee
n
Conf
ined
spa
ce
Cut,
punc
ture
, scr
ape
Expl
osio
ns o
r bur
ns
Expo
sure
ele
ctri
cal
Expo
sure
noi
se, c
hem
ical
, bio
logi
cal,
vibr
atio
n
Falls
from
hei
ght
Over
exer
tion,
str
ain
Pres
sure
rele
ase
Slip
s an
d tr
ips
(at s
ame
heig
ht)
Stru
ck b
y
Wat
er re
late
d, d
row
ning
Othe
r
Over
all
Construction, commissioning, decommissioning
0 1 1 0 0 0 0 0 0 0 0 1 2 1 6
Diving, subsea, ROV 0 0 0 0 0 0 0 0 0 0 0 0 0 0 0Drilling, workover, well services 0 2 0 0 5 0 0 2 0 0 0 7 0 0 16
Lifting, crane, rigging, deck operations 0 2 0 0 0 1 0 0 0 0 0 3 0 0 6
Maintenance, inspection, testing 0 1 0 0 0 2 0 1 0 0 0 0 0 0 4
Office, warehouse, accommodation, catering 0 0 0 0 0 0 0 0 0 0 0 0 0 0 0
Production operations 0 0 0 0 2 0 0 1 0 0 0 0 0 0 3Seismic /survey operations 0 1 0 0 0 0 0 0 0 0 0 0 0 0 1
Transport – Air 0 0 0 0 0 0 0 0 0 0 0 0 0 0 0Transport – Land 0 0 0 0 2 0 0 0 0 0 0 4 0 0 6Transport – Water, incl. marine activity 0 0 0 0 0 0 0 1 0 0 0 0 1 0 2
Unspecified – other 0 0 0 0 0 0 0 0 0 1 0 0 0 0 1Overall 0 7 1 0 9 3 0 5 0 1 0 15 3 1 45
Table 7: Fatalities by incident category and activity (2014)

232. Key performance indicators
Forty of the 42 fatal incidents involved one fatality.
Both of the incidents that involved two or more fatalities were reported under the ‘explosions or burns’ category.
The largest proportion of the fatalities reported in 2014 were the result of individuals being struck by falling or moving objects — 33% (13% in 2013).
• Seven contractors lost their lives in seven separate incidents in the ‘drilling, workover, well services’ activity:
– One worker was stuck by a pipe joint causing him to fall and strike the back of his head.
– One worker was struck by the element of a damaged plug during well construction works, when the mud pump for well washing was started up and the welded plug tore off from the quick-split joint of the manifold force line.
– A worker was fatally injured when he moved into the path of the pipeline during a repair, consisting of changing a production line segment that had broken during a well fracturing job.
– One man was struck by a stabilizer (17½ inch in diameter, 2.14 m long and approximate weight of 765 kg) that fell during an operation to remove it from the drilling column.
– One worker died and another was seriously injured when they were trying to break out a cross-over from a drill pipe and the elevator arm made contact with mast beam and swung, striking the two workers.
– On a carousel rig, a 5 inch joint dropped from pneumatic elevators down the V door to the pipe rack, hitting two roustabouts working close to a catwalk, one was fatally injured. The elevators had been accidentally opened by a third party operator while trying to move the joystick box with the elevators loaded.
– One fatality occurred during well servicing operations.• Three contractors died in three separate lifting incidents:
– One worker died and another was injured when a jammed chain block’s sprocket suddenly ruptured releasing an array of projectiles which struck the workers.
– One worker was struck by a skid mounted load during truck loading activity.
– One worker died during platform refuelling; once the refuelling came to an end, while relocating the hose in its seat with the assistance of a crane operator, the hose was released due to the failure of the suspending fibre rope and the hose coupling struck the worker in the head.

24Safety performance indicators – 2014 data
• Four contractors died in four separate road accidents: – A company-owned bus that was transporting workers to the office
was involved in a head-on collision with a third-party dump truck; the driver was fatally injured.
– A truck driver died after exceeding the speed limit and driving too close to the vehicle in front. The truck collided with the other vehicle (truck and trailer) due to the short stopping distance.
– A bowser carrying around 50 000 litres of crude oil was hit by a passing trailer resulting in a leak but no fire. One fatality was recorded.
– A driver was killed in a public roadway accident.• One contractor died as the result of a tree felling incident in the ‘construction,
commissioning, decommissioning’ activity.
Nine fatalities, 20% of the total reported in 2014, were categorized as ‘explosions or burns’ (5% in 2013).
• Two company employees and one contractor died in a single incident in the ‘drilling, workover, well services’ activity which occurred on an offshore rig in the Gulf of Mexico as the result of an explosion caused by a gas leak during cementing of the well.
• Two contractor employees died in a single incident in the ‘transport – land’ activity in which a crude oil tanker carrying 50 000 litres of crude parked next to the road side, was hit head-on by a vehicle resulting in a fire.
• A sudden gas release, which occurred on the wellhead, resulted in a serious fire, one contractor fatality, and two first aid injuries. The crew had been working on tubing installation prior to production.
• During workover of an oil well in the oil field vented gas ignited and set the wellsurface and workoverunit on fire resulting in the death of one contractor.
• A fire at a compressor reached the workers causing one contractor fatality.• Loss of containment heating system and oil injection to the well, caused
an explosion that reached the camp where staff were working causing one contractor fatality.
Seven fatalities, 16% of the total fatalities reported in 2014, were categorized as ‘caught in, under or between’ (9% in 2013).
• During construction work a machinery driver reversed the truck and did not see a worker causing his death.
• One worker was caught between drill-collars during an operation to move them with a fork lift – he had returned to the cleared operations area unexpectedly to remove a rope.
• A worker without training or permit to work was operating a crane causing a crash of the cab and his death.

252. Key performance indicators
• An electrician was fatally injured during maintenance of the drive system of load elevator door.
• A contract driller drilling shot holes for a seismic acquisition contractor was fatally injured when a hooded sweater he was wearing became entangled in the rotating drill string.
• A derrickman was fatally injured during a manoeuvre to move five steel plates, weighing approximately two tons with the support of crew which consisted of three people. They had removed and were holding the plates because the crane was receiving material from a boat. During the manoeuvre the worker was caught between the plates and a wall.
• While conducting repairs to the Pipe Handling Machine, a mechanic was caught between the equipment and crushed.
11% of the fatalities reported in 2014 were categorized as ‘falls from height’ (4% in 2013).
• A contractor scaffolder fell from an offshore installation in the North Sea to the sea through an open section of deck grating, which had been removed for underdeck access. The opening had been barriered off with an appropriately sized and constructed scaffold barrier.
• A contractor died after falling from a permanent working platform which is about six metres high whilst conducting inspection on a grating replacement job.
• A contractor died after falling from a ladder, hitting the floor with his head.• A worker died when the welded support of the crane that was welded to the
structure failed and the crane and the IP fell into the water.• A driller died after climbing up 10 metres to carry out a repair without a
safety harness. He lost his balance and fell to the drilling floor.
The number of deaths resulting from land transport incidents remains unchanged (6 fatalities, 13% of all fatalities) compared with 2013 (6 fatalities, 8% of all fatalities in 2013; 9 fatalities, 11% in 2012).
• Six fatalities were associated with five separate incidents.
There were no fatal incidents reported under the following categories:• Assault or violent act• Cut, puncture, scrape• Exposure noise, chemical, biological, vibration• Slips, trips, falls (at same height).

26Safety performance indicators – 2014 data
Other 2.2%
Water related 6.7%
Struck by 33.3%
Pressure release 2.2%
Falls 11.1%
Exposure electrical 6.7%
Explosions/burns 20.0%
Confined space 2.2%
Caught between 15.6%
Figure 15: Percentage of fatalities by incident category (2014)
Category Number of fatalities
Assault: Assault or violent act 0
Caught between: Caught in, under or between 7Confined space: Confined space 1Cut: Cut, puncture, scrape 0Explosions/burns: Explosions or burns 9Exposure electrical: Exposure electrical 3Exposure N, C, B, V: Exposure noise, chemical, biological, vibration 0Falls: Falls from height 5Overexertion: Overexertion, strain 0Pressure release: Pressure release 1Slips/trips: Slips and trips (at same height) 0Struck by: Struck by 15Water related: Water related, drowning 3Other: Other 1
Table 8: Fatalities by incident category (2014)

272. Key performance indicators
Unspecified 2.2%
Transport – Water 4.4%
Transport – Land 13.3%
Seismic 2.2%
Production 6.7%
Maintenance 8.9%
Lifting 13.3%
Drilling 35.6%
Construction 13.3%
Figure 16: Percentage of fatalities by incident activity (2014)
Activity Number of fatalities
Construction: Construction, commissioning, decommissioning 6Diving: Diving, subsea, ROV 0Drilling: Drilling, workover, well services 16Lifting: Lifting, crane, rigging, deck operations 6Maintenance: Maintenance, inspection, testing 4Office: Office, warehouse, accommodation, catering 0Production: Production operations 3Seismic: Seismic/survey operations 1Transport – Air: Transport – Air 0Transport – Land: Transport – Land 6Transport – Water: Transport – Water, incl. marine activity 2Unspecified: Unspecified – other 1
Table 9: Fatalities by incident activity (2014)

28Safety performance indicators – 2014 data
2.4 Number of fatal incidents per 100 million work hours
Fatal incidents per 100 million work hours
2014 2013 2014 relative to 2013 FIR
Company 0.32 0.85 $ 62% lower
Contractor 1.14 1.22 $ 7% lower
Overall 0.96 1.14 $ 16% lower
Onshore 0.92 0.94 $ 2% lower
Offshore 1.06 1.68 $ 37% lower
Table 10: Fatal incidents per 100 million work hours (2013 & 2014)
The number of fatal incidents per 100 million work hours is a measure of the frequency with which fatal incidents occur, in contrast to the FAR which measures the frequency of fatalities. Accordingly, for company and contractor fatalities, the number of fatal incidents per 100 million work hours will be less than or equal to the FAR. Comparison of FAR and number of fatal incidents per 100 million work hours gives an indication of the magnitude of the incidents in terms of lives lost.
Overall the number of fatal incidents per 100 million work hours has decreased by 16% compared with last year and is the lowest on record (42 fatal incidents in 2014, 43 fatal incidents in 2013).
0
20
40
60
80
100
120
140
2014201320122011201020092008200720062005
Num
ber o
f fat
aliti
es a
nd fa
tal i
ncid
ents
8474
82
6758
115103 103
87
73
8880
4543 4250 52
99 94
65
Fatalities Fatal incidents
Figure 17: Number of fatalities and fatal incidents (2005–2014)

292. Key performance indicators
0
1
2
3
4
5
2014201320122011201020092008200720062005
Fata
l inc
iden
ts p
er 1
00 m
illio
n ho
urs
wor
ked
Company Contractor Overall
Figure 18: Fatal incidents per 100 million hours by company & contractor (2005–2014)
0
1
2
3
4
5
2014201320122011201020092008200720062005
Fata
l inc
iden
ts p
er 1
00 m
illio
n ho
urs
wor
ked
Onshore Offshore Overall
Figure 19: Fatal incidents per 100 million hours by onshore & offshore (2005–2014)

30Safety performance indicators – 2014 data
2.5 Total recordable injury rate (TRIR)
Total recordable incident rate (TRIR)
2014 2013 2014 relative to 2013 TRIR
Company 0.90 0.95 $ 5% lower
Contractor 1.70 1.77 $ 4% lower
Overall 1.54 1.60 $ 4% lower
Onshore 1.33 1.33 1 No change
Offshore 2.16 2.34 $ 8% lower
Table 11: Total recordable injury rate (2013 & 2014)
Submissions without information on medical treatment cases were filtered out, leaving a dataset of 3 909 million hours, 90% of the database (see Appendix A).
An overall reduction in TRIR of 4% is seen in 2014.
Definitions
Total recordable injury rate (TRIR)The number of recordable injuries (fatalities + lost work day cases + restricted work day cases + medical treatment cases) per million hours worked.

312. Key performance indicators
0
1
2
3
4
2014201320122011201020092008200720062005
Tota
l rec
orda
ble
inju
ry ra
te (p
er m
illio
n ho
urs
wor
ked)
Company Contractor Overall
Figure 20: Total recordable injury rate by company & contractor (2005–2014)
0
1
2
3
4
2014201320122011201020092008200720062005
Tota
l rec
orda
ble
inju
ry ra
te (p
er m
illio
n ho
urs
wor
ked)
Onshore Offshore Overall
Figure 21: Total recordable injury rate by onshore & offshore (2005–2014)

32Safety performance indicators – 2014 data
2.6 Lost time injury frequency (LTIF)
Lost time injury frequency (LTIF)
2014 2013 2014 relative to 2013 LTIF
Company 0.26 0.40 $ 35% lower
Contractor 0.39 0.47 $ 17% lower
Overall 0.36 0.45 $ 20% lower
Onshore 0.29 0.34 $ 15% lower
Offshore 0.52 0.77 $ 32% lower
Table 12: Lost time injury frequency (2013 & 2014)
There were 1 518 reported lost work day cases resulting in at least one day off work, which equates to an average of 29 injuries resulting in at least one day off work every week of the year or four injuries every day of the year.
Although the absolute number of LWDCs has reduced (1 627 in 2013), the time away from work has increased for company workers and onshore activities compared with 2013. See section 2.8 for further information on lost work day case severity.
Definitions
Lost time injury frequency (LTIF)The number of lost time injuries (fatalities + lost work day cases) per million hours worked.

332. Key performance indicators
0.0
0.5
1.0
1.5
2.0
2014201320122011201020092008200720062005
Lost
tim
e in
jury
freq
uenc
y (p
er m
illio
n ho
urs
wor
ked) Company Contractor Overall
Figure 22: Lost time injury frequency by company & contractor (2005–2014)
0.0
0.5
1.0
1.5
2.0
2014201320122011201020092008200720062005
Lost
tim
e in
jury
freq
uenc
y (p
er m
illio
n ho
urs
wor
ked) Onshore Offshore Overall
Figure 23: Lost time injury frequency by onshore & offshore (2005–2014)

34Safety performance indicators – 2014 data
2.7 Lost work day case categories and activities
Category Number % of totalAssault: Assault or violent act 10 0.7Caught between: Caught in, under or between 342 22.5Confined space: Confined space 1 0.1Cut: Cut, puncture, scrape 74 4.9Explosions/burns: Explosions or burns 55 3.6Exposure electrical: Exposure electrical 17 1.1Exposure N, C, B, V: Exposure noise, chemical, biological, vibration 14 0.9
Falls: Falls from height 174 11.5Overexertion: Overexertion, strain 92 6.1Pressure release: Pressure release 7 0.5Slips/trips: Slips and trips (at same height) 276 18.2Struck by: Struck by 353 23.3Water related: Water related, drowning 1 0.1Other: Other 102 6.7Overall 1 518
Table 13: Lost work day cases by category (2014)
Assault 0.7%Other 6.7%
Cut 4.9%
Water related 0.1%
Struck by 23.3%
Slips/trips 18.2%
Pressure release 0.5% Overexertion 6.1%
Falls 11.5%
Exposure electrical 1.1%Exposure NCBV 0.9%
Explosions/burns 3.6%
Confined space 0.1%
Caught between 22.5%
Figure 24: Percentage of lost work day cases by category (2014)

352. Key performance indicators
Of the 1 518 reported lost work day cases resulting in at least one day off work, 1 277 incidents (84%) were contractor-related and 241 (16%) were company-related (1 312 and 315 respectively for 2013). The lost work day case category was provided for all of the lost work day cases reported, although 6.7% of the cases were categorized as ‘other’.
The pie chart shows the percentage of LWDCs within each of the reporting categories for 2014.
• The greatest number of incidents was reported as ‘struck by’ – 353 cases accounting for 22.5% of LWDCs (2013 results showed 367 cases accounting for 22.6%).
• ‘Caught in, under or between’ accounted for 342 cases, 22.5% of the total (341 cases, 21.0% of the total in 2013).
• In comparison with 2013, the 2014 results were very similar.
Definitions
Lost work day case (LWDC)An incident resulting in at least one day off work. Fatal incidents are not included.

36Safety performance indicators – 2014 data
Category Company ContractorAssault: Assault or violent act 2 8Caught between: Caught in, under or between 34 308Confined space: Confined space 0 1Cut: Cut, puncture, scrape 9 65Explosions/burns: Explosions or burns 7 48Exposure electrical: Exposure electrical 3 14Exposure N, C, B, V: Exposure noise, chemical, biological, vibration 2 12
Falls: Falls from height 30 144Overexertion: Overexertion, strain 14 78Pressure release: Pressure release 1 6Slips/trips: Slips and trips (at same height) 72 204Struck by: Struck by 56 297Water related: Water related, drowning 1 0Other: Other 10 92Overall 241 1 277
Table 14: Lost work day cases by category – company & contractor data (2014)
Assault 0.8%Other 4.1%
Cut 3.7%
Water related 0.4%
Struck by 23.2%
Slips/trips 29.9%Pressure release 0.4%
Overexertion 5.8%
Falls 12.4%
Exposure electrical 1.2%Exposure NCBV 0.8%
Explosions/burns 2.9%
Confined space 0.1%
Caught between 14.1%
Figure 25: Lost work day cases by category – company data (2014)

372. Key performance indicators
Assault 0.6%Other 7.2%
Cut 5.1%
Water related 0.1%
Struck by 23.3%
Slips/trips 16.0%
Pressure release 0.5% Overexertion 6.1%
Falls 11.3%
Exposure electrical 1.1%Exposure NCBV 0.9%
Explosions/burns 3.8%
Confined space 0.1%
Caught between 24.1%
Figure 26: Lost work day cases by category – contractor data (2014)
Category Onshore OffshoreAssault: Assault or violent act 8 2Caught between: Caught in, under or between 181 161Confined space: Confined space 1 0Cut: Cut, puncture, scrape 41 33Explosions/burns: Explosions or burns 37 18Exposure electrical 6 11Exposure N, C, B, V: Exposure noise, chemical, biological, vibration 10 4
Falls: Falls from height 109 65Overexertion: Overexertion, strain 53 39Pressure release: Pressure release 3 4Slips/trips: Slips and trips (at same height) 171 105Struck by: Struck by 195 158Water related: Water related, drowning 1 0Other: Other 76 26Overall 892 626
Table 15: Lost work day cases by category – onshore & offshore (2014)
Of the 1 518 reported lost work day cases resulting in at least one day off work, 892 incidents (59%) were related to onshore activity and 626 (41%) were related to offshore activity (879 and 748 respectively for 2013).

38Safety performance indicators – 2014 data
Assault 0.9%Other 8.5%
Cut 4.6%
Water related 0.1%
Struck by 21.9%
Slips/trips 19.2%
Pressure release 0.3% Overexertion 5.9%
Falls 12.2%
Exposure electrical 0.7%Exposure NCBV 1.1%
Explosions/burns 4.1%
Confined space 0.1%
Caught between 20.3%
Figure 27: Lost work day cases by category – onshore operations (2014)
Assault 0.3%Other 4.2%
Cut 5.3%
Water related 0.1%
Struck by 25.2%
Slips/trips 16.8%
Pressure release 0.6% Overexertion 6.2%
Falls 10.4%
Exposure electrical 1.8%Exposure NCBV 0.6%
Explosions/burns 2.9%
Confined space 0.1%
Caught between 25.7%
Figure 28: Lost work day cases by category – offshore operations (2014)

392. Key performance indicators
Activity Number % of totalConstruction: Construction, commissioning, decommissioning 138 9.1Diving: Diving, subsea, ROV 9 0.6Drilling: Drilling, workover, well services 380 25Lifting: Lifting, crane, rigging, deck operations 110 7.2Maintenance: Maintenance, inspection, testing 240 15.8Office: Office, warehouse, accommodation, catering 114 7.5Production: Production operations 258 17Seismic: Seismic/survey operations 19 1.3Transport – Air: Transport – Air 4 0.3Transport – Land: Transport – Land 46 3Transport – Water incl. marine activity 77 5.1Unspecified: Unspecified other 123 8.1Overall 1 518
Table 16: Lost work day cases by activity (2014)
Lost work day case activities were reported for all of the 1,518 Lost Work Day Cases reported.
Unspecified 8.1%
Transport – Water 5.1%
Transport – Land 3.0%
Transport – Air 0.3%Seismic 1.3%
Production 17.0%
Maintenance 15.8%
Lifting 7.2%Office 7.5%
Drilling 25.0%
Construction 9.1%
Diving 0.6%
Figure 29: Lost work day cases by activity

40Safety performance indicators – 2014 data
Activity Company ContractorConstruction: Construction, commissioning, decommissioning 7 131Diving: Diving, subsea, ROV 1 8Drilling: Drilling, workover, well services 40 340Lifting: Lifting, crane, rigging, deck operations 5 105Maintenance: Maintenance, inspection, testing 37 203Office: Office, warehouse, accommodation, catering 31 83Production: Production operations 74 184Seismic: Seismic/survey operations 0 19Transport – Air: Transport – Air 1 3Transport – Land: Transport – Land 9 37Transport – Water incl. marine activity 4 73Unspecified: Unspecified other 32 91Overall 241 1 277
Table 17: Lost work day cases by activity – company & contractor (2014)
Construction 2.9%
Drilling 16.6%
Unspecified 13.3%
Transport – Water 1.7%
Transport – Land 3.7%
Transport – Air 0.4%
Production 30.7%
Maintenance 15.4%
Office 12.9%
Lifting 2.1%
Diving 0.4%
Figure 30: Lost work day cases by activity – company (2014)

412. Key performance indicators
Construction 10.3%
Drilling 26.6%
Unspecified 7.1%
Transport – Water 5.7%
Transport – Land 2.9%Transport – Air 0.2%Seismic 1.5%
Production 14.4%
Maintenance 15.9%
Office 6.5%
Lifting 8.2%
Diving 0.6%
Figure 31: Lost work day cases by activity – contractor (2014)
Activity Onshore OffshoreConstruction: Construction, commissioning, decommissioning 98 40Diving: Diving, subsea, ROV 4 5Drilling: Drilling, workover, well services 234 146Lifting: Lifting, crane, rigging, deck operations 45 65Maintenance: Maintenance, inspection, testing 105 135Office: Office, warehouse, accommodation, catering 76 38Production: Production operations 180 78Seismic: Seismic/survey operations 16 3Transport – Air: Transport – Air 2 2Transport – Land: Transport – Land 41 5Transport – Water incl. marine activity 10 67Unspecified: Unspecified other 81 42Overall 892 626
Table 18: Lost work day cases by activity – onshore & offshore (2014)

42Safety performance indicators – 2014 data
Construction 11.1%
Drilling 26.2%
Unspecified 9.1%
Transport – Water 1.1%Transport – Land 4.6%
Transport – Air 0.2%Seismic 1.9%
Production 20.2%
Maintenance 11.8%
Office 8.5%Lifting 5.0%
Diving 0.4%
Figure 32: Lost work day cases by activity – onshore (2014)
Construction 6.4%
Drilling 23.3%
Unspecified 6.7%
Transport – Water 10.7%
Transport – Land 0.8%Transport – Air 0.3%
Seismic 0.5%
Production 12.5%
Maintenance 21.6%
Office 6.1%Lifting 10.4%
Diving 0.8%
Figure 33: Lost work day cases by activity – offshore (2014)

432. Key performance indicators
2.8 Severity of lost work day cases
Severity of LWDC (Average days lost per LWDC)
2014 2013 2014 relative to 2013 severity
2014 relative to 2009-2013 severity
Company 51.6 43.5 # 19% higher # 34% higher
Contractor 40.3 42.9 $ 6% lower $ 4% lower
Overall 42.2 43.0 $ 2% lower # 2% higher
Onshore 39.9 35.8 # 11% higher # 7% higher
Offshore 45.5 51.2 $ 11% lower $ 6% lower
Table 19: Average severity of lost work day cases
IOGP member companies reported a total of 45 527 days lost (LWDC days) through injuries.
• The number of days lost was reported for 74% of the database (see Appendix A and Appendix C).
• The offshore LWDC severity is 14% higher than onshore.
Definitions
Severity of lost work day casesThe number of days lost (where reported) for each lost work day case (LWDC).

44Safety performance indicators – 2014 data
0
10
20
30
40
50
60 Contractor
Company
Overall
2014201320122011201020092008200720062005
Aver
age
days
lost
per
LW
DC
Company Contractor Overall
Figure 34: Severity of LWDC by company & contractor (2005–2014)
0
10
20
30
40
50
60
2014201320122011201020092008200720062005
Aver
age
days
lost
per
LW
DC
Onshore Offshore Overall
Figure 35: Severity of LWDC by onshore & offshore (2005–2014)

452. Key performance indicators
Figures 36 and 37 show the average number of days lost per LWDC in 2014 compared with the average for the previous five-year period. A 2% increase is shown in overall LWDC severity when compared with the previous five-year period.
0
10
20
30
40
50
60
OverallContractorCompany
Aver
age
days
of l
ost w
ork
per L
WDC
2014 2009–2013
0
10
20
30
40
50
60
OverallOffshoreOnshore
Aver
age
days
of l
ost w
ork
per L
WDC
2014 2009–2013
Figure 36: Severity of lost work day cases by company & contrator (2014 compared with 2009–2013)
Figure 37: Severity of lost work day cases by onshore & offshore (2014 compared with 2009–2013)

46Safety performance indicators – 2014 data
2.9 Severity of restricted work day cases
Severity of RWDC (Average days lost per RWDC)
2014 2013 2014 relative to 2013 severity
2014 relative to 2009-2013 severity
Company 14.6 17.2 $ 15% lower $ 1% lower
Contractor 11.6 14.2 $ 19% lower $ 8% lower
Overall 11.8 14.5 $ 18% lower $ 7% lower
Onshore 12.2 15.4 $ 21% lower $ 5% lower
Offshore 11.2 13.0 $ 14% lower $ 11% lower
Table 20: Severity of restricted work day cases (2014 compared with 2009–2013)
A total of 10 115 days were restricted (RWDC days) as a result of restricted work day cases, in the sense that normal duties could not be performed. This compares with 45 527 days lost (LWDC days) on a 16% larger dataset (see Appendix A and Appendix C).
Definitions
Severity of restricted work day casesThe number of days of restricted work per restricted work day case (RWDC).
Restricted work day cases are not reported by all companies and RWDC days are not reported by all companies that report RWDC. See Appendix A.

472. Key performance indicators
0
5
10
15
20 Contractor
Company
Overall
2014201320122011201020092008200720062005
Aver
age
days
lost
per
RW
DC
Company Contractor Overall
Figure 38: Severity of restricted work day cases by company & contractor (2005–2014)
0
5
10
15
20
2014201320122011201020092008200720062005
Aver
age
days
lost
per
RW
DC
Onshore Offshore Overall
Figure 39: Severity of restricted work day cases by onshore & offshore (2005–2014)

48Safety performance indicators – 2014 data
Figures 40 and 41 show the average number of days lost per RWDC in 2014 compared with the average for the previous five-year period. The overall average shows a reduction of 18% compared with the average for the previous five-year period.
0
5
10
15
20
OverallContractorCompany
Aver
age
days
of l
ost w
ork
per R
WDC
2014 2009–2013
0
5
10
15
20
OverallOffshoreOnshore
Aver
age
days
of l
ost w
ork
per L
WDC
2014 2009–2013
Figure 40: Severity of restricted work day cases by company & contrator (2014 compared with 2009–2013)
Figure 41: Severity of restricted work day cases by onshore & offshore (2014 compared with 2009–2013)

492. Key performance indicators
2.10 Incident trianglesIn this section the relative numbers of types of occupational injury are shown in the form of ‘incident triangles’. The ratios have been corrected to account for the absence, in some data submissions, of medical treatment cases.
Year Ratio of lost time injuries to fatalities
Ratio of total recordable injuries to fatalities
2014 35:1 134:1
2013 21:1 73:1
2012 20:1 72:1
2011 22:1 93:1
2010 15:1 60:1
2009 16:1 63:1
Table 21: Ratio of lost time injuries and recordable injuries to fatalities (2009–2014)
DefinitionsLost time injuries: Lost work day cases and fatalities.
Recordable injuries: Fatalities, lost work day cases, restricted work day cases and medical treatment cases where medical treatment cases are reported for the data set.
Ratio of lost time injuries to fatalities: The number of lost time injuries divided by the total number of fatalities (lost time injuries/fatalities).
Ratio of total recordable injuries to fatalities The number of recordable injuries divided by the total number of fatalities (recordable injuries/fatalities).

50Safety performance indicators – 2014 data
Fatality
Lost time injuries
Recordable injuries
Company ContractorOverall
1
35
134 140 133
49 32
1 1
Figure 42: Incident triangles by company & contractor (2014)
Fatality
Lost time injuries
Recordable injuries
Company ContractorOverall
1
21
73 48 79
21 21
1 1
Figure 43: Incident triangles by company & contractor (2013)
The varying ratio of fatalities to lost time injuries to recordable injuries for 2013–2014 challenges the traditional notion of recordable injuries and lost time injuries overall as a precursor to fatalities as shown in the incident triangles. In some incident categories however such as 'confined space, 'assault or violent act' and 'water related, drowning', the ratio will be higher as shown in Tables 22 and 23.

512. Key performance indicators
Category LTIs (fatalities + LWDCs)
Fatalities Ratio LTI: Fatality
Assault or violent act 10 0 n/aCaught in, under or between 349 7 50:1Confined space 2 1 2:1Cut, puncture, scrape 74 0 n/aExplosions or burns 64 9 7:1Exposure electrical 20 3 7:1Exposure noise, chemical, biological, vibration 14 0 n/a
Falls from height 179 5 36:1Overexertion, strain 92 0 n/aPressure release 8 1 8:1Slips and trips (at same height) 276 0 n/aStruck by 368 15 25:1Water related, drowning 4 3 1:1Other 103 1 103:1
Table 22: Ratio of fatalities to lost time injuries by category
Activity LTIs (fatalities + LWDCs)
Fatalities Ratio LTI: Fatality
Construction, commissioning, decommissioning 144 6 24:1
Diving, subsea, ROV 9 0 n/aDrilling, workover, well services 396 16 25:1Lifting, crane, rigging, deck operations 116 6 19:1
Maintenance, inspection, testing 244 4 61:1Office, warehouse, accommodation, catering 114 0 n/a
Production operations 261 3 87:1Seismic/survey operations 20 1 20:1Transport – Air 4 0 n/aTransport – Land 52 6 9:1Transport – Water, incl. marine activity 79 2 40:1
Unspecified – other 124 1 124:1
Table 23: Ratio of fatalities to lost time injuries by activity

52Safety performance indicators – 2014 data
2.11 Causal factorsThe 2014 data submission requested allocation of ‘causal factors’ to fatal incidents and high potential events. This request was first made in 2010, therefore a comparison of five years of data is possible.
To standardize the response an IOGP list of causal factors and a glossary was provided to the member companies as part of the IOGP user guide. The causal factors list is divided into two sections:
• People (Acts) classifications usually involve either the actions of a person or actions which were required but not carried out or were incorrectly performed. There are four major categories of actions, with an additional level of detail under each of the major categories.
• Process (Conditions) classifications usually involve some type of physical hazard or organizational aspect out of the control of the individual. There are five major classification categories, with an additional level of detail under each of the major categories.
2.11.1 Fatal incident causal factorsCausal factors are divided into two separate groups, People (Acts) and Process (Conditions), see Report 2014su Safety data reporting users' guide – 2014 data and Glossary for details.
• 33 of the 42 fatal incidents reported were assigned causal factors (34 of 43 in 2013)
• 176 causal factors were assigned for the 42 fatal incidents• Between 1 and 13 causal factors were assigned per incident (between 2
and 16 in 2013).
Causal factor group 2014 2013
PEOPLE (ACTS) 75 95
PROCESS (CONDITIONS) 101 127
Table 24: Causal factors assigned to fatal incidents (2013 & 2014)

532. Key performance indicators
The causal factors assigned to fatal incidents are shown in Table 25. The highlighted content indicates the top ten causal factors assigned to fatal incidents in 2014 compared with the previous four years. Seven of the top ten were the same for all five years.
Additional information on the fatal incidents reported by region can be found on the IOGP Safety Zone website: http://info.iogp.org/Safety/. The information provided includes a narrative description of the incident, the corrective actions and recommendations and the causal factors assigned by the reporting company.

54Safety performance indicators – 2014 data
Causal factors 2014 2013 2012 2011 2010
PROCESS: Organizational: Inadequate work standards/procedures 18 15 15 8 10PROCESS: Organizational: Inadequate hazard identification or risk assessment 18 13 17 15 30PROCESS: Organizational: Inadequate training/competence 16 21 13 10 13PEOPLE: Following procedures: Improper position (in the line of fire) 14 12 13 9 16PEOPLE: Inattention/lack of awareness: Improper decision making or lack of judgement 13 16 11 16 14PROCESS: Organizational: Inadequate supervision 13 14 16 18 18PEOPLE: Following procedures: Violation unintentional (by individual or group) 9 11 13 9 12PEOPLE: Use of protective methods: Personal Protective Equipment not used or used improperly
8 7 4 6 1
PEOPLE: Use of tools, equipment, materials and products: Improper use/position of tools/equipment/materials/products
6 10 7 6 9
PROCESS: Organizational: Inadequate communication 6 8 6 9 12PROCESS: Protective systems: Inadequate/defective guards or protective barriers 6 10 6 11 7PROCESS: Protective systems: Inadequate/defective warning systems/safety devices 5 5 5 6 5PROCESS: Tools, equipment, materials & products: Inadequate maintenance/inspection/testing 5 9 5 6 4PEOPLE: Following procedures: Violation intentional (by individual or group) 5 2 4 4 12PEOPLE: Use of tools, equipment, materials and products: Servicing of energized equipment/inadequate energy isolation
4 3 3 3
PEOPLE: Use of protective methods: Failure to warn of hazard 4 6 4 8 7PROCESS: Tools, equipment, materials & products: Inadequate design/specification/management of change
4 4 7 5 10
PROCESS: Protective systems: Inadequate security provisions or systems 3 1 4 2 2PROCESS: Organizational: Poor leadership/organizational culture 3 6 4 4 9PROCESS: Organizational: Failure to report/learn from events 3 1 1 3PEOPLE: Use of protective methods: Equipment or materials not secured 3 8 4 4 6PEOPLE: Inattention/lack of awareness: Lack of attention/distracted by other concerns/stress 3 4 5 7 5PEOPLE: Use of protective methods: Disabled or removed guards, warning systems or safety devices
2 3 2 2 2
PEOPLE: Use of protective methods: Inadequate use of safety systems 2 7 9 4 5PEOPLE: Following procedures: Work or motion at improper speed 1 2 1 2PEOPLE: Following procedures: Improper lifting or loading 1 4 7 2 8PROCESS: Workplace hazards: Inadequate surfaces, floors, walkways or roads 1 3 4 7 1PROCESS: Workplace hazards: Hazardous atmosphere (explosive/toxic/asphyxiant) 2 2 1 1PROCESS: Workplace hazards: Storms or acts of nature 2 5 2PROCESS: Protective systems: Inadequate/defective Personal Protective Equipment 4 5 5PROCESS: Tools, equipment, materials & products: Inadequate/defective tools/equipment/materials/products
9 7 5 4
PROCESS: Workplace hazards: Congestion, clutter or restricted motion 4 4 2PEOPLE: Inattention/lack of awareness: Acts of violence 2 1 6PEOPLE: Inattention/lack of awareness: Use of drugs or alcohol 1PEOPLE: Inattention/lack of awareness: Fatigue 1 1
Causal factors are listed in order of frequency for 2014. The top 10 causal factors assigned to fatal incidents for each year are highlighted in yellow.2014: three causal factors were equal 9th with six assigned incidents (11 factors are highlighted) 2013: two causal factors were equal 10th with nine assigned incidents (11 factors are highlighted) 2012: four causal factors were equal 9th with seven assigned incidents (12 factors are highlighted)
Table 25: Causal factors assigned to fatal incidents (2010–2014)

552. Key performance indicators
2.11.2 High potential event causal factors
• 86 of the 141 high potential events were assigned causal factors (124 of 179 in 2013)• 336 causal factors were assigned for the 86 high potential events (444 in 2013)• Between 1 and 12 causal factors were assigned per event (between 1 and 16 in 2013).
Causal factor group 2014 2013
PEOPLE (ACTS) 119 134
PROCESS (CONDITIONS) 217 310
Table 26: Causal factors assigned to high potential events (2013 & 2014)
The causal factors assigned to high potential events are shown in Table 27. The highlighted content indicates the top ten causal factors assigned to high potential events in 2014 compared with the previous four years. Six of the top ten were the same for all five years.
Additional information on the high potential events reported by region can be found on the IOGP Safety Zone website: http://info.iogp.org/Safety/. The information provided includes a narrative description of the event, the corrective actions and recommendations and the causal factors assigned by the reporting company.

56Safety performance indicators – 2014 data
Causal factors 2014 2013 2012 2011 2010
PROCESS: Organizational: Inadequate work standards/procedures 35 44 54 20 37PROCESS: Organizational: Inadequate hazard identification or risk assessment 28 35 61 24 47PROCESS: Tools, equipment, materials & products: Inadequate maintenance/inspection/testing 26 29 37 12 21PROCESS: Tools, equipment, materials & products: Inadequate design/specification/management of change
23 29 16 18 13
PROCESS: Organizational: Inadequate communication 22 26 36 15 19PROCES: Organizational: Inadequate supervision 21 24 44 18 31PEOPLE: Inattention/lack of awareness: Improper decision making or lack of judgement 21 24 38 21 23PEOPLE: Following procedures: Violation unintentional (by individual or group) 17 11 23 15 27PROCESS: Organizational: Inadequate training/competence 17 29 36 15 22PEOPLE: Use of Tools, equipment, materials & products: Improper use/position of tools/equipment/materials/products
16 22 21 17 9
PROCESS: Tools, equipment, materials & products: Inadequate/defective tools/equipment/materials/products
14 28 27 13 16
PEOPLE: Use of protective methods: Equipment or materials not secured 13 9 15 9 3PEOPLE: Following procedures: Violation intentional (by individual or group) 10 9 7 6 9PROCESS: Protective systems: Inadequate/defective guards or protective barriers 8 21 22 9 10PEOPLE: Inattention/lack of awareness: Lack of attention/distracted by other concerns/stress 6 11 21 8 15PEOPLE: Use of protective methods: Failure to warn of hazard 6 12 31 13 9PEOPLE: Use of protective methods: Inadequate use of safety systems 5 9 19 12 2PEOPLE: Use of protective methods: Personal Protective Equipment not used or used improperly
5 4 8 3 6
PROCESS: Protective systems: Inadequate/defective warning systems/safety devices 5 14 8 15 13PROCESS: Organizational: Failure to report/learn from events 5 4 3 2 4PROCESS: Workplace hazards: Hazardous atmosphere (explosive/toxic/asphyxiant) 4 3 6 5 6PROCESS: Organizational: Poor leadership/organizational culture 4 9 10 9 15PEOPLE: Following procedures: Improper position (in the line of fire) 4 8 13 3 9PEOPLE: Following procedures: Work or motion at improper speed 4 2 5 3 3PEOPLE: Following procedures: Improper lifting or loading 4 5 11 9 5PEOPLE: Use of protective methods: Disabled or removed guards, warning systems or safety devices
3 2 4 3 1
PROCESS: Workplace hazards: Inadequate surfaces, floors, walkways or roads 3 2 5 2 5PROCESS: Workplace hazards: Storms or acts of nature 2 3 2 2PEOPLE: Following procedures: Overexertion or improper position/posture for task 2 2 1 1 3PEOPLE: Use of Tools, equipment, materials & products: Servicing of energized equipment/inadequate energy isolation
2 3 5 3 6
PEOPLE: Inattention/lack of awareness: Fatigue 1 1 1 4 4PEOPLE: Inattention/lack of awareness: Acts of violence 2 1PROCESS: Protective systems: Inadequate security provisions or systems 2 4 3 1PROCESS: Protective systems: Inadequate/defective Personal Protective Equipment 4 2 1 3PROCESS: Work place hazards: Congestion, clutter or restricted motion 4 5 3 3
Causal factors are listed in order of frequency for 2014. The top 10 causal factors assigned to high potential events for each year are highlighted in yellow.
2010: two causal factors were equal 10th with 15 assigned incidents (11 factors are highlighted)
Table 27: Causal factors assigned to high potential events (2010–2014)

572. Key performance indicators
The following eight causal factors were common to the top ten for both fatal incidents and high potential events in 2014.
• PROCESS (CONDITIONS): Organizational: Inadequate work standards/procedures
• PROCESS (CONDITIONS): Organizational: Inadequate hazard identification or risk assessment
• PROCESS (CONDITIONS): Organizational: Inadequate training/competence• PEOPLE (ACTS): Inattention/lack of awareness: Improper decision making or
lack of judgement• PROCESS (CONDITIONS): Organizational: Inadequate supervision• PEOPLE (ACTS): Following procedures: Violation unintentional (by individual
or group)• PEOPLE (ACTS): Use of tools, equipment, materials and products: Improper
use/position of tools/equipment/materials/products• PROCESS (CONDITIONS): Organizational: Inadequate communication.
The following five causal factors appear consistently in the top ten for both fatal incidents and high potential events for 2014, 2013, 2012, 2011 and 2010.
• PROCESS (CONDITIONS): Organizational: Inadequate training/competence • PEOPLE (ACTS): Inattention/lack of awareness: Improper decision making or
lack of judgement• PROCESS (CONDITIONS): Organizational: Inadequate work standards/
procedures • PROCESS (CONDITIONS): Organizational: Inadequate supervision• PROCESS (CONDITIONS): Organizational: Inadequate hazard identification or
risk assessment.
The 4th most common causal factor for fatal incidents, which did not show in the top ten for high potential events was:
• PEOPLE (ACTS): Following procedures: Improper position (line of fire).

58Safety performance indicators – 2014 data
2.12 Life-Saving RulesIOGP has released a set of Life-Saving Rules (OGP Life-Saving Rules, Report 459), intended for use by the oil and gas industry to mitigate risk and reduce fatalities. Each Life-Saving Rule consists of a simple icon and descriptive text, providing clear, simple and consistent communication about risks in the workplace.
These rules were developed by using the fatal incident and high potential event data from the 1991 to 2010 safety performance indicators reports to identify the events and activities that are the highest risk and therefore provide clear instructions on how to mitigate against these risks. The Life-Saving Rules are split into eight ‘Core Rules’ and ten ‘Supplementary rules’ (previously called 'Supplemental Rules').
1. 2. 3.
5. 6.
7. 8.
9. 10. 11. 12. 13.
14. 15. 16.
17. 18.
4.
Personal Safety
Driving
Site Safety
Control of Work
Figure 44: Life-Saving Rules (from IOGP Report 459)
Assessment of the applicability of the Life-Saving Rules to fatal incident descriptions for 2014 data shows that at least 78% of the fatal incidents reported are covered by the Life-Saving Rules and may have been prevented by the adoption of this system. Insufficient information was provided to be able to assign a rule for six of the incidents.

592. Key performance indicators
Insufficient information to assign a Rule 17%
No appropriate Rule 5%
Supplementary Rule 40%
Core Rule 38%
Figure 45: Percentage of fatal incidents applicable to Life-Saving Rules (2014)
Isolation 4.8%
Permit to work 7.1%
Speeding/phone 2.4%
Work at height 11.9%
Insufficient information to assign a Rule 16.7%
No appropriate Rule 4.8%
PPE (Including flotation device) 2.4%Overhead power lines 2.4%
Line of fire – safe area 14.3%
Gas test 2.4%Lift plan 2.4%
Dropped objects 16.7%
Journey management 9.5%
Confined space 2.4%
Figure 46: Percentage of Life-Saving Rules allocated to fatal incidents (2014)

60Safety performance indicators – 2014 data
Rule IncidentsConfined space 1Isolation 2Journey management 4Permit to work 3Seat belt 0Speeding/phone 1Suspended load 0Work at height 5Dropped objects 7Drugs and alcohol 0Excavation 0Gas test 1Lift plan 1Line of fire – safe area 6Overhead power lines 1PPE (including flotation device) 1Smoking 0System override 0No appropriate Rule 2Insufficient information to assign a Rule 7Overall 42
Table 28: Life-Saving Rules allocated to fatal incidents (2014)

613. Results by region
3. Results by region
In this section the safety performance of the contributing IOGP Members is presented for regions and individual countries within those regions.
A list of countries from which companies have reported information and the division of countries into regions is provided in Appendix D.
Figure 47: Region map for IOGP data reports
3.1 FatalitiesTable 29 shows the number of fatal incidents and fatalities in each of the seven regions into which the data are partitioned.
Further analysis of the fatality statistics is presented in section 3.5, where five-year rolling averages of FAR are presented for each of the regions.
RegionFatalities FAR Fatal Incidents
2014 2013 2014 2013 2014 2013Africa 5 27 0.86 4.53 5 9Asia/Australasia 11 8 1.02 0.87 10 7Europe 4 9 1.04 2.26 4 5FSU 2 3 0.81 1.25 2 3Middle East 2 4 0.33 0.63 2 4North America 16 12 1.56 2.03 14 10South & Central America 5 17 1.13 4.37 5 5Overall 45 80 1.03 2.12 42 43
Table 29: Fatalities, fatal incidents and fatal accident rate by region (2013 & 2014)
NORTH AMERICA
SOUTH & CENTRAL AMERICA
EUROPE
AFRICA
MIDDLE EAST
ASIA/AUSTRALASIA
FSU

62Safety performance indicators – 2014 data
3.2 Fatal accident rate (FAR)Further analysis of the fatality statistics is presented in section 3.5, where five-year rolling averages of FAR are presented for each of the regions.
Region 2014 2013 2012 2011 2010Africa 0.86 4.53 2.83 1.25 3.38Asia/Australasia 1.02 0.87 1.35 3.28 4.14Europe 1.04 2.26 0.52 0.87 0.97FSU 0.81 1.25 0.55 1.59 2.17Middle East 0.33 0.63 1.95 1.74 1.63North America 1.56 2.03 7.50 1.50 5.08South & Central America 1.13 4.37 0.54 2.42 1.57Overall 1.03 2.12 2.38 1.88 2.76
Table 30: Fatal accident rate by region (2010–2014)
0
1
2
3
4
5
6
7
8
OverallSouth & Central America
North America
Middle East
FSUEuropeAsia/Australasia
Africa
Fata
l acc
iden
t rat
e (p
er 1
00 m
illio
n ho
urs
wor
ked)
20142013201220112010
Figure 48: Fatal accident rate by region (2010–2014)
Definitions
Fatal accident rate (FAR)The number of company/contractor fatalities per 100 million hours worked.

633. Results by region
3.3 Total recordable injury rate (TRIR)
Submissions without information on medical treatment cases were filtered out, leaving a database of 3 909 million hours, 90% of the database (see Appendix A).
Region 2014 2013 2012 2011 2010Africa 1.02 1.05 1.14 1.22 1.40Asia/Australasia 1.01 0.97 1.37 1.46 1.30Europe 2.58 2.58 2.64 2.81 3.05FSU 0.59 0.81 0.99 0.99 1.08Middle East 0.86 0.90 1.02 0.78 0.98North America 2.40 2.58 2.82 3.19 2.89South & Central America 2.82 3.13 3.05 3.17 2.76Overall 1.54 1.60 1.74 1.77 1.68
Table 31: Total recordable inury rate by region (2010–2014)
0.0
0.5
1.0
1.5
2.0
2.5
3.0
3.5
OverallSouth & Central America
North America
Middle East
FSUEuropeAsia/Australasia
Africa
Tota
l rec
orda
ble
inju
ry ra
te (p
er m
illio
n ho
urs
wor
ked)
20142013201220112010
Figure 49: Total recordable injury rate by region (2010–2014)
Definitions
Total recordable injury rate (TRIR)The number of recordable injuries (fatalities + lost work day cases + restricted work day cases + medical treatment cases) per million hours worked.

64Safety performance indicators – 2014 data
3.4 Lost time injury frequency (LTIF)
Further analysis of the lost time injuries is presented in section 3.5, where 5-year rolling averages of LTIF are presented for each of the regions, 100% of the database (see Appendix A).
Region 2014 2013 2012 2011 2010Africa 0.29 0.31 0.33 0.30 0.36Asia/Australasia 0.17 0.15 0.26 0.30 0.29Europe 0.81 1.02 0.91 1.08 1.06FSU 0.18 0.33 0.28 0.31 0.31Middle East 0.17 0.21 0.24 0.18 0.25North America 0.39 0.74 0.94 0.59 0.48South & Central America 0.77 0.85 0.69 0.64 0.61Overall 0.36 0.45 0.48 0.43 0.42
Table 32: Lost time injury frequency by region (2010–2014)
0.0
0.2
0.4
0.6
0.8
1.0
1.2
OverallSouth & Central America
North America
Middle East
FSUEuropeAsia/Australasia
Africa
Lost
tim
e in
jury
freq
uenc
y (p
er m
illio
n ho
urs
wor
ked)
20142013201220112010
Figure 50: Lost time injury frequency by region (2010–2014)
Definitions
Lost time injury frequency (LTIF)The number of lost time injuries (fatalities + lost work day cases) per million hours worked.

653. Results by region
3.5 FAR, TRIR and LTIF 5-year rolling averages
In order to smooth out variability in the annual values for the regional TRIR, FAR and LTIF, five-year rolling averages are computed which should provide a more reliable indicator of performance trends.
The five-year rolling average is calculated by summing the total number of incidents of the five previous years, and dividing by the sum of the work hours for these years. For example, the five-year rolling average for 2014 is calculated by:
(Number of injuries in 2010+2011+2012+2013+2014)
(Total work hours in 2010+2011+2012+2013+2014)
The number series involved in the calculation is frame-shifted along by one each year, e.g. 2013 is calculated from 2009–2013 data.
The figures show TRIR, FAR and LTIF five-year rolling averages for each of the regions, and includes the ‘overall’ curve.
The increase in the North America five-year rolling average FAR for 2012 can be attributed to the effect of a gas leak and explosion following the loss of mechanical integrity of a pipeline in Mexico (onshore) in which 31 individuals lost their lives.
1
2
3
4
5
201420132012201120102009FAR
five-
year
rolli
ng a
vera
ge (p
er 1
00 m
illio
n ho
urs) Africa
Asia/Australasia Europe FSU
Middle East
NorthAmerica
South &Central America
Overall
Figure 51: FAR five-year rolling average (2009–2014)

66Safety performance indicators – 2014 data
0
1
2
3
4
5
201420132012201120102009TRIR
five
-yea
r rol
ling
aver
age
(per
mill
ion
hour
s) AfricaAsia/Australasia Europe FSU
Middle East
NorthAmerica
South &Central America
Overall
Figure 52: TRIR five-year rolling average (2009–2014)
0.0
0.5
1.0
1.5
2.0
201420132012201120102009LTIF
five
-yea
r rol
ling
aver
age
(per
mill
ion
hour
s) AfricaAsia/Australasia Europe FSU
Middle East
NorthAmerica
South &Central America
Overall
Figure 53: LTIF five-year rolling average (2009–2014)

673. Results by region
3.6 Severity of lost work day cases
The number of days lost was reported for 71% of lost work day cases.
The severity of lost work day cases is the highest in the FSU region compared with the other regions (65 days lost per LWDC in 2014). This represents a 54% increase compared with the average for the previous five-year period.
Appendix A provides further information on the proportion of the database which can be used for lost work day case severity, 96% of the data submitted for South & Central America was usable for this metric, in comparison with only 53% of equivalent data for Europe.
RegionAverage days lost per LWDC
2014 2013 2014 relative to 2013 severity
2014 relative to 2009–2013 severity
Africa 33.2 29.2 # 14% higher # 17% higher
Asia/Australasia 31.0 30.4 # 2% higher # 11% higher
Europe 33.8 42.3 $ 20% lower $ 16% lower
FSU 64.8 51.0 # 27% higher # 54% higher
Middle East 34.6 13.6 # 154% higher # 91% higher
North America 49.2 49.6 $ 1% lower # 24% higher
South & Central America 49.1 60.3 $ 19% lower $ 32% lower
Overall 42.2 43.0 $ 2% lower # 2% higher
Table 33: Severity of lost work day cases by region (2014 compared to 2009–2013)
Definitions
Lost work day case (LWDC)An incident resulting in at least one day off work. Fatal incidents are not included.
Severity of lost work day casesThe number of days lost (where reported) for each lost work day case (LWDC).

68Safety performance indicators – 2014 data
0
10
20
30
40
50
60
70
80
South & Central America
North America
Middle East
FSUEuropeAsia/Australasia
Africa
Aver
age
days
lost
per
LW
DC
20142009–20132014 Overall
42.2
Figure 54: Severity of lost work day cases by region (2014 compared to 2009–2013)

693. Results by region
3.7 Individual country performanceThe safety performance reported by participating IOGP member companies of individual countries is presented in terms of the lost time injury frequency of companies jointly with contractors. To preserve the anonymity of companies, performance is only published for those countries for which at least two companies have reported statistics. Countries with less than 50 000 work hours reported are excluded, since results for such small populations of hours would be unrepresentative. Overall averages and regional averages include data from all countries regardless of work hours or number of contributing companies.
Of the 111 countries from which data have been reported, 31 are excluded by these constraints. The chart of relative LTIF performance for the remaining 80 countries compares the 2014 performance with that of 2013 and 2012.
The majority of countries in Africa, Asia/Australasia, FSU and the Middle East achieved an LTIF equal to or lower than the overall average LTIF (0.36). The majority of countries in Europe, North America and South & Central America show an LTIF higher than the global average.
TRIR calculations exclude data where medical treatment cases are not reported. The chart of relative TRIR performance therefore compares the 2014 performance with that of 2013 and 2012 for 79 of the 80 countries.
The majority of countries in Africa, Asia/Australasia, FSU and Middle East achieved a TRIR equal to or lower than the overall average TRIR (1.54). The majority of countries in Europe, North America and South & Central America show a TRIR higher than the global average.
For comparison, the five-year rolling average FAR is shown for each of the regions. There appears to be little if any correlation between these values and the regional average LTIF and TRIR values.
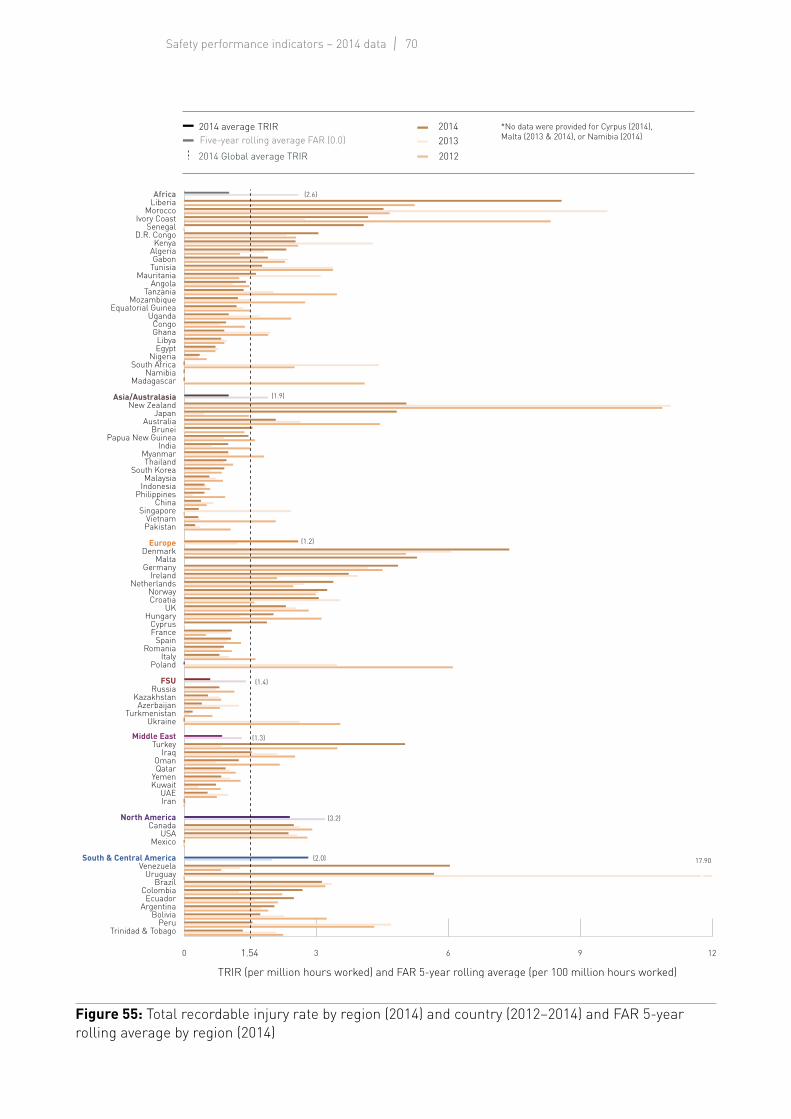
70Safety performance indicators – 2014 data
0 3 6 9 12
Trinidad & TobagoPeru
BoliviaArgentina
EcuadorColombia
BrazilUruguay
VenezuelaSouth & Central America
MexicoUSA
CanadaNorth America
IranUAE
KuwaitYemenQatarOman
IraqTurkey
Middle EastUkraine
TurkmenistanAzerbaijan
KazakhstanRussia
FSU
PolandItaly
RomaniaSpain
FranceCyprus
HungaryUK
CroatiaNorway
NetherlandsIreland
GermanyMalta
DenmarkEurope
PakistanVietnam
SingaporeChina
PhilippinesIndonesiaMalaysia
South KoreaThailand
MyanmarIndia
Papua New GuineaBrunei
AustraliaJapan
New ZealandAsia/Australasia
MadagascarNamibia
South AfricaNigeria
EgyptLibya
GhanaCongo
UgandaEquatorial Guinea
MozambiqueTanzania
AngolaMauritania
TunisiaGabon
AlgeriaKenya
D.R. CongoSenegal
Ivory CoastMorocco
LiberiaAfrica
17.90
1.54
2014 Global average TRIR 2012201320142014 average TRIR
Five-year rolling average FAR (0.0)
(2.6)
(1.9)
(1.2)
(1.4)
(1.3)
(3.2)
(2.0)
*No data were provided for Cyrpus (2014), Malta (2013 & 2014), or Namibia (2014)
TRIR (per million hours worked) and FAR 5-year rolling average (per 100 million hours worked)
Figure 55: Total recordable injury rate by region (2014) and country (2012–2014) and FAR 5-year rolling average by region (2014)

713. Results by region
0 1 2 3 4 5
UruguayBolivia
EcuadorTrinidad & Tobago
ArgentinaPeru
ColombiaBrazil
VenezuelaSouth & Central America
CanadaMexico
USANorth America
IranUAE
QatarKuwait
IraqOman
YemenTurkey
Middle East
AzerbaijanUkraine
TurkmenistanKazakhstan
RussiaFSU
Malta*Poland
HungarySpain
FranceRomania
NetherlandsUK
ItalyIrelandNorway
DenmarkGermany
CroatiaCyprusEurope
PhilippinesBrunei
SingaporeIndonesiaThailand
South KoreaChina
Papua New GuineaMalaysiaPakistanAustraliaMyanmar
IndiaVietnam
JapanNew Zealand
Asia/Australasia
LiberiaUganda
MadagascarNamibia
South AfricaNigeriaGhana
LibyaEquatorial Guinea
AngolaCongoEgypt
MozambiqueGabon
TanzaniaD.R. Congo
MoroccoMauritania
KenyaSenegalTunisiaAlgeria
Ivory coastAfrica
15.35
6.98
0.36
*No data were provided for Malta (2013 & 2014)
2014 Global average LTIF 2012201320142014 average LTIF One or more fatalities (2014) in red
Five-year rolling average FAR (0.0)
(2.6)
(1.9)
(1.2)
(1.4)
(1.3)
(3.2)
(2.0)
LTIF (per million hours worked) and FAR 5-year rolling average (per 100 million hours worked)
Figure 56: Lost time injury frequency by region (2014) and country (2012–2014) and FAR 5-year rolling average by region (2014)

72Safety performance indicators – 2014 data
3.8 Incident triangles by regionIn this section the relative numbers of types of occupational injury are shown in the form of ‘incident triangles’. The ratios have been corrected to account for the absence, in some data submissions, of medical treatment cases.
DefinitionsLost time injuries: Lost work day cases and fatalities.
Recordable injuries: Fatalities, lost work day cases, restricted work day cases and medical treatment cases where medical treatment cases are reported for the data set.
Ratio of lost time injuries to fatalities: The number of lost time injuries (LTI) divided by the total number of fatalities (LTI/fatalities).
Ratio of total recordable injuries to fatalities The number of recordable injuries divided by the total number of fatalities (recordable injuries/fatalities).
Year Ratio of lost time injuries to fatalities Ratio of total recordable injuries to fatalities2014 34:1 116:12013 7:1 23:12012 12:1 40:12011 24:1 97:1
Table 34: Ratio of lost time injuries and recordable injuries to fatalities – Africa (2011–2014)
Fatality
Lost time injuries
Recordable injuries
Company ContractorOverall
1
34
116 105
31
n/aFatalities = 0 1
Figure 57: Incident triangles by company & contractor – Africa (2014)
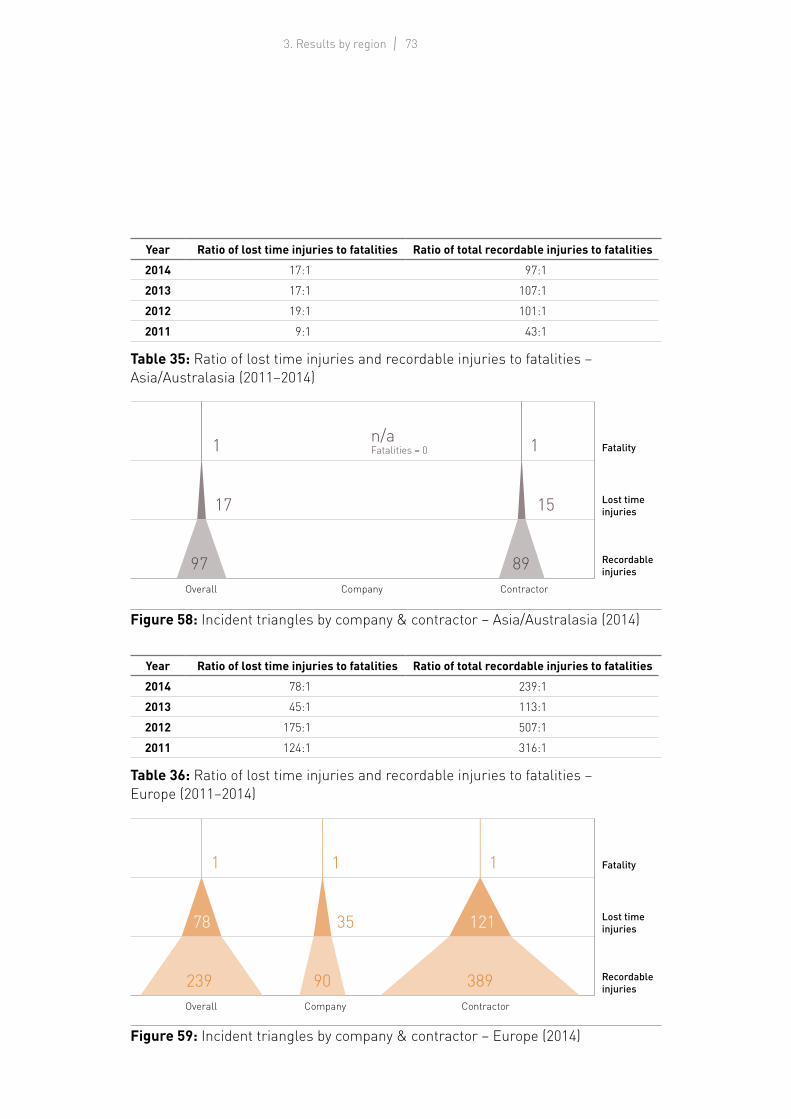
733. Results by region
Year Ratio of lost time injuries to fatalities Ratio of total recordable injuries to fatalities2014 17:1 97:12013 17:1 107:12012 19:1 101:12011 9:1 43:1
Table 35: Ratio of lost time injuries and recordable injuries to fatalities – Asia/Australasia (2011–2014)
Fatality
Lost time injuries
Recordable injuries
Company ContractorOverall
1
17
97 89
15
n/aFatalities = 0 1
Figure 58: Incident triangles by company & contractor – Asia/Australasia (2014)
Year Ratio of lost time injuries to fatalities Ratio of total recordable injuries to fatalities2014 78:1 239:12013 45:1 113:12012 175:1 507:12011 124:1 316:1
Table 36: Ratio of lost time injuries and recordable injuries to fatalities – Europe (2011–2014)
Fatality
Lost time injuries
Recordable injuries
Company ContractorOverall
1
78
239
1
35
90 389
121
1
Figure 59: Incident triangles by company & contractor – Europe (2014)

74Safety performance indicators – 2014 data
Year Ratio of lost time injuries to fatalities Ratio of total recordable injuries to fatalities2014 22:1 72:12013 27:1 65:12012 52:1 180:12011 19:1 62:1
Table 37: Ratio of lost time injuries and recordable injuries to fatalities – FSU (2011–2014)
Fatality
Lost time injuries
Recordable injuries
Company ContractorOverall
1
22
72 61
19
1n/aFatalities = 0
Figure 60: Incident triangles by company & contractor – FSU (2014)
Year Ratio of lost time injuries to fatalities Ratio of total recordable injuries to fatalities2014 53:1 255:12013 34:1 141:12012 12:1 52:12011 10:1 45:1
Table 38: Ratio of lost time injuries and recordable injuries to fatalities – Middle East (2011–2014)
Fatality
Lost time injuries
Recordable injuries
Company ContractorOverall
1
53
255 224
45
1n/aFatalities = 0
Figure 61: Incident triangles by company & contractor – Middle East (2014)

753. Results by region
Year Ratio of lost time injuries to fatalities Ratio of total recordable injuries to fatalities2014 25:1 96:12013 36:1 116:12012 13:1 35:12011 40:1 213:1
Table 39: Ratio of lost time injuries and recordable injuries to fatalities – North America (2011–2014)
Fatality
Lost time injuries
Recordable injuries
Company ContractorOverall
1
25
96
1
28
63 104
25
1
Figure 62: Incident triangles by company & contractor – North America (2014)
Year Ratio of lost time injuries to fatalities Ratio of total recordable injuries to fatalities2014 68:1 247:12013 19:1 72:12012 129:1 570:12011 26:1 131:1
Table 40: Ratio of lost time injuries and recordable injuries to fatalities – South & Central America (2011–2014)
Fatality
Lost time injuries
Recordable injuries
Company ContractorOverall
1
68
247 226
62
1n/aFatalities = 0
Figure 63: Incident triangles by company & contractor – South & Central America (2014)
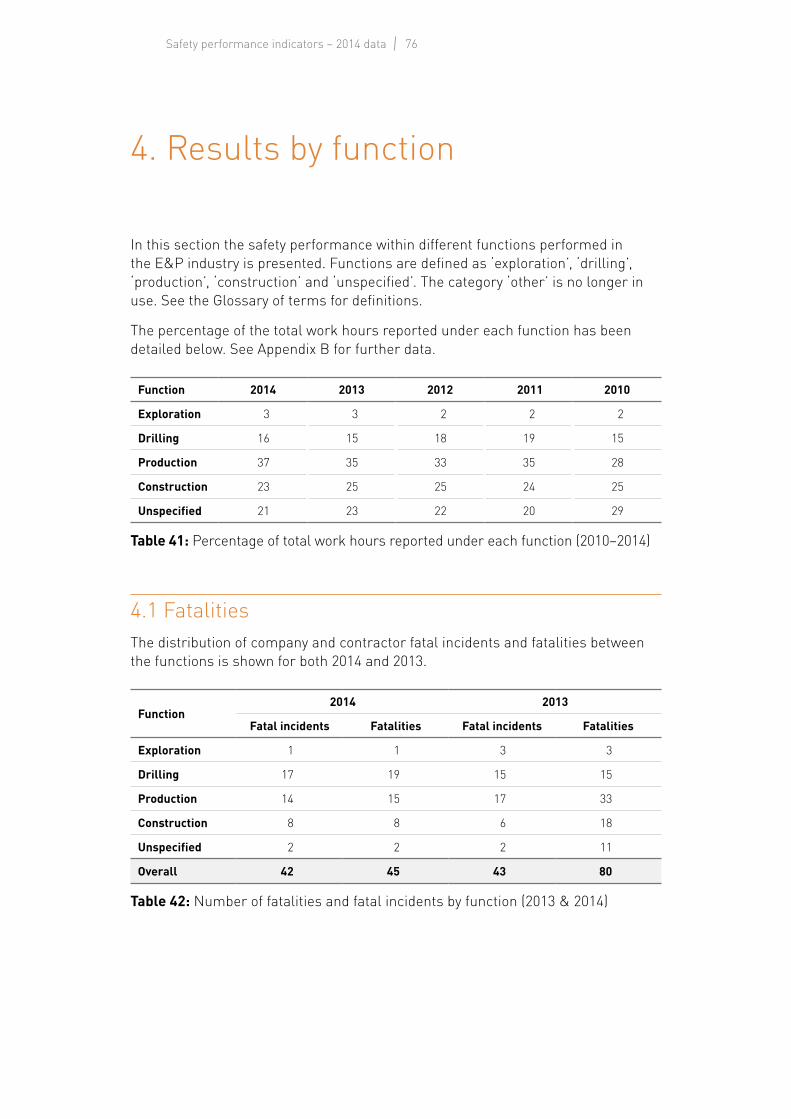
76Safety performance indicators – 2014 data
4. Results by function
In this section the safety performance within different functions performed in the E&P industry is presented. Functions are defined as ‘exploration’, ‘drilling’, ‘production’, ‘construction’ and ‘unspecified’. The category ‘other’ is no longer in use. See the Glossary of terms for definitions.
The percentage of the total work hours reported under each function has been detailed below. See Appendix B for further data.
Function 2014 2013 2012 2011 2010
Exploration 3 3 2 2 2
Drilling 16 15 18 19 15
Production 37 35 33 35 28
Construction 23 25 25 24 25
Unspecified 21 23 22 20 29
Table 41: Percentage of total work hours reported under each function (2010–2014)
4.1 FatalitiesThe distribution of company and contractor fatal incidents and fatalities between the functions is shown for both 2014 and 2013.
Function2014 2013
Fatal incidents Fatalities Fatal incidents Fatalities
Exploration 1 1 3 3
Drilling 17 19 15 15
Production 14 15 17 33
Construction 8 8 6 18
Unspecified 2 2 2 11
Overall 42 45 43 80
Table 42: Number of fatalities and fatal incidents by function (2013 & 2014)

774. Results by function
4.2 FAR, LTIF and TRIR – five-year rolling averages
In order to smooth out variability in the annual values for the regional TRIR, FAR and LTIF, five-year rolling averages are computed which should provide a more reliable indicator of performance trends.
The five-year rolling average is calculated by summing the total number of incidents of the five previous years, and dividing by the sum of the work hours for these years. For example, the five-year rolling average for 2014 is calculated by:
(Number of fatalities in function in 2010+2011+2012+2013+2014)
(Total work hours in function 2010+2011+2012+2013+2014)
The number series involved in the calculation is frame-shifted along by one each year, e.g. 2013 is calculated from 2009–2013 data.
The figures show TRIR, FAR and LTIF five-year rolling averages for each of the regions, and include the ‘overall’ curve.
0
1
2
3
4
5
6
7
201420132012201120102009
Exploration Drilling Production Construction* Unspecified Overall
FAR
five-
year
rolli
ng a
vera
ge (p
er 1
00 m
illio
n ho
urs)
*The 2009 5-year rolling average for ‘construction’ is not available as the category was used for the first time in 2006, replacing the function ‘other’.
Figure 64: FAR five-year rolling average by function (2009–2014)
The increase in the 2010 drilling FAR can be attributed to the effect of a fire and explosion offshore in the USA in which 11 individuals lost their lives.

78Safety performance indicators – 2014 data
For the calculation of TRIR results, submissions without information on medical treatment cases were filtered out, leaving a database of 3 909 million hours, 90% of the database (see Appendix A).
0
1
2
3
4
5 Overall
Unspeci�ed
Construction
Production
Drilling
Exploration
201420132012201120102009
Exploration Drilling Production Construction* Unspecified Overall
TRIR
five
-yea
r rol
ling
aver
age
(per
mill
ion
hour
s)
*The 2009 5-year rolling average for ‘construction’ is not available as the category was used for the first time in 2006, replacing the function ‘other’.
Figure 65: TRIR five-year rolling average by function (2009–2014)
0.0
0.5
1.0
1.5
201420132012201120102009
Exploration Drilling Production Construction* Unspecified Overall
LTIF
five
year
rolli
ng a
vera
ge (p
er m
illio
n ho
urs)
*The 2009 5-year rolling average for ‘construction’ is not available as the category was used for the first time in 2006, replacing the function ‘other’.
Figure 66: LTIF five-year rolling average by function (2009–2014)

793. Results by region
4.3 Severity of lost work day cases (LWDC)
0
10
20
30
40
50
60
UnspecifiedConstructionProductionDrillingExploration
42.2
Aver
age
days
lost
per
LW
DC
20142009–20132014 Overall
42.2
Figure 67: Average severity of lost work day cases by function (2014 compared with 2009–2013)
The overall severity based on the number of days lost per lost work day case (LWDC) is 42.2 in 2014 (43.0 in 2013). Offshore the LWDC severity is 45.5 days lost per LWDC compared with 39.9 days for onshore activities (51.2 and 35.8 respectively for 2013). See section 2.8 for additional information and Section 3.6 for LWDC severity by region.
4.4 Exploration performance
4.4.1 Total recordable injury rate – exploration
Definitions
ExplorationGeophysical, seismographic and geological operations, including their administrative and engineering aspects, construction, maintenance, materials supply and transportation of personnel and equipment; excludes drilling.
Figures 68 and 69 show the TRIR for companies and contractors for exploration related activities, in different regions of the world.
103 million work hours (87% of reported exploration work hours) were used in this analysis, of which company activities represent 20% and contractor activities represent 80%. This is an increase of 15 million work hours compared with 2013 (88 million work hours in 2013; 22% company, 78% contractor).

80Safety performance indicators – 2014 data
In 2014 the overall TRIR values for companies and contractors engaged in exploration activities are 0.39 and 1.75 respectively; the overall average TRIR for exploration activities is 1.48.
The total recordable injury rates for companies operating in the FSU show a strong increase, this is against a relatively small number of work hours (0.25 million work hours).
0
1
2
3
4
5
6
South & Central America
North America
Middle EastFSUEuropeAsia/Australasia
Africa
Com
pany
tota
l rec
orda
ble
inju
ry ra
te (p
er m
illio
n ho
urs
wor
ked)
20142009–20132014 Overall
0.39
Figure 68: Total recordable injury rate for companies engaged in exploration activities – by region (2014 compared with 2009–2013)
0
1
2
3
4
5
6
South & Central America
North America
Middle EastFSUEuropeAsia/Australasia
Africa
Cont
ract
or to
tal r
ecor
dabl
e in
jury
rate
(pe
r mill
ion
hour
s w
orke
d)
20142009–20132014 Overall
1.75
Figure 69: Total recordable injury rate for contractors engaged in exploration activities – by region (2014 compared with 2009–2013)

814. Results by function
4.4.2 Lost time injury frequency – explorationFigures 70 and 71 show the LTIF for companies and contractors for exploration related activities, in different regions of the world. The 2014 result is compared with average LTIF results in the previous five-year period.
118 million work hours (100% of reported exploration work hours) were used in this analysis of which company activities represent 21% and contractor activities represent 79%. This is an increase of 23 million work hours compared with 2013 (24% company, 76% contractor in 2013).
In 2014 the overall LTIF values for companies and contractors engaged in exploration activities are 0.00 and 0.37 respectively; the overall average LTIF for exploration activities is 0.30.
Company LTIF values associated with exploration show an LTIF of zero (no fatalities or LWDC reported) in all regions in 2014.
0
1
2
3
4
5
6
South & Central America
North America
Middle EastFSUEuropeAsia/Australasia
Africa
Com
pany
lost
tim
e in
jury
freq
uenc
y (p
er m
illio
n ho
urs
wor
ked)
20142009–20132014 Overall
0.00
Figure 70: Lost time injury frequency for companies engaged in exploration activities – by region (2014 compared with 2009–2013)
0
1
2
3
4
5
6
South & Central America
North America
Middle EastFSUEuropeAsia/Australasia
Africa
Cont
ract
or lo
st ti
me
inju
ry fr
eque
ncy
(per
mill
ion
hour
s w
orke
d)
20142009–20132014 Overall
0.37
Figure 71: Lost time injury frequency for contractors engaged in exploration activities – by region (2014 compared with 2009–2013)

82Safety performance indicators – 2014 data
4.5 Drilling performance
Definitions
DrillingAll exploration, appraisal and production drilling and workover as well as their administrative, engineering, construction, materials supply and transportation aspects. It includes site preparation, rigging up and down and restoration of the drilling site upon work completion. Drilling includes ALL exploration, appraisal and production drilling.
4.5.1 Total recordable injury rate – drillingFigures 72 and 73 show the TRIR for companies and contractors for drilling related activities in different regions of the world.
603 million work hours (85% of reported drilling work hours) were used in this analysis of which company activities represent 9% and contractor activities represent 91%. This represents an increase of 50 million work hours compared with 2013, with a similar ratio of company to contractor activities (12% to 88% respectively).
In 2014 the overall TRIR values for companies and contractors engaged in drilling activities are 0.92 and 2.97 respectively; the overall TRIR for drilling activities is 2.78.

834. Results by function
0
1
2
3
4
5
6
South & Central America
North America
Middle EastFSUEuropeAsia/Australasia
Africa
Com
pany
tota
l rec
orda
ble
inju
ry ra
te (p
er m
illio
n ho
urs
wor
ked)
20142009–20132014 Overall
0.92
Figure 72: Total recordable injury rate for companies engaged in drilling activities – by region (2014 compared with 2009–2013)
0
1
2
3
4
5
6
South & Central America
North America
Middle EastFSUEuropeAsia/Australasia
Africa
Cont
ract
or to
tal r
ecor
dabl
e in
jury
rate
(per
mill
ion
hour
s w
orke
d)
20142009–20132014 Overall
2.97
Figure 73: Total recordable injury rate for contractors engaged in drilling activities – by region (2014 compared with 2009–2013)

84Safety performance indicators – 2014 data
4.5.2 Lost time injury frequency – drilling706 million work hours (100% of reported drilling work hours) were used in this analysis, of which company activities represent 14% and contractor activities represent 86%. This represents an increase of 126 million work hours compared with 2013, with the same ratio of company to contractor activities.
Figures 74 and 75 show the LTIF for companies and contractors in drilling related activities in different regions of the world. In 2014 the overall LTIF for both companies and contractors engaged in drilling activities is 0.78.
In 2014 the overall LTIF values for companies and contractors engaged in drilling activities are 0.55 and 0.82 respectively.
0
1
2
3
4
5
6
South & Central America
North America
Middle EastFSUEuropeAsia/Australasia
Africa
Com
pany
lost
tim
e in
jury
freq
uenc
y (p
er m
illio
n ho
urs
wor
ked)
20142009–20132014 Overall
0.55
Figure 74: Lost time injury frequency for companies engaged in drilling activities – by region (2014 compared with 2009–2013)
0
1
2
3
4
5
6
South & Central America
North America
Middle East
FSUEuropeAsia/Australasia
Africa
Cont
ract
or lo
st ti
me
inju
ry fr
eque
ncy
(per
mill
ion
hour
s w
orke
d)
20142009–20132014 Overall
0.82
Figure 75: Lost time injury frequency for contractors engaged in drilling activities – by region (2014 compared with 2009–2013)
854. Results by function
4.6 Production performance
Definitions
ProductionPetroleum and natural gas producing operations, including their administrative and engineering aspects, minor construction, repairs, maintenance and servicing, materials supply, and transportation of personnel and equipment. It covers all mainstream production operations including wireline. It does not cover production drilling and workover. See Appendix E: Glossary of Terms for details.
4.6.1 Total recordable injury rate – productionFigures 76 and 77 show the TRIR for companies and contractors for production related activities in different regions of the world.
1 398 million work hours (85% of reported production work hours) were used in this analysis, of which company activities represent 26% and contractor activities represent 74%. This represents an increase of 119 million work hours compared with 2013, with a similar ratio of company to contractor activities (27% to 73% respectively).
In 2014 the overall TRIR values for companies and contractors engaged in production activities are 1.35 and 1.89 respectively; the overall average TRIR for production activities is 1.75.

86Safety performance indicators – 2014 data
0
1
2
3
4
5
6
South & Central America
North America
Middle EastFSUEuropeAsia/Australasia
Africa
Com
pany
tota
l rec
orda
ble
inju
ry ra
te (p
er m
illio
n ho
urs
wor
ked)
20142009–20132014 Overall
1.35
Figure 76: Total recordable injury rate for companies engaged in production activities – by region (2014 compared with 2009–2013)
0
1
2
3
4
5
6
South & Central America
North America
Middle EastFSUEuropeAsia/Australasia
Africa
Cont
ract
or to
tal r
ecor
dabl
e in
jury
rate
(per
mill
ion
hour
s w
orke
d)
20142009–20132014 Overall
1.89
Figure 77: Total recordable injury rate for contractors engaged in production activities – by region (2014 compared with 2009–2013)

874. Results by function
4.6.2 Lost time injury frequency – productionFigures 78 and 79 show the LTIF for companies and contractors for production related activities in different regions of the world.
1 629 million work hours (100% of reported production work hours) were used in this analysis of which company activities represent 27% and contractor activities represent 73%. This is an increase of 316 million work hours compared with 2013, with the same ratio of company to contractor activities.
In 2014 the overall LTIF values for companies and contractors engaged in production activities are 0.33 and 0.43 respectively; the overall average LTIF for production activities is 0.40.
0
1
2
3
4
5
6
South & Central America
North America
Middle EastFSUEuropeAsia/Australasia
Africa
Com
pany
lost
tim
e in
jury
freq
uenc
y (p
er m
illio
n ho
urs
wor
ked)
20142009–20132014 Overall
0.33
Figure 78: Lost time injury frequency for companies engaged in production activities – by region (2014 compared with 2009–2013)
0
1
2
3
4
5
6
South & Central America
North America
Middle EastFSUEuropeAsia/Australasia
Africa
0.43
Cont
ract
or lo
st ti
me
inju
ry fr
eque
ncy
(per
mill
ion
hour
s w
orke
d)
20142009–20132014 Overall
Figure 79: Lost time injury frequency for contractors engaged in production activities – by region (2014 compared with 2009–2013)

88Safety performance indicators – 2014 data
4.7 Construction performance
Definitions
ConstructionAll major construction, fabrication activities and also disassembly, removal and disposal (decommissioning) at the end of the facility life. Includes construction of process plant, yard construction of structures, offshore installation, hook-up and commissioning, and removal of redundant process facilities.
The company and contractor results for 2014 construction performance are presented below.
Construction activities are predominately conducted by contractors therefore the work hours reported for contractors are much greater than those reported for company employees. Refer to Appendix B for detailed information.
4.7.1 Total recordable injury rate – construction934 million work hours (93% of reported construction work hours) were used in this analysis of which company activities represent 7% and contractor activities represent 93%. This is an increase of 11 million work hours compared with 2013, with a similar ratio of company to contractor activities (8% to 92% respectively).
In 2014 the overall TRIR values for companies and contractors engaged in construction activities are 0.23 and 1.14 respectively; the overall average TRIR for construction activities is 1.08.

894. Results by function
0
1
2
3
4
5
6 2009-2013
2014
South & Central America
North America
Middle EastFSUEuropeAsia/Australasia
Africa
Com
pany
tota
l rec
orda
ble
inju
ry ra
te (p
er m
illio
n ho
urs
wor
ked)
20142009–20132014 Overall
0.23
Figure 80: Total recordable injury rate for companies engaged in construction activities – by region (2014 compared with 2009–2013)
0
1
2
3
4
5
6
South & Central America
North America
Middle EastFSUEuropeAsia/Australasia
Africa
Con
trac
tor t
otal
reco
rdab
le in
jury
rate
(per
mill
ion
hour
s w
orke
d)
20142009–20132014 Overall
1.14
Figure 81: Total recordable injury rate for contractors engaged in construction activities – by region (2014 compared with 2009–2013)

90Safety performance indicators – 2014 data
4.7.2 Lost time injury frequency – construction1 001 million work hours (100% of reported construction work hours) were used in this analysis of which company activities represent 7% and contractor activities represent 93%. This represents an increase of 71 million work hours compared with 2013, with a similar ratio of company to contractor activities (8% to 92% respectively).
In 2014 the overall LTIF values for companies and contractors engaged in construction activities are 0.06 and 0.17 respectively; the overall average LTIF for construction activities is 0.17.
0
1
2
3
4
5
6
South & Central America
North America
Middle EastFSUEuropeAsia/Australasia
Africa
Com
pany
lost
tim
e in
jury
freq
uenc
y (p
er m
illio
n ho
urs
wor
ked)
20142009–20132014 Overall
0.06
Figure 82: Lost time injury frequency for companies engaged in construction activities – by region (2014 compared with 2009–2013)
0
1
2
3
4
5
6
South & Central America
North America
Middle EastFSUEuropeAsia/Australasia
Africa
0.17
Cont
ract
or lo
st ti
me
inju
ry fr
eque
ncy
(per
mill
ion
hour
s w
orke
d)
20142009–20132014 Overall
Figure 83: Lost time injury frequency for contractors engaged in construction activities – by region (2014 compared with 2009–2013)

914. Results by function
4.8 Unspecified performance
Definitions
UnspecifiedUnspecified is used for the entry of data associated with office personnel who’s work hours and incident data cannot be reasonably assigned to the administrative support of one of the function groupings of exploration, drilling, production or construction. Corporate overhead support function personnel such as finance or human resources staff may be examples where work hours cannot be specifically assigned to a particular function.
4.8.1 Total recordable injury rate – unspecified871 million work hours (95% of work hours reported as unspecified) were used in this analysis, of which company activities represent 32% and contractor activities represent 68%. This represents an increase of 49 million work hours compared with 2013, with a similar ratio company to contractor activities (33% to 67% respectively in 2013).
In 2014 the overall TRIR values for companies and contractors engaged in activities where the work function was not specified are 0.52 and 1.00 respectively; the overall average TRIR for unspecified activities is 0.85.

92Safety performance indicators – 2014 data
0
1
2
3
4
5
6 2009-2013
2014
South & Central America
North America
Middle EastFSUEuropeAsia/Australasia
Africa
Com
pany
tota
l rec
orda
ble
inju
ry ra
te (p
er m
illio
n ho
urs
wor
ked)
20142009–20132014 Overall
0.52
Figure 84: Total recordable injury rate for companies engaged in unspecified activities – by region (2014 compared with 2009–2013)
0
1
2
3
4
5
6
South & Central America
North America
Middle EastFSUEuropeAsia/Australasia
Africa
Cont
ract
or to
tal r
ecor
dabl
e in
jury
rate
(per
mill
ion
hour
s w
orke
d)
20142009–20132014 Overall
1.00
Figure 85: Total recordable injury rate for contractors engaged in unspecified activities – by region (2014 compared with 2009–2013)

934. Results by function
4.8.2 Lost time injury frequency – unspecified912 million work hours (100% of work hours reported as unspecified) were used in this analysis of which company activities represent 34% and contractor activities represent 66%. This represents an increase of 60 million work hours compared with 2013, with the same ratio of company to contractor activities.
In 2014 the overall LTIF values for companies and contractors engaged in activities in the ‘unspecified’ work function are 0.14 and 0.19 respectively; the overall average LTIF for unspecified activities is 0.17.
Reported under the ‘unspecified’ function in 2014 were two contractor fatalities with 43 company and 109 contractor lost work day cases.
Reported under the ‘unspecified’ function from 2009 to 2013 were 31 company and 72 contractor fatalities with 333 company and 950 contractor lost work day cases.
0
1
2
3
4
5
6
South & Central America
North America
Middle EastFSUEuropeAsia/Australasia
Africa
Com
pany
lost
tim
e in
jury
freq
uenc
y (p
er m
illio
n ho
urs
wor
ked)
20142009–20132014 Overall
0.14
Figure 86: Lost time injury frequency for companies engaged in construction activities – by region (2014 compared with 2009–2013)
0
1
2
3
4
5
6
South & Central America
North America
Middle EastFSUEuropeAsia/Australasia
Africa
0.19
Cont
ract
or lo
st ti
me
inju
ry fr
eque
ncy
(per
mill
ion
hour
s w
orke
d)
20142009–20132014 Overall
Figure 87: Lost time injury frequency for contractors engaged in construction activities – by region (2014 compared with 2009–2013)
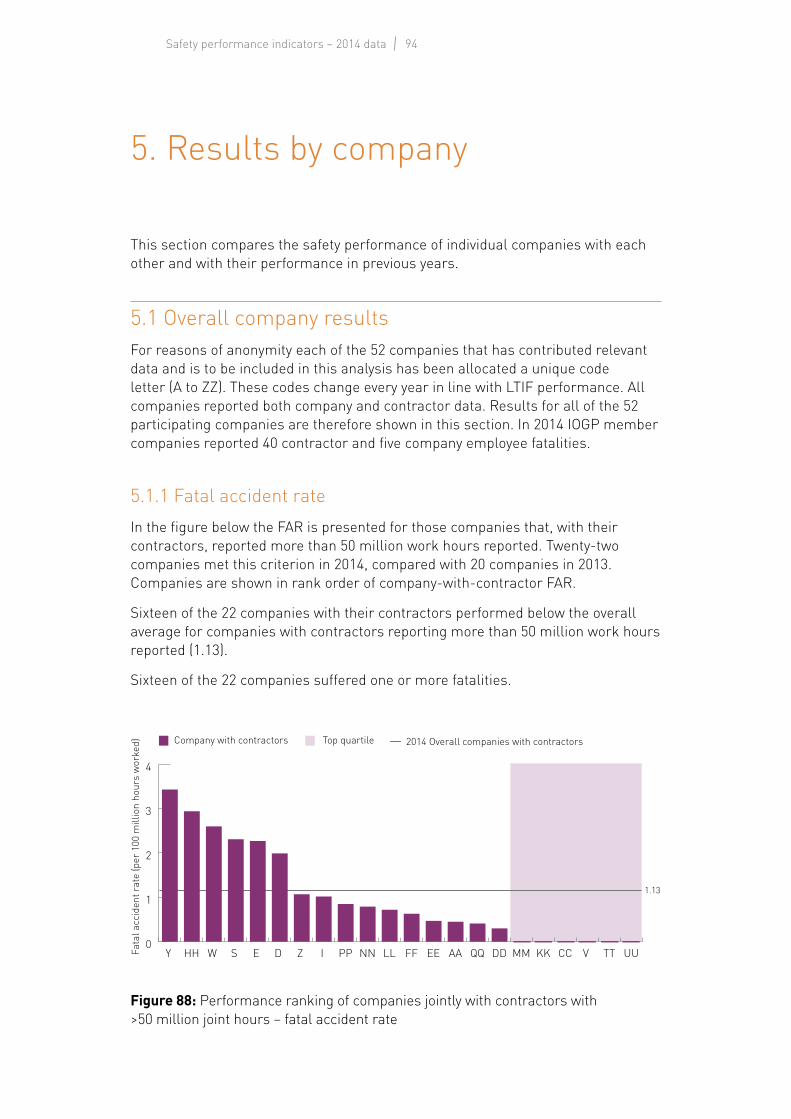
94Safety performance indicators – 2014 data
5. Results by company
This section compares the safety performance of individual companies with each other and with their performance in previous years.
5.1 Overall company resultsFor reasons of anonymity each of the 52 companies that has contributed relevant data and is to be included in this analysis has been allocated a unique code letter (A to ZZ). These codes change every year in line with LTIF performance. All companies reported both company and contractor data. Results for all of the 52 participating companies are therefore shown in this section. In 2014 IOGP member companies reported 40 contractor and five company employee fatalities.
5.1.1 Fatal accident rateIn the figure below the FAR is presented for those companies that, with their contractors, reported more than 50 million work hours reported. Twenty-two companies met this criterion in 2014, compared with 20 companies in 2013. Companies are shown in rank order of company-with-contractor FAR.
Sixteen of the 22 companies with their contractors performed below the overall average for companies with contractors reporting more than 50 million work hours reported (1.13).
Sixteen of the 22 companies suffered one or more fatalities.
Fata
l acc
iden
t rat
e (p
er 1
00 m
illio
n ho
urs
wor
ked) Company with contractors Top quartile 2014 Overall companies with contractors
1.13
0
1
2
3
4
UU TT V CC KK MM DD QQ AA EE FF LL NN PP I Z D E S W HH Y
Figure 88: Performance ranking of companies jointly with contractors with >50 million joint hours – fatal accident rate

955. Results by company
5.1.2 Total recordable injury rateThe TRIR for companies together with their contractors is presented below. Data are only included where Medical Treatment Cases (MTC) are reported. Fifty-one of the 52 participating companies qualified for inclusion in this section. Company W did not provide MTC data and is excluded from the TRIR analysis.
The TRIR for company alone is plotted alongside the TRIR for company and contractors jointly. Details of results are tabulated in Appendix B.
In six instances, contractors achieved a lower TRIR than the companies they were employed by.
Tota
l rec
orda
ble
inju
ry ra
te (p
er m
illio
n ho
urs
wor
ked)
Company with contractors Company only Top quartile 2014 Overall companies with contractors
1.54
0
1
2
3
4
5
6
7 Company onlyCompany with Contractors
YY WWGGTTHHEEOOLLKKY UUZ QQCCDDFFS IIF AAM PP V MMNNSSVVR JJQ U XXX BBRRP J I K D ZZG O E N L C A T H B
Figure 89: Performance ranking of companies vs. companies with contractors combined – total recordable injury rate
In Figure 90 the TRIR for contractors alone is plotted alongside the TRIR for company and contractors jointly.
Tota
l rec
orda
ble
inju
ry ra
te (p
er m
illio
n ho
urs
wor
ked)
Company with contractors Contractor only Top quartile 2014 Overall companies with contractors
1.54
0
1
2
3
4
5
6
7 Contractor onlyCompany with Contractors
YY WWGGTTHHEEOOLLKKY UUZ QQCCDDFFS IIF AAM PP V MMNNSSVVR JJQ U XXX BBRRP J I K D ZZG O E N L C A T H B
Figure 90: Performance ranking of contractors vs. companies with contractors combined – total recordable injury rate
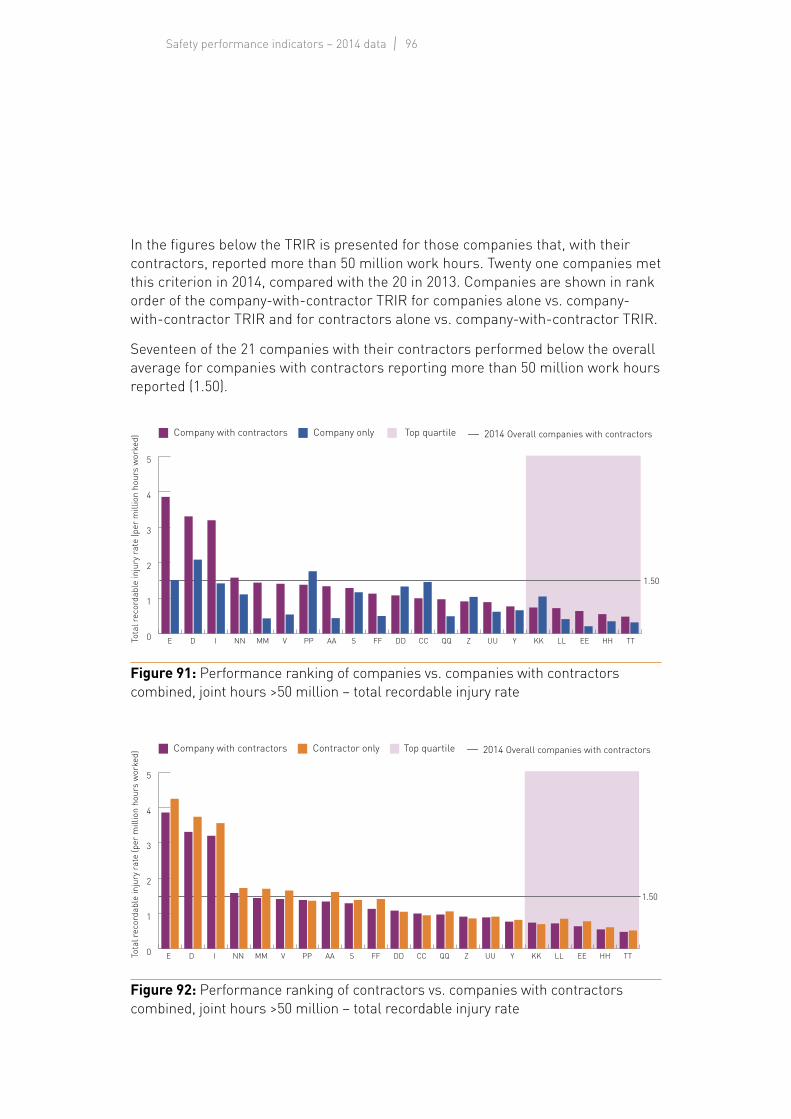
96Safety performance indicators – 2014 data
In the figures below the TRIR is presented for those companies that, with their contractors, reported more than 50 million work hours. Twenty one companies met this criterion in 2014, compared with the 20 in 2013. Companies are shown in rank order of the company-with-contractor TRIR for companies alone vs. company-with-contractor TRIR and for contractors alone vs. company-with-contractor TRIR.
Seventeen of the 21 companies with their contractors performed below the overall average for companies with contractors reporting more than 50 million work hours reported (1.50).
Tota
l rec
orda
ble
inju
ry ra
te (p
er m
illio
n ho
urs
wor
ked)
Company with contractors Company only Top quartile 2014 Overall companies with contractors
1.50
0
1
2
3
4
5 Company onlyCompany with Contractors
TT HH EE LL KK Y UU Z QQ CC DD FF S AA PP V MM NN I D E
Figure 91: Performance ranking of companies vs. companies with contractors combined, joint hours >50 million – total recordable injury rate
Tota
l rec
orda
ble
inju
ry ra
te (p
er m
illio
n ho
urs
wor
ked)
Company with contractors Contractor only Top quartile 2014 Overall companies with contractors
1.50
0
1
2
3
4
5 Contractor onlyCompany with Contractors
TT HH EE LL KK Y UU Z QQ CC DD FF S AA PP V MM NN I D E
Figure 92: Performance ranking of contractors vs. companies with contractors combined, joint hours >50 million – total recordable injury rate

975. Results by company
The remaining 30 companies which, with their contractors, reported less than 50 million work hours are presented below in rank order of the company-with-contractor TRIR for companies alone vs. company-with-contractor TRIR and for contractors alone vs. company-with-contractor TRIR.
Twenty three of the 30 companies with their contractors performed above the overall average for smaller companies with contractors (1.58).
Tota
l rec
orda
ble
inju
ry ra
te (p
er m
illio
n ho
urs
wor
ked)
Company with contractors Company only Top quartile 2014 Overall companies with contractors
1.58
0
1
2
3
4
5
6
7 Company onlyCompany with Contractors
YY WW GG OO II F M VV SS R JJ Q U XX X BB RR P J K ZZ G O N L C A T H B
Figure 93: Performance ranking of companies vs. companies with contractors combined, joint hours <=50 million – total recordable injury rate
Tota
l rec
orda
ble
inju
ry ra
te (p
er m
illio
n ho
urs
wor
ked)
Company with contractors Contractor only Top quartile 2014 Overall companies with contractors
1.58
0
1
2
3
4
5
6
7Contractor only
Company with Contractors
YY WW GG OO II F M VV SS R JJ Q U XX X BB P J K ZZ G O N L C A T H B
Figure 94: Performance ranking of contractors vs. companies with contractors combined joint hours <=50 million – total recordable injury rate

98Safety performance indicators – 2014 data
5.1.3 Lost time injury frequency The figure shows the LTIF in rank order for companies together with their contractors. All of the 52 participating companies (A to ZZ) contributed both company and contractor data, although not always for every country in which operations were conducted. Data for all 52 participating companies are therefore included in this section.
The LTIF for the company alone and contractors alone is plotted alongside the LTIF for company and contractors jointly. The incidence of a fatality in either company or contractor operations is also indicated*. Details of results are tabulated in Appendix B.
• 46 companies with their contractors delivered a LTIF of less than one• 23 of the 52 companies presented below suffered one or more fatality• In eight instances, contractors achieved a lower LTIF than the companies they
were employed by.
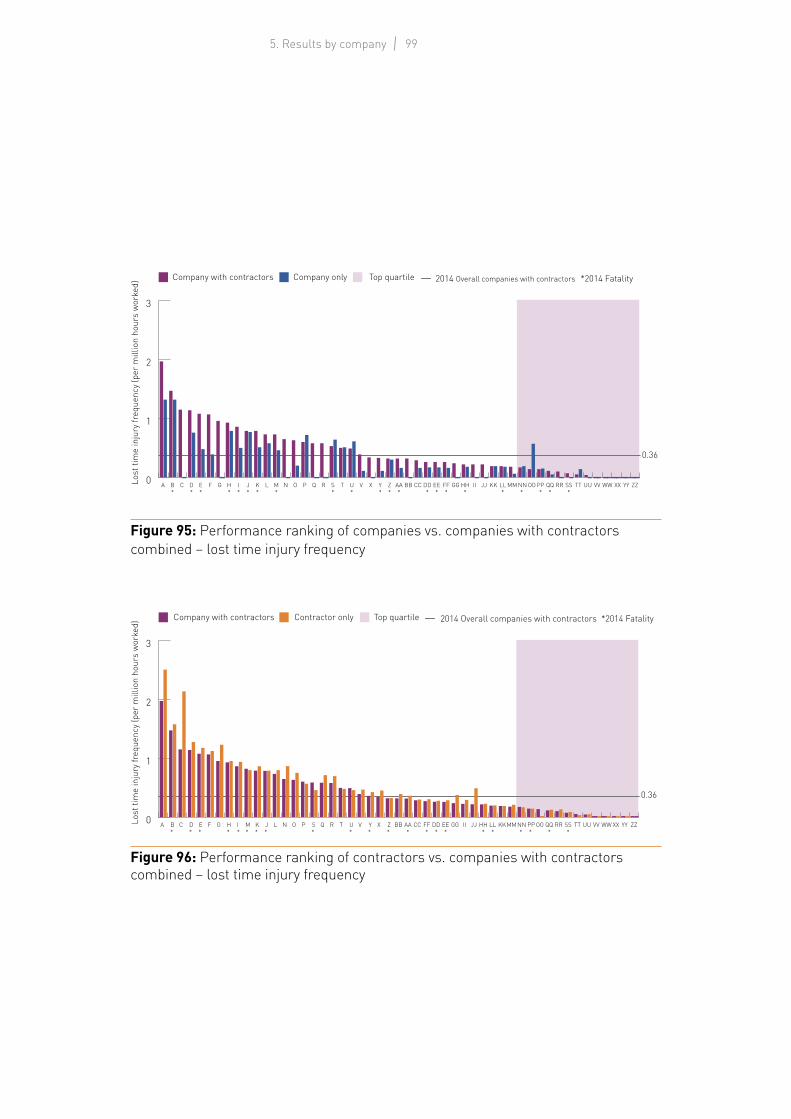
995. Results by company
Lost
tim
e in
jury
freq
uenc
y (p
er m
illio
n ho
urs
wor
ked)
Company with contractors Company only Top quartile 2014 Overall companies with contractors *2014 Fatality
0.36
0
1
2
3 Company onlyCompany with Contractors
ZZ YY XX WWVVUUTTSS*
RRQQ*
PP*
OO NN*
MMLL*
KKJJIIHH*
GGFF*
EE*
DD*
CCBBAA*
Z*
Y*
XVU*
TS*
RQPONM*
LK*
J*
I*
H*
GFE*
D*
CB*
A
Figure 95: Performance ranking of companies vs. companies with contractors combined – lost time injury frequency
Lost
tim
e in
jury
freq
uenc
y (p
er m
illio
n ho
urs
wor
ked)
Company with contractors Contractor only Top quartile 2014 Overall companies with contractors
0.36
*2014 Fatality
0
1
2
3 Contractor onlyCompany with Contractors
ZZYY XX WWVVUUTTSS*
RRQQ*
OO PP*
NN*
MMKKLL*
HH*
JJIIGGEE*
DD*
FF*
CCAA*
BBZ*
X Y*
V U*
T R Q S*
P O N L J*
K*
M*
I *
H*
G F E*
D*
C B*
A
Figure 96: Performance ranking of contractors vs. companies with contractors combined – lost time injury frequency

100Safety performance indicators – 2014 data
In figures 97 and 98 below the LTIF is presented for those companies that, with their contractors, reported more than 50 million work hours. Twenty two companies met this criterion in 2014, compared with 20 companies in 2013. Companies are shown in rank order of the company-with-contractor LTIF.
• 16 of the 22 companies with their contractors performed below the overall average for companies with contractors reporting more than 50 million work hours reported (0.34).
• 16 of the 22 companies suffered one or more fatalities.
Lost
tim
e in
jury
freq
uenc
y (p
er m
illio
n ho
urs
wor
ked)
Company with contractors Company only Top quartile 2014 Overall companies with contractors *2014 Fatality
0.34
0.0
0.5
1.0
1.5
2.0 Company onlyCompany with Contractors
UU TT QQ* PP* NN* MM LL* KK HH* FF* EE* DD* CC AA* Z* Y* W* V S*I*E*D*
Figure 97: Performance ranking of companies vs. companies with contractors combined, joint hours >50 million – lost time injury frequency
Lost
tim
e in
jury
freq
uenc
y (p
er m
illio
n ho
urs
wor
ked)
Company with contractors Contractor only Top quartile 2014 Overall companies with contractors
0.34
*2014 Fatality
0.0
0.5
1.0
1.5
2.0Contractor only
Company with Contractors
UU TT QQ* PP* NN* MM LL* KK HH* FF* EE* DD* CC AA* Z* Y* W* V S* I* E* D*
Figure 98: Performance ranking of contractors vs. companies with contractors combined, joint hours >50 million – lost time injury frequency
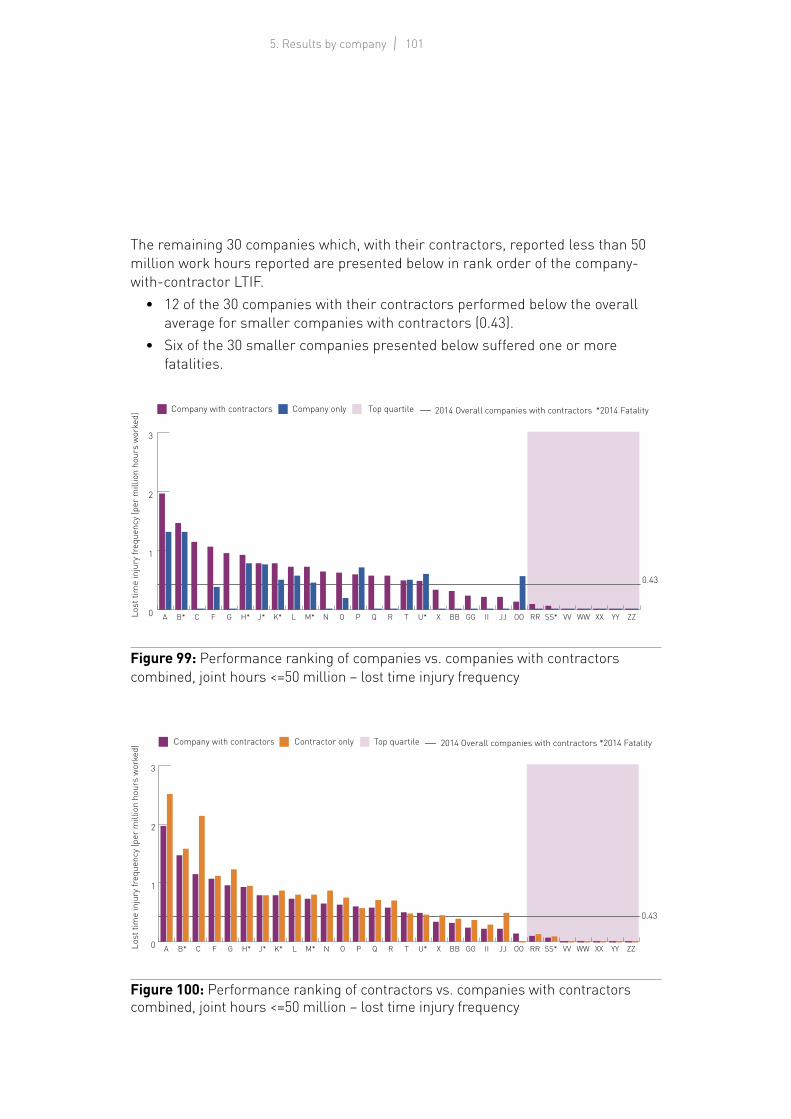
1015. Results by company
The remaining 30 companies which, with their contractors, reported less than 50 million work hours reported are presented below in rank order of the company-with-contractor LTIF.
• 12 of the 30 companies with their contractors performed below the overall average for smaller companies with contractors (0.43).
• Six of the 30 smaller companies presented below suffered one or more fatalities.
Lost
tim
e in
jury
freq
uenc
y (p
er m
illio
n ho
urs
wor
ked)
Company with contractors Company only Top quartile 2014 Overall companies with contractors *2014 Fatality
0.43
0
1
2
3 Company onlyCompany with Contractors
ZZYYXXWWVVSS*RROOJJIIGGBBXU*TRQPONM*LK*J*H*GFCB*A
Figure 99: Performance ranking of companies vs. companies with contractors combined, joint hours <=50 million – lost time injury frequency
Lost
tim
e in
jury
freq
uenc
y (p
er m
illio
n ho
urs
wor
ked)
Company with contractors Contractor only Top quartile 2014 Overall companies with contractors
0.43
*2014 Fatality
0
1
2
3Contractor only
Company with Contractors
ZZYYXXWWVVSS*RROOJJIIGGBBXU*TRQPONM*LK*J*H*GFCB*A
Figure 100: Performance ranking of contractors vs. companies with contractors combined, joint hours <=50 million – lost time injury frequency

102Safety performance indicators – 2014 data
5.2 Company results by functionResults of companies together with their contractors have been analysed by function to allow more in-depth benchmarking between companies. The TRIR indicator has been selected, and the ranked results are shown in the following charts. Only companies that provided data by function are included, and then only those companies that reported more than 100 000 hours worked. Results against smaller numbers of hours would not have statistical significance. The company code letters are the same as used elsewhere in this section.
Exploration was the only function where the top quartile company with contractors shows a TRIR of zero. It is also the function with the smallest number of work hours reported (3% of the total in 2014, see Appendix A).
Tota
l rec
orda
ble
inju
ry ra
te (p
er m
illio
n ho
urs
wor
ked) Company with contractors Top quartile 2014 Overall companies with contractors
1.48
0
2
4
6
8
10
12
Z TT T PP LL L JJ HH H G QQ EE F D Y CC O BB P S R II NN KK DD AA K E XX Q X U A C RR V I
13.22
Figure 101: Performance ranking of companies jointly with contractors – exploration – total recordable injury rate
Tota
l rec
orda
ble
inju
ry ra
te (p
er m
illio
n ho
urs
wor
ked) Company with contractors Top quartile 2014 Overall companies with contractors
2.78
0
2
4
6
8
10
12
YY UU PP Y LL Z EE HH M QQ AA TT X SS DD JJ FF VV Q S V R CC L F II RR C NN P J U XX I E N O T G K A KK ZZ D H
Figure 102: Performance ranking of companies jointly with contractors – drilling – total recordable injury rate

1035. Results by company
Tota
l rec
orda
ble
inju
ry ra
te (p
er m
illio
n ho
urs
wor
ked) Company with contractors Top quartile 2014 Overall companies with contractors
1.75
0
2
4
6
8
10
12
ZZ GG WW KK Z M UU LL Y HH CC U QQ TT R OO EE II S FF DD V SS PP F AA J Q RR NN JJ K I G H VV O X D P E L A T C
Figure 103: Performance ranking of companies jointly with contractors – production – total recordable injury rate
Tota
l rec
orda
ble
inju
ry ra
te (p
er m
illio
n ho
urs
wor
ked) Company with contractors Top quartile 2014 Overall companies with contractors
1.08
0
2
4
6
8
10
12
X VV T F TT WW KK HH EE FF CC DD S GG NN Z U LL UU SS Y QQ AA PP RR II L D V M C H P K JJ R G O A
16.61
Figure 104: Performance ranking of companies jointly with contractors – construction – total recordable injury rate

104Safety performance indicators – 2014 data
Appendix A
Database dimensions
0
500
1000
1500
2000
2500
3000
3500
4000
4500
5000
2014201020052000199519901985
Num
ber o
f wor
k ho
urs
(mill
ions
)
Company Contractor
Figure A.1: Work hours reported by company and contractor (1985–2014)
Data typeWork hours reported (thousands)
Onshore Offshore Overall
Company 719 829 225 743 945 572
Contractor 2 419 208 1 001 179 3 420 387
Overall 3 139 037 1 226 922 4 365 959
Table A.1: Work hours reported by data type and operations (2014)
The database for the year 2014 covers 4 365 959 000 work hours reported in the exploration and production sector of the oil and gas industry. The database is 16% larger than it was in 2013.
• 72% of the hours reported were associated with onshore activities, 28% with offshore activities
• 111 countries are represented in the database, one more than in the 2013 database. Countries are listed in Appendix D
• 52 companies contributed data, of which all companies contributed contractor statistics, though not in every case for each country of operation
• Of the 52 companies, 50 had contributed data in 2013 which accounted for 98% of the database in 2013 and 98% of the database in 2014. Forty five of the companies submitting 2014 data also provided data in 2012
• 25 of the companies contributed 90% of the hours. Seven companies between them covered 50% of the hours, and the largest contributor accounted for 11%
• 22% of the reported work hours were related to company personnel and 78% were related to contractors.
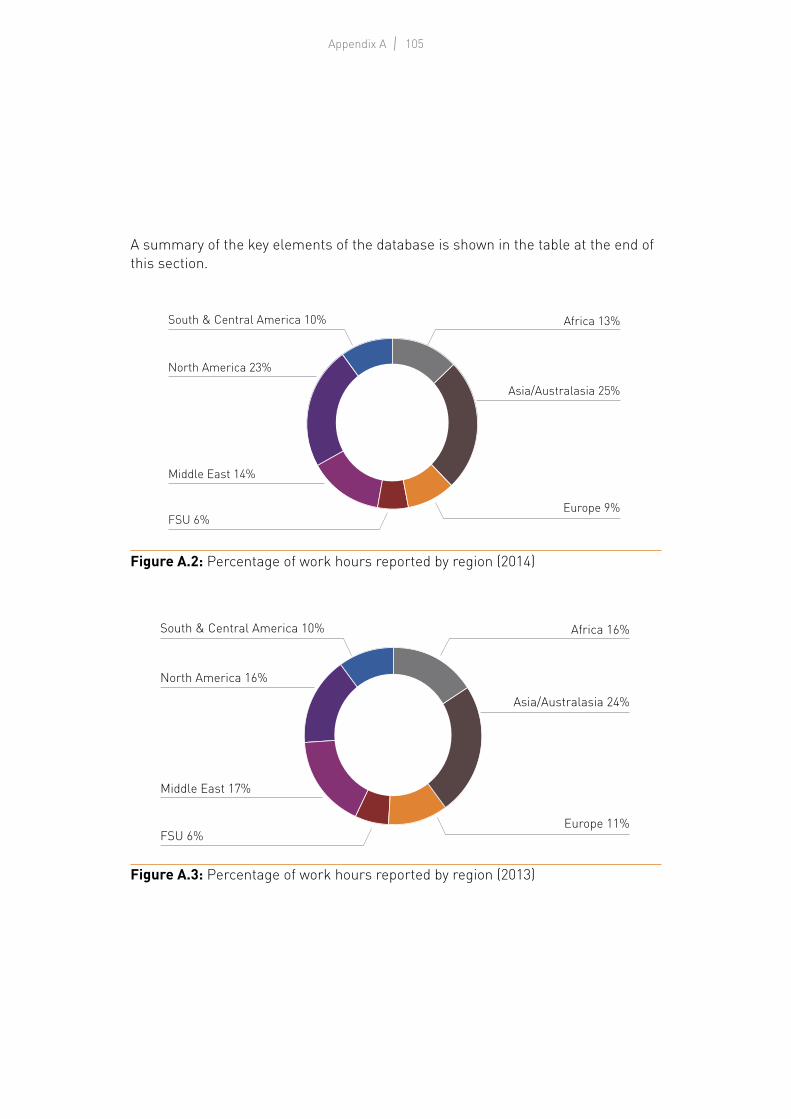
105Appendix A
A summary of the key elements of the database is shown in the table at the end of this section.
Asia/Australasia 25%
South & Central America 10%
North America 23%
Middle East 14%
FSU 6%Europe 9%
Africa 13%
Figure A.2: Percentage of work hours reported by region (2014)
Asia/Australasia 24%
South & Central America 10%
North America 16%
Middle East 17%
FSU 6%Europe 11%
Africa 16%
Figure A.3: Percentage of work hours reported by region (2013)

106Safety performance indicators – 2014 data
Unspecified 21%
Exploration 3%
Construction 23%
Production 37%
Drilling 16%
Figure A.4: Percentage of work hours reported by function (2014)
Unspecified 23%
Exploration 2%
Construction 25%
Production 35%
Drilling 15%
Figure A.5: Percentage of work hours reported by function (2013)
‘Unspecified (as a work function)’ is used for the entry of data associated with office personnel whose work hours and incident data cannot be reasonably assigned to the administrative support of one of the function groupings of exploration, drilling, production or construction. Corporate overhead support function personnel such as finance or human resources staff may be examples where work hours cannot be specifically assigned to a particular function. All other data that are not separated out by function are reported as ‘unspecified’.

107Appendix A
Proportion of database used in analysisFor calculations of FAR, Fatal incidents per 100 million work hours, and LTIF:
• All hours in the database were used.
For calculations of TRIR:• Submissions without information on medical treatment cases were filtered
out, leaving a database of 3 909 million hours, 90% of the database.• In 2013, the TRIR database was 3 651 million hours, 99% of the total
database.• The region where the smallest proportion of the database could be used was
North America (62%).
For calculations of lost work day case severity:• Submissions without information on days off work were filtered out, leaving a
database of 3 213 million hours, 74% of the total database.• In 2013, this database was 2 625 million hours, 70% of the total database.• Europe has only 53% severity information respectively, whereas 96% of the
South & Central America database was useable.
For calculations of restricted work day case severity:• Submissions without information on days assigned to restricted activities
were filtered out, leaving a database of 2 151 million hours (49% of the total database), and 854 restricted work day cases, 58% of the total reported in 2014 (1 473 RWDC).
• In 2013 this database was 2 088 million hours, 55% of the total database.
More detailed information is shown in Tables A.2–A.5.

108Safety performance indicators – 2014 data
Percentage of reported work hours included in analysis
Region TRIR Lost work day case severity
Restricted work day case severity
Africa 98% 84% 62%
Asia/Australasia 98% 78% 59%
Europe 96% 53% 43%
FSU 99% 73% 47%
Middle East 98% 74% 49%
North America 62% 61% 22%
South & Central America 99% 96% 78%
Table A.2: Percentage of reported work hours included in analyses by region
Percentage of reported work hours included in analysis
Function TRIR Lost work day case severity
Restricted work day case severity
Exploration 87% 79% 46%
Drilling 85% 77% 47%
Production 85% 75% 48%
Construction 93% 70% 51%
Unspecified 95% 70% 50%
Table A.3: Percentage of reported work hours included in analyses by function
Percentage of reported work hours included in analysis
TRIR Lost work day case severity
Restricted work day case severity
Overall 90% 74% 49%
Table A.4: Percentage of reported work hours included in analyses overall
Percentage of reported work hours included in RWDC severity analysis
Company Contractor Overall Onshore Offshore
60% 58% 58% 55% 64%
Table A.5: Percentage of reported RWDC included in RWDC severity calculations

109Appendix B
Appendix B - Data tables
Region Data type Operations Hours worked (thousands)
Fatalities (number)
LWDCs (number)
RWDCs (number)
MTCs (number) FAR LTIF TRIR
Afri
ca
Company Onshore 87 856 0 9 5 11 0.00 0.10 0.29
Offshore 17 839 0 8 16 9 0.00 0.45 1.86
Contractor Onshore 349 144 3 93 58 113 0.86 0.27 0.77
Offshore 125 625 2 56 93 110 1.59 0.46 2.09
Subtotal 580 464 5 166 172 243 0.86 0.29 1.02
Asia
/Aus
tral
asia Company Onshore 132 135 0 14 8 35 0.00 0.11 0.45
Offshore 41 953 0 7 11 13 0.00 0.17 0.76
Contractor Onshore 668 811 6 99 207 435 0.90 0.16 1.12
Offshore 234 936 5 55 92 91 2.13 0.26 1.05
Subtotal 1 077 835 11 175 318 574 1.02 0.17 1.01
Euro
pe
Company Onshore 105 478 2 42 19 42 1.90 0.42 1.03
Offshore 33 477 0 26 11 41 0.00 0.78 2.36
Contractor Onshore 112 994 1 72 51 91 0.89 0.65 2.01
Offshore 133 386 1 167 122 274 0.75 1.26 4.24
Subtotal 385 335 4 307 203 448 1.04 0.81 2.59
FSU
Company Onshore 47 806 0 4 0 16 0.00 0.08 0.43
Offshore 9 852 0 2 1 0 0.00 0.20 0.30
Contractor Onshore 154 631 2 36 24 36 1.29 0.25 0.64
Offshore 36 039 0 0 14 9 0.00 0.00 0.64
Subtotal 248 328 2 42 39 61 0.81 0.18 0.59
MId
dle
East
Company Onshore 84 262 0 12 5 31 0.00 0.14 0.60
Offshore 10 278 0 4 4 8 0.00 0.39 1.56
Contractor Onshore 451 696 2 79 91 219 0.44 0.18 0.87
Offshore 61 718 0 9 15 35 0.00 0.15 0.96
Subtotal 607 954 2 104 115 293 0.33 0.17 0.86
Nort
h Am
eric
a Company Onshore 220 723 0 56 37 101 0.00 0.25 1.15
Offshore 76 633 3 25 5 12 3.91 0.37 1.38
Contractor Onshore 505 655 11 216 321 684 2.18 0.45 2.99
Offshore 222 243 2 91 44 70 0.90 0.42 1.87
Subtotal 1 025 254 16 388 407 867 1.56 0.39 2.40
Sout
h &
Cen
tral
Am
eric
a
Company Onshore 41 569 0 15 10 33 0.00 0.36 1.43
Offshore 35 711 0 17 0 28 0.00 0.48 1.27
Contractor Onshore 176 277 3 145 129 188 1.70 0.84 2.65
Offshore 187 232 2 159 80 426 1.07 0.86 3.57
Subtotal 440 789 5 336 219 675 1.13 0.77 2.82
Over
all
Company Onshore 719 829 2 152 84 269 0.28 0.21 0.77
Offshore 225 743 3 89 48 111 1.33 0.41 1.40
Contractor Onshore 2 419 208 28 740 881 1766 1.16 0.32 1.47
Offshore 1 001 179 12 537 460 1015 1.20 0.55 2.31
Grand Total 4 365 959 45 1 518 1 473 3 161 1.03 0.36 1.54
Table B.1: Summary of 2014 data

110Safety performance indicators – 2014 data
Hours worked (thousands)
Fatalities LWDCs RWDCs MTCs FAR LTIF TRIR
Company 945 572 5 241 132 380 0.53 0.26 0.90Contractor 3 420 387 40 1 277 1 341 2 781 1.17 0.39 1.70Onshore 3 139 037 30 892 965 2 035 0.96 0.29 1.33Offshore 1 226 922 15 626 508 1 126 1.22 0.52 2.16
Table B.2: Summary of 2014 data, company, contractor, onshore, offshore
The following data are presented in relation to the sections where they were used.
Section 1 SummaryIntentionally excluded.
Section 2 Overall results
Year Company Contractor Overall Onshore Offshore2005 1.25 4.36 3.53 3.94 1.992006 2.04 4.54 3.92 4.64 1.582007 1.65 3.39 2.99 3.01 2.922008 2.81 3.20 3.12 3.38 2.252009 1.58 3.11 2.76 2.75 2.782010 3.17 2.64 2.76 2.62 3.162011 1.33 2.03 1.88 1.94 1.672012 1.58 2.59 2.38 2.87 0.892013 1.83 2.20 2.12 1.70 3.272014 0.53 1.17 1.03 0.96 1.22
Hours 2014 (thousands) 945 572 3 420 387 4 365 959 3 139 037 1 226 922
Table B.3: Fatal accident rate (2005–2014)
Year Company Contractor Overall Onshore Offshore2005 1.72 3.96 3.36 3.62 2.382006 1.91 4.04 3.51 4.10 1.582007 1.35 2.85 2.51 2.74 1.692008 2.53 2.47 2.48 2.71 1.722009 1.22 2.06 1.87 1.86 1.902010 1.10 1.86 1.70 1.70 1.692011 0.80 1.63 1.45 1.57 1.032012 0.79 1.57 1.41 1.58 0.892013 0.85 1.22 1.14 0.94 1.682014 0.32 1.14 0.96 0.92 1.06
Hours 2014 (thousands) 945 572 3 420 387 4 365 959 3 139 037 1 226 922
Table B.4: Fatal incidents per 100 million work hours (2005–2014)

111Appendix B
Year Company Contractor Overall Onshore Offshore2005 1.76 3.50 3.05 2.82 3.872006 1.85 3.24 2.92 2.68 3.662007 2.41 2.76 2.68 2.51 3.262008 1.49 2.23 2.08 1.75 3.092009 1.28 1.89 1.75 1.45 2.792010 1.19 1.81 1.68 1.41 2.452011 1.32 1.88 1.76 1.45 2.842012 1.12 1.90 1.74 1.49 2.532013 0.95 1.77 1.60 1.33 2.342014 0.90 1.70 1.54 1.33 2.16
Hours 2014 (thousands) 779 552 3 132 246 3 908 798 2 902 277 1 006 521
Table B.5: Total recordable injury rate (2005–2014)
Year Company Contractor Overall Onshore Offshore2005 0.83 1.02 0.97 0.92 1.122006 0.89 1.03 0.99 0.95 1.132007 0.54 0.70 0.66 0.62 0.822008 0.52 0.56 0.55 0.47 0.812009 0.44 0.46 0.45 0.38 0.702010 0.41 0.42 0.42 0.35 0.622011 0.42 0.43 0.43 0.34 0.742012 0.47 0.49 0.48 0.38 0.812013 0.40 0.47 0.45 0.34 0.772014 0.26 0.39 0.36 0.29 0.52
Hours 2014 (thousands) 945 572 3 420 387 4 365 959 3 139 037 1 226 922
Table B.6: Lost time injury frequency (2005–2014)
Category Company Contractor Overall Onshore Offshore % of totalAssault or violent act 0 0 0 0 0 0.0Caught in, under or between 0 7 7 4 3 15.6Confined space 0 1 1 1 0 2.2Cut, puncture, scrape 0 0 0 0 0 0.0Explosions or burns 3 6 9 6 3 20.0Exposure electrical 2 1 3 2 1 6.7Exposure noise, chemical, biological, vibration 0 0 0 0 0 0.0
Falls from height 0 5 5 1 4 11.1Overexertion, strain 0 0 0 0 0 0.0Pressure release 0 1 1 1 0 2.2Slips and trips (at same height) 0 0 0 0 0 0.0Struck by 0 15 15 13 2 33.3Water related, drowning 0 3 3 1 2 6.7Other 0 1 1 1 0 2.2Overall 5 40 45 30 15
Table B.7: Fatalities by category (2014)

112Safety performance indicators – 2014 data
Activity Company Contractor Overall Onshore Offshore % of totalConstruction, commissioning, decommissioning 0 6 6 5 1 13.3
Diving, subsea, ROV 0 0 0 0 0 0.0Drilling, workover, well services 3 13 16 9 7 35.6Lifting, crane, rigging, deck operations 0 6 6 3 3 13.3
Maintenance, inspection, testing 2 2 4 3 1 8.9Office, warehouse, accommodation, catering 0 0 0 0 0 0.0
Production operations 0 3 3 2 1 6.7Seismic/survey operations 0 1 1 1 0 2.2Transport – Air 0 0 0 0 0 0.0Transport – Land 0 6 6 6 0 13.3Transport – Water, incl. marine activity 0 2 2 0 2 4.4
Unspecified – other 0 1 1 1 0 2.2Overall 5 40 45 30 15
Table B.8: Fatalities by activity (2014)
Category Company Contractor Overall Onshore Offshore % of totalAssault or violent act 2 8 10 8 2 0.7Caught in, under or between 34 308 342 181 161 22.5Confined space 0 1 1 1 0 0.1Cut, puncture, scrape 9 65 74 41 33 4.9Explosions or burns 7 48 55 37 18 3.6Exposure electrical 3 14 17 6 11 1.1Exposure noise, chemical, biological, vibration 2 12 14 10 4 0.9
Falls from height 30 144 174 109 65 11.5Overexertion, strain 14 78 92 53 39 6.1Pressure release 1 6 7 3 4 0.5Slips and trips (at same height) 72 204 276 171 105 18.2Struck by 56 297 353 195 158 23.3Water related, drowning 1 0 1 1 0 0.1Other 10 92 102 76 26 6.7Overall 241 1 277 1 518 892 626
Table B.9: Lost work day cases by category (2014)

113Appendix B
Activity Company Contractor Overall Onshore Offshore % of totalConstruction, commissioning, decommissioning 7 131 138 98 40 9.1
Diving, subsea, ROV 1 8 9 4 5 0.6Drilling, workover, well services 40 340 380 234 146 25.0Lifting, crane, rigging, deck operations 5 105 110 45 65 7.2Maintenance, inspection, testing 37 203 240 105 135 15.8Office, warehouse, accommodation, catering 31 83 114 76 38 7.5
Production operations 74 184 258 180 78 17.0Seismic/survey operations 0 19 19 16 3 1.3Transport – Air 1 3 4 2 2 0.3Transport – Land 9 37 46 41 5 3.0Transport – Water, incl. marine activity 4 73 77 10 67 5.1Unspecified – other 32 91 123 81 42 8.1Overall 241 1 277 1 518 892 626
Table B.10: Lost work day cases by activity (2014)
YearAverage number of days lost per LWDC
Company Contractor Overall Onshore Offshore2005 25.6 23.7 24.2 24.5 23.12006 20.6 26.2 24.9 24.7 25.52007 32.7 35.6 35.0 33.0 42.02008 35.2 34.6 34.7 32.1 41.02009 35.3 38.3 37.5 34.8 44.42010 35.4 46.0 43.9 39.4 52.62011 41.1 42.6 42.3 39.8 46.42012 38.8 41.3 40.7 36.8 46.02013 43.5 42.9 43.0 35.8 51.22014 51.6 40.3 42.2 39.9 45.5
Table B.11: Lost work day case severity (2014)
YearAverage number of days lost per LWDC
Company Contractor Overall Onshore Offshore2005 12.5 13.8 13.7 14.7 9.62006 11.8 11.1 11.2 10.3 13.02007 15.3 10.5 10.9 8.9 16.02008 16.1 13.4 13.7 13.3 14.42009 15.3 13.8 13.9 12.4 15.82010 14.7 13.8 13.9 13.6 14.42011 12.9 10.2 10.4 11.7 8.62012 13.8 12.1 12.2 11.5 13.42013 17.2 14.2 14.5 15.4 13.02014 14.6 11.6 11.8 12.2 11.2
Table B.12: Restricted work day case severity (2014)

114Safety performance indicators – 2014 data
Rule Fatal incidents Core Rule Confined space 1 yesIsolation 2 yesJourney management 4 yesPermit to work 3 yesSeat belt 0 yesSpeeding/phone 1 yesSuspended load 0 yesWork at height 5 yesDropped objects 7Drugs and alcohol 0Excavation 0Gas test 1Lift plan 1Line of fire – safe area 6Overhead power lines 1PPE (Including flotation device) 1Smoking 0System override 0No appropriate Rule 2Insufficient information to assign a Rule 7Overall 42
Table B.13: Life-Saving Rules attributable to fatal incidents (2014)
Section 3 Results by region
RegionFatalities FAR Fatal Incidents
2014 2013 2014 2013 2014 2013Africa 5 27 0.86 4.53 5 9Asia/Australasia 11 8 1.02 0.87 10 7Europe 4 9 1.04 2.26 4 5FSU 2 3 0.81 1.25 2 3Middle East 2 4 0.33 0.63 2 4North America 16 12 1.56 2.03 14 10South & Central America 5 17 1.13 4.37 5 5Overall 45 80 1.03 2.12 42 43
Table B.14: Fatalities, fatal incidents and fatal accident rate by region (2013 & 2014)

115Appendix B
Region 2014 2013 2012 2011 2010Africa 0.86 4.53 2.83 1.25 3.38Asia/Australasia 1.02 0.87 1.35 3.28 4.14Europe 1.04 2.26 0.52 0.87 0.97FSU 0.81 1.25 0.55 1.59 2.17Middle East 0.33 0.63 1.95 1.74 1.63North America 1.56 2.03 7.50 1.50 5.08South & Central America 1.13 4.37 0.54 2.42 1.57Overall 1.03 2.12 2.38 1.88 2.76
Table B.15: Fatal accident rate by region (2010–2014)
Year Africa Asia/ Australasia
Europe FSU Middle East
North America
South & Central America
Overall
2009 1.65 1.22 3.48 1.21 0.92 3.08 3.17 1.752010 1.40 1.30 3.05 1.08 0.98 2.89 2.76 1.682011 1.22 1.46 2.81 0.99 0.78 3.19 3.17 1.772012 1.14 1.37 2.64 0.99 1.02 2.82 3.05 1.742013 1.05 0.97 2.58 0.81 0.90 2.58 3.13 1.602014 1.02 1.01 2.58 0.59 0.86 2.40 2.82 1.54
Table B.16: Total recordable injury rate by region (2009–2014)
Year Africa Asia/ Australasia
Europe FSU Middle East
North America
South & Central America
Overall
2009 0.42 0.29 1.31 0.35 0.26 0.51 0.69 0.452010 0.36 0.29 1.06 0.31 0.25 0.48 0.61 0.422011 0.30 0.30 1.08 0.31 0.18 0.59 0.64 0.432012 0.33 0.26 0.91 0.28 0.24 0.94 0.69 0.482013 0.31 0.15 1.02 0.33 0.21 0.74 0.85 0.452014 0.29 0.17 0.81 0.18 0.17 0.39 0.77 0.36
Table B.17: Lost time injury frequency by region (2009–2014)
YearThousand work hours
Africa Asia/ Australasia
Europe FSU Middle East
North America
South & Central America
Overall
2005 472 879 348 806 191 127 443 782 383 968 224 603 315 505 2 380 670 2006 473 646 473 100 282 856 451 036 447 657 302 632 506 047 2 936 974 2007 496 830 540 809 296 407 418 534 553 424 285 769 321 028 2 912 801 2008 499 818 562 677 310 258 444 115 835 031 304 046 348 223 3 304 168 2009 542 110 697 524 319 176 350 794 1 018 682 320 541 337 015 3 585 842 2010 562 121 725 171 308 870 461 827 676 337 295 339 381 479 3 411 144 2011 558 573 609 466 344 762 439 420 690 171 400 902 412 784 3 456 078 2012 600 478 741 523 384 668 363 944 666 915 560 027 373 485 3 691 040 2013 595 637 919 063 398 820 240 596 637 244 590 089 389 097 3 770 546 2014 580 464 1 077 835 385 335 248 328 607 954 1 025 254 440 789 4 365 959
Table B.18: Work hours reported by region (2005–2014)

116Safety performance indicators – 2014 data
Year Africa Asia/ Australasia
Europe FSU Middle East
North America
South & Central America
Overall
2005 7.0 2.1 3.5 6.6 4.9 4.5 3.8 4.72006 6.6 1.8 3.5 6.3 4.3 4.0 3.9 4.42007 6.0 1.5 3.0 5.5 4.2 3.6 3.8 4.12008 5.1 1.4 3.5 5.2 3.6 2.8 3.9 3.72009 4.1 1.4 4.6 4.4 2.8 2.4 3.7 3.22010 3.8 2.1 4.0 3.7 2.5 3.1 3.3 3.12011 2.9 2.3 3.4 2.9 2.3 2.7 2.9 2.72012 2.8 2.3 2.5 2.3 2.0 4.4 2.4 2.62013 2.9 2.1 2.2 1.8 1.7 4.1 2.3 2.42014 2.6 1.9 1.2 1.4 1.3 3.2 2.0 2.0
Table B.19: Fatal accident rate five-year rolling averages by region (2005–2014)
Year Africa Asia/ Australasia
Europe FSU Middle East
North America
South & Central America
Overall
2005 3.0 2.1 6.4 1.9 3.6 6.5 5.2 3.82006 3.0 1.9 6.0 1.9 3.3 5.7 4.5 3.42007 2.9 1.7 5.3 2.2 3.0 5.2 4.1 3.22008 2.8 1.6 4.7 2.1 1.9 4.9 3.8 2.82009 2.2 1.4 4.3 1.9 1.5 4.4 3.5 2.42010 2.0 1.4 3.9 1.8 1.3 4.0 3.2 2.22011 1.7 1.3 3.4 1.6 1.1 3.6 3.1 2.02012 1.5 1.3 3.1 1.1 0.9 3.2 3.1 1.82013 1.3 1.2 2.9 1.0 0.9 2.9 3.1 1.72014 1.2 1.2 2.7 0.9 0.9 2.7 3.0 1.7
Table B.20: Total recordable injury rate five-year rolling averages by region (2005–2014)
Year Africa Asia/ Australasia
Europe FSU Middle East
North America
South & Central America
Overall
2005 0.8 0.5 2.0 0.8 1.2 1.2 2.3 1.22006 0.7 0.4 1.8 0.8 1.0 1.0 2.2 1.12007 0.7 0.4 1.7 0.8 0.9 0.9 2.0 1.02008 0.7 0.3 1.5 0.7 0.6 0.8 1.7 0.82009 0.6 0.3 1.5 0.6 0.4 0.7 1.4 0.72010 0.5 0.3 1.4 0.5 0.4 0.6 1.2 0.62011 0.5 0.3 1.2 0.4 0.3 0.6 0.8 0.52012 0.4 0.3 1.1 0.3 0.3 0.7 0.7 0.52013 0.3 0.3 1.1 0.3 0.2 0.7 0.7 0.52014 0.3 0.2 1.0 0.3 0.2 0.6 0.7 0.4
Table B.21: Lost time injury frequency five-year rolling averages by region (2005–2014)

117Appendix B
YearAverage number of days lost per LWDC
Africa Asia/ Australasia
Europe FSU Middle East
North America
South & Central America
Overall
2009 23.1 31.8 42.3 32.6 20.4 38.9 68.9 37.52010 27.2 27.6 32.8 42.2 14.7 46.6 98.5 43.92011 27.6 26.7 44.5 46.4 12.3 31.3 71.6 42.32012 35.9 24.2 38.1 41.4 26.2 36.7 69.5 40.72013 29.2 30.4 42.3 51.0 13.6 49.6 60.3 43.02014 33.2 31.0 33.8 64.8 34.6 49.2 49.1 42.2
Table B.22: Severity of lost work day cases by region (2009–2014)
Country 2014 2013 2012 Liberia 8.58 0.00 5.24Morocco 4.53 9.62 4.67
Ivory coast 4.18 2.74 8.33Senegal 4.08 0.00 0.00D.R. of the Congo (formerly Zaire) 3.05 2.33 2.54Kenya 2.53 4.29 2.59Algeria 2.32 1.81 1.27Gabon 1.90 2.35 2.29Tunisia 1.77 3.38 3.38Mauritania 1.63 3.10 1.25Angola 1.40 1.10 1.48Tanzania 1.35 2.03 3.47Mozambique 1.22 1.52 2.75Equatorial Guinea 1.19 1.34 1.50Africa average 1.02Uganda 1.01 1.71 2.43Congo 0.95 0.82 1.38Ghana 0.91 1.95 1.91Libya 0.84 0.97 0.91Egypt 0.71 0.77 0.71Nigeria 0.35 0.31 0.51South Africa 0.00 4.43 2.51Namibia 0.00 0.00 n/aMadagascar 0.00 0.00 4.10
Data only included in TRIR calculations where medical treatment cases are reported.
Table B.23: Total recordable injury rate by country – Africa (2012–2014)

118Safety performance indicators – 2014 data
Country 2014 2013 2012 New Zealand 5.05 11.06 10.87Japan 4.83 0.44 1.47
Australia 2.08 2.64 4.45Brunei 1.55 0.00 1.37Papua New Guinea 1.46 0.91 1.61Asia-Australasia average 1.01India 1.00 0.63 1.51Myanmar 1.00 1.01 1.81Thailand 0.96 0.89 1.11South Korea 0.91 0.59 0.85Malaysia 0.57 0.72 0.88Indonesia 0.46 0.49 0.59Philippines 0.46 0.19 0.93China 0.38 0.66 0.51Singapore 0.33 2.43 0.00Vietnam 0.32 0.35 2.08Pakistan 0.25 0.35 1.05
Data only included in TRIR calculations where medical treatment cases are reported.
Table B.24: Total recordable injury rate by country – Asia/Australasia (2012–2014)
Country 2014 2013 2012 Denmark 7.39 6.07 5.04Malta 5.29 n/a n/a
Germany 4.86 4.17 4.51Ireland 3.74 3.95 2.11Netherlands 3.39 2.71 2.48Norway 3.25 3.05 2.99Croatia 3.06 3.55 1.59Europe average 2.58UK 2.30 2.54 2.83Hungary 2.03 1.28 3.12Cyprus 1.88 0.00 n/aFrance 1.08 0.99 0.49Spain 1.06 0.98 1.29Romania 0.90 0.83 1.08Italy 0.80 1.01 1.62Poland 0.00 3.47 6.11
Data only included in TRIR calculations where medical treatment cases are reported.
Table B.25: Total recordable injury rate by country – Europe (2012–2014)

119Appendix B
Country 2014 2013 2012 Russia 0.80 0.72 1.14FSU average 0.59
Kazakhstan 0.54 0.80 0.84Azerbaijan 0.40 1.24 0.81Turkmenistan 0.19 0.11 0.64Ukraine 0.00 2.62 3.55
Data only included in TRIR calculations where medical treatment cases are reported.
Table B.26: Total recordable injury rate by country – FSU (2012–2014)
Country 2014 2013 2012 Turkey 4.53 0.86 3.48Iraq 1.53 2.11 2.52
Oman 1.24 0.73 2.17Qatar 0.94 1.04 1.17Middle East average 0.86Yemen 0.84 1.05 1.28Kuwait 0.72 0.32 0.83UAE 0.53 1.00 0.74Iran 0.00 0.00 0.00
Data only included in TRIR calculations where medical treatment cases are reported..
Table B.27: Total recordable injury rate by country – Middle East (2012–2014)
Country 2014 2013 2012 Canada 2.49 2.63 2.91North America average 2.40
USA 2.37 2.57 2.80Mexico 0.00 0.00 0.00
Data only included in TRIR calculations where medical treatment cases are reported.
Table B.28: Total recordable injury rate by country – North America (2012–2014)

120Safety performance indicators – 2014 data
Country 2014 2013 2012 Venezuela 6.04 1.27 0.84Uruguay 5.68 17.90 0.00
Brazil 3.13 3.35 3.21South & Central America average 2.82Colombia 2.69 1.24 2.23Ecuador 2.49 1.61 2.13Argentina 2.05 1.74 1.91Bolivia 1.73 2.27 3.24Peru 1.55 4.70 4.32Trinidad & Tobago 1.33 2.08 2.25
Data only included in TRIR calculations where medical treatment cases are reported.
Table B.29: Total recordable injury rate by country – South & Central America (2012–2014)
CountryLTIF Fatality
2014 2013 2012 2014Ivory Coast 2.79 0.00 3.33 NoAlgeria 1.53 1.00 0.24 Yes
Tunisia 1.07 1.47 1.61 YesSenegal 1.02 0.00 0.00 NoKenya 0.99 0.83 0.43 NoMauritania 0.82 0.77 0.63 NoMorocco 0.57 4.81 4.67 NoD.R. of the Congo (Formerly Zaire) 0.54 0.97 0.63 NoTanzania 0.45 1.27 0.87 NoGabon 0.39 0.57 0.70 NoMozambique 0.30 0.35 0.78 NoAfrica Average 0.29Egypt 0.25 0.26 0.27 NoCongo 0.24 0.15 0.34 YesAngola 0.23 0.16 0.23 NoEquatorial Guinea 0.22 0.45 0.32 NoLibya 0.19 0.31 0.54 NoGhana 0.15 0.60 1.43 NoNigeria 0.10 0.10 0.15 YesSouth Africa 0.00 0.00 0.00 NoNamibia 0.00 0.00 0.00 NoMadagascar 0.00 0.00 0.00 NoUganda 0.00 0.50 0.37 NoLiberia 0.00 0.00 0.00 No
Table B.30: Lost time injury frequency (2012–2014) by country – Africa

121Appendix B
CountryLTIF Fatality
2014 2013 2012 2014New Zealand 1.25 2.07 3.11 NoJapan 0.60 0.44 0.00 No
Vietnam 0.32 0.17 0.52 NoIndia 0.30 0.15 0.43 NoMyanmar 0.28 0.27 0.46 YesAustralia 0.22 0.27 0.64 YesPakistan 0.22 0.03 0.05 YesMalaysia 0.20 0.17 0.27 YesPapua New Guinea 0.19 0.04 0.13 NoChina 0.17 0.23 0.26 YesSouth Korea 0.17 0.17 0.34 NoAsia-Australasia average 0.17Thailand 0.12 0.04 0.11 NoIndonesia 0.08 0.09 0.16 YesSingapore 0.04 0.35 0.00 NoBrunei 0.00 0.00 0.00 NoPhilippines 0.00 0.00 0.37 No
Table B.31: Lost time injury frequency (2012–2014) – Asia/Australasia
CountryLTIF Fatality
2014 2013 2012 2014Cyprus 1.88 0.00 N/A NoCroatia 1.68 1.75 1.38 No
Germany 1.43 1.68 0.92 YesDenmark 1.24 0.39 1.04 NoNorway 1.04 1.13 0.98 NoIreland 0.83 1.08 0.00 NoEurope average 0.81Italy 0.75 1.01 1.55 NoUK 0.70 1.11 0.82 YesNetherlands 0.68 0.75 0.65 NoRomania 0.40 0.47 0.60 YesFrance 0.33 0.56 0.27 NoSpain 0.27 0.49 0.64 NoHungary 0.25 0.64 1.76 NoPoland 0.00 0.00 3.66 NoMalta 0.00 N/A N/A No
Table B.32:Lost time injury frequency (2012–2014) – Europe

122Safety performance indicators – 2014 data
CountryLTIF Fatality
2014 2013 2012 2014Russia 0.27 0.50 0.27 YesKazakhstan 0.18 0.29 0.33 No
FSU average 0.18Turkmenistan 0.09 0.00 0.32 NoUkraine 0.00 0.00 3.55 NoAzerbaijan 0.00 0.21 0.11 No
Table B.33: Lost time injury frequency (2012–2014) – FSU
CountryLTIF Fatality
2014 2013 2012 2014Turkey 2.28 0.00 2.61 YesYemen 0.35 0.36 0.43 No
Oman 0.31 0.00 0.00 NoIraq 0.20 0.27 1.15 NoKuwait 0.18 0.14 0.12 NoQatar 0.17 0.25 0.26 YesMiddle East average 0.17Uae 0.06 0.19 0.16 NoIran 0.00 0.00 0.00 No
Table B.34: Lost time injury frequency (2012–2014) – Middle East
CountryLTIF Fatality
2014 2013 2012 2014Usa 0.44 0.58 0.56 YesNorth America average 0.39
Mexico 0.37 3.14 6.98 YesCanada 0.32 0.25 0.35 Yes
Table B.35: Lost time injury frequency (2012–2014) – North America
CountryLTIF Fatality
2014 2013 2012 2014Venezuela 2.12 0.84 0.21 NoBrazil 0.84 0.90 0.78 Yes
Colombia 0.78 0.15 0.35 YesPeru 0.77 2.03 0.62 NoSouth & Central America average 0.77Argentina 0.48 0.29 0.15 YesTrinidad & Tobago 0.37 0.43 0.63 NoEcuador 0.36 0.36 0.16 NoBolivia 0.26 0.22 0.76 NoUruguay 0.00 15.35 0.00 No
Table B.36: Lost time injury frequency (2012–2014) – South & Central America

123Appendix B
Section 4 Results by function
Function2014 2013
Fatal incidents Fatalities Fatal incidents FatalitiesExploration 1 1 3 3Drilling 17 19 15 15
Production 14 15 17 33Construction 8 8 6 18Unspecified 2 2 2 11Overall 42 45 43 80
Table B.37: Number of fatalities and fatal incidents in 2013 & 2014 by function
FunctionHours (thousands)
2014 2013 2012 2011 2010Exploration 117 859 95 197 84 947 74 306 83 397Drilling 706 179 579 757 672 728 642 462 518 505
Production 1 628 568 1 313 488 1 220 365 1 208 473 965 145Construction 1 001 301 930 481 911 045 839 178 869 540Unspecified 911 052 851 623 801 955 691 659 974 557Overall 4 365 959 3 770 546 3 691 040 3 456 078 3 411 144
Table B.38: Exposure hours by function (2010–2014)
Year Exploration Drilling Production Construction Unspecified Overall2009 6.15 4.24 3.76 2.76 3.232010 4.54 5.06 3.54 1.87 2.80 3.08
2011 1.91 3.82 3.35 1.80 2.35 2.692012 2.42 3.43 2.90 1.69 2.62 2.572013 2.50 3.19 2.58 1.71 2.30 2.382014 1.97 2.92 1.82 1.56 2.03 1.99
The method of calculating rolling averages changed with the publication of 2010 data. Historic figures presented above have been recalculated accordingly.
Table B.39: Fatal accident rate – five-year rolling averages by function (2009–2014)
Year Exploration Drilling Production Construction Unspecified Overall2009 3.26 4.59 4.85 1.49 1.65 2.762010 1.20 6.36 2.07 1.15 3.08 2.76
2011 0.00 1.87 2.65 1.91 0.72 1.882012 4.71 1.78 1.23 2.09 4.74 2.382013 3.15 2.59 2.51 1.93 1.29 2.122014 0.85 2.69 0.92 0.80 0.22 1.03
The method of calculating FAR on a functional basis has changed with the publication of 2010 data to use the incident function instead of the function of the victim. Historic figures presented above have been recalculated accordingly.
Table B.40: Fatal accident rate by function (2009–2014)
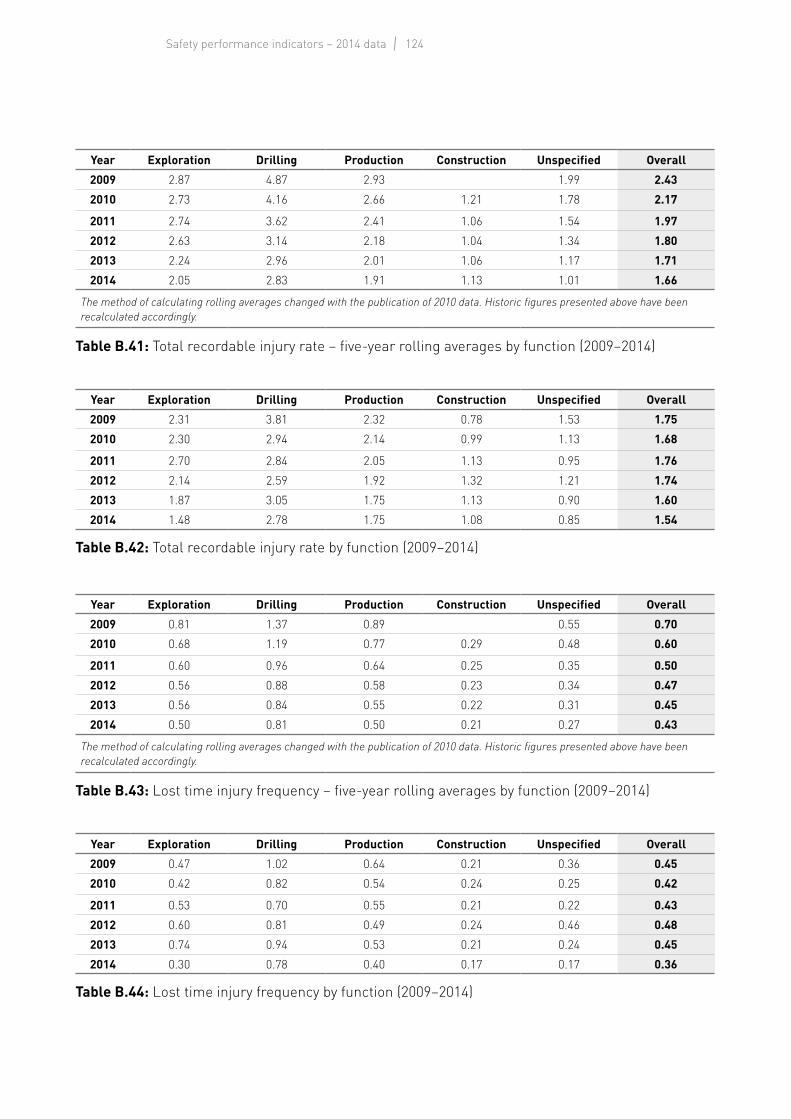
124Safety performance indicators – 2014 data
Year Exploration Drilling Production Construction Unspecified Overall2009 2.87 4.87 2.93 1.99 2.432010 2.73 4.16 2.66 1.21 1.78 2.17
2011 2.74 3.62 2.41 1.06 1.54 1.972012 2.63 3.14 2.18 1.04 1.34 1.802013 2.24 2.96 2.01 1.06 1.17 1.712014 2.05 2.83 1.91 1.13 1.01 1.66
The method of calculating rolling averages changed with the publication of 2010 data. Historic figures presented above have been recalculated accordingly.
Table B.41: Total recordable injury rate – five-year rolling averages by function (2009–2014)
Year Exploration Drilling Production Construction Unspecified Overall2009 2.31 3.81 2.32 0.78 1.53 1.752010 2.30 2.94 2.14 0.99 1.13 1.68
2011 2.70 2.84 2.05 1.13 0.95 1.762012 2.14 2.59 1.92 1.32 1.21 1.742013 1.87 3.05 1.75 1.13 0.90 1.602014 1.48 2.78 1.75 1.08 0.85 1.54
Table B.42: Total recordable injury rate by function (2009–2014)
Year Exploration Drilling Production Construction Unspecified Overall2009 0.81 1.37 0.89 0.55 0.702010 0.68 1.19 0.77 0.29 0.48 0.60
2011 0.60 0.96 0.64 0.25 0.35 0.502012 0.56 0.88 0.58 0.23 0.34 0.472013 0.56 0.84 0.55 0.22 0.31 0.452014 0.50 0.81 0.50 0.21 0.27 0.43
The method of calculating rolling averages changed with the publication of 2010 data. Historic figures presented above have been recalculated accordingly.
Table B.43: Lost time injury frequency – five-year rolling averages by function (2009–2014)
Year Exploration Drilling Production Construction Unspecified Overall2009 0.47 1.02 0.64 0.21 0.36 0.452010 0.42 0.82 0.54 0.24 0.25 0.42
2011 0.53 0.70 0.55 0.21 0.22 0.432012 0.60 0.81 0.49 0.24 0.46 0.482013 0.74 0.94 0.53 0.21 0.24 0.452014 0.30 0.78 0.40 0.17 0.17 0.36
Table B.44: Lost time injury frequency by function (2009–2014)

125Appendix B
YearAverage days lost per LWDC
Exploration Drilling Production Construction Unspecified Overall2009 45.5 44.3 38.4 34.7 29.9 37.52010 28.7 55.8 49.8 27.3 22.6 43.9
2011 42.4 51.8 40.4 36.4 22.8 42.32012 37.6 50.3 39.6 36.8 26.2 40.72013 27.0 51.4 47.5 23.7 27.7 43.02014 32.1 49.6 41.5 31.9 31.2 42.2
Table B.45: Severity of lost work day cases by function (2009–2014)
RegionTRIR Work hours (thousands)
Company Contractor Company Contractor2014 2009–2013 2014 2009–2013 2014
Africa 0.00 0.57 1.29 2.11 2 931 17 030Asia/Australasia 0.19 0.51 0.89 2.30 5 298 24 731Europe 0.00 0.83 1.53 2.45 3 781 3 272FSU 4.05 1.69 0.44 1.43 247 4 554Middle East 0.57 0.66 2.41 2.04 1 742 10 355North America 0.82 0.67 2.50 4.31 6 114 11 189South & Central America 0.00 0.76 3.58 5.46 630 11 166Overall 0.39 0.67 1.75 2.80 20 743 82 297
Table B.46: Exploration TRIR by region for companies and contractors (2014 & 2009–2013) and the number of related work hours for companies and contractors for 2014 only
RegionLTIF Work hours (thousands)
Company Contractor Company Contractor2014 2009–2013 2014 2009–2013 2014
Africa 0.00 0.16 0.47 0.48 2 996 17 190Asia/Australasia 0.00 0.29 0.16 0.27 5 688 25 252Europe 0.00 0.48 0.31 1.22 4 465 3 272FSU 0.00 0.79 0.41 0.69 247 4 925Middle East 0.00 0.64 0.47 0.53 1 821 10 695North America 0.00 0.08 0.10 2.03 8 262 20 716South & Central America 0.00 0.21 1.12 0.97 722 11 608Overall 0.00 0.30 0.37 0.65 24 201 93 658
Table B.47: Exploration LTIF by region for companies and contractors (2014 & 2009–2013) and the number of related work hours for companies and contractors for 2014 only

126Safety performance indicators – 2014 data
RegionTRIR Work hours (thousands)
Company Contractor Company Contractor2014 2009–2013 2014 2009–2013 2014
Africa 0.66 1.03 2.07 3.06 6 019 79 235Asia/Australasia 0.48 0.76 1.73 2.26 10 406 123 386Europe 1.91 2.14 4.50 5.34 10 447 44 186FSU 0.51 1.73 1.17 1.31 1 965 30 882Middle East 0.45 1.19 3.30 2.63 4 400 39 966North America 0.48 0.32 3.68 4.57 10 507 134 729South & Central America 1.22 1.55 4.03 4.40 10 667 96 144Overall 0.92 1.44 2.97 3.19 54 411 548 528
Table B.48: Drilling TRIR by region for companies and contractors (2014 & 2009–2013) and the number of related work hours for companies and contractors for 2014 only
RegionLTIF Work hours (thousands)
Company Contractor Company Contractor2014 2009–2013 2014 2009–2013 2014
Africa 0.00 0.34 0.61 0.93 6 416 81 344Asia/Australasia 0.00 0.21 0.52 0.59 10 947 126 313Europe 0.73 1.24 1.56 2.12 10 966 44 310FSU 0.00 0.49 0.48 0.34 2 025 31 057Middle East 0.22 0.59 0.71 0.55 4 530 40 608North America 0.73 1.59 0.78 0.95 56 011 184 417South & Central America 0.55 0.51 1.27 1.11 10 936 96 299Overall 0.55 0.79 0.82 0.85 101 831 604 348
Table B.49: Drilling LTIF by region for companies and contractors (2014 & 2009–2013) and the number of related work hours for companies and contractors for 2014 only
RegionTRIR Work hours (thousands)
Company Contractor Company Contractor2014 2009–2013 2014 2009–2013 2014
Africa 0.92 1.14 1.07 1.17 42 525 173 719Asia/Australasia 0.79 1.16 0.69 1.15 69 995 198 939Europe 2.00 1.92 4.04 4.46 63 047 96 326FSU 0.33 0.70 0.66 0.70 33 137 60 560Middle East 0.72 1.59 0.56 1.25 41 598 133 602North America 2.47 2.84 3.29 3.61 54 567 148 516South & Central America 1.62 2.05 2.84 2.94 52 577 228 893Overall 1.35 1.65 1.89 2.16 357 446 1 040 555
Table B.50: Production TRIR by region for companies and contractors (2014 & 2009–2013) and the number of related work hours for companies and contractors for 2014 only

127Appendix B
RegionLTIF Work hours (thousands)
Company Contractor Company Contractor2014 2009–2013 2014 2009–2013 2014
Africa 0.18 0.32 0.34 0.32 44 990 175 816Asia/Australasia 0.22 0.31 0.16 0.30 73 041 208 894Europe 0.79 0.84 1.15 1.47 65 504 101 372FSU 0.09 0.30 0.16 0.18 33 637 61 828Middle East 0.19 0.58 0.09 0.30 42 604 137 729North America 0.25 0.80 0.44 0.82 121 768 279 259South & Central America 0.47 0.59 0.69 0.57 52 863 229 263Overall 0.33 0.56 0.43 0.54 434 407 1 194 161
Table B.51: Production LTIF by region for companies and contractors (2014 & 2009–2013) and the number of related work hours for companies and contractors for 2014 only
RegionTRIR Work hours (thousands)
Company Contractor Company Contractor2014 2009–2013 2014 2009–2013 2014
Africa 0.18 0.36 1.27 1.46 11 145 56 802Asia/Australasia 0.05 0.47 1.15 1.58 19 702 373 530Europe 0.95 0.36 2.23 2.90 7 376 53 408FSU 0.31 0.70 0.43 0.93 3 262 53 144Middle East 0.00 0.39 0.64 0.45 9 757 246 654North America 0.33 0.45 2.10 2.87 9 018 73 010South & Central America 0.00 1.24 2.85 2.77 1 472 15 429Overall 0.23 0.47 1.14 1.10 61 732 871 977
Table B.52: Construction TRIR by region for companies and contractors (2014 & 2009–2013) and the number of related work hours for companies and contractors for 2014 only
RegionLTIF Work hours (thousands)
Company Contractor Company Contractor2014 2009–2013 2014 2009–2013 2014
Africa 0.00 0.06 0.26 0.33 11 145 56 802Asia/Australasia 0.05 0.11 0.12 0.20 21 464 375 596Europe 0.25 0.12 0.71 0.87 7 952 53 528FSU 0.31 0.25 0.13 0.31 3 262 53 144Middle East 0.00 0.14 0.07 0.11 13 984 248 471North America 0.00 0.07 0.20 0.38 12 304 126 689South & Central America 0.00 0.56 0.84 0.92 1 531 15 429Overall 0.06 0.13 0.17 0.23 71 642 929 659
Table B.53: Construction LTIF by region for companies and contractors (2014 & 2009–2013) and the number of related work hours for companies and contractors for 2014 only
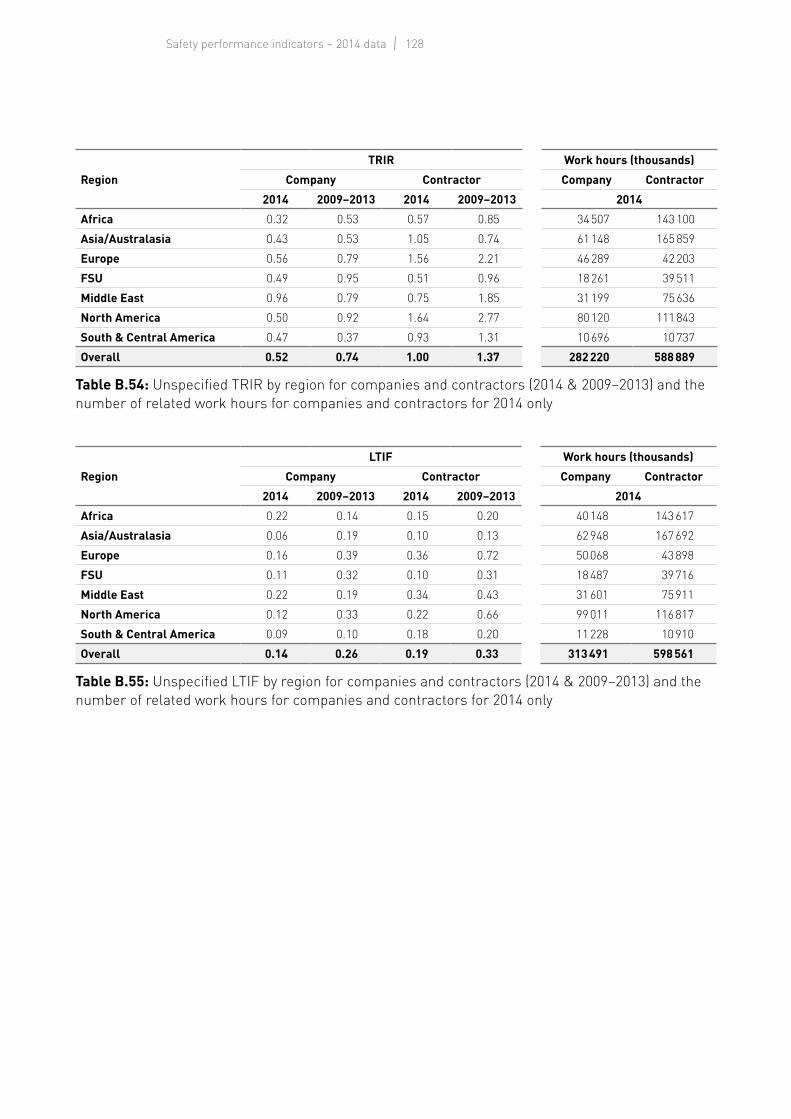
128Safety performance indicators – 2014 data
RegionTRIR Work hours (thousands)
Company Contractor Company Contractor2014 2009–2013 2014 2009–2013 2014
Africa 0.32 0.53 0.57 0.85 34 507 143 100Asia/Australasia 0.43 0.53 1.05 0.74 61 148 165 859Europe 0.56 0.79 1.56 2.21 46 289 42 203FSU 0.49 0.95 0.51 0.96 18 261 39 511Middle East 0.96 0.79 0.75 1.85 31 199 75 636North America 0.50 0.92 1.64 2.77 80 120 111 843South & Central America 0.47 0.37 0.93 1.31 10 696 10 737Overall 0.52 0.74 1.00 1.37 282 220 588 889
Table B.54: Unspecified TRIR by region for companies and contractors (2014 & 2009–2013) and the number of related work hours for companies and contractors for 2014 only
RegionLTIF Work hours (thousands)
Company Contractor Company Contractor2014 2009–2013 2014 2009–2013 2014
Africa 0.22 0.14 0.15 0.20 40 148 143 617Asia/Australasia 0.06 0.19 0.10 0.13 62 948 167 692Europe 0.16 0.39 0.36 0.72 50 068 43 898FSU 0.11 0.32 0.10 0.31 18 487 39 716Middle East 0.22 0.19 0.34 0.43 31 601 75 911North America 0.12 0.33 0.22 0.66 99 011 116 817South & Central America 0.09 0.10 0.18 0.20 11 228 10 910Overall 0.14 0.26 0.19 0.33 313 491 598 561
Table B.55: Unspecified LTIF by region for companies and contractors (2014 & 2009–2013) and the number of related work hours for companies and contractors for 2014 only

129Appendix B
Section 5 Results by company
Company codeFAR TRIR LTIF
FAR Total TRIR Total Company Contractor LTIF Total Company ContractorA 0.00 4.34 1.76 6.45 1.97 1.32 2.51B 13.41 4.83 3.64 5.64 1.48 1.32 1.58C 0.00 4.22 1.66 6.41 1.15 0.00 2.14D 1.99 3.31 2.09 3.74 1.14 0.76 1.28E 2.27 3.86 1.51 4.25 1.08 0.48 1.18F 0.00 1.34 1.56 1.32 1.07 0.39 1.12G 0.00 3.79 0.89 4.62 0.96 0.00 1.23H 3.88 4.57 1.31 5.14 0.93 0.79 0.95I 1.02 3.20 1.42 3.56 0.87 0.50 0.94J 9.82 2.96 2.05 3.80 0.79 0.77 0.79K 4.28 3.25 2.97 3.33 0.79 0.51 0.87L 0.00 3.97 2.07 4.74 0.73 0.58 0.80M 9.15 1.37 0.92 1.48 0.73 0.46 0.80N 0.00 3.88 2.56 4.33 0.65 0.00 0.87O 0.00 3.81 2.65 4.14 0.63 0.20 0.75P 0.00 2.77 1.86 3.07 0.60 0.72 0.57Q 0.00 1.97 0.74 2.24 0.59 0.00 0.71R 0.00 1.83 0.27 2.14 0.58 0.00 0.70S 2.31 1.29 1.17 1.38 0.53 0.64 0.46T 0.00 4.47 2.57 6.24 0.50 0.51 0.48U 7.03 1.97 1.21 2.20 0.49 0.61 0.46V 0.00 1.41 0.54 1.65 0.39 0.11 0.47W 2.60 0.37 0.37 0.37OVERALL 1.03 1.54 0.90 1.70 0.36 0.26 0.39X 0.00 2.09 0.99 2.45 0.34 0.00 0.45Y 3.43 0.77 0.66 0.82 0.33 0.11 0.42Z 1.07 0.91 1.04 0.86 0.32 0.30 0.32AA 0.45 1.34 0.44 1.61 0.32 0.16 0.36BB 0.00 2.23 0.00 2.74 0.32 0.00 0.39CC 0.00 1.00 1.46 0.95 0.29 0.16 0.30DD 0.30 1.08 1.33 1.05 0.26 0.17 0.28EE 0.47 0.64 0.21 0.78 0.26 0.17 0.29FF 0.63 1.13 0.50 1.41 0.26 0.16 0.30GG 0.00 0.24 0.00 0.37 0.24 0.00 0.37HH 2.94 0.55 0.35 0.61 0.22 0.18 0.23II 0.00 1.29 0.63 1.50 0.22 0.00 0.29JJ 0.00 1.90 0.93 3.11 0.22 0.00 0.49KK 0.00 0.74 1.05 0.70 0.19 0.19 0.19LL 0.72 0.72 0.41 0.85 0.19 0.18 0.20MM 0.00 1.44 0.43 1.70 0.18 0.06 0.21NN 0.79 1.58 1.11 1.72 0.17 0.19 0.17OO 0.00 0.68 0.57 0.71 0.14 0.57 0.00PP 0.85 1.38 1.76 1.36 0.14 0.15 0.14QQ 0.41 0.97 0.49 1.06 0.11 0.05 0.13RR 0.00 2.42 0.74 2.92 0.10 0.00 0.13SS 3.72 1.60 0.25 1.84 0.07 0.00 0.09TT 0.00 0.48 0.32 0.52 0.05 0.14 0.03UU 0.00 0.89 0.62 0.91 0.04 0.00 0.05VV 0.00 1.60 0.89 2.01 0.00 0.00 0.00WW 0.00 0.20 0.00 0.25 0.00 0.00 0.00XX 0.00 2.03 0.00 3.57 0.00 0.00 0.00YY 0.00 0.00 0.00 0.00 0.00 0.00 0.00ZZ 0.00 3.61 0.00 5.43 0.00 0.00 0.00
Company codes are allocated according to company & contractor LTIF performance
Table B.56: FAR, TRIR and LTIF results by company (2014)

130Safety performance indicators – 2014 data
TRIR Exploration TRIR Drilling TRIR Production TRIR ConstructedCode Total Code Total Code Total Code TotalI 13.22 H 10.20 C 8.85 A 16.61V 4.41 D 7.25 T 8.66 O 5.68RR 4.35 ZZ 6.97 A 7.07 G 5.34C 3.50 KK 6.41 L 6.12 R 4.45A 3.47 A 6.33 E 4.37 JJ 4.27U 3.16 K 5.56 P 3.81 K 4.07X 2.76 G 5.19 D 3.50 P 3.95Q 2.49 T 4.93 X 3.46 H 3.90XX 2.46 O 4.88 O 3.45 C 2.49E 2.38 N 4.40 VV 3.23 M 2.31K 2.02 E 4.33 H 3.10 V 1.91AA 1.89 I 4.21 G 2.99 D 1.90DD 1.87 XX 4.21 I 2.78 L 1.73KK 1.83 U 4.05 K 2.63 II 1.63NN 1.73 J 3.90 JJ 2.35 RR 1.44II 1.68 P 3.75 NN 2.20 PP 1.40Overall 1.48 NN 3.47 RR 2.19 AA 1.35R 1.41 C 3.29 Q 2.09 QQ 1.27S 1.34 RR 3.27 J 1.82 Y 1.10P 1.28 II 3.17 AA 1.79 Overall 1.08BB 1.25 F 3.00 Overall 1.75 SS 1.00O 1.00 L 2.91 F 1.42 UU 1.00CC 0.77 CC 2.84 PP 1.41 LL 0.93Y 0.57 R 2.82 SS 1.39 U 0.86D 0.43 Overall 2.78 V 1.18 Z 0.80F 0.36 V 2.34 DD 1.14 NN 0.76EE 0.35 S 2.22 FF 1.12 GG 0.63QQ 0.19 Q 2.17 S 1.06 S 0.60G 0.00 VV 2.17 II 1.03 DD 0.59H 0.00 FF 2.14 EE 0.99 CC 0.56HH 0.00 JJ 2.10 OO 0.90 FF 0.56JJ 0.00 DD 2.08 R 0.83 EE 0.40L 0.00 SS 2.05 TT 0.81 HH 0.33LL 0.00 X 1.97 QQ 0.75 KK 0.22PP 0.00 TT 1.86 U 0.70 WW 0.19T 0.00 AA 1.74 CC 0.63 TT 0.07TT 0.00 QQ 1.71 HH 0.58 F 0.00Z 0.00 M 1.47 Y 0.58 T 0.00
HH 1.40 LL 0.53 VV 0.00EE 1.15 UU 0.50 X 0.00Z 1.15 M 0.45LL 1.14 Z 0.39Y 0.73 KK 0.32PP 0.63 WW 0.20UU 0.00 GG 0.00YY 0.00 ZZ 0.00
Company results are sorted from worst to best for each function
Table B.57: Company TRIR results by function (2014)

131Appendix B
YearHours (thousands)
Overall Company Contractor1985 655 650 410 409 245 241 1986 544 053 305 637 238 416
1987 602 480 355 578 246 902 1988 616 448 363 530 252 918 1989 655 945 330 970 324 975 1990 720 652 331 986 388 666 1991 940 538 441 141 499 397 1992 944 143 431 139 513 004 1993 919 176 410 474 508 702 1994 871 973 397 258 474 715 1995 840 811 355 695 485 186 1996 911 540 360 149 551 391 1997 1 161 335 389 442 771 893 1998 1 131 229 385 619 745 610 1999 1 197 460 395 141 802 319 2000 1 633 855 571 915 1 061 940 2001 1 976 646 633 039 1 343 607 2002 2 120 829 636 414 1 484 415 2003 2 247 026 663 894 1 583 132 2004 2 290 453 638 739 1 651 714 2005 2 380 670 639 292 1 741 378 2006 2 936 974 734 425 2 202 549 2007 2 912 801 667 986 2 244 815 2008 3 304 168 712 482 2 591 686 2009 3 585 842 822 240 2 763 602 2010 3 411 144 725 673 2 685 471 2011 3 456 078 753 100 2 702 978 2012 3 691 040 759 600 2 931 440 2013 3 770 546 820 856 2 949 690 2014 4 365 959 945 572 3 420 387
Table B.58: Total work hours reported (1985–2014)
RegionHours (thousands)
2014 2013Africa 580 464 595 637 Asia/Australasia 1 077 835 919 063 Europe 385 335 398 820 FSU 248 328 240 596 Middle East 607 954 637 244 North America 1 025 254 590 089 South & Central America 440 789 389 097 Overall 4 365 959 3 770 546
Table B.59: Exposure hours by region (2013 & 2014)

132Safety performance indicators – 2014 data
RegionHours (thousands)
2014 2013Exploration 117 859 95 197 Drilling 706 179 579 757 Production 1 628 568 1 313 488 Construction 1 001 301 930 481 Unspecified 912 052 851 623 Overall 4 365 959 3 770 546
Table B.60: Exposure hours by function (2013 & 2014)

133Appendix B
Appendix C – Contributing companies
Company Hours (thousands)
Contractor data
Data by function RWDCs LWDC
daysRWDC days
ADNOC 113 611 yes yes yes yes yesANADARKO 88 165 yes yes yes partly partlyBASHNEFT 58 313 yes yes partly yes partlyBG GROUP 89 115 yes yes yes yes yesBHP BILLITON 29 734 yes yes yes partly partlyBP 158 204 yes yes yes no noCAIRN ENERGY 1 545 yes yes yes yes yesCAIRN INDIA 62 856 yes yes yes yes yesCHEVRON 493 285 yes yes mostly mostly mostlyCNOOC 139 443 yes yes partly partly noCONOCOPHILLIPS 157 056 yes no yes no noDOLPHIN ENERGY 10 251 yes yes yes yes yesDONG E&P 2 606 yes yes yes yes yesE.ON 1 080 yes yes yes yes yesENI 212 827 yes yes yes yes noEXXONMOBIL 254 475 yes yes yes no noGALP 554 yes yes yes yes noGDF SUEZ E&P INTERNATIONAL
7 458 yes yes yes yes yes
GENEL 3 146 yes yes no mostly noHESS CORPORATION 37 609 yes yes yes yes yesHUSKY 44 318 yes yes yes yes yesINPEX 118 132 yes yes yes yes yesKOSMOS 1 972 yes yes yes yes yesKUWAIT OIL COMPANY 137 785 yes yes yes yes noMAERSK OIL 29 986 yes yes yes no noMARATHON OIL COMPANY
30 362 yes yes yes no no
MOL 30 541 yes yes partly no noOIL SEARCH 14 226 yes yes yes yes yes
Table C.1 shows the size of the database in thousands of work hours reported for each contributing company and whether reported data include information on contractor statistics, breakdown by function, medical treatment cases, restricted work day cases, days lost following lost work day and restricted work day cases. All company submissions include data on numbers of fatalities and lost work day cases.

134Safety performance indicators – 2014 data
Company Hours (thousands)
Contractor data
Data by function RWDCs LWDC
daysRWDC days
OMV 86 561 yes yes yes yes yesORIGIN 25 805 yes yes yes partly noPAN AMERICAN ENERGY 26 881 yes yes yes yes noPEMEX 384 953 yes yes no yes noPERENCO 46 749 yes yes yes yes yesPETROBRAS 293 730 yes yes yes yes yesPETRONAS CARIGALI SDN BHD
101 888 yes yes yes partly no
PLUSPETROL 32 828 yes yes yes yes partlyPREMIER OIL 10 931 yes yes mostly no noPTTEP 40 155 yes yes yes yes yesQATAR PETROLEUM 93 886 yes yes yes yes yesRASGAS 115 344 yes yes yes no noREPSOL 29 129 yes yes yes yes noRWE DEA AG 5 066 yes yes yes yes noSASOL 4 194 yes yes no yes noSHELL COMPANIES 334 770 yes yes partly partly partlySTATOIL 100 693 yes yes yes no noSUNCOR 3 118 yes yes yes yes yesTALISMAN ENERGY 28 143 yes yes yes no noTOTAL 220 936 yes yes yes yes yesTULLOW OIL 22 433 yes yes mostly mostly mostlyWINTERSHALL 8 061 yes yes yes yes yesWOODSIDE 13 681 yes yes yes yes yesYEMEN LNG 7 369 yes yes yes yes yes
A data row is a single entry for a company for one country and location (one of company onshore, company offshore, contractor onshore, contractor offshore), e.g. A company, UK, company offshore.yes = reported for all data rows mostly = reported for more than 50% of data rows partly = reported for less than 50% of data rows no = not reported at all.
Table C.1: Data provided by contributing companies (2014)

135Appendix B
Appendix D – Countries represented
The tabulation shows the breakdown of reported hours worked in regions and countries. Also shown is the number of companies reporting data in each country. The table does not necessarily show all hours worked in the exploration and production sectors of the oil and gas industry in each country.
Country No. of companies Hours (thousands) Algeria 11 24 138 Angola 9 102 166
Benin 1 401 Cameroun 1 7 417 Chad 1 13 758 Congo 4 42 309 D.R. of the Congo (formerly Zaire) 2 5 571 Egypt 7 55 270 Equatorial Guinea 4 9 291 Ethiopia 1 1 195 Gabon 5 31 030 Ghana 6 6 563 Guinea 1 12 Ivory Coast 3 718 Kenya 5 11 080 Liberia 3 406 Libya 13 15 490 Madagascar 3 113 Mauritania 5 3 671 Morocco 5 1 766 Mozambique 5 13 127 Namibia 3 322 Nigeria 8 206 912 Senegal 3 981 Sierra Leone 2 5 South Africa 5 822 Sudan 1 63 Tanzania 4 4 448 Togo 1 31 Tunisia 7 13 045 Uganda 3 8 343
Table D.1: Number of companies and work hours reported by country – Africa (2014)

136Safety performance indicators – 2014 data
Country No. of companies Hours (thousands) Australia 19 270 471 Bangladesh 1 17 598
Brunei 3 1 336 Cambodia 1 12 China 13 120 814 India 4 67 169 Indonesia 16 257 968 Japan 4 5 005 Malaysia 10 132 867 Myanmar 5 17 939 New Zealand 4 2 401 Pakistan 6 31 634 Papua New Guinea 5 36 313 Philippines 2 9 155 Singapore 7 22 384 South Korea 5 18 139 Taiwan 1 9 Thailand 7 60 355 Timor Leste 1 5 Vietnam 7 6 261
Table D.2: Number of companies and work hours reported by country – Asia/Australasia (2014)
Country No. of companies Hours (thousands) Austria 1 2 911 Bulgaria 2 23
Croatia 2 10 129 Cyprus 2 531 Denmark 6 12 884 Faroe Islands 1 208 France 6 12 106 Germany 5 10 494 Greenland 2 25 Hungary 2 8 024 Ireland 2 2 410 Italy 5 20 007 Malta 2 189 Monaco 1 177 Netherlands 8 21 963 Norway 22 106 077 Poland 3 840 Portugal 1 9 Romania 4 55 488 Spain 3 3 769 Sweden 1 5 UK 26 117 066
Table D.3: Number of companies and work hours reported by country – Europe (2014)

137Appendix B
Country No. of companies Hours (thousands) Azerbaijan 5 37 230 Kazakhstan 10 119 052
Lithuania 1 8 Russia 13 80 772 Turkmenistan 4 10 762 Ukraine 4 504
Table D.4: Number of companies and work hours reported by country – FSU (2014)
Country No. of companies Hours (thousands) Iran 2 100 Iraq 15 44 103
Jordan 1 763 Kurdistan region of Iraq 1 111 Kuwait 4 159 029 Oman 3 6 546 Palestine 1 8 Qatar 11 246 677 Saudi Arabia 1 83 Syria 2 32 Turkey 3 3 394 UAE 12 121 115 Yemen 5 25 993
Table D.5: Number of companies and work hours reported by country – Middle East (2014)
Country No. of companies Hours (thousands) Canada 14 167 158 Mexico 5 385 112
USA 19 472 984
Table D.6: Number of companies and work hours reported by country – North America (2014)

138Safety performance indicators – 2014 data
Country No. of companies Hours (thousands) Argentina 8 43 428 Aruba 1 82
Bolivia 4 15 600 Brazil 14 310 542 Chile 1 72 Colombia 10 8 992 Ecuador 2 5 622 Falkland Islands 1 281 French Guiana 1 18 Guatemala 1 2 700 Guyana 2 24 Honduras 1 33 Peru 5 34 895 Surinam 3 31 Trinidad & Tobago 6 13 583 Uruguay 3 176 Venezuela 7 4 710
Table D.7: Number of companies and work hours reported by country – South & Central America (2014)

139Glossary
Appendix E – Glossary of terms
AAssault and violent act (as an incident/event category)Intentional attempt, threat or act of bodily injury by a person or person(s) or by violent harmful actions of unknown intent, includes intentional acts of damage to property.
CCaught in, under or between (as an incident/event category)Injury where injured person is crushed or similarly injured between machinery moving parts or other objects, caught between rolling tubulars or objects being moved, crushed between a ship and a dock, or similar incidents. Also includes vehicle incidents involving a rollover.
Causal factorsSee IOGP Report 2014su, Safety data reporting users' guide – 2014 data.
Company employeeAny person employed by and on the payroll of the reporting company, including corporate and management personnel specifically involved in E&P. Persons employed under short-service contracts are included as company employees provided they are paid directly by the company.
Confined space (as an incident/event category)Spaces that are considered confined because their configurations hinder the activities of employee who must enter, work in, and exit them. Confined spaces include, but are not limited to underground vaults, tanks, storage bins, manholes, pits, silos, process vessels and pipelines.
Construction (as a work function)Major construction, fabrication activities and also disassembly, removal and disposal (decommissioning)
at the end of the facility life. Includes construction of process plant, yard construction of structures, offshore installation, hook-up and commissioning, and removal of redundant process facilities.
Construction, commissioning, decommissioning (as a type of activity)Activities involving the construction, fabrication and installation of equipment, facilities or plant, testing activities to verify design objectives or specification, and also disassembly, removal and disposal (decommissioning) at the end of the facility life.
ContractorA contractor is defined as an individual or organization performing work for the reporting company, following verbal or written agreement. Subcontractor is synonymous with contractor.
Contractor employeeAny person employed by a contractor or contractor’s subcontractor(s) who is directly involved in execution of prescribed work under a contract with the reporting company.
Cut, puncture, scrape (as an incident/event category)Abrasions, scratches and wounds that penetrate the skin.
DDiving operations The personnel, equipment and management systems to support a person who dives. A person dives if they enter water or any other liquid, or a chamber in which they are subject to pressure greater than 100 millibars above atmospheric pressure, and in order to survive in such an environment breathes air or other gas at a pressure greater than atmospheric pressure. Or for such a purpose uses a vehicle, capsule or suit where a sealed internal atmospheric pressure is maintained and where the external pressure differential is greater than 100 millibars.

140Safety performance indicators – 2014 data
Diving, subsea, ROV (as a type of activity)Operations involving diving (see definition for diving operations), subsea equipment or activities and/or operations involving underwater remotely operated vehicles (ROV).
Drilling (as a work function)All exploration, appraisal and production drilling and workover as well as their administrative, engineering, construction, materials supply and transportation aspects. It includes site preparation, rigging up and down and restoration of the drilling site upon work completion. Drilling includes ALL exploration, appraisal and production drilling.
Drilling/workover/well services (as a type of activity) Activities involving the development, maintenance work or remedial treatments related to an oil or gas well.
EEventAn unplanned or uncontrolled outcome of a business operation or activity that has or could have contributed to an injury, illness, physical or environmental damage.
Exploration (as a work function)Geophysical, seismographic and geological operations, including their administrative and engineering aspects, construction, maintenance, materials supply, and transportation of personnel and equipment; excludes drilling.
Explosion or burn (as an incident/ event category)Burns or other effects of fires, explosions and extremes of temperature. Explosion means a rapid combustion, not an overpressure.
Exposure: Electrical (as an incident/ event category)Exposure to electrical shock or electrical burns etc.
Exposure: Noise, chemical, biological, vibration (as an incident/event category)Exposure to noise, chemical substances (including asphyxiation due to lack of oxygen not associated with a confined space), hazardous biological material, vibration or radiation.
FFalls from height (as an incident/ event category)A person falls from one level to another.
Fatal accident rate (FAR)The number of company/contractor fatalities per 100 000 000 (100 million) hours worked.
FatalityCases that involve one or more people who died as a result of a work-related incident or occupational illness.
First aid caseCases that are not sufficiently serious to be reported as medical treatment or more serious cases but nevertheless require minor first aid treatment, e.g. dressing on a minor cut, removal of a splinter from a finger. First aid cases are not recordable incidents.
HHigh potential eventAny incident or near miss that could have realistically resulted in one or more fatalities.
Hours workedThe actual hours worked, including overtime hours, are recorded in the case of onshore operations. The hours worked by an individual will generally be about 2 000 per year. For offshore workers, the hours worked are calculated on a 12-hour work day. Consequently, average hours worked per year will vary from 1 600 to 2 300 hours per person depending upon the on/off shift ratio. Vacations and leave are excluded.

141Glossary
Hours worked in year (thousands)Hours are rounded to the nearest thousand.
IIncident An unplanned or uncontrolled event or chain of events that has resulted in at least one fatality, recordable injury or illness, or physical or environmental damage.
KKey performance indicators (KPI)In this report, these include: number of fatalities, fatal accident and incident rates, lost time injury frequency and total recordable injury rate.
LLifting, crane, rigging, deck operations (as a type of activity)Activities related to the use of mechanical lifting and hoisting equipment, assembling and dis-assembling drilling rig equipment and drill pipe handling on the rig floor.
Lost time injury (LTI)A fatality or lost work day case. The number of LTIs is the sum of fatalities and lost work day cases.
Lost time injury frequency (LTIF)The number of lost time injuries (fatalities + lost work day cases) incidents per 1 000 000 hours worked.
Lost work day case (LWDC)Any work related injury other than a fatal injury which results in a person being unfit for work on any day after the day of occurrence of the occupational injury. Any day includes rest days, weekend days, leave days, public holidays or days after ceasing employment.
LWDC severityThe average number of lost days per lost work day case.
MMaintenance, inspection and testing (as a type of activity)Activities related to preserving, repairing, examining and function testing assets, equipment, plant or facilities.
Medical cause of deathThis is the cause of death given on the death certificate. Where two types of causes are provided, such as pulmonary oedema caused by inhalation of hot gases from a fire, both are recorded.
Medical treatment case (MTC)Cases that are not severe enough to be reported as fatalities or lost work day cases or restricted work day cases but are more severe than requiring simple first aid treatment.
NNear missAn unplanned or uncontrolled event or chain of events that has not resulted in recordable injury, illness, physical or environmental damage but had the potential to do so in other circumstances.
Number of days unfit for workThe sum total of calendar days (consecutive or otherwise) after the days of the occupational injuries on which the employees involved were unfit for work and did not work.
Number of employeesAverage number of full-time and part-time employees involved in exploration and production, calculated on a full-time basis, during the reporting year.
Number of fatalitiesThe total number of a company’s employees and or contractor’s employees who died as a result of an incident. Delayed deaths that occur after the incident are included if the deaths were a direct result of the incident. For example, if a fire killed one person outright, and a second died three weeks later from lung damage caused by the fire, both are reported.
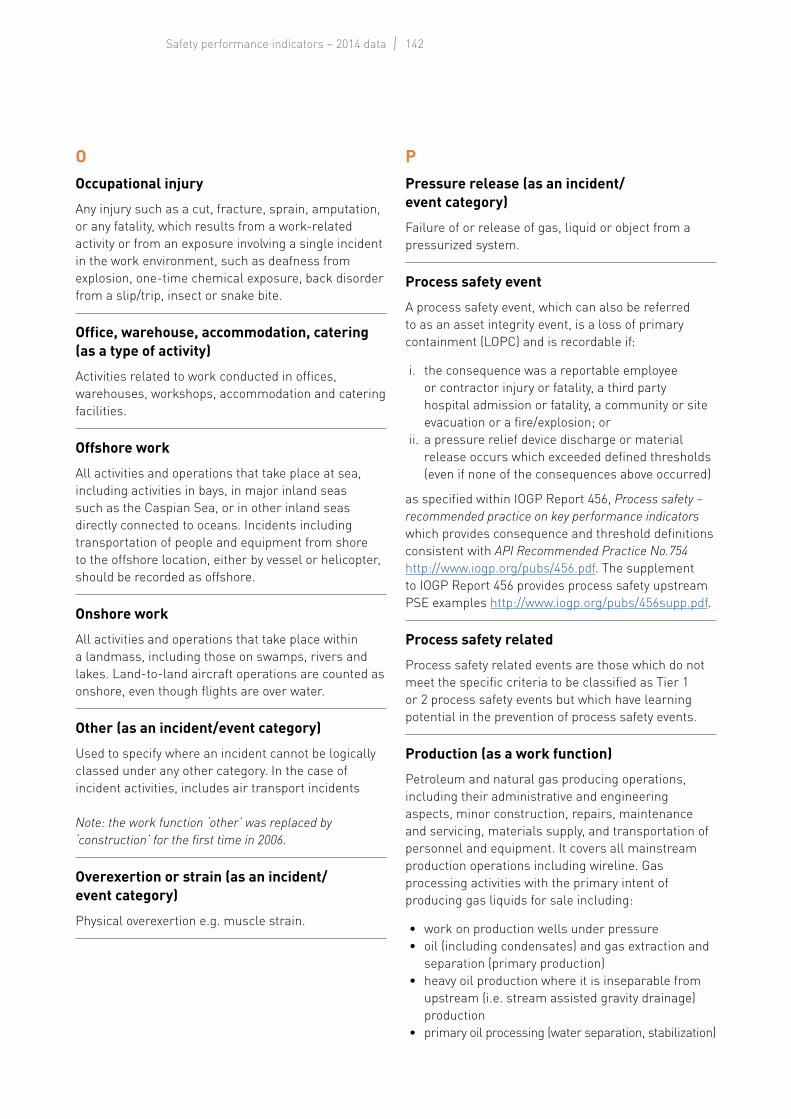
142Safety performance indicators – 2014 data
OOccupational injuryAny injury such as a cut, fracture, sprain, amputation, or any fatality, which results from a work-related activity or from an exposure involving a single incident in the work environment, such as deafness from explosion, one-time chemical exposure, back disorder from a slip/trip, insect or snake bite.
Office, warehouse, accommodation, catering (as a type of activity)Activities related to work conducted in offices, warehouses, workshops, accommodation and catering facilities.
Offshore workAll activities and operations that take place at sea, including activities in bays, in major inland seas such as the Caspian Sea, or in other inland seas directly connected to oceans. Incidents including transportation of people and equipment from shore to the offshore location, either by vessel or helicopter, should be recorded as offshore.
Onshore workAll activities and operations that take place within a landmass, including those on swamps, rivers and lakes. Land-to-land aircraft operations are counted as onshore, even though flights are over water.
Other (as an incident/event category)Used to specify where an incident cannot be logically classed under any other category. In the case of incident activities, includes air transport incidents Note: the work function ‘other’ was replaced by ‘construction’ for the first time in 2006.
Overexertion or strain (as an incident/ event category)Physical overexertion e.g. muscle strain.
PPressure release (as an incident/ event category)Failure of or release of gas, liquid or object from a pressurized system.
Process safety eventA process safety event, which can also be referred to as an asset integrity event, is a loss of primary containment (LOPC) and is recordable if:
i. the consequence was a reportable employee or contractor injury or fatality, a third party hospital admission or fatality, a community or site evacuation or a fire/explosion; or
ii. a pressure relief device discharge or material release occurs which exceeded defined thresholds (even if none of the consequences above occurred)
as specified within IOGP Report 456, Process safety – recommended practice on key performance indicators which provides consequence and threshold definitions consistent with API Recommended Practice No.754 http://www.iogp.org/pubs/456.pdf. The supplement to IOGP Report 456 provides process safety upstream PSE examples http://www.iogp.org/pubs/456supp.pdf.
Process safety relatedProcess safety related events are those which do not meet the specific criteria to be classified as Tier 1 or 2 process safety events but which have learning potential in the prevention of process safety events.
Production (as a work function)Petroleum and natural gas producing operations, including their administrative and engineering aspects, minor construction, repairs, maintenance and servicing, materials supply, and transportation of personnel and equipment. It covers all mainstream production operations including wireline. Gas processing activities with the primary intent of producing gas liquids for sale including:
• work on production wells under pressure• oil (including condensates) and gas extraction and
separation (primary production)• heavy oil production where it is inseparable from
upstream (i.e. stream assisted gravity drainage) production
• primary oil processing (water separation, stabilization)

143Glossary
• primary gas processing (dehydration, liquids separation, sweetening, CO2 removal)
• floating storage units (FSUs) and sub-sea storage units
• gas processing activities with the primary intent of producing gas liquids for sale• secondary liquid separation (i.e. natural gas
liquids [NGL] extraction using refrigeration processing)
• liquefied natural gas (LNG) and gas to liquids (GTL) operations
• flow-lines between wells and pipelines between facilities associated with field production operations
• oil and gas loading facilities including land or marine vessels (trucks and ships) when connected to an oil or gas production process
• pipeline operations (including booster stations) operated by company E&P business.
Production excludes:
• production drilling or workover• mining processes associated with the extraction of
heavy oil tar sands• heavy oil when separable from upstream operations• secondary heavy oil processing (upgrader)• refineries.
Production operations (as a type of activity)Activities related to the extraction of hydrocarbons from source such as an oil or gas well or hydrocarbon bearing geological structure, including primary processing, storage and transport operations. Includes normal, start-up or shut-down operations.
RRecordableA type of event, incident, injury, illness, release or other outcome which has been determined to meet or exceed definitions, criteria or thresholds for inclusion and classification in reported data.
Restricted work day case (RWDC)Any work-related injury other than a fatality or lost work day case which results in a person being unfit for full performance of the regular job on any day after the occupational injury.
Work performed might be:
• an assignment to a temporary job• part-time work at the regular job• working full-time in the regular job but not
performing all the usual duties of the job.
Where no meaningful restricted work is being performed, the incident is recorded as a lost work day case (LWDC).
SSeismic/survey operations (as a type of activity)Activities relating to the determination of sub-surface structures for the purpose of locating oil and gas deposits including geophysical and seismic data acquisition.
Slips and trips (at the same height) (as an incident/event category)Slips, trips and falls caused by falling over or onto something at the same height.
Struck by (as an incident/event category)Incidents/events where injury results from being hit by moving equipment and machinery, or by flying or falling objects. Also includes vehicle incidents where the vehicle is struck by or struck against another object.
TThird partyA person with no business relationship with the company or contractor.
Total recordable injury rate (TRIR)The number of recordable injuries (fatalities + lost work day cases + restricted work day cases + medical treatment cases) per million hours worked.
Transport – Air (as a type of activity)Involving aircraft, either fixed wing or helicopters. Injuries caused by accidents on the ground at airports are classified in one of the other categories.

144Safety performance indicators – 2014 data
Transport – Land (as a type of activity)Involving motorized vehicles designed for transporting people and goods over land, e.g. cars, buses, trucks. Pedestrians struck by a vehicle are classified as land transport incidents. Incidents from a mobile crane would only be land transport incidents if the crane were being moved between locations.
Transport – Water, including marine activity (as a type of activity)Involving vessels, equipment or boats designed for transporting people and goods over water (including inland, marine, ice roads and marsh/swamp) e.g. supply vessels, crew boats.
UUnspecified – Other (as a type of activity)Incidents that cannot be logically classed under other headings or where the activity is unknown.
Unspecified (as a work function)Unspecified is used for the entry of data associated with office personnel whose work hours and incident data cannot be reasonably assigned to the administrative support of one of the function groupings of exploration, drilling, production or construction. Corporate overhead support function personnel such as finance or human resources staff may be examples where work hours cannot be specifically assigned to a particular function. All other data that are not sepa rated out by function are reported as unspecified.
WWater related/drowning (as an incident/ event category)Incidents/events in which water played a significant role including drowning.
Work-related injurySee occupational injury.


Registered OfficeLevel 5209–215 Blackfriars RdLondon SE1 8NLUnited Kingdom
Brussels OfficeBd du Souverain,1654th FloorB-1160 BrusselsBelgium
T +44 (0)20 3763 9700F +44 (0)20 3763 [email protected]
T +32 (0)2 566 9150 F +32 (0)2 566 9159
www.iogp.org
The IOGP safety performance indicators – 2014 data report summarizes the safety performance of contributing IOGP member companies for 2014 based on the analysis of 4366 million work hours of data.
Submissions were made by 52 of the 58 operating company IOGP Members and cover operations in 111 countries.
The key performance indicators (KPI) used to benchmark safety performance are:• number of fatalities• fatal accident and incident rates • total recordable injury rate, and • lost time injury frequency.
Against the background of a 16% increase in work hours reported, the number of fatalities has decreased from 80 in 2013 to 45 in 2014. The resulting fatal accident rate (FAR) of 1.03 is 51% lower than last year.