DATA REPORTING AND ANALYTICS FOR FLEET REPORTING AND ANALYTICS FOR FLEET May 22, 2014 Bob Topaz...
38
DATA REPORTING AND ANALYTICS FOR FLEET May 22, 2014 Bob Topaz Verizon Networkfleet Empire Clean Cities Stakeholder Meeting PTEXXXXX XX/13 Confidential and proprietary materials for authorized Verizon personnel and outside agencies only. Use, disclosure or distribution of this material is not permitted to any unauthorized persons or third parties except by written agreement.
Transcript of DATA REPORTING AND ANALYTICS FOR FLEET REPORTING AND ANALYTICS FOR FLEET May 22, 2014 Bob Topaz...
DATA REPORTING AND ANALYTICS FOR FLEET May 22, 2014
Bob Topaz
Verizon Networkfleet
Empire Clean Cities Stakeholder Meeting
PTEXXXXX XX/13
Confidential and proprietary materials for authorized Verizon personnel and outside agencies only. Use, disclosure or distribution of this material is not permitted to any unauthorized persons or third parties except by written agreement.
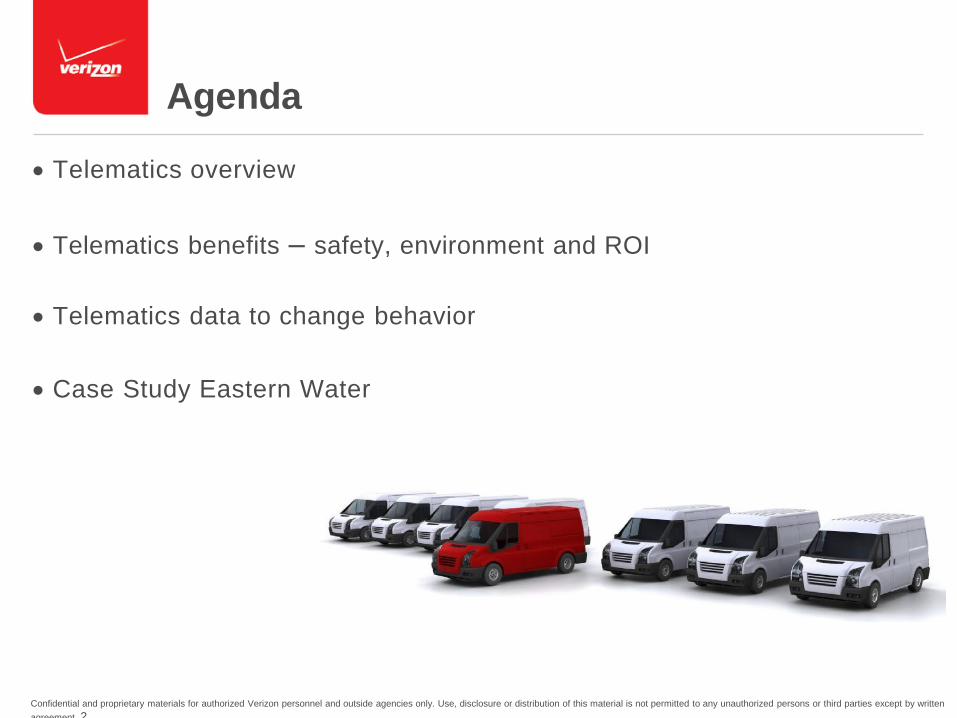
Agenda
Telematics overview
Telematics benefits – safety, environment and ROI
Telematics data to change behavior
Case Study Eastern Water
Confidential and proprietary materials for authorized Verizon personnel and outside agencies only. Use, disclosure or distribution of this material is not permitted to any unauthorized persons or third parties except by written
agreement. 2
Why Telematics now?
Overall fleet budgets are rising, and an additional dimension of Engine Data is now available.
Centralized decision-making and economies of scale are demanding better, more fact-based analyses.
The need for managing ‘big data’ and the confidence in data collected is critical.
New trends in accidents related to distracted driving and the explosive Telematics adoption-rate in the insurance industry.
To help keep maintenance costs in-check through tighter maintenance management and major repair avoidance.
Continuous optimization to drive on-going value from systems investments –
access to Engine data points provides hundreds of new, untapped optimization opportunities.
Confidential and proprietary materials for authorized Verizon personnel and outside agencies only. Use, disclosure or distribution of this material is not permitted to any unauthorized persons or third parties except by
written agreement. 3

Telematics Technology Adoption
Telematics at 20% penetration
Entering the Majority stage in
which over 75% of buyers will
make their purchase 100%
2014
20%
2007 2000
2010
0%
Early
Innovators Adopters Early
Majority Late
Majority Laggards
Source: Connected Fleet Report 2014 - Analysis of the industry trends, vehicle fleet needs and development of the fleet telematics market
Confidential and proprietary materials for authorized Verizon personnel and outside agencies only. Use, disclosure or distribution of this material is not permitted to any unauthorized persons or third parties except by
written agreement. 4

Why Isn’t Adoption Faster?
Cost not worth the benefit
Lack of organizational commitment
Employee pushback
Resource constraints/worries
Return on investment proven over and over again
Start small with a pilot, prove results, gain commitment
GPS has wider acceptance than you might think
Let your vendor help you manage your data/reporting
Confidential and proprietary materials for authorized Verizon personnel and outside agencies only. Use, disclosure or distribution of this material is not permitted to any unauthorized persons or third parties except by
written agreement. 5
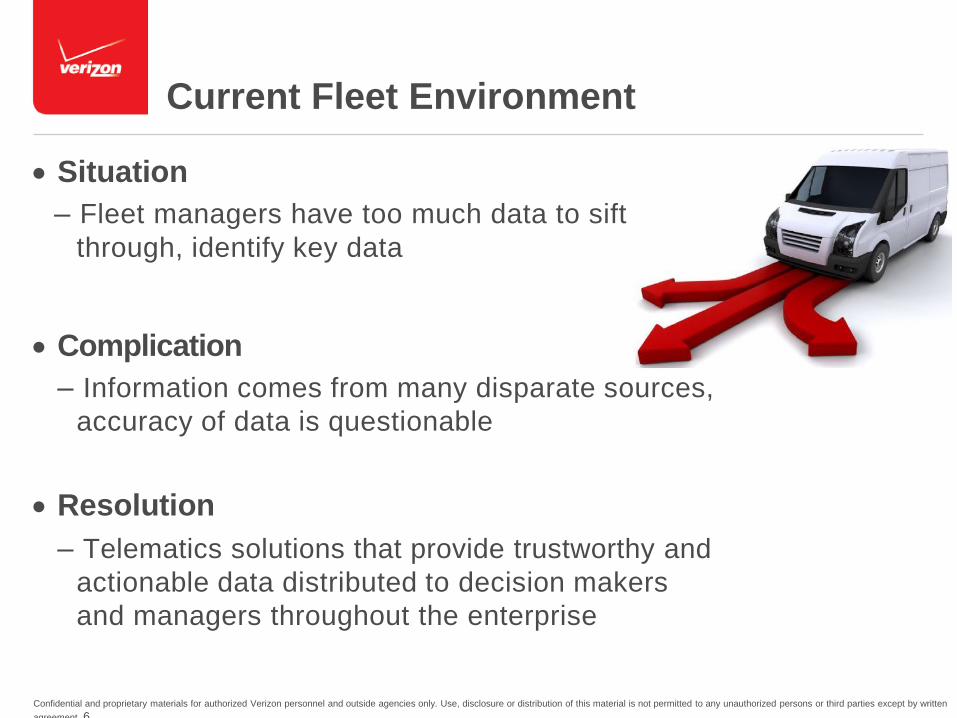
Current Fleet Environment
Situation
– Fleet managers have too much data to sift
through, identify key data
Complication
– Information comes from many disparate sources,
accuracy of data is questionable
Resolution
– Telematics solutions that provide trustworthy and
actionable data distributed to decision makers
and managers throughout the enterprise
Confidential and proprietary materials for authorized Verizon personnel and outside agencies only. Use, disclosure or distribution of this material is not permitted to any unauthorized persons or third parties except by written
agreement. 6

What Fleet Managers Worry About
Fewer Accidents
More Work Completed
Reduced Liability
Reduced Maintenance Costs
Less Speeding
Optimizing Fleet Size
Less Overtime
Lower Fuel Costs
Higher Fleet MPG
Lower Idling
Confidential and proprietary materials for authorized Verizon personnel and outside agencies only. Use, disclosure or distribution of this material is not permitted to any unauthorized persons or third parties except by
written agreement. 7
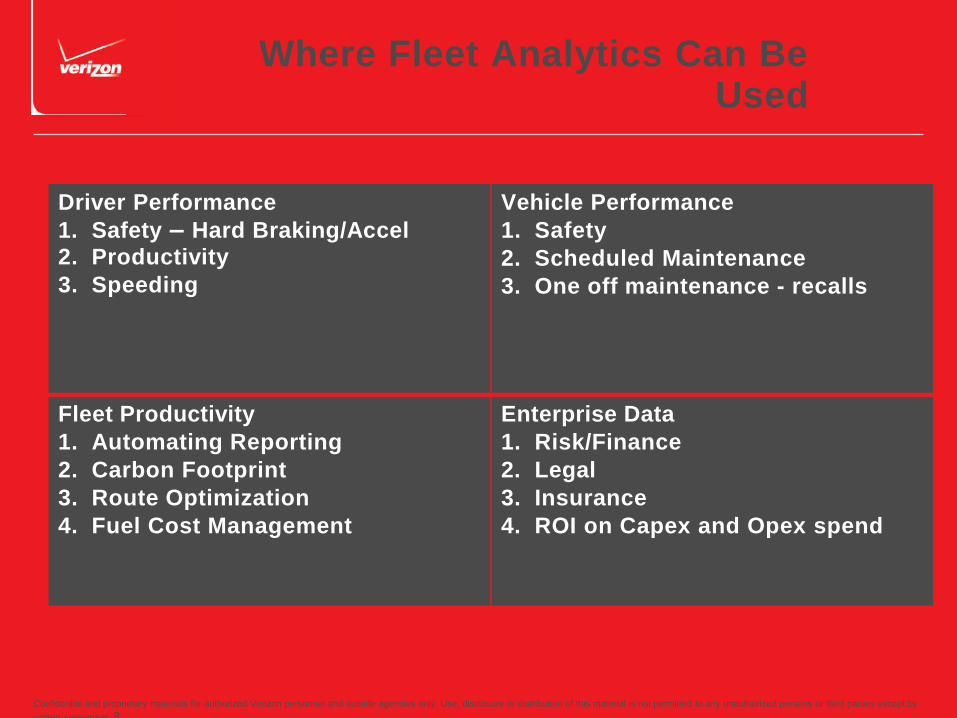
Where Fleet Analytics Can Be Used
Driver Performance
1. Safety – Hard Braking/Accel
2. Productivity
3. Speeding
Fleet Productivity
1. Automating Reporting
2. Carbon Footprint
3. Route Optimization
4. Fuel Cost Management
Vehicle Performance
1. Safety
2. Scheduled Maintenance
3. One off maintenance - recalls
Enterprise Data
1. Risk/Finance
2. Legal
3. Insurance
4. ROI on Capex and Opex spend
Confidential and proprietary materials for authorized Verizon personnel and outside agencies only. Use, disclosure or distribution of this material is not permitted to any unauthorized persons or third parties except by
written agreement. 8

SAFETY
Confidential and proprietary materials for authorized Verizon personnel and outside agencies only. Use, disclosure or distribution of this material is not permitted to any unauthorized persons or third parties except by
written agreement. 9
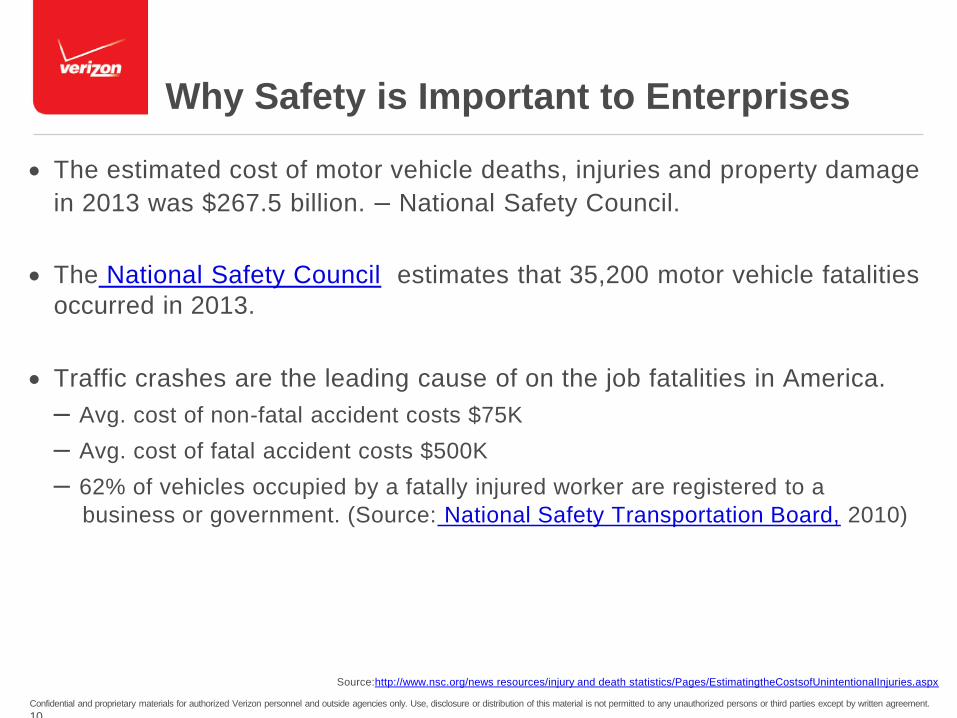
Why Safety is Important to Enterprises
The estimated cost of motor vehicle deaths, injuries and property damage
in 2013 was $267.5 billion. – National Safety Council.
The National Safety Council estimates that 35,200 motor vehicle fatalities
occurred in 2013.
Traffic crashes are the leading cause of on the job fatalities in America.
– Avg. cost of non-fatal accident costs $75K
– Avg. cost of fatal accident costs $500K
– 62% of vehicles occupied by a fatally injured worker are registered to a
business or government. (Source: National Safety Transportation Board, 2010)
Source:http://www.nsc.org/news resources/injury and death statistics/Pages/EstimatingtheCostsofUnintentionalInjuries.aspx
Confidential and proprietary materials for authorized Verizon personnel and outside agencies only. Use, disclosure or distribution of this material is not permitted to any unauthorized persons or third parties except by written agreement.
10
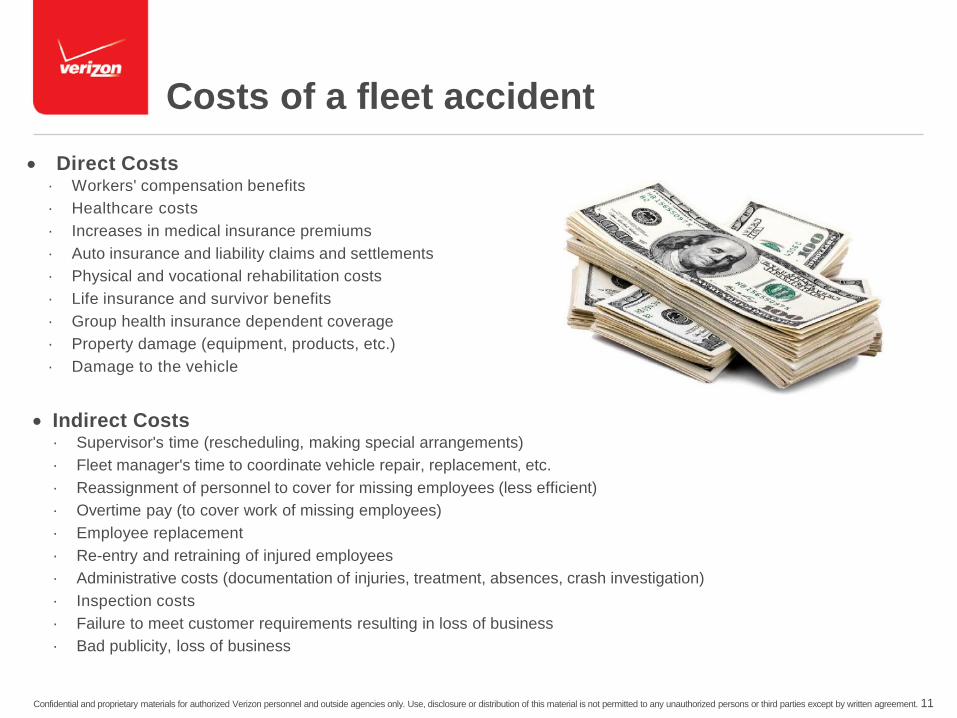
Costs of a fleet accident
Direct Costs · Workers' compensation benefits
· Healthcare costs
· Increases in medical insurance premiums
· Auto insurance and liability claims and settlements
· Physical and vocational rehabilitation costs
· Life insurance and survivor benefits
· Group health insurance dependent coverage
· Property damage (equipment, products, etc.)
· Damage to the vehicle
Indirect Costs · Supervisor's time (rescheduling, making special arrangements)
· Fleet manager's time to coordinate vehicle repair, replacement, etc.
· Reassignment of personnel to cover for missing employees (less efficient)
· Overtime pay (to cover work of missing employees)
· Employee replacement
· Re-entry and retraining of injured employees
· Administrative costs (documentation of injuries, treatment, absences, crash investigation)
· Inspection costs
· Failure to meet customer requirements resulting in loss of business
· Bad publicity, loss of business
Confidential and proprietary materials for authorized Verizon personnel and outside agencies only. Use, disclosure or distribution of this material is not permitted to any unauthorized persons or third parties except by written agreement. 11

Bassett Firm Research on Texas Law Suits
All Verdicts & Settlements
Time Frame January 1, 2003, through December 31, 2009
Jurisdiction Texas (all counties)
Number of Cases Reported 390
Number of Verdicts in Favor of the Plaintiff 148
Number of Verdicts in Favor of the Defendant 125
Number of Cases that Settled 119
Wrongful Death Verdicts in Favor of the Plaintiff
Low Verdict $85,000.00
High Verdict $23,588,217.00
Average Verdict $6,755,416.00
Average Verdict Excluding High/Low Verdict $6,120,267.70
Wrongful Death Settlements
Low Settlement $100,000.00
High Settlement $5,800,000.00
Average Settlement $1,783,593.00
Average Verdict Excluding High/Low Settlement $1,703,152.00
Confidential and proprietary materials for authorized Verizon personnel and outside agencies only. Use, disclosure or distribution of this material is not permitted to any unauthorized persons or third parties except by written agreement. 12
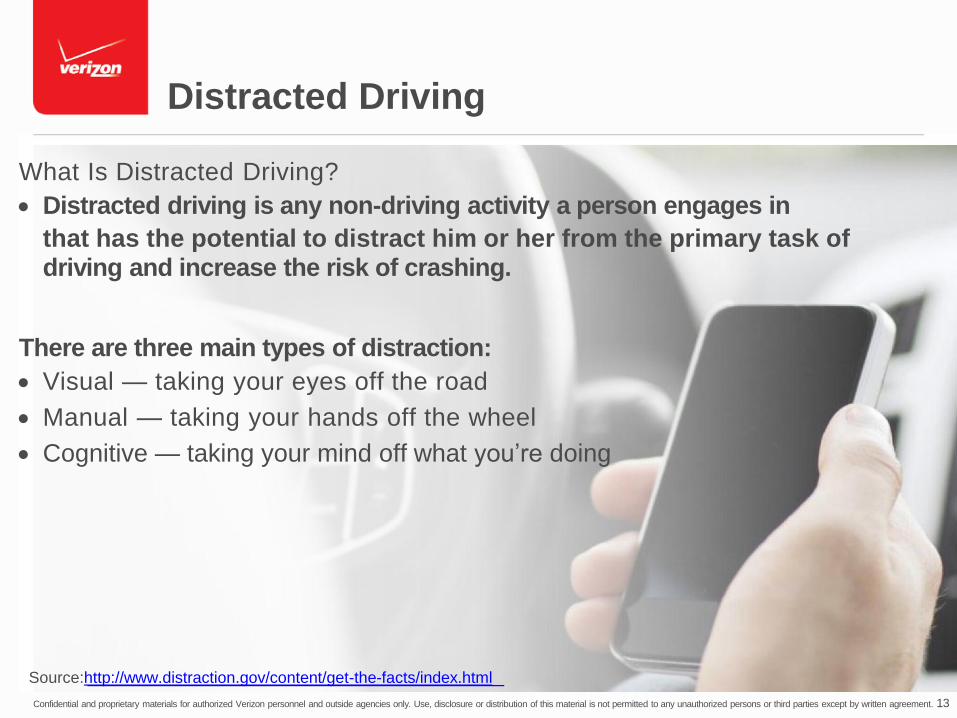
Distracted Driving
What Is Distracted Driving?
Distracted driving is any non-driving activity a person engages in
that has the potential to distract him or her from the primary task of driving and increase the risk of crashing.
There are three main types of distraction:
Visual — taking your eyes off the road
Manual — taking your hands off the wheel
Cognitive — taking your mind off what you’re doing
Source:http://www.distraction.gov/content/get-the-facts/index.html
Confidential and proprietary materials for authorized Verizon personnel and outside agencies only. Use, disclosure or distribution of this material is not permitted to any unauthorized persons or third parties except by written agreement. 13
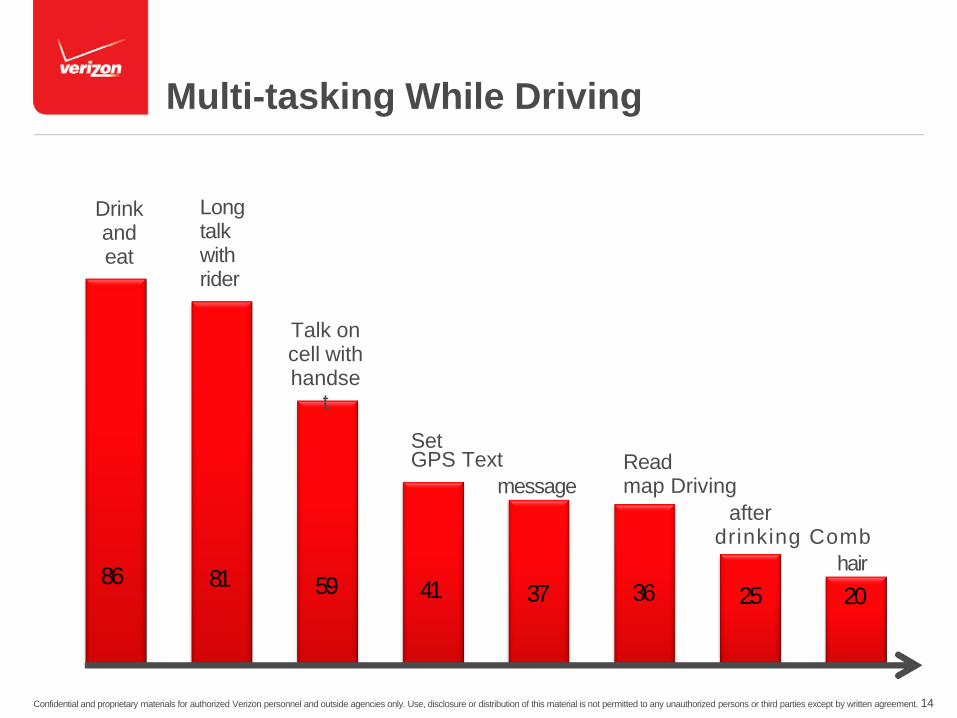
Multi-tasking While Driving
Long talk with rider
Drink and eat
Set GPS Text
message
41
Read map Driving
after drinking Comb
hair
25
Talk on cell with handse
t
81 59 37 20 36 86
Confidential and proprietary materials for authorized Verizon personnel and outside agencies only. Use, disclosure or distribution of this material is not permitted to any unauthorized persons or third parties except by written agreement. 14
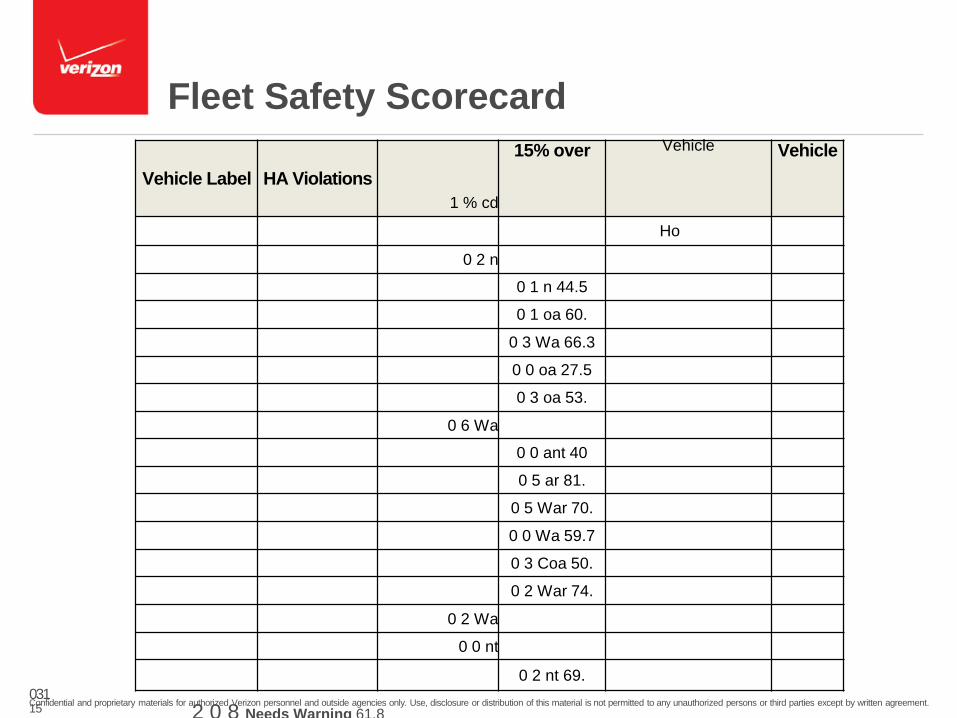
Fleet Safety Scorecard
Vehicle Label HA Violations
1 % cd
15% over Vehicle Vehicle
Ho
0 2 n
0 1 n 44.5
0 1 oa 60.
0 3 Wa 66.3
0 0 oa 27.5
0 3 oa 53.
0 6 Wa
0 0 ant 40
0 5 ar 81.
0 5 War 70.
0 0 Wa 59.7
0 3 Coa 50.
0 2 War 74.
0 2 Wa
0 0 nt
0 2 nt 69.
031 Confidential and proprietary materials for authorized Verizon personnel and outside agencies only. Use, disclosure or distribution of this material is not permitted to any unauthorized persons or third parties except by written agreement. 15 2 0 8 Needs Warning 61.8

Reduction in Speed
Fact– Reducing average driving speed lowers fuel cost by 2MPG for a 5
MPH reduction per hour
National Average – Average driver rides 60 miles per day/average mpg
22, uses 2.72 gallons of gas/day
Fact – If we take the 22 mpg to 24 mpg drivers will use 2.5 gallons per
day
Fact – Reducing .22 gallon of gas per day per driver (250 x $0.78) results
in:
$ 195 in Annual Savings per vehicle
Source:http://www-nrd.nhtsa.dot.gov/Pubs/811751.pdf
Confidential and proprietary materials for authorized Verizon personnel and outside agencies only. Use, disclosure or distribution of this material is not permitted to any unauthorized persons or third parties except by written agreement. 16
FUEL COSTS
Confidential and proprietary materials for authorized Verizon personnel and outside agencies only. Use, disclosure or distribution of this material is not permitted to any unauthorized persons or third parties except by written agreement. 17
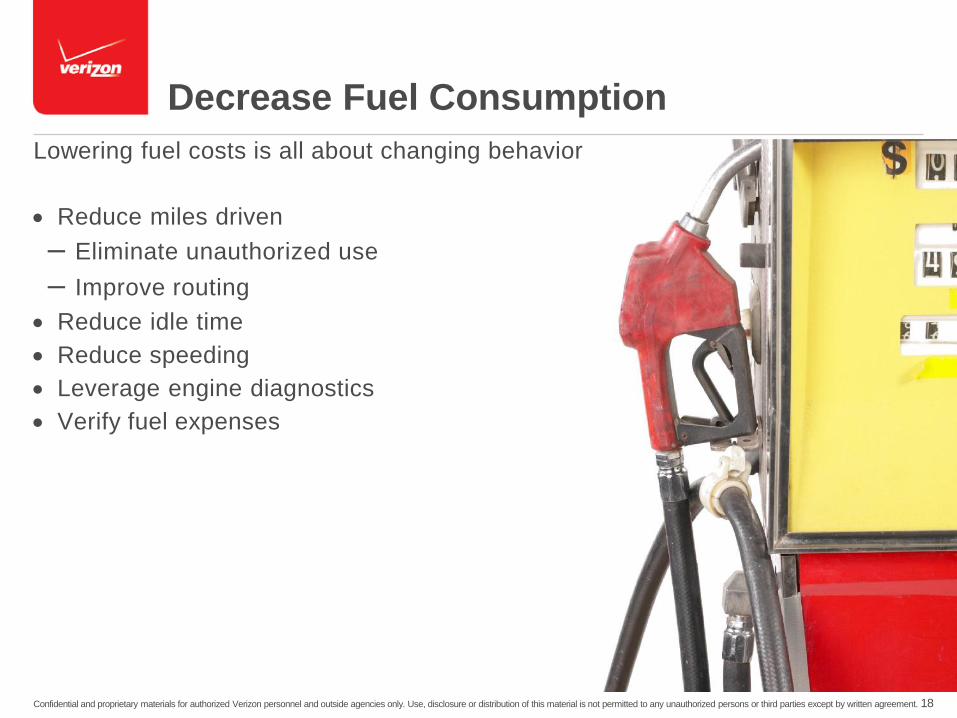
Decrease Fuel Consumption
Lowering fuel costs is all about changing behavior
Reduce miles driven
– Eliminate unauthorized use
– Improve routing
Reduce idle time
Reduce speeding
Leverage engine diagnostics
Verify fuel expenses
Confidential and proprietary materials for authorized Verizon personnel and outside agencies only. Use, disclosure or distribution of this material is not permitted to any unauthorized persons or third parties except by written agreement. 18
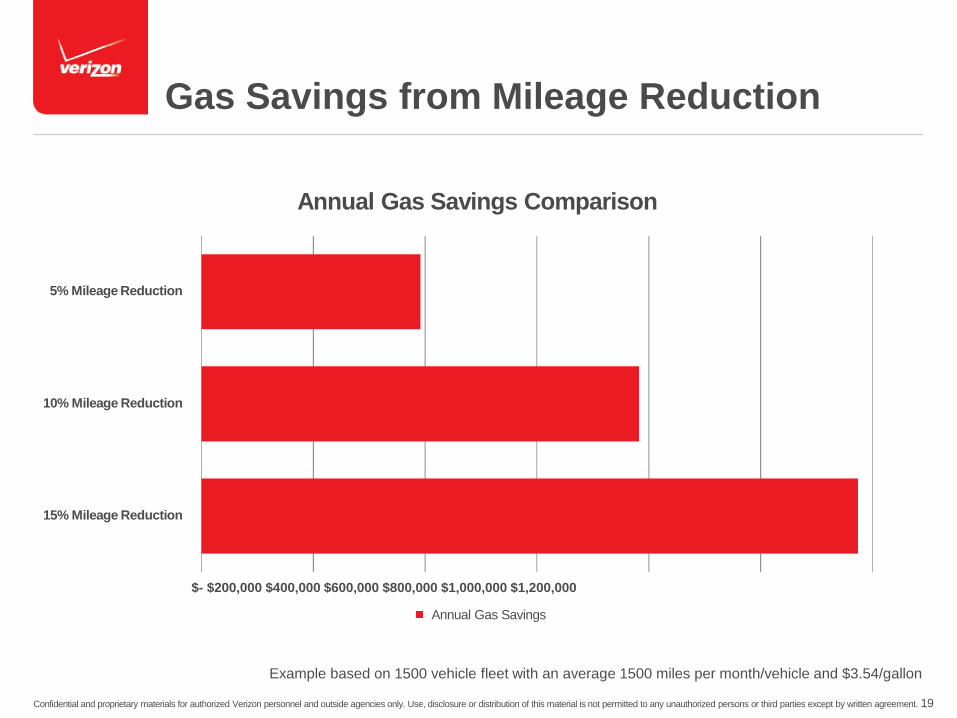
Gas Savings from Mileage Reduction
Annual Gas Savings Comparison
5% Mileage Reduction
10% Mileage Reduction
15% Mileage Reduction
$- $200,000 $400,000 $600,000 $800,000 $1,000,000 $1,200,000
Annual Gas Savings
Example based on 1500 vehicle fleet with an average 1500 miles per month/vehicle and $3.54/gallon
Confidential and proprietary materials for authorized Verizon personnel and outside agencies only. Use, disclosure or distribution of this material is not permitted to any unauthorized persons or third parties except by written agreement. 19
Confidential and proprietary materials for authorized Verizon personnel and outside agencies only. Use, disclosure or distribution of this material is not permitted to any unauthorized persons or third parties except by written agreement. 20
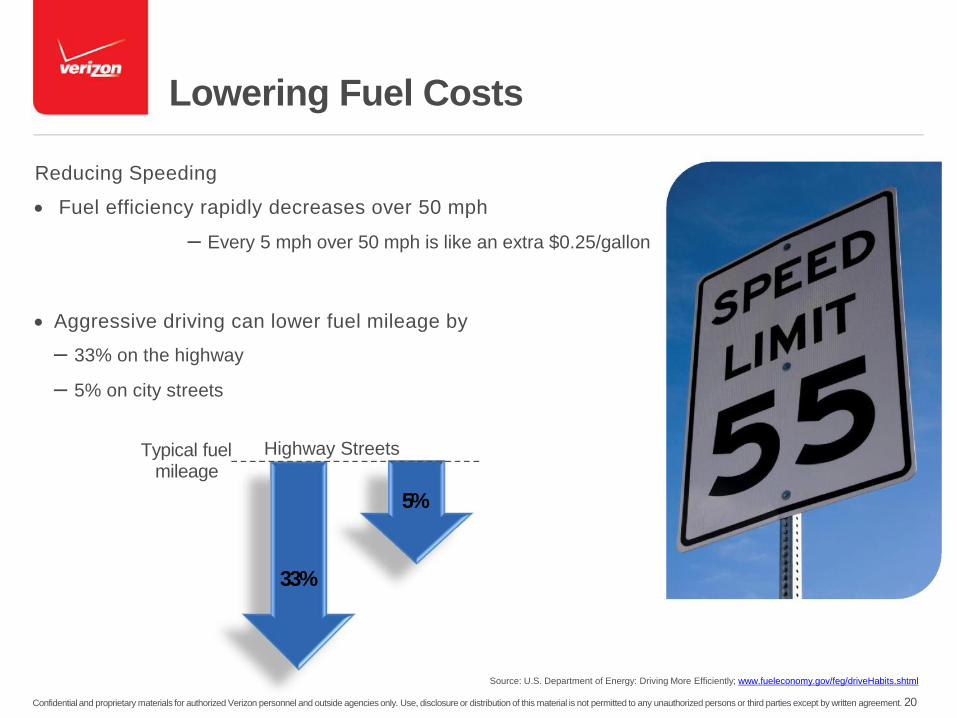
Lowering Fuel Costs
Reducing Speeding
Fuel efficiency rapidly decreases over 50 mph
– Every 5 mph over 50 mph is like an extra $0.25/gallon
Aggressive driving can lower fuel mileage by
– 33% on the highway
– 5% on city streets
Typical fuel mileage
5%
33%
Source: U.S. Department of Energy: Driving More Efficiently; www.fueleconomy.gov/feg/driveHabits.shtml
Highway Streets

Odd Hours Usage
May 1 - August 31
Driver 1
Driver 2
Driver 3
Driver 4
Driver 5
Driver 6
Driver 7
Driver 8
2% 2%
3%
11%
9%
31%
9%
33%
September 1 - December 1
+80%
+9%
-17%
+22%
-23%
9%
16%
9%
3% 3% 1%
28%
-53%
31%
-13%
-1%
% Percent
Odd Hours Violation Window Change
6 PM – 6 AM
Confidential and proprietary materials for authorized Verizon personnel and outside agencies only. Use, disclosure or distribution of this material is not permitted to any unauthorized persons or third parties except by written agreement. 21
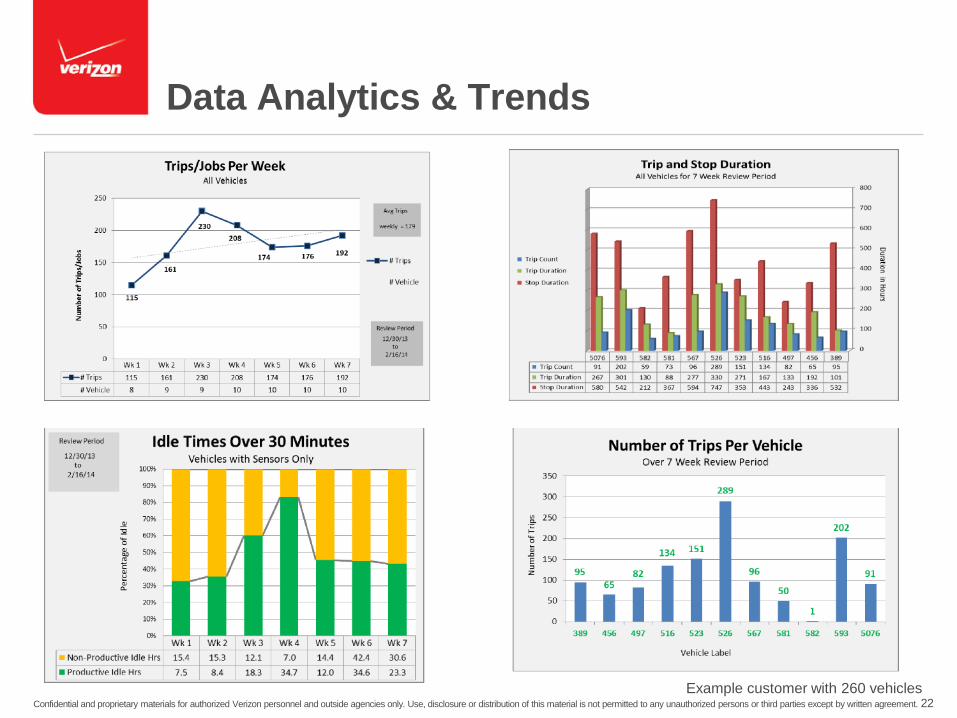
Data Analytics & Trends
Example customer with 260 vehicles Confidential and proprietary materials for authorized Verizon personnel and outside agencies only. Use, disclosure or distribution of this material is not permitted to any unauthorized persons or third parties except by written agreement. 22
SUSTAINABILITY
Confidential and proprietary materials for authorized Verizon personnel and outside agencies only. Use, disclosure or distribution of this material is not permitted to any unauthorized persons or third parties except by written agreement. 23
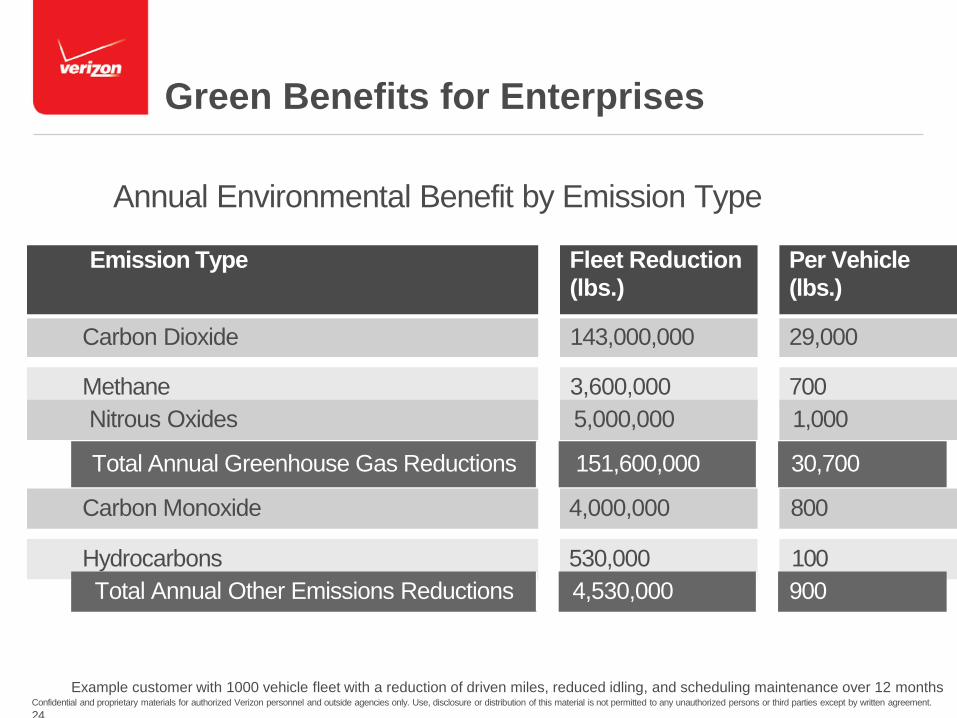
Green Benefits for Enterprises
Annual Environmental Benefit by Emission Type
Emission Type
Fleet Reduction (lbs.)
Per Vehicle (lbs.)
Carbon Dioxide
143,000,000
29,000
Methane
3,600,000
700
Nitrous Oxides
5,000,000
1,000
Total Annual Greenhouse Gas Reductions
151,600,000
30,700
Carbon Monoxide
4,000,000
800
Hydrocarbons
530,000
100
Total Annual Other Emissions Reductions
4,530,000
900
Example customer with 1000 vehicle fleet with a reduction of driven miles, reduced idling, and scheduling maintenance over 12 months Confidential and proprietary materials for authorized Verizon personnel and outside agencies only. Use, disclosure or distribution of this material is not permitted to any unauthorized persons or third parties except by written agreement.
24
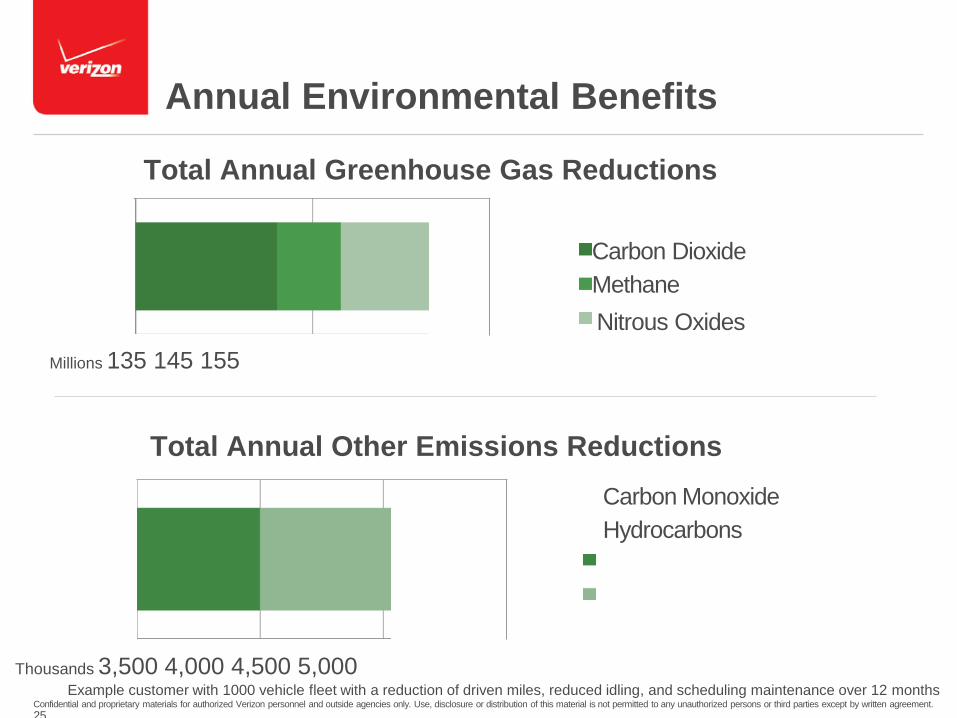
Annual Environmental Benefits
Total Annual Greenhouse Gas Reductions
Carbon Dioxide
Methane
Nitrous Oxides
Millions 135 145 155
Total Annual Other Emissions Reductions
Carbon Monoxide
Hydrocarbons
Thousands 3,500 4,000 4,500 5,000 Example customer with 1000 vehicle fleet with a reduction of driven miles, reduced idling, and scheduling maintenance over 12 months
Confidential and proprietary materials for authorized Verizon personnel and outside agencies only. Use, disclosure or distribution of this material is not permitted to any unauthorized persons or third parties except by written agreement.
25
Smog Check With the Fleet Smog Check Report you can view a snapshot of each
vehicle's most recent emissions status along with a Pass/Fail determination
based on selected compliance criteria. This report can also help determine
which vehicles have engine health issues and what those issues are. The
diagnostic capabilities of the device capture a host of monitor status values
for most light duty vehicles. The Fleet Smog Check Report uses this
diagnostic data to evaluate vehicle emissions.
Four options for smog check
Pass/Fail criteria are available.
Run Report
Choose a Report Type: Smog Check
Input Report Parameters:
Schedule Report
Group:
ALL VEHICLES Smog Failure Criteria:* MIL on
Vehicle Attribute: All Attributes
Submit
Report: Smog Check
Selected Vehicle(s): All Vehicles
Report Run Date/Time: 10/06/2010 10:26 AM PDT Number of Failing Vehicles: 1
Smog Check Failure Criteria: MIL on Number of Passing Vehicles: 9 Number of Vehicles Included in Report: 13 Number of Ineligible Vehicles: 3
Quickly determine which vehicles
are in or out of compliance
Page 1 / 1. Show 10 per page.
Year Make Fuel Active Fuel Oxygen Secondary Comprehensive ERG Evap. Heated AC Oxygen Smog Last
mi fi VIN Vehicle Label License , Sensor Check Smog
Model Type MIL D.rcs
Catalyst System aystem Sensor Air System —Le Component System System Catalyst System
Heater Pass/Fail Check
Gasoline KE93MDU76H4O993HE SERVICE 245 7JE7F87 2005 FORD L,asoene off comp comp comp comp comp comp nsup comp nsup nsup comp PASS 10/6/2010 F250
2007 S0DKEN73ND84JFGS8 SERVICE 248 KDYE94J CHEVROLET Gasoline off comp comp comp nsup comp comp comp comp nsup nsup comp PASS 10/5/2010
SILVERADO
2010 SDUEL83J349R759SD6 SERVICE 252 83JD634 CHEVROLET Gasoline off incomp comp comp nsup comp comp comp comp nsup nsup comp PASS 10/6/2010
SILVERADO
2008 5F8KH8884F8F6R4F93 SERVICE 255 98JDT65 CHEVROLET Gasoline off comp comp comp nsup comp comp nsup comp nsup nsup comp PASS 10/6/2010
SILVERADO
Gasoline D5868EDK87FG8R4D8 SERVICE 256 945ST32 2005 FORD t.asoene off INELIGIBLE 9/30/2010 F250
Gasoline H4T9R2G7T92RTE896 SERVICE 262 7S6YT43 2007 FORD t.asoene off INELIGIBLE 10/6/2010 F250
2007 8SDFH8SF6GH87S464 SERVICE 264 98H4GT3 CHEVROLET Gasoline off comp comp comp nsup comp comp nsup comp nsup nsup comp PASS 10/6/2010
SILVERADO
2007 SDFG984SD65F4G98S SERVICE 265 9DI76W3 CHEVROLET Gasoline on comp comp comp nsup comp comp nsup comp nsup nsup comp FAIL 10/5/2010
SILVERADO
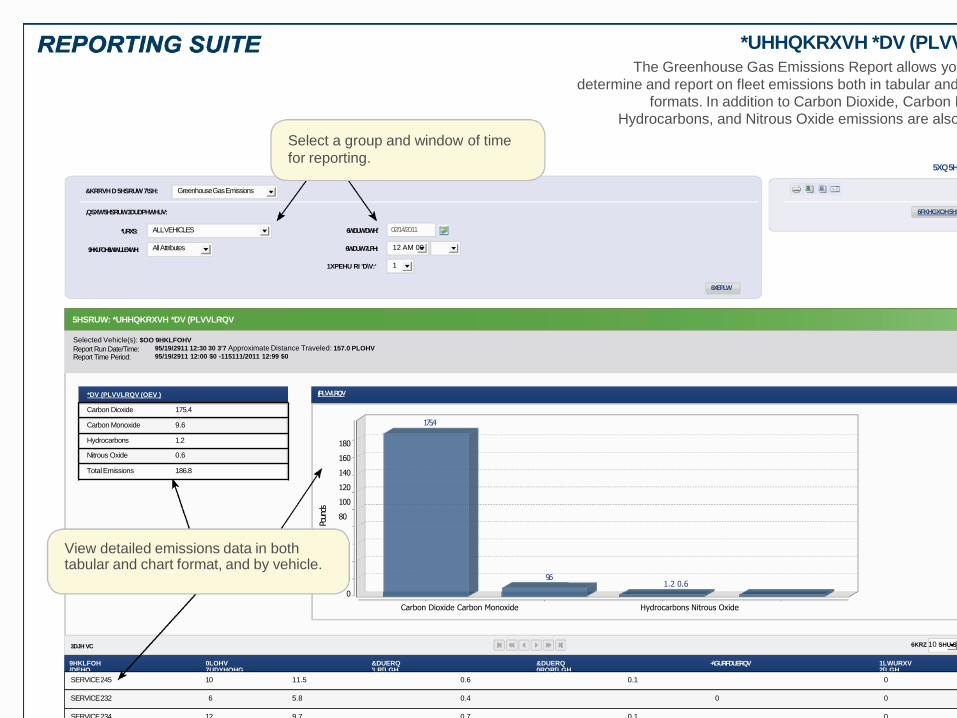
*UHHQKRXVH *DV (PLVVLRQV
The Greenhouse Gas Emissions Report allows you to easily
determine and report on fleet emissions both in tabular and graphical
formats. In addition to Carbon Dioxide, Carbon Monoxide, Hydrocarbons, and Nitrous Oxide emissions are also reported.
Select a group and window of time
for reporting. 5XQ 5HSRUW
Greenhouse Gas Emissions &KRRVH D 5HSRUW 7\SH:
,QSXW 5HSRUW 3DUDPHWHUV: 6FKHGXOH 5HSRUW
*URXS: 02/14/2011 ALL VEHICLES 6WDUW 'DWH:*
9HKLFOH $WWULEXWH: 12 AM 00 All Attributes 6WDUW 7LPH:.
1XPEHU RI 'D\V:• 1
6XEPLW
5HSRUW: *UHHQKRXVH *DV (PLVVLRQV
Selected Vehicle(s): $OO 9HKLFOHV
Report Run Date/Time: Report Time Period:
95/19/2911 12:30 30 3'7 Approximate Distance Traveled: 157.0 PLOHV
95/19/2911 12:00 $0 -115111/2011 12:99 $0
*DV (PLVVLRQV (OEV ) (PLVVLRQV
Carbon Dioxide 175.4
Carbon Monoxide 9.6
Hydrocarbons 1.2
Nitrous Oxide 0.6
Total Emissions 186.8
175.4
Poun
ds
180
160
140
120
100
80
View detailed emissions data in both tabular and chart format, and by vehicle.
9.6 1.2 0.6
0
Carbon Dioxide Carbon Monoxide Hydrocarbons Nitrous Oxide
3DJH VC 6KRZ 10 SHU SDJH.
9HKLFOH /DEHO
1LWURXV 2[LGH
&DUERQ 0RQR[LGH
&DUERQ 'LR[LGH
0LOHV 7UDYHOHG
+\GURFDUERQV
SERVICE 245 10 11.5 0.6 0.1 0
SERVICE 232 6 5.8 0.4 0 0
SERVICE 234 12 9.7 0.7 0.1 0
SERVICE 248 23 26.4 1.4 0.2 0.1
SERVICE 255 21 24.2 1.3 0.2 0.1
SERVICE 256 77 88.6 4.7 0.6 0.3
WATER AGENCY CASE STUDY Eastern Municipal Water District
Confidential and proprietary materials for authorized Verizon personnel and outside agencies only. Use, disclosure or distribution of this material is not permitted to any unauthorized persons or third parties except by written agreement. 26
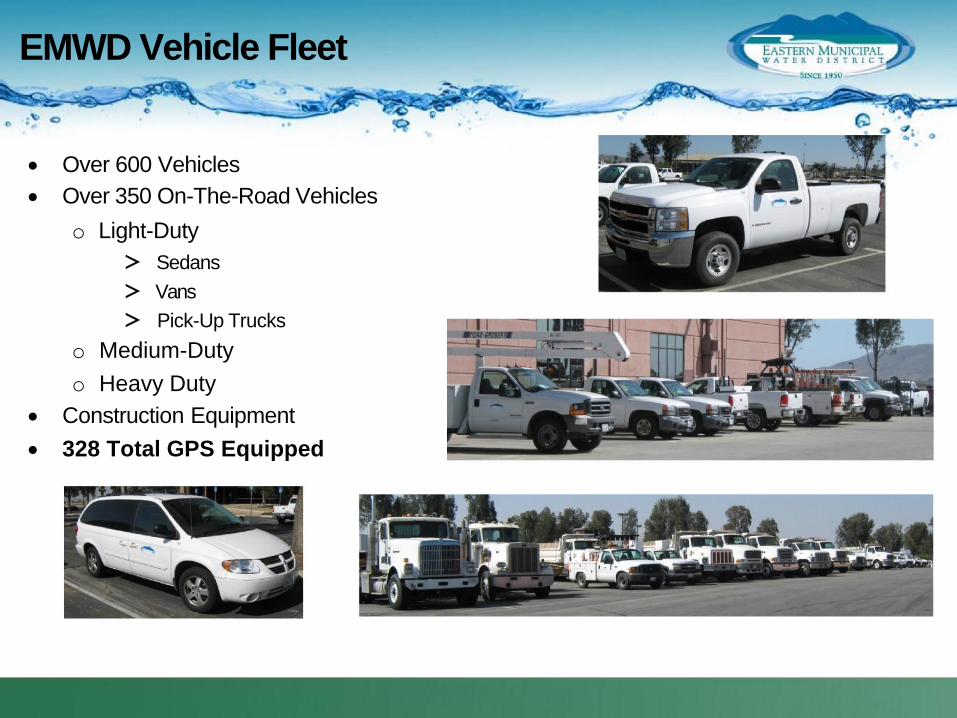
EMWD Vehicle Fleet
Over 600 Vehicles
Over 350 On-The-Road Vehicles
o Light-Duty
> Sedans
> Vans
> Pick-Up Trucks
o Medium-Duty
o Heavy Duty
Construction Equipment
328 Total GPS Equipped
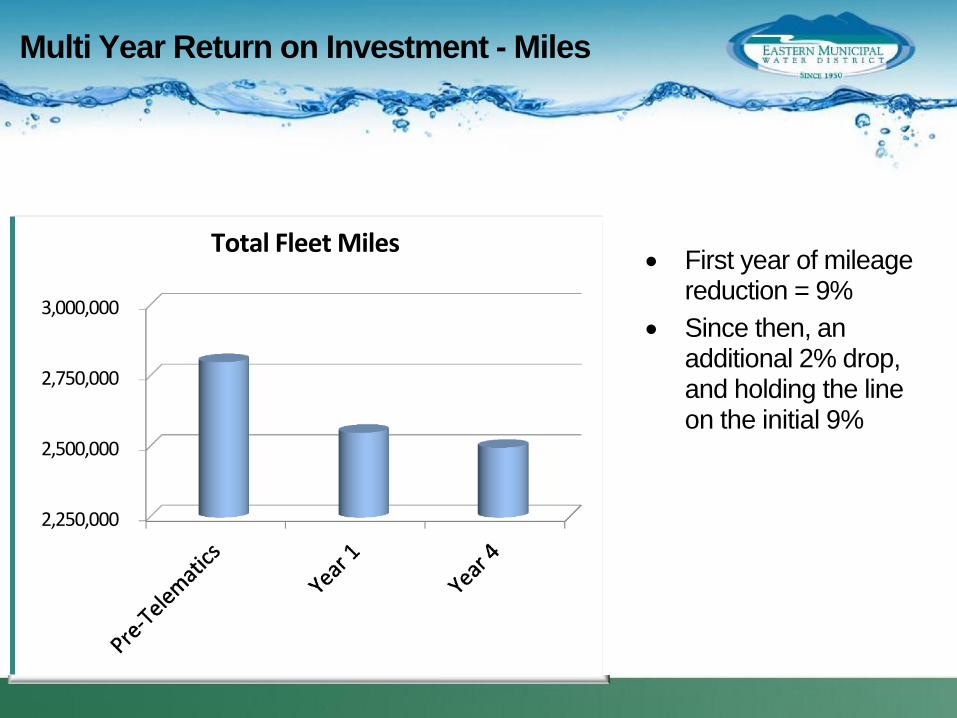
Multi Year Return on Investment - Miles
Total Fleet Miles
3,000,000
2,750,000
2,500,000
2,250,000
First year of mileage reduction = 9%
Since then, an additional 2% drop, and holding the line on the initial 9%

Multi Year Return on Investment - Fuel
Total Fuel (Gallons)
500,000
450,000
400,000
350,000
300,000
First year of fuel reduction = 14% Since then, an additional 3% drop, and holding the line on the initial 14%
Confidential and proprietary materials for authorized Verizon personnel and outside agencies only. Use, disclosure or distribution of this material is not permitted to any unauthorized persons or third parties except by written agreement.
29
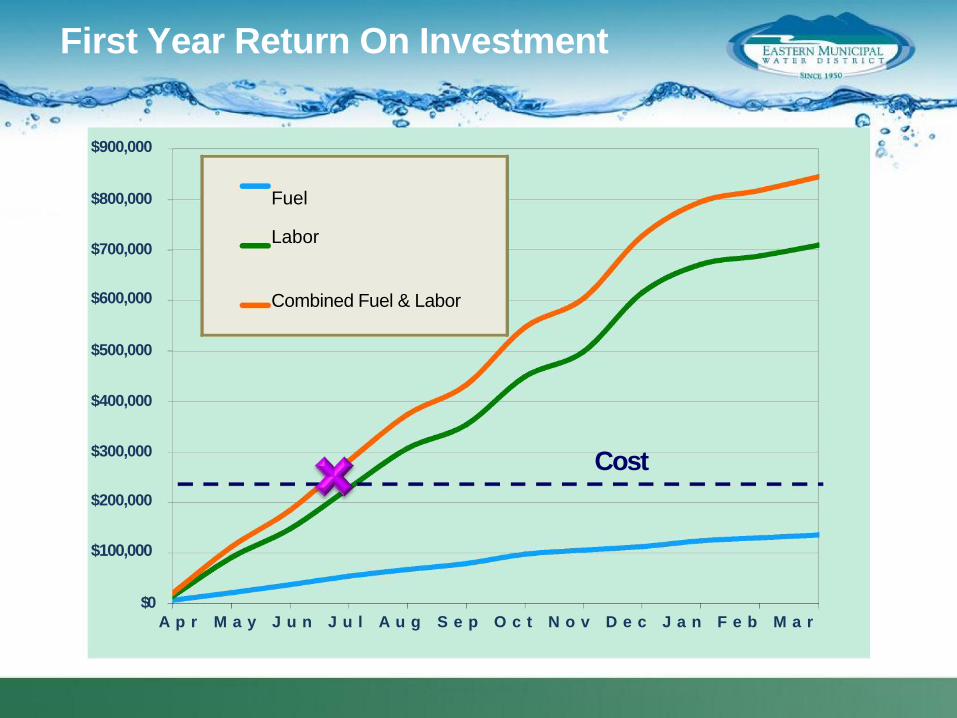
First Year Return On Investment
$900,000
$800,000
$700,000
$600,000
Fuel
Labor
Combined Fuel & Labor
$500,000
$400,000
$300,000 Cost
$200,000
$100,000
$0
A p r M a y J u n J u l A u g S e p O c t N o v D e c J a n F e b M a r

Fleet Optimization
Example customer with 260 vehicles Confidential and proprietary materials for authorized Verizon personnel and outside agencies only. Use, disclosure or distribution of this material is not permitted to any unauthorized persons or third parties except by written agreement.
31
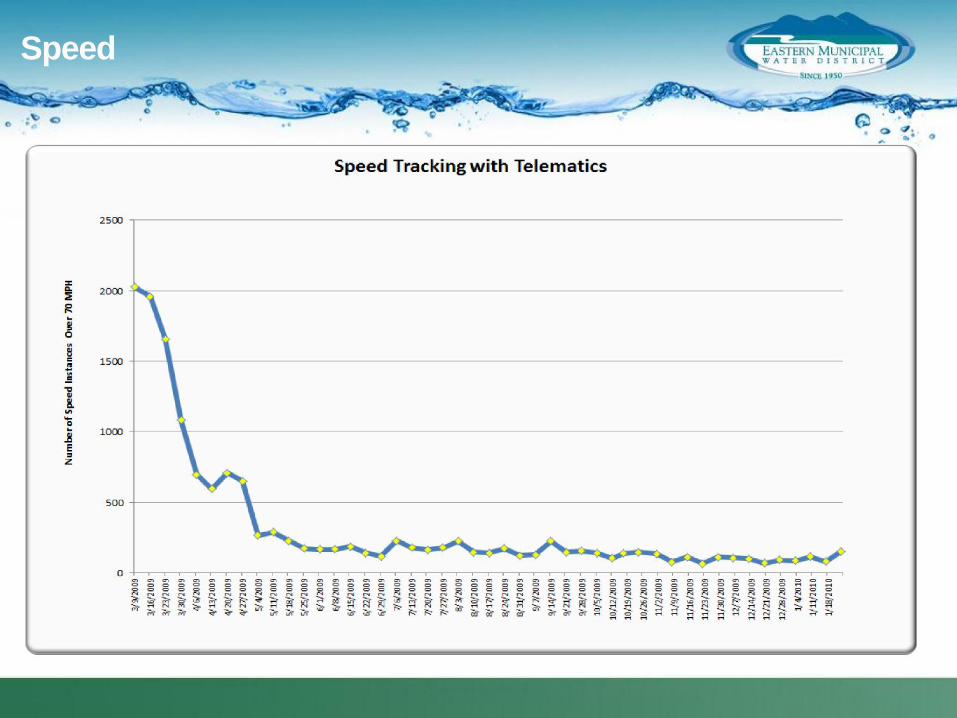
Speed
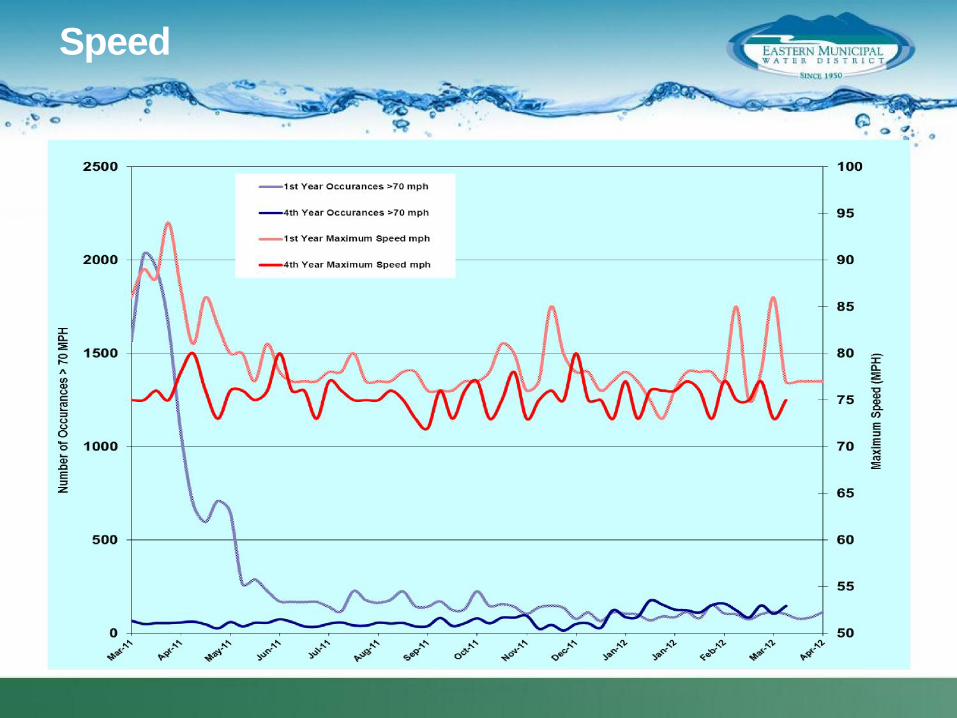
Speed
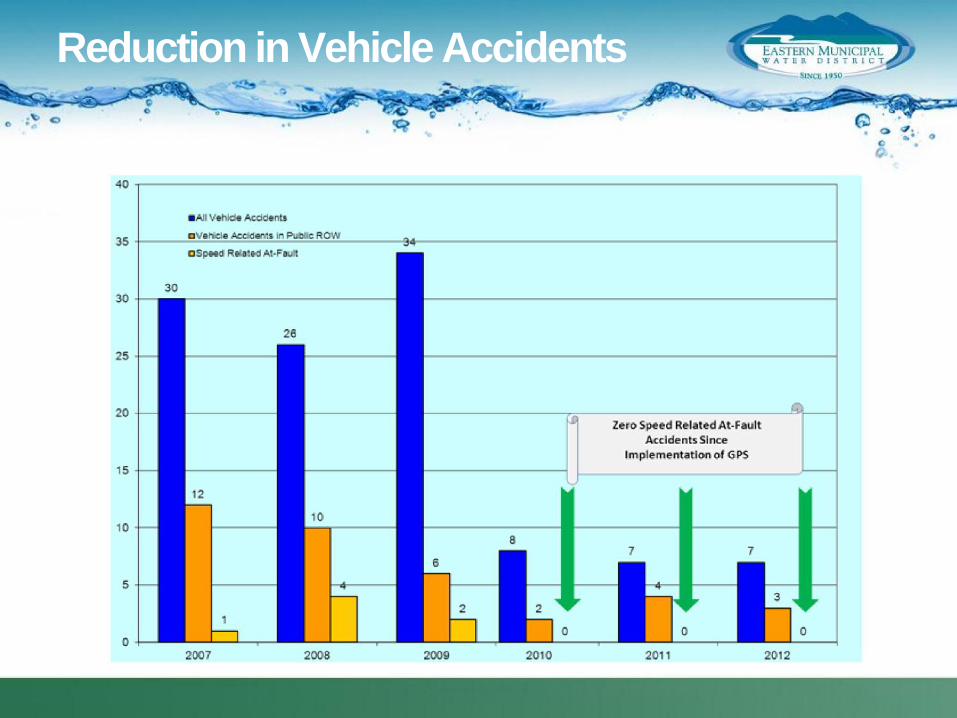
Reduction in Vehicle Accidents

Reduction in Liability
THANK YOU
Bob Topaz
Verizon Networkfleet
Confidential and proprietary materials for authorized Verizon personnel and outside agencies only. Use, disclosure or distribution of this material is not permitted to any unauthorized persons or third parties except by written agreement. 36