Dare to Commit - Welspun Annual Report - 2008-09.pdf · WELSPUN INDIA LIMITED ... 'Quick Dry...
116
Transcript of Dare to Commit - Welspun Annual Report - 2008-09.pdf · WELSPUN INDIA LIMITED ... 'Quick Dry...


Dare to Commit
WELSPUN City entrance, Anjar, Gujarat.

Vision Statement

Contents
05Corporate Information
06Chairman and Managing Director's Statement
10Directors' Report
20Corporate Governance Report
28Management Discussion and Analysis
44Financial Section
26Practicing Company Secretary’s Certificate
Forward looking statement
In this Annual Report we have disclosed forward-looking information to enable investors to comprehend our
prospects and take informed investment decisions. This report and other statements that set out anticipated
results based on the management's plans and assumptions. We have tried wherever possible to identify such
statements by using words as 'anticipate', 'estimate', 'expects', 'projects', 'intends', 'plans', 'believes', and words of
similar substance in connection with any discussion of future performance. We cannot guarantee that these
forward-looking statements will be realized, although we believe we have been prudent in assumptions. Should
known or unknown risks or uncertainties materialize, or should underlying assumptions prove inaccurate, actual
results could vary materially from those anticipated, estimated or projected. Readers should bear this in mind. We
undertake no obligation to publicity update any forward-looking statements, whether as a result of new information,
future events or otherwise.

4
WELSPUN INDIA LIMITEDAnnual Report 2008 -09
AWARD / RECOGNITION BESTOWED BY
5 Star Award Macy's Inc., USA2008
Supplier of the Year J.C. Penney, USA2008
Indian Exporters Excellence Awards
– Textile Sector
Dun & Bradstreet2008
Earth Care Awards
– (1st Runner Up - Greenhouse Gas Mitigation)
Times of India &
Jindal Steel Works.
2008
YEAR

5
CORPORATE INFORMATION
Board of Directors
Mr. B. K. Goenka
Chairman & Managing Director
Mr. Arun Todarwal
(Nominee – Dunearn Investments (Mauritius) Pte. Ltd.)
Mr. Dadi B. Engineer
(Director)
Mr. Ram Gopal Sharma
(Additional Director)
Mr. A. K. Dasgupta
(Director)
Mr. R. R. Mandawewala
(Joint Managing Director)
Mrs. Revathy Ashok
(Director)
Mr. M. L. Mittal
(Executive Director – Finance)
Company Secretary
Mr. D. K. Patil
Auditors
Price Waterhouse & Co.
Audit Committee
Mr. Dadi B. Engineer
Mr. A. K. Dasgupta
Mr. Arun T odarwal
Mr. Ram Gopal Sharma
Remuneration Committee Share Transfer and Investor Grievance Committee
Mr. A. K. Dasgupta Mr. A. K. Dasgupta
Mr. Dadi B. Engineer Mr. B. K. Goenka
Mr. Arun Todarwal Mr. R. R. Mandawewala
Mr. M. L. Mittal
Registered Office and Works Bankers:
Welspun City, Tal. Anjar, State Bank of Bikaner & Jaipur
Dist. Kutch, State Bank of India
Gujarat – 370 110, INDIA Punjab National Bank
Tel: (02836) 661111, Fax: (02836) 279010 Andhra Bank
Canara Bank
Works: Exim Bank Ltd.
Survey No. 76, Village Morai, Bank of India
Vapi, Dist. Valsad, State Bank of Patiala
Gujarat – 396 191, INDIA Bank of Baroda
Tel: (0260) 2437437, Fax: (0260) 2437088, Oriental Bank of Commerce
Email: [email protected] IDBI Bank
Corporate Office Stock Exchanges where the Company’s securities are
listed
Welspun House, 6th
Floor, Bombay Stock Exchange Ltd.
Kamala City, Phiroze Jeejeebhoy Towers, Dalal Street,
Senapati Bapat Marg, Lower Parel, Mumbai – 400 051
Mumbai - 400 013, INDIA
Tel: 022-66136000/ 2490 8000 The National Stock Exchange of India
Fax: 022-24908020 Exchange Plaza, Bandra Kurla Complex,
Website: http://www.welspuntowels.com Bandra (E), Mumbai – 400 051

My dear fellow stakeholders,
I always enjoy this forum as it gives me an opportunity to take a
step back, retrospect on the year that went by, introspect on
our achievements and short comings and evaluate prospects
for the year ahead.
This has been a very eventful year for the World economy -
from surge in commodity prices including cotton, energy cost
etc. in the first half, to a complete U-Turn reversal in the second
half, where Financial Institutes across the world were jolted
creating the lowest confidence index since the depression days
of 1920-30's. I strongly believe in the Chinese word for 'Crisis'
i.e. 'Weiji'. 'Wei' means 'danger' while 'ji' means 'Opportunity',
which is incidentally the central focus of Welspun.
We took multiple steps this year to create long-term
sustainable values for our stakeholders. To begin with, the
Board of Directors decided to demerge its non-core
investments and its marketing and distribution network into 2
separate entities Welspun Investments Ltd and Welspun
Global Brands Ltd respectively. This process has created a clear
focus on each element of our business. Both companies,
particularly Welspun Global Brands Ltd. is going to be our torch
bearer in the International arena encompassing all brands,
distribution, marketing, customer relationship and
international operations. I strongly believe that this Company
has the potential of becoming one of the most sort-out Global
Message from Chairman and Managing Director
6
WELSPUN INDIA LIMITEDAnnual Report 2008 -09

brand companies and a force to reckon with in the home textiles segment.
The extension of a world-renowned brand license for fashion bedding, fashion bath in addition to earlier license of
towels and bed sheets is another example of how Welspun can enhance its brand personality by offering 360
degree product range within the home textile segment. Our initiative of setting up a factory in Mexico for the
decorative bedding segment has played a key role in creating such enviable market position in the entire North
American territory for the foresaid products.
Today, Welspun is truly a global brand Company with balanced portfolio and product offerings within Christy,
Sorema, Gracciozza, Amy Butler amongst other well sort-after brands. We also take pride in bringing consumer
research driven innovations within our product offerings. Supported by our state-of-art manufacturing facilities
and multi-location design studios, we offer comprehensive solutions to retailers all over the World to satisfy the
complete range of consumer requirements. 'Quick Dry Towels' and 'The Perfect Sheet' are ideal examples of how
innovation can enhance functionality in our product offerings.
In line with our strategy to offer more inter-related products within the home textile segment, our factory at Vapi,
Gujarat, India successfully commissioned its maiden bath rug manufacturing. This facility is perhaps one of the
best in the world utilizing latest technology in plant and machinery.
Friends, softening of commodity prices and energy costs, coupled with rupee depreciation against global
currencies, particularly the US Dollar, have enabled your company to remain competitive even in this macro
environment. Our focus have facilitated our production lines to be operating at optimal capacity levels thereby
retaining jobs in an environment where job losses have become synonymous within the textile industry. To widen
7

our Global footprints, we have expanded by opening new facilities at multiple locations, notably offices in San
Francisco to cater to our client base in the West-coast of U.S.
With our focus on cost optimization and our aim to be one of the largest producers of Home Textiles globally, we
can consolidate our status of being the preferred partner with almost all top retailers of the World. We also plan to
reach new markets particularly Mexico, Japan, Russia and China in our quest to be a truly Global Home Textile
Company. We have to live up to the true Chinese meaning of 'Crisis'.
The past one year 'Parivartan' (meaning 'change' in Hindi), a project undertaken with HAY Group, (World's leading
Human Resource consultant) have re-defined roles and responsibilities within our organization, thereby
increasing efficacy and efficiency within all our employees. I dedicate this space to the hard work of each and every
Welspunite who stood like rocks in testing times and now ready to transcend with the opportunities ahead.
Last but not the least, sustainability has remained a prime focus for Welspun thereby enabling improvements in
areas like energy efficiency, waste recycling, waste reduction and usage of eco-friendly material. Recognizing our
efforts, Macy's one of the most premium departmental chain in the U.S., bestowed their most prestigious 5 Star
Award to Welspun. We dedicate this Global recognition towards the trust bestowed by our stakeholders.
Finally I would like to put on record, my sincere appreciation to financial institutions, banks, equity partners,
Governmental authorities and each Welspunite for their unflinching support. I believe, we have all ingredients for
being one of the largest and best home textile companies and for that I solicit your continued support.
Yours sincerely
B. K. Goenka
Chairman & Managing Director
8
WELSPUN INDIA LIMITEDAnnual Report 2008 -09

TERRY TOWELS
Capacity
Facilities
– 45000 tons
– Anjar, Gujarat, India– Vapi, Gujarat, India

10
WELSPUN INDIA LIMITEDAnnual Report 2008 -09
DIRECTORS' REPORT
To,
The Members,
WELSPUN INDIA LIMITED
Your directors have pleasure in presenting their 24th Annual Report on the Audited Financial Statement of the Company for the
financial year ended 31st March, 2009.
I. FINANCIAL HIGHLIGHTS
Despite severe recession in the Company's major market geographies, your Company's Turnover increased by 8.34% y-o-y.
Reduction in overall volume of Sales and adverse impact of foreign currency fluctuation arrested the growth in sales and
reduced Profit Before Tax. To counter the impact of recession on the business, your company undertook severe cost curbing
exercise which not only mitigated to a great extent the impact but also sharpened the competitive edge to exploit business
opportunities going forward. Improved quality fetched better unit value realization in both towel as well as bed linen.
II. AWARDS
Your Company has been in recognition by spectrum of relations in textile arena and the following accolades add to the list of
awards and honours received over the years:
'5 Star Award' by Macy's Inc., USA
Four 'Gold Awards' by Cotton Textile Promotion Council of India
III. QUALITY AND RESEARCH & DEVELOPMENT
Your Company continues to emphasize qualitative growth and believes that quality of its product has to be its strength in
this complex market environment. Your Company is committed to bringing about positive change in each and every process
and has a team fully focused on Research & Development. Particulars of activities relating thereto have been given in
Annexure I hereto.
IV. DIRECTORS
During the year, Mr. Gopi Ram Goenka, Chairman of the Company and 'Babuji' of the Welspun family passed away for
heavenly abode on December 28, 2008. Your directors pay homage to the departed soul and pray the almighty to give
courage to the bereaved family to withstand the colossal loss.
During the period under report, Mr. Ram Gopal Sharma has been appointed as an additional director of your Company
pursuant to section 260 of the Companies Act, 1956. Your Directors welcome him on the Board. Pursuant to section 257 of
the Companies Act, 1956, he is proposed to be appointed as a director, liable to retire by rotation, at the ensuing Annual
General Meeting.
�
�
ParticularsCurrent year
31.03.2009
% age to Total
Income
Previous year
31.03.2008
% age to
Total Income
Turnover 13,444.40 98.74 12,409.44 98.05
Other Income 171.6 1.26 246.66 1.95
Total Income 13,616.00 100.00 12,656.10 100.00
Profit before Interest, Depreciation and Tax (PBIDT) 2,138.79 15.71 1935.04 15.29
PROFIT BEFORE TAX (PBT) 257.37 1.89 414.52 3.28
Less: Provision for taxation -51.66 -0.38 151.86 1.20
PROFIT / (LOSS) AFTER TAX (PAT) 309.03 2.27 262.66 2.08
Add: Balance brought forward from the previous Year 1,692.62 - 1,430.29 -
Profit available for appropriation 2,001.65 - 1,692.95 -
Less : Transfer to Capital Redemption Reserve - 30.00 -
Add: Transfer from Debenture Redemption Reserve - 29.67 -
Balance carried to Next Year 2,001.65 1692.62 -
Earnings Per share (EPS) (Basic & Diluted) (Rs.) 4.23 3.59 -
(Rs. in million)

11
In the ensuing Annual General Meeting, Mr. Rajesh R. Mandawewala and Mr. A. K. Dasgupta will be retiring by rotation and
being eligible have offered themselves to be reappointed. Mr. Rajesh R. Mandawewala is a Joint Managing Director
whereas Mr. A. K. Dasgupta is an independent director. Further, details about these directors are given in the Notice of the
ensuing Annual General Meeting being sent to the shareholders along with Annual Report. The Board recommends their
reappointment.
V. ENERGY, TECHNOLOGY AND FOREIGN EXCHANGE
Information in accordance with the provisions of Section 217 (1) (e) of the Companies Act, 1956, read with Companies
(Disclosure of Particulars in the Report of Board of Directors) Rules, 1988, regarding conservation of energy, technology
absorption and foreign exchange earnings and outgo is given in the Annexure I forming part of this report.
VI. SUBSIDIARY COMPANIES:
Ministry of Corporate Affairs, Government of India has exempted the Company from attaching the Annual Reports and
other particulars of its subsidiary companies along with the Annual Report of the company required u/s. 212 of the
Companies Act, 1956. Therefore, the said Reports of the subsidiary companies viz. (1) Welspun USA Inc., USA (2) Welspun
Holdings Private Limited, Cyprus (3) Welspun Home Textiles UK Limited, UK (4) CHT Holdings Limited, UK (5) Christy Home
Textiles Limited, UK (6) Welspun UK Limited (Formerly Christy UK Limited), UK (7) E R Kingsley (Textiles) Limited, UK (8)
Christy 2004 Limited, UK (9) Christy UK Limited (Formerly Flyspark Limited), UK (10) Christy Europe GmbH, (11) Welspun
AG, Switzerland (12) Welspun Mexico SA de CV, Mexico (13) SOREMA - Tapetes E Cortinas DE Banho, S.A., (14) Welspun
Global Brands Limited, India, (15) Welspun Investments Limited, India, (16) Besa Developers and Infrastructure Private
Limited, India, (17) Sorema Welspun Distribution and Logistics, Portugal, (18) Sorema Welspun España, Spain and (19)
Sorema Welspun Benelux, Holland are not attached herewith. However, a statement giving certain information as required
by the Ministry is placed along with the Consolidated Accounts.
The Company shall provide a copy of Annual Report and other documents of its subsidiary companies as required u/s. 212
of the Companies Act to the shareholders upon their request, free of cost.
VII. FIXED DEPOSIT
During the year under review, your Company has not accepted any fixed deposit within the meaning of Section 58-A of the
Companies Act, 1956 and the Rules made thereunder.
VIII. EMPLOYEE STOCK OPTION SCHEME:
The particulars required to be disclosed pursuant to Clause 12 of SEBI (Employee Stock Option Scheme and Employee Stock
Purchase Scheme) Guidelines, 1999 are as under:
During the year 2008 09, no new stock options were granted. Your Company had granted 20,58,000 stock options on 17th
May, 2006 (each option carrying entitlement for one equity share of the face value of Rs.10/- each) to a whole-time director
and employees including an employee of a subsidiary company at an exercise price of Rs. 110.80 per share i.e. the latest
closing market price of the company's equity share at the time of grant. The stock option can be exercised during a period of
3 years from the date of vesting. Till 31st March, 2009, 40% of the outstanding options i.e. 516,000 were vested. The dates
of vesting of remaining options are 17.05.09 (30%) and 17.05.10 (30%).
The Company has adopted intrinsic value method for the valuation and accounting of the aforesaid stock options as per
SEBI guidelines. Since the grants were made at an exercise price equal to the closing market price at the time of grant, no
amount was required to be accounted as employee compensation cost. The fair value of the options as per the “Black
Scholes” model comes to Rs. 63.39 per option. Had the company valued and accounted the aforesaid options as per the
“Black Scholes” model, the net profit for the year would have been lower by Rs.14.36 mn and the Basic and Diluted earning
per share (with face value of Rs. 10/- each) would have been Rs. 4.03 instead of Rs.4.23per share.
The “Black Scholes” model captures all the variables with their respective appropriateness which influences the fair value of

stock options. The significant assumptions to estimate the fair value of options as per “Black Scholes” model are :
1. Risk-free interest rate : 7.06%
2. Expected life of the option : 4.2 years
3. Expected volatility : 63.71%
4. Expected dividend yield : 0.00%
Mr. M. L. Mittal, Executive Director (Finance), being a senior management personnel has been granted 90,000 stock
options.
The other employees have been granted 12,00,000 options. The details of options granted to other employees are:
Total number of employees : 38
Max. number of options granted : 12,00,000
Avg. number of options granted : 31,579
The particulars with regard to the stock options as on 31st March, 2009 as required to be disclosed under the SEBI's guidelines
are as follows:
Cumulative position as on 31st March, 2009
As required by the provisions of Section 217(2A) of the Companies Act, 1956 read with the Companies (Particulars of
Employees) Rules, 1975 as amended, the names and other particulars of the employees are set out in the Annexure to the
Directors' Report. However, as per the provisions of Section 219(1)(b)(iv) of the Companies Act, 1956, the Report and Accounts
is being sent to all the shareholders of the Company excluding the aforesaid information. Any shareholder interested in
obtaining such particulars may write to the Company Secretary at the Registered Office of the Company.
Cumulative disclosure
12
WELSPUN INDIA LIMITEDAnnual Report 2008 -09
Nature of disclosure Particulars
a. Options granted 20,58,000
b. The pricing formula
The exercise price is Rs. 110.80 per equity share
i.e. the latest available closing market price of
share prior to the date of grant i.e. 17th
May,
2006.
c. Options vested 516,000
d. Options exercised NIL
e.The total number of shares arising as a result of exercise of
Options.
Total number of shares arising as a result of
exercise of options shall be 12,90,000 of Rs.
10/- each.
f. Options lapsed /surrendered 7,68,000
g. Variation of terms of Option ----
h. Money realized by exercise of Options NIL
i. Total number of Options in force 12,90,000
No. of Options
granted
No. of Options exercised
(a) Details of options granted to / exercised by the Whole -
time Directors
1. Mr. M.L. Mittal 90,000 NILj.
(b) Any other employee who received a grant in any one
year of option amounting to 5% or more of options
granted during that year.
NIL NIL
k.
Employees who were granted options, during any one
year, equal to or exceedi ng 1% of the issued capital of the
company at the time of grant
NIL
l.Diluted Earnings Per Share (EPS) of Option calculated in
accordance with Accounting Standard AS-20.Rs. 4.23
m.Weighted average exercise price of options
Weighted average fair valu e of options.
NIL
Rs.63.39

13
IX. DIRECTORS' RESPONSIBILITY STATEMENT
Pursuant to the requirement under section 217(2AA) of the Companies Act, 1956, with respect to Directors' Responsibility
Statement, it is hereby confirmed:
(i) That in the preparation of the accounts for the financial year ended 31st March, 2009, the applicable accounting
standards have been followed alongwith proper explanation relating to material departures;
(ii) That the Directors have selected such accounting policies and applied them consistently and made judgements and
estimates that were reasonable and prudent so as to give a true and fair view of the state of affairs of the Company at
the end of the financial year and of the profit or loss of the Company for the year under review;
(iii) That the Directors have taken proper and sufficient care for the maintenance of adequate accounting records in
accordance with the provisions of the Companies Act, 1956, for safeguarding the assets of the Company and for
preventing and detecting fraud and other irregularities;
(iv) That the Directors have prepared the accounts for the financial year ended 31st March, 2009 on a 'going concern' basis.
X. CORPORATE GOVERNANCE
Your Company believes that Corporate Governance is a voluntary code of self-discipline. Your Company continuously
endeavors to follow healthy Corporate Governance practices to nurture interest of all stakeholders in the Company.
A separate report on Corporate Governance is annexed hereto as a part of this report. A certificate from a practicing
company secretary regarding compliance of conditions of Corporate Governance as prescribed under Clause 49 of the
Listing Agreement is attached to this report. Management Discussion and Analysis Report is separately given in the Annual
Report.
XI. ACKNOWLEDGEMENT
Your directors express deep sense of appreciation for the assistance and co-operation received from the Financial
Institutions, Banks, Government Authorities, creditors and Shareholders and for the devoted services rendered, by the
Executives, Staff and Workers of the Company.
For and on behalf of the Board
Mumbai B.K. GOENKA R. R. MANDAWEWALA
July 30, 2009 Chairman & Managing Director Joint Managing Director

Form A (See Rule 2)
FORM FOR DISCLOSURE OF PARTICULARS WITH RESPECT TO CONSERVATION OF ENERGY
14
WELSPUN INDIA LIMITEDAnnual Report 2008 -09
2008-09 2007-08
A. POWER AND FUEL CONSUMPTION
ELECTRICITY
PURCHASED
KWH Units (in '000s) 1,873.97 1,340.82
Total Amount (Rs in Lac) 110.36 68.00
(A)
Rate/Unit (Rs) 5.89 5.07
OWN GENERATION UNIT
Through Diesel Generator (Furnace Oil)
KWH Units (in '000s) 149,733 111,918.97
Unit per Ltr of Furnace Oil 4.25 4.24
Furnace Oil Consumption (Rs. in Lacs) 6,863.21 4,685.78
Cost / KWH Unit (Rs.) 4.58 4.19
(I)
Through Diesel Generator (Diesel Oil)
KWH Units (in '000s) 35.88 37.00
Unit per Ltr of Diesel Oil 3.90 3.81
Diesel Consumption (Rs. in Lacs) 3.19 3.90
Cost / KWH Unit (Rs.) 8.90 10.55
(II)
Through Gas Turbine / Generator
KWH Units (in '000s) 75,727 80,116.47
Giga Calorie Consumption 195,824 199,286.93
KWH per Giga Calorie of Natural Gas 386.71 402.02
Gas Cost (Rs. in Lacs) 2,997.49 2,202.78
(B)
(III)
Cost / KWH Unit (Rs.) 3.96 2.75
1
2 COAL - -
FURNACE OIL & HSD
(i) Furnace Oil
Quantity ( K.Ltrs) 36,282 27,339.41
Total Amount ( Rs. in Lac) 7,263.45 4,685.78
Cost/ Unit of Furnace Oil (Rs.) 20.02 17.14
(ii) Diesel Oil
Quantity (K.Ltrs) 9.20 9.70
Total Amount (Rs. in Lac 3.19 3.90
Cost / Unit of Diesel Oil (Rs.) 34.71 40.24
3
NATURAL GAS
Quantity (Giga Calorie) 195,824.00 199,286.93
Total Amount (Rs. in Lac) 2,997.49 2,202.78
Cost / Giga Calorie of Natural Gas (Rs.) 1,530.71 1,094.42
4
OTHERS/INTERNAL GENERATION - -5
B. CONSUMPTION PER UNIT OF PRODUCTION
PRODUCTS STANDARD CURRENT YEAR
PREVIOUS
YEAR
Cotton Yarn & Te rry Towels and Bed Sheet Mt 68,791 66,743
Electricity Kwh 3.67 2.90
Furnace Oil Ltr 0.58 0.41
Coal - - -
Others - - -

15
FORM B (See Rule 2)
FORM FOR DISCLOSURE OF PARTICULARS WITH RESPECT TO ABSORPTION.
RESEARCH AND DEVELOPMENT (R&D)
Technology absorption, adaptation and innovation
01 Specific areas in which R&D is carried
out by the Company
: 1) Use of wool fibers in place of PVA fibers for manufacture of Hygro yarns. This not
only has replaced the non bio degradable PVA, but also has brought down the cost
by as much as Rs 20/- per kg of Towel .
2) Spider Embroidery frame was introduced in place of normal embroidery frame. This
has resulted in 70% improvement in production in embroidery as a result of
reduced idle time.
3) Introduced twin needle length hemming machines for catering to institutional
towels, where unraveling of threads is prevented during industrial washes because
of double row stitching.
4) Bleach safe towel was introduced by incorporating cert ain chemicals during
processing, thus making the towel bleach resistant i.e. the color does not fade or
bleed even if bleach is used during domestic washing.
5) The liquor to material ratio has been reduced from 1:10 to 1:7 there by saving 30%
water consumption, which has reduced ETP load.
6) In rugs division new products in wool carpet, Dryn nylon rugs, Hygro rugs , Shaggy
rugs and artificial rugs are introduced.
02 Benefits derived as a result of the
above R&D.
1. Wool hygro towels have proved to be new kind of hygro towel which has been
accepted well in the market. Further it has resulted in addition to of a saving in cost
per kg of towel to an extant of Rs 20/-.
2. Bleach safe towels has been put into the market and is expected to be received
well.
3. In rugs division new products in wool carpet, Dry nylon rugs, Hygro rugs, Shaggy
rugs and artificial rugs are introduced; the samples have been appreciated in the
market place.
03 Future plan of action 1. Further innovation in bleach safe towel to eliminate any possible failure in the long
run.
2. Trial with natural dyes is to be made successful as the organ ic product with natural
dyes will attract more buyers .
3. Use of cationic dyes as a method of creating design on towels.
04 Expenditure on R&D
(a) Capital
(b) Recurring(PVA replacement)
(c) Total
(d) Total R&D expenditure as a
percentage of total turnovers.
Rs. 4.45 Lac
NIL
Rs. 4.45 Lac
-
01 Efforts, in brief, made towards
technology absorption, adaptation,
and innovation.
1. Three Numbers of MCS Machines of 1200 kg batch dyeing machines have been
installed, enhancing the dyeing capacity by 10 Tons per day toweling production.
2. In rugs plant Juki bar tracker, Pegasus covering and overlock, Jumbo rewinding,
Open packet dyeing, Tumble dryer, Cut pile tufting and loop tufting and auto bulk
dispensing and dosing system and Gerber comp cam machines have been installed.
02 Benefits derived as a result of the
above efforts, etc. Product
improvement, cost reduction,
product development, import
substitution, etc.
Over all toweling production increased 10 Tons per da y in towel dyeing and in rugs
plant. The new technology has adaptability for producing wool based carpets, Dry Nylon
rugs, Hygro rugs, Shaggy rugs and artificial rugs and yarn dyed rugs.
FORM B (See Rule 2)
FORM FOR DISCLOSURE OF PARTICULARS WITH RESPECT TO ABSORPTION.
16
WELSPUN INDIA LIMITEDAnnual Report 2008 -09
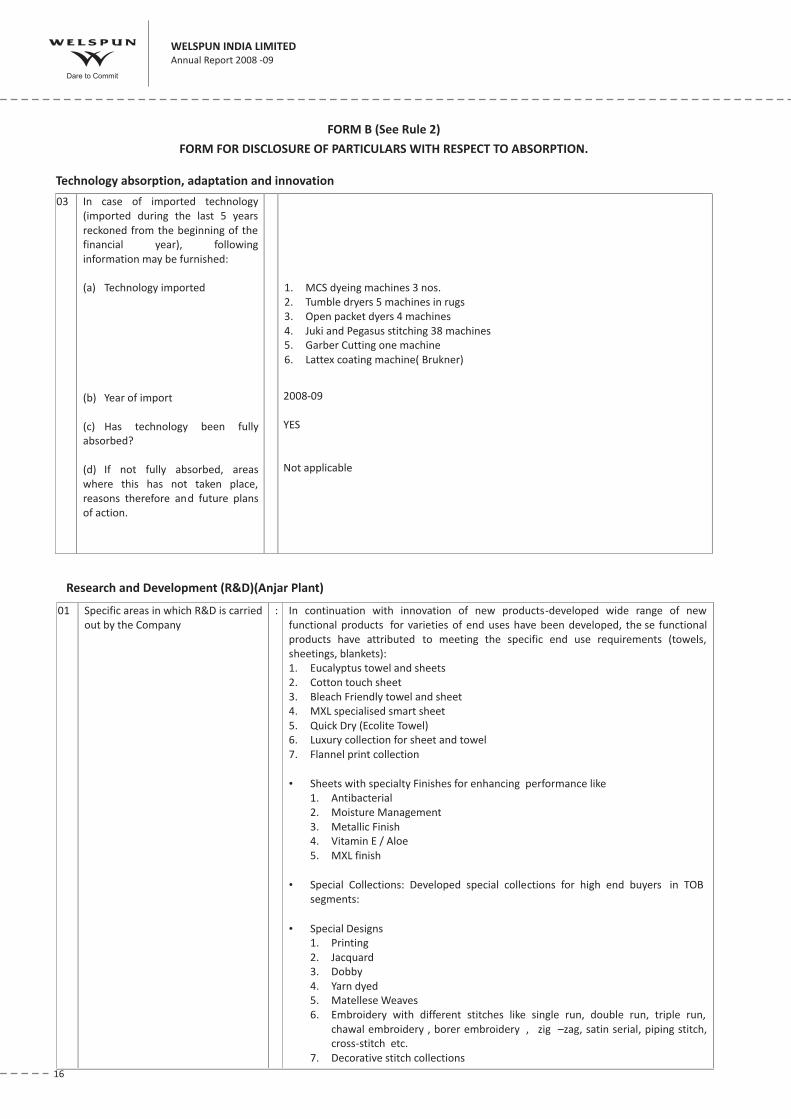
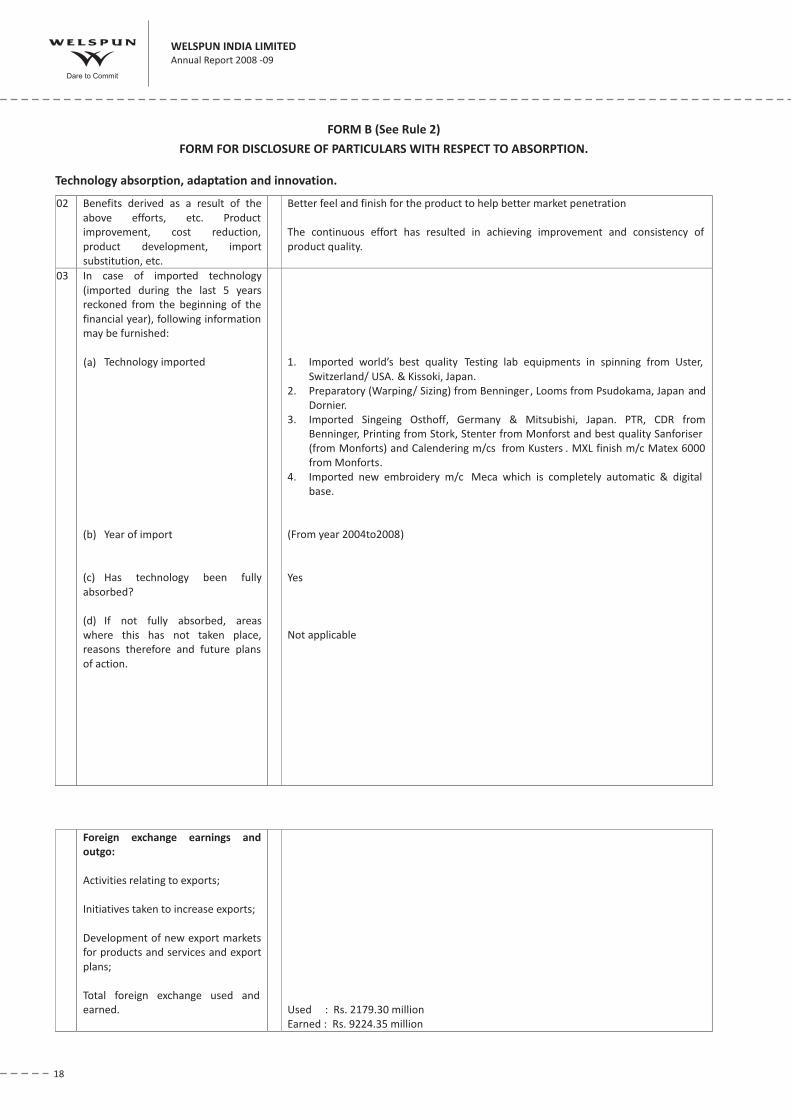
03 In case of imported technology
(imported during the last 5 years
reckoned from the beginning of the
financial year), following
information may be furnished:
(a) Technology imported
(b) Year of import
(c) Has technology been fully
absorbed?
(d) If not fully absorbed, areas
where this has not taken place,
reasons therefore and future plans
of action.
1. MCS dyeing machines 3 nos.
2. Tumble dryers 5 machines in rugs
3. Open packet dyers 4 machines
4. Juki and Pegasus stitching 38 machines
5. Garber Cutting one machine
6. Lattex coating machine( Brukner)
2008-09
YES
Not applicable
Technology absorption, adaptation and innovation
Research and Development (R&D)(Anjar Plant)
01 Specific areas in which R&D is carried
out by the Company
: In continuation with innovation of new products-developed wide range of new
functional products for varieties of end uses have been developed, the se functional
products have attributed to meeting the specific end use requirements (towels,
sheetings, blankets):
1. Eucalyptus towel and sheets
2. Cotton touch sheet
3. Bleach Friendly towel and sheet
4. MXL specialised smart sheet
5. Quick Dry (Ecolite Towel)
6. Luxury collection for sheet and towel
7. Flannel print collection
• Sheets with specialty Finishes for enhancing performance like
1. Antibacterial
2. Moisture Management
3. Metallic Finish
4. Vitamin E / Aloe
5. MXL finish
• Special Collections: Developed special collections for high end buyers in TOB
segments:
• Special Designs
1. Printing
2. Jacquard
3. Dobby
4. Yarn dyed
5. Matellese Weaves
6. Embroidery with different stitches like single run, double run, triple run,
chawal embroidery , borer embroidery , zig –zag, satin serial, piping stitch,
cross-stitch etc.
7. Decorative stitch collections

FORM B (See Rule 2)
FORM FOR DISCLOSURE OF PARTICULARS WITH RESPECT TO ABSORPTION.
• Blankets
• Flannels collections both print and solid
• Flexi fit sheet with different color pallets
• Innovative approach of making TOB beds and Living room collections depicting
different themes- like Barren Beauty, Post pone Sun -rise, The Ethos, The Santa
Kukri for bedding, Fins and Oysters for Kid’s bedding ;
Maa , Knotting the Union, Better Connected ,
Nationalist Buoyancy for Living room items ,
02 Benefits derived as a result of the
above R&D.
Widened the range of products and create a brand image for better penetration in
market.
03 Future plan of action To create wider range of Sheets, towels and ‘Top of the Bed’ collections in future with
innovations.
04 Expenditure on R&D
(a) Capital
(b) Recurring
(c) Total
(d) Total R&D expenditure as a
percentage of total turnover.
NIL
Rs12.3 million
Rs12.3million
0.09%
Research and Development (R&D)(Anjar Plant)
17
.
01 Efforts, in brief, made towards
technology absorption, adaptation,
and innovation.
1. Designed processes to manufacture products made from special fibers, spinning,
weaving, and processing to packing.
2. Up-gradation in ERP system to accomplish growing need of fast material tracking,
data management, and ready access to useful information.
3. Ready access for information anywhere in the world with the plant for customer
enquiries and tracking.
4. Organic product processing established and we are certified manufacturers to
manufacture organic products. certified by International agencies (SKAL & IMO)
5. Adopted new technology of drying in towel (Alea Dryer). This technology helps pile
orientation thru air knife technology and drying in hot air resulting unique look of
the towel.
6. Incorporated new technology of auto-drawing (Staubli-from Germany) in sheeting
weaving. Earlier the system was fully manual and now with the help of automatic
system the process has become more reliable, fast and cost effective.
7. Incorporated auto-cutting system (Hauser-COMTAC-3000) in sheeting cut & sew
section enabling us to improve productivity, quality.
8. Incorporated auto-conveyer system (E-tone from Sweden) at cut & sew (sheeting)
to improve product quality and productivity.
9. Incorporated fully automatic cut & sew system (sheeting ) -Texpa-espritex which
also improve productivity & quality.
10. Incorporated New Sanforizing machine at sheeting (Monforts-Monfortex-finishing
shrinker) for effective finish on fabric.
11. Adopted new technology in dyeing – thermosol dyeing( Monforts Thermex
machine) which improve quality as well as production also.
12. Installed new finishing process of Anglada for improving quality & production in
towel.
13. Incorporated MXL finish fabrics through Matex 6000 Monforts machine where
sheets will be wrinkle free. As on date, this is a unique product & market
demanding value addition on sheeting fabric.
14. Incorporated Mitsubishi – singing machine in sheeting where double singing in one
operation
15. Incorporated single end sizing machine in case of sample which is minimized the
loss of production for sampling.
16. Incorporated in sample process Suzuki single end warping machine this is help
faster processing sample without hampering suffering loss of production.
Technology absorption, adaptation and innovation.
FORM B (See Rule 2)
FORM FOR DISCLOSURE OF PARTICULARS WITH RESPECT TO ABSORPTION.
(b) Year of import
(c) Has technology been fully
absorbed?
(d) If not fully absorbed, areas
where this has not taken place,
reasons therefore and future plans
of action.
Benninger, Printing from Stork, Stenter from Monforst and best quality Sanforiser
(from Monforts) and Calendering m/cs from Kusters . MXL finish m/c Matex 6000
from Monforts.
4. Imported new embroidery m/c Meca which is completely automatic & digital
base.
(From year 2004to2008)
Yes
Not applicable
Foreign exchange earnings and
outgo:
Activities relating to exports;
Initiatives taken to increase exports;
Development of new export markets
for products and services and export
plans;
Total foreign exchange used and
earned. Used : Rs. 2179.30 million
Earned : Rs. 9224.35 million
02 Benefits derived as a result of the
above efforts, etc. Product
improvement, cost reduction,
product development, import
substitution, etc.
Better feel and finish for the product to help better market penetration
The continuous effort has resulted in achieving improvement and consistency of
product quality.
03 In case of imported technology
(imported during the last 5 years
reckoned from the beginning of the
financial year), following information
may be furnished:
(a) Technology imported 1. Imported world’s best quality Testing lab equipments in spinning from Uster,
Switzerland/ USA. & Kissoki, Japan.
2. Preparatory (Warping/ Sizing) from Benninger, Looms from Psudokama, Japan and
Dornier.
3. Imported Singeing Osthoff, Germany & Mitsubishi, Japan. PTR, CDR from
Technology absorption, adaptation and innovation.
18
WELSPUN INDIA LIMITEDAnnual Report 2008 -09

BASIC BEDDING
Capacity
Facilities
– 3 million units
– Mexico

20
WELSPUN INDIA LIMITEDAnnual Report 2008 -09
CORPORATE GOVERNANCE REPORT - 2009
I. Philosophy on Corporate Governance:
II. Board of Directors.
III. AUDIT COMMITTEE
A. Terms of reference:
B. Composition:
Board of Directors of the Company acts as a trustee and assumes fiduciary responsibility of protecting the interests of the
shareholders and other stakeholders of the Company. Board supports the broad principles of Corporate Governance. In
order to attain the highest level of good Corporate Governance practice, Board lays strong emphasis on transparency,
accountability and integrity.
Composition and category of directors; attendance of each director at the board meetings and the last AGM; number of
other companies on the Board or Committees of which, a director is a Director; and number of board meetings, dates on
which held, are as under:
The terms of reference stipulated by the Board of Directors to the Audit Committee are as contained under clause 49 of the
Listing Agreement.
The Audit Committee was constituted by the Board of Directors in the year 1997. The Chairperson of the Committee is an
independent director. Five meetings of the Committee were held during the year under review (17th May, 2008, 29th May,
2008, 28th July, 2008, 31st October, 2008 and 31st January, 2009). The composition of the Committee and attendance of
PLC = Public Limited Company incorporated in India
PTC = Private Limited Company incorporated in India
Over-seas = Bodies Corporate incorporated outside India
Other = Others including companies Incorporated under Section 25 of the Companies Act
@ Finance & Administration Committee, Remuneration Committee & Project Management Committee memberships not included as the same are not
considered with reference to the limit of the committees on which a director can serve.
Abbreviations:
P = Promoter, E = Executive, NE = Non-Executive, I = Independent, L = Lenders, S = Shareholders, M = Member, C = Chairperson.
Five meetings of the board of directors were held during the financial year 2008-09. One each on 30th May, 2008, 28th July, 2008, 15th September, 2008,
31st October, 2008 and 31st January, 2009.
No. of other Director- ships
(As declared to the Company)Name of Director
CategoryBoard Meetings
Attended during
the Year 2008-09
Attendance at
the Last AGM
(attended)PLC PTC
Over-
seasOther
Member (M) /
Chairperson (C) in No. of
Board Committees
including other
Companies @
Mr. G. R .Goenka (Died on 28.12.2008)P 0 - - - - - -
Mr. B.K.Goenka - *Chairman & Managing
Director (Chairman w.e.f. 31.01.2009)P, E, C 4 - 13 7 4 - 3M
Mr. R.R.Mandawewala –
Joint Managing DirectorP, E, S 4 - 15 2 13 - 2M,1C
Mr. M.L.Mittal - Executive Director
(Finance)E 5 - 14 6 2 - 4M
Mr. D.B. Engineer NE, I 3 - 9 3 - - 4M, 2C
Mr. A.K Dasgupta NE, I 4 - 2 1 - - 1M
Mrs. Bala Deshpande NE, I 0 - 1 - 2M
Mrs. Revathy Ashok NE, I 2 - - 2 - - -
Mr. Arun Todarwal – Nominee – Dunearn
InvestmentsNE, S 5 - 4 1 - - 3M, 1C
Mr. Ram Gopal Sharma (appointed on
25.08.2008 and retired at AGM 27.09.2008
and again appointed w.e.f. 16.10.2008)
NE, I 3 YES 2 - - - 1M

21
the members is given hereunder:
The Company Secretary of the Company, Mr. D.K. Patil is the Secretary of the Committee. Executive Director (Finance),
Internal Auditors and Statutory Auditors attended each of the meetings as per the provisions of section 292A of the
Companies Act, 1956.
The Remuneration Committee was constituted by the Board of Directors in its meeting held on 22nd June, 2002. One
meeting of the Committee was held on 28-07-2008 during the year. The terms of reference, compositions are as under:
: To recommend appointment of Managerial Personnel and consider the remuneration payable to
them and review thereof from time to time.
The details of remuneration paid/ payable to the directors for the Financial Year 2008-09 are as under:
Chairman and Managing Director
Joint Managing Director
IV. REMUNERATION COMMITTEE:
a. Terms of reference
b. Composition:
c. Remuneration to Executive Directors
1) Mr. B.K Goenka -
2) Mr. R.R. Mandawewala
* @ 1 % on the profits determined under Section 349 of the Companies Act, 1956.
* @ 1 % on the profits determined under Section 349 of the Companies Act, 1956.
Name of Member Member/ Chairman CategoryNumber of Meetings
Attended
Mr. D. B. Engineer Chairman Non-Executive Independent 4
Mrs. Bala Deshpande Member Non-Executive Independent 0
Mr. Arun Todarwal Member Non-Executive Shareholder 5
Mr. A. K. Dasgupta Member Non-Executive Independent 5
Mr. R. G. Sharma (Since 16.10.2008) Member Non-Executive Independent 2
Name of Member Member/ Chairman
Mr. A. K. Dasgupta Chairman
Mrs. Bala Deshpande Member
Mr. Arun Todarwal Member
Salary & Allowances 2.85
Perquisites -
Commission * -
Service Contract Dated 04-11-2000 extended upto 10-10-2010
Tenure 11-10-2005 to 10-10-2010
Notice Period 1 Month
Severance Fees NIL
Stock Option NIL
Salary & Allowances 1.90
Perquisites 0.26
Commission * -
Service Contract -
Tenure
Upto June 30, 2011 subject to reappointment upon
retirement by rotation and approval of the members in the
ensuing Annual General Meeting
Notice Period 1 month
Severance Fees NIL
Stock Option NIL
(Rs. in million)
(Rs. in million)

3) Mr. M.L.Mittal
D. Remuneration to Non Executive Directors:
V. SHARE TRANSFER AND INVESTOR GRIEVANCE COMMITTEE
- Executive Director (Finance)
The Non Executive Directors do not draw any remuneration from the Company. Non Executive directors are entitled to the
sitting fees for every meeting of the Board and Audit Committee attended.
Non Executive Directors are paid Rs. 5,000 for attending a Board Meeting, Rs. 3,000 for Audit Committee Meeting and Rs.
3,000 for Remuneration Committee Meeting.
The Share Transfer Committee was constituted by the Board of Directors at its meeting held on 30th December, 1996 and
was later on renamed and re-constituted as Share Transfer and Investor Grievance Committee. The Chairman of the
Committee Mr. A. K. Dasgupta is a Non Executive Independent Director. The Committee meets once in a fortnight.
Compliance Officer: Mr D.K. Patil - Vice President (Legal) & Company Secretary.
a. Constitution of the Share Transfer and Investor Grievance Committee and attendance in its meetings:
b. Number of Shareholders complaints received during the year:
During the Year under review, total 90 Investor complaints were received. Break-up of number of complaints received
under different category is given hereunder:
All the complaints received during the year under review were solved within the time limit to the satisfaction of the
investors/shareholders and no complaint is pending as at 31st March, 2009 for a period over 30 days.
22
WELSPUN INDIA LIMITEDAnnual Report 2008 -09
Salary & Allowances 2.97
Perquisites 0.19
Commission -
Service Contract -
Tenure
Upto June 30, 2011 subject to approval of the members in the
ensuing Annual General Meeting
Notice Period 1 month
Severance Fees NIL
Stock Options (Granted) 90,000
Sr.
No.
Director Fees paid for attending Board and Committee Meetings
1 Mr. D. B. Engineer 27,000
2 Mr. A. K. Dasgupta 38,000
3 Mrs. Bala Deshpande 0
4 Mrs. Revathy Ashok 10,000
5 Mr. Arun Todarwal 43,000
6 Mr. Ram Gopal Sharma 21,000
Name of Member Member/ Chairman Meetings attended
Mr. A. K. Dasgupta Chairman 23
Mr. B. K. Goenka Member 17
Mr. R.R.Mandawewala Member 16
Mr. M.L.Mittal Member 18
Sr. Nature of Grievance Nos.
1. Non receipt of Share certificates after transfer 20
2. Non receipt of warrant 5
3. Non receipt of end stickers 1
4. Non receipt of Annual Report 16
5. Non receipt of demat credit / remat certificate 35
6. Rejected demat request 2
7. Non receipt of exchange certificate 2
8. Others 9
Total 90
(Rs. in million)

23
VI. MANAGEMENT
VII. GENERAL BODY MEETINGS
VIII. DISCLOSURE
IX. MEANS OF COMMUNICATION
X. GENERAL SHAREHOLDER INFORMATION
a. Management Discussion and Analysis
Management Discussion and Analysis of various businesses of the Company will be separately given in the Annual Report.
b. Disclosures by Management to the Board
All details relating to financial and commercial transactions where directors may have a pecuniary interest are provided to
the Board, and the interested directors neither participated in the discussion, nor do they vote on such matters.
The details of Annual General Meetings held in the last three years are given hereunder:
a) Details of related party transactions
Refer Note No. 22 (ii) of Schedule 19 to the Accounts in the Annual Statement for list of related party transactions.
b) Details of information on appointment of new directors
A brief resume, nature of expertise in specific functional areas, names of companies in which the person already holds
directorship and membership of committees of the Board and his shareholdings in the Company forms part of the
Notice of General Meeting, annexed to this Annual Report.
c) Details of non-compliance
There was no non compliance by the Company, nor there was any penalty or stricture imposed on the Company by the
Stock Exchange or SEBI or any authority on any matter related to capital market during the last 3 years.
The Company published its un-audited quarterly results / audited annual financial results in one or more of the following
newspapers:
(i) Western Times (English and Gujarati Editions)
(ii) Business Standard (English Edition)
(iii) Economic Times (English Edition)
(iv) The Financial Express (English Edition)
Results are published immediately after the same are approved / taken on record by the Board of directors.
Address of Website on which quarterly results are posted: www.welspun.com
Management Discussion and Analysis form part of this Annual Report.
AGM will be held on Wednesday, 30th September, 2009 at 10.30 a.m. at the Registered Office of the Company at Welspun
City, Village Versamedi, Taluka Anjar, District Kutch, Gujarat 370 110.
Financial Year of the Company is 1st April to 31st March.
Date of Book Closure: 18th September, 2009 to 25th September, 2009 (Both days inclusive)
Dividend payment date: Not applicable.
Listing on Stock Exchanges: Bombay Stock Exchange (BSE) and National Stock Exchange (NSE).
The equity shares of the Company have been voluntarily delisted from Ahmedabad and Delhi Stock Exchanges and all the
Meeting Day & Date of Meeting Time Place
21st
Annual General
Meeting
Wednesday, 23rd
September,
2006
10.30
a.m.
Registered Office : Survey No.76, Village Morai,
Vapi, Dist. Valsad, Gujarat – 396191
22nd
Annual General
Meeting
Saturday, 29th
September,
2007
10.30
a.m.
Registered Office : Survey No.76, Village Morai,
Vapi, Dist. Valsad, Gujarat – 396191
23rd
Annual General
Meeting
Saturday, 28th
September,
2008
10.30
a.m.
Registered Office : Survey No.76, Village Morai,
Vapi, Dist. Valsad, Gujarat – 396191

formalities for delisting of equity shares from Calcutta Stock Exchange have been completed and formal intimation is
awaited.
Bombay Stock Exchange : 514162
National Stock Exchange : WELSPUNIND (SERIES BE)
Market Price Data: High & Low price of equity shares on Bombay Stock Exchange Limited is as under.
Market Price Data: High & Low price of equity shares on The National Stock Exchange is as under.
Performance in comparison to broad-based indices i.e. BSE Sensex and NSE S & P CNX is as under:
Registrar and Transfer Agent: The Company has appointed Registrar and Transfer agent to handle the share transfer work
and to solve the complaints of Shareholders. Name, Address and telephone number of Registrar and Transfer Agent is given
hereunder:
M/s. Link Intime India Private Limited
Unit: Welspun India Limited
C-13, Pannalal Silk Mills Compound, LBS Marg,
Bhandup (West), Mumbai - 400078
Contact person: Mr. Suresh Kadam
Stock Code:
24
WELSPUN INDIA LIMITEDAnnual Report 2008 -09
Month High Amount (Rs.) Low Amount (Rs.)
Apr - 2008 58.00 43.65
May - 2008 64.70 48.60
Jun - 2008 50.95 35.00
Jul - 2008 41.45 33.00
Aug - 2008 43.00 36.20
Sep - 2008 49.90 34.00
Oct - 2008 37.50 17.10
Nov - 2008 28.50 16.20
Dec - 2008 27.20 17.50
Jan - 2009 24.20 15.25
Feb - 2009 17.35 12.95
Mar - 2009 25.00 11.35
Month BSE Index Closing price of
Shares (Rs.)
NSE Nifty Closing price of Shares
(Rs.)
Apr - 2008 17,287.31 52.80 5165.90 53.00
May - 2008 16,415.57 49.90 4870.10 50.10
Jun - 2008 13,461.60 35.70 4040.55 35.50
Jul - 2008 14,355.75 39.25 4332.95 39.15
Aug - 2008 14,564.53 38.60 4360.00 39.20
Sep - 2008 12,860.43 36.30 3921.20 36.55
Oct - 2008 9,788.06 22.90 2885.60 23.75
Nov - 2008 9,092.72 18.25 2755.10 18.00
Dec - 2008 9,647.31 20.45 2959.15 20.25
Jan - 2009 9,424.24 16.00 2874.80 16.05
Feb - 2009 8,891.61 14.30 2763.65 14.10
Mar - 2009 9,708.50 20.40 3020.95 20.40
Month High Amount (Rs.) Low Amount (Rs.)
Apr - 2008 57.90 43.70
May - 2008 64.75 48.60
Jun - 2008 50.70 35.00
Jul - 2008 40.00 33.00
Aug - 2008 43.00 36.00
Sep - 2008 44.95 34.00
Oct - 2008 39.00 17.50
Nov - 2008 27.50 15.00
Dec - 2008 27.00 17.50
Jan - 2009 24.95 15.20
Feb - 2009 17.90 13.00
Mar - 2009 24.60 13.20
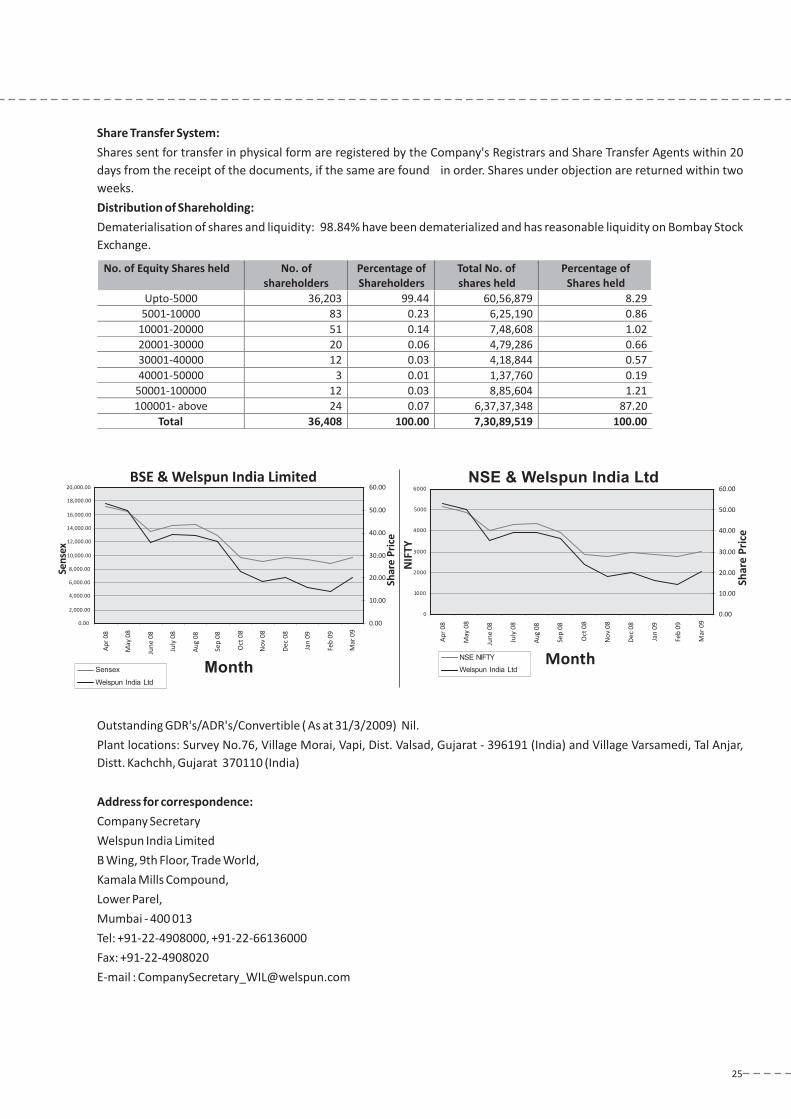
Share Transfer System:
Distribution of Shareholding:
Address for correspondence:
Shares sent for transfer in physical form are registered by the Company's Registrars and Share Transfer Agents within 20
days from the receipt of the documents, if the same are found in order. Shares under objection are returned within two
weeks.
Dematerialisation of shares and liquidity: 98.84% have been dematerialized and has reasonable liquidity on Bombay Stock
Exchange.
Outstanding GDR's/ADR's/Convertible ( As at 31/3/2009) Nil.
Plant locations: Survey No.76, Village Morai, Vapi, Dist. Valsad, Gujarat - 396191 (India) and Village Varsamedi, Tal Anjar,
Distt. Kachchh, Gujarat 370110 (India)
Company Secretary
Welspun India Limited
B Wing, 9th Floor, Trade World,
Kamala Mills Compound,
Lower Parel,
Mumbai - 400 013
Tel: +91-22-4908000, +91-22-66136000
Fax: +91-22-4908020
E-mail : [email protected]
25
No. of Equity Shares held No. of
shareholders
Percentage of
Shareholders
Total No. of
shares held
Percentage of
Shares held
Upto-5000 36,203 99.44 60,56,879 8.29
5001-10000 83 0.23 6,25,190 0.86
10001-20000 51 0.14 7,48,608 1.02
20001-30000 20 0.06 4,79,286 0.66
30001-40000 12 0.03 4,18,844 0.57
40001-50000 3 0.01 1,37,760 0.19
50001-100000 12 0.03 8,85,604 1.21
100001- above 24 0.07 6,37,37,348 87.20
Total 36,408 100.00 7,30,89,519 100.00
BSE & Welspun India Limited
0.00
2,000.00
4,000.00
6,000.00
8,000.00
10,000.00
12,000.00
14,000.00
16,000.00
18,000.00
20,000.00
Ap
r0
8
Ma
y0
8
Jun
e0
8
July
08
Au
g0
8
Se
p0
8
Oct
08
No
v0
8
De
c 0
8
Jan
09
Feb
09
Ma
r0
9
Month
Se
nse
x
0.00
10.00
20.00
30.00
40.00
50.00
60.00
Sh
are
Pri
ce
Sensex
Welspun India Ltd
NSE & Welspun India Ltd
0
1000
2000
3000
4000
5000
6000
Ap
r0
8
Ma
y0
8
Jun
e0
8
July
08
Au
g0
8
Se
p0
8
Oct
08
No
v0
8
De
c 0
8
Jan
09
Feb
09
Ma
r0
9
Month
NIF
TY
0.00
10.00
20.00
30.00
40.00
50.00
60.00
Sh
are
Pri
ce
NS
Welspun India Ltd
E NIFTY

26
WELSPUN INDIA LIMITEDAnnual Report 2008 -09
Practicing Company Secretary's Certificate
TO THE MEMBERS OF WELSPUN INDIA LIMITED
For S. S. Risbud & Co.
Company Secretaries
Sanjay S. Risbud
Proprietor
Mumbai
We have examined the compliance of conditions of Corporate Governance by Welspun India Limited for the year ended on 31st
March, 2009, as stipulated in Clause 49 of the Listing Agreement of the said Company with Stock Exchanges.
The compliance of conditions of Corporate Governance is the responsibility of the management. Our examination was limited to
procedures and implementation thereof, adopted by the Company for ensuring the compliance of the conditions of the
Corporate Governance. It is neither an audit nor an expression of opinion on the financial statements of the Company.
In our opinion and to the best of our information and according to the explanation given to us, we certify that the Company has
complied with the conditions of Corporate Governance as stipulated in the above mentioned Listing Agreement.
We state that in respect of investor grievance received during the year ended 31st March, 2009, the Registrars of the Company
have certified that as at 31st March, 2009, there were no investor grievance remaining unattended/pending for more than 30
days.
We further state that such compliance is neither an assurance as to the future viability of the Company nor the efficiency or
effectiveness with which the management has conducted the affairs of the Company.
July 30, 2009

DECORATIVE BEDDING
Capacity
Facilities– 1 million sets
– Mexico

28
WELSPUN INDIA LIMITEDAnnual Report 2008 -09
MANAGEMENT DISCUSSION AND ANALYSIS
Rajesh R. Mandawewala
BUSINESS ORGANIZATION
Overview of the Indian economy
The World Textile overview
Readers are cautioned that this discussion and analysis contains forward-looking statements that involve risks and uncertainties. When used in this discussion,
the words “anticipate,” “believe,” “estimate,” “intend,” “will,” and “expected” and other similar expressions as they relate to the Company or its business are
intended to identify such forward-looking statements. The Company undertakes no obligation to publicly update or revise any forward-looking statements,
whether as a result of new information, future events, or otherwise. Actual results, performances or achievements, risks and opportunities could differ materially
from those expressed or implied in these forward-looking statements. Readers are cautioned not to place undue reliance on these forward-looking statements as
these are relevant at a particular point of time & adequate restrain should be applied in their use for any decision making or formation of an opinion. The
following discussion and analysis should be read in conjunction with the Company's financial statements included herein and the notes thereto.
Welspun’s wide range of products provides one-stop solution in Home
Textiles - from terry towels to bath rugs & robes and from bed linen to
decorative bedding. Our innovative product portfolio, one-of-its-kind
design studio and stringent practices on sustainability, is the hallmark
of servicing our consumers better and being one of the largest and the
most respected Home Textile Company in the World!
Joint Managing Director
The Global economy saw a period of high growth from 2003- 2007 with the world economy growing at a CAGR of 4.5%. In 2007-
08 there were visible signs of a slowdown in the developed economies which exacerbated with the fall of several large financial
institutions in the US and Europe during 2008. The slowdown had a huge impact on the world economic growth in 2008 as all the
developed economies of USA, Europe and Japan entered into a recession. It is estimated by the International Monetary Fund
(IMF) that in 2009 the world economy will contract by 1.3% and show a modest recovery of 1.9% in 2010.
India's economy is on the fulcrum of an ever-increasing growth curve. With positive indicators such as a stable 8-9 percent
annual growth, rising foreign exchange reserves and rapidly expanding FDI inflows, India has emerged as the second fastest
growing major economy in the world after China.
The economy has been growing at an average growth rate of 8.8 percent in the last four fiscal years (2003-4 to 2006-7), with the
2006-7 growth rate of 9.6 percent being the highest in the last decade.
Inspite of the current global crisis, the Indian economy grew @ 6.7% during 2008-09. While the growth is expected to slow down
further in 2009-10 but most of the agencies believe that India will still grow at 5.5 to 6.5% during 2009-10. However, on the
Indian textile export front the country could only achieve a growth rate estimated to grow at 15
to 18 per cent.
The manufacturing sector in India has also been adversely affected by the global slowdown growing by a meager 2.4% in 2008-
09 against 8.2% in 2007-08. The Government has taken initiatives to stimulate the economy. The Indian industry is likely to see a
lot of capacity additions in 2009-10 in various Industry sectors.
The world cotton production for 2008-09 is estimated at 111.6 million bales, down 7.4% from 2007-08. The global cotton
consumption is also expected to reduce from 123.4 million bales in 2007-08 to 116.6 million bales in 2008-09. The lack of credit,
of at 11.8 per cent which was
(Source: IBEF Presentation on Textiles and Apparels, Dec 2008)

29
sharp drop in cotton prices and a drop in cotton consumption led to difficult conditions for the cotton industry across the world.
The global Textile & Clothing trade was estimated at US $ 598 billion in 2008 recording a growth of 2.5%, with the clothing trade
at US $ 363 billion and textile trade at US $ 235 billion.
The world trade in cotton textiles in 2008 was estimated at US $ 96.70 billion. The world trade in cotton made ups was estimated
at US$ 33.4 billion in 2008 considering a growth rate of 4.4%. USA which is the largest market for Cotton made ups in the world
registered a marginal decline of 1.48% in 2008. The UK market also showed a decline in imports of Cotton made ups by 6%.
Germany showed an increase of 4.88% (albeit much slower than the growth of 17.24% shown in 2007) and Japan showed an
increase in imports by 14.93% supported by the appreciation in the Japanese Yen (20%).
China which is the largest cotton producer in the world and exporter of Textile & Clothing has been facing a difficult period since
the beginning of the global economic crisis. The total T & C exports from China reached US $ 34.06 billion in Jan-Mar'09 a drop of
9% Y-o-Y. The key reasons for this are slackening demand, introduction of trade protection measures, currency appreciation and
increase in raw material cost.
China State Council recently announced further policies including tax breaks, export rebates, financial access and expanded
export credit insurance to support the exporters. The Chinese government has increased the tax rebate on textile exports five
times since August'08, the latest being an increase from 15% to 16% effective 1st April 2009.
The textile industry plays a crucial role in the Indian economy. It contributes about 14 per cent to the industrial production of the
country. As regards employment, it is the second largest after agriculture, employing nearly 35 million people & accounting for
20 per cent of the total workforce of the nation. Its contribution to forex earnings is around 14 per cent.
Textiles sector has been identified as one of the priority sectors having high growth potential and higher multiplier effects for
employment generation. Textile and clothing industry plays a dominant role in the country's economy. As of March 2009, it has a
total market size of USD 52 billion and accounts for 26 percent of the manufacturing sector, 20 percent of industrial production
and 18 percent of industrial employment. It contributes 16 percent to gross export earnings and 4 percent to national GDP.
Besides, another 50 million people are engaged in allied activities.
India has overtaken the US to become the world's 2nd largest cotton producing country, after China, as per a study by
International Service for the Acquisition of Agri-biotech Application. BT cotton was a major factor contributing to higher rate of
production, from 15.8 million bales in 2001-2 to 31 million bales in 2008-09. The yield per hectare has also improved drastically
from 278 kgs In 2000-01 to 526.15 kgs in 2008-09.
As of 2008, India accounts for:
41 percent of the global loomage. (including the organized & unorganized sector) (1.38 million out of 3.33 million
looms, out of this 1.3 million are non mill sector powerlooms)
16 percent of the global spindlage. (38.7 million out of 236 million spindles)
12 percent of the world's production of textile fibres and yarn.
20 percent share in the total world trade of cotton yarn. (US $ 2 billion out of $ 10 billion)
However, year 2008-09 was a tough year for the Indian textile Industry. In the first half of 2008-09 the commodity prices like
cotton, fuel and other inputs like power, dyes & chemicals were at multi year highs, the prices crashed after September 2008 and
reached lows in the second half of 2008-09. However, with an improvement in the business sentiment since April 2009, the
prices have again increased by 15-20%.
In addition to the global economic crisis some other steps taken by the government like 40% increase in the minimum support
price (MSP) of raw cotton, 5% export incentive for cotton exports, bulk discount offered by CCI, drastic reduction in export
incentive, heavy backlog in government dues, hardening of bank interest rates etc, have paralysed the performance of the
Indian textile industry. Even the best performing mills in the country have incurred huge losses for the last two years. Even in
(Source: Texprocil Newsletters,2009)
(Source: Texprocil)
(Source: * ITMF - International Textile Manufacturers Federation 2008 Shipment Statistics
# Texprocil)
The Indian Textile industry overview
�
�
�
�
*
*
#
#
competing manufacturing locations like China and Pakistan, there has been a closure of a lot of small manufacturing units.
The outlook for textile industry in India is optimistic. It is expected that Indian textile industry would achieve 7-8% growth rate in
the remaining period of the 11th Five year plan. The Indian textile & clothing industry is estimated to grow from USD 52 billion in
2008-09 to USD 115 billion by the year 2012, comprising domestic market of USD 60 billion and exports of USD 55 billion. Thus,
the projected growth rate is 34 percent per annum during these years, which is a pretty challenging target. It will require a well
defined multi prong strategy to achieve this kind of growth in the current challenging environment.
India produces a wide range of home furnishings, household linen, curtain tapestry and yardage made with different textures
and varying thickness.
The Indian domestic and export markets for textile and apparel grew at 6.5 percent and 12 percent CAGR respectively during the
tenth five year plan. However, due to the economic crisis, the Indian Textile & Clothing exports dropped by 2% to US $ 21.75
billion in 2008-09 in which Textile exports accounted for US $ 12.7 billion and Garment exports accounted for US $ 9.7 billion. In
the current scenario, it appears difficult to achieve the target of US $ 40 Billion in 2009-10 as planned in the 11th five year plan.
Ministry of Textiles has targeted a growth of 16% per annum for the Indian T&C industry to reach US $ 115 billion by the end of
Eleventh Five Year Plan. It also wants to secure a 7% share in global T&C trade by the end of the Eleventh Five Year Plan.
The domestic demand accounts for more than 60% of the Indian textile and apparel industry, reducing the dependence on the
international markets. However, the exports are heavily tilted towards the US and European market (70%).
India has several advantages in terms of abundant supply of cotton and human-made fibre, mature and well-established
production base, cheap and skilled labour and good design capabilities. Besides this, government incentives to exporters and
entry of foreign retailers into the Indian market would also act as a fillip to retail sourcing from India.
As per a recent survey conducted by the trade bodies on the Textile & Clothing Industry, the companies across the value chain
have been adversely affected by the global economic slowdown. The performance is however expected to improve in the
coming quarter with improvement in Demand, reduction in raw material prices and improvement in cost efficiencies by the
companies.
The global home textiles industry is estimated at US$ 70 billion (at the retail level) with US and EU together accounting for nearly
70% of the overall market.
During 2004-2007, the global growth, sales of new homes, increase in consumer spending led to an increase in the US and
European home textile markets. However, with the drop in sales of new homes and most of the developed economies entering a
recession the overall home textiles market stagnated in 2008.
The imports from China, India and Pakistan and other emerging manufacturing locations like Bangladesh and Vietnam have
been increasing since 2004 after the end of quotas. The manufacturing plants in USA and Europe have been shutting down and
adapting their business model to either relocating to low cost manufacturing locations (as done by Springs Global in moving to
Brazil and WestPoint Home getting products manufactured from Bahrain and Pakistan), sourcing from Asia or getting acquired
by companies from these manufacturing centres.
In the current scenario, USA imports of home textiles account for nearly 75% of the overall market. This figure is expected to go
up with the finishing facilities for Towels and basic bedding manufacturing plants also moving out of the USA.
Even in case of Europe, manufacturing companies from Portugal have been struggling with many small companies like Mundo
Textil, JMA, La Meirinho on the brink of closure. This provides a huge opportunity for companies like us with a global
manufacturing footprint to cater to these markets.
(Source: Texprocil Newsletter, 2009)
(Source: Home Textiles Today, ec.europa.eu)
(Source: OTEXA)
(Source: OTEXA)
Growth Plan for textiles and apparel industry
THE HOME TEXTILE INDUSTRY
30
WELSPUN INDIA LIMITEDAnnual Report 2008 -09

31
CHALLENGES AND THREATS-GLOBAL CHALLENGE
ADVANTAGE INDIA
Building Sustainable Business Model
Availability of Cotton with a marginal cost advantage:
Strong presence in Yarn Market:
Cost Advantages in inputs:
�
�
�
�
�
�
�
Increasing Competition: As mentioned above, there has been a shift from Developed economies to Developing
Asian Economies. Now with the emergence of new centres and slowdown in consumer spending, the competition is
increasing.
Weak Consumer Demand: The Retail sales in USA, UK and Japan have dropped since 2008 which has adversely affected the
order position.
Economic Slowdown: As mentioned earlier in the document, most of the developed economies are into recession. This has
severely affected tradeflows, consumer demand, job availability, business profitability etc. challenging the business
scenario.
Liquidity Crisis: With the collapse of large financial institutions in USA and Europe and the sub prime mortgage crisis,
defaults & foreclosures liquidity has been a concern. While most of the Central banks have reduced rates & infused liquidity
in the system, the availability of funds to businesses has been low.
As mentioned above India is now the second largest cotton
manufacturer in the world after China. With the improvement in area under cultivation and yield per hectare, the
availability of cotton is very good. With the low freight costs the overall cost advantage of 5- 7% is also available.
India contributes to nearly 20% of Yarn trade in the world and enjoys top exporter
status in 17 large markets. This provides easy availability of yarn with good quality.
In terms of the key inputs, most of the companies have access to captive power or public
power at competitive costs. Even in case of other key inputs like Dyes, Chemicals and packaging material which account
for 12-15% of overall product cost, most of the multinationals are present in India and there is also a development of
Weak Consumer Demand
Consumer confidence index
lowest in Decade
Retail Comp store sales
showing negative growth in US
Oct Dec’08 Retail comp store
sales growth negative in UK
Weak Consumer
Demand
Retailer
Bankruptcies
Liquidity
CrisisEconomic Slowdown
Increasing
Competition
Global
Challenges
Bankruptcies
Retailers- LNT, Boscov’s, Mervyn’s Liquidated,
Gottschalks filed for Chap 11
Suppliers- APE is an example
Increasing competition
High Inventory Levels
Obsolescence costs
Liquidity Crisis
Low Lending by Institutions
Purchase postponement
Defaults & Foreclosures
Economic Slowdown
All Major economies USA, UK, Japan and EU
in Recession.
Emerging economies have been affected
China GDP growth slowed to 6.1% for Jan-
Mar'09 (slowest in 20 years)
India has shown negative exports growth
since in Oct'08, for FY'09 Indian exports @
US $ 168.7 billion (only 3.4% Y-o-Y growth)

local vendors ensuring low delivery lead time and competitive pricing for inputs.
As per the Werner International Study, Most of the
Asian countries are competitive in terms of labour costs. India is also comparable with other manufacturing centres like
Bangladesh, Vietnam, Pakistan and China. However, India has the advantage of a pool of skilled manpower.
Most of the competing manufacturing centres lose out to India in terms of the
Political & Business Climate. While Bangladesh & Pakistan are battling Political Issues, China has also seen closure of a
lot of small units in the recent economic turmoil, the pegging of yuan against the dollar & dependence on exports has
also made china manufacturing uncompetitive in the recent past.
With the TUFS program, India saw a lot of Investment in the textile sector
in the last five- seven years. Considering that a lot of technology in India is better than other competitors.
The increasing shopping malls, residential complexes, sophisticated life style and surge in hotel
industry, bring a tremendous opportunity for Companies making home products.
• Welspun is today amongst the top 3 Home Textile manufacturers in the world. In all the product areas the
company has capacity amongst the top 5 manufacturers in the world. It has capacities at multiple locations
which is a derisking for the customers.
• With the expansion from Terry Towels & Bed Sheets to Rugs, Basic Bedding & Fashion Bedding as
also window treatments and blankets, today Welspun is an integrated Home Textile supplier across all customer
requirements.
• Welspun actively uses the organizations like NPD and Just Ask a Woman to get insights into consumer
requirements and identify the key product attributes to help in consumer communication. Infact, this consumer research is
also shared with the key retailers during strategic meetings which are the foundation for all product recommendations.
• To meet the differing expectations of the consumers in different markets and products
Welspun has design teams in India, New York (Bath), Charlotte (Bedding), Porto (Sorema Rugs), Hyde (UK Bed & Bath), San
Francisco, USA .
• Welspun believes that Product Development & Innovation is a key area to create a
sustainable competitive advantage. Using the inputs from the consumer research and through tracking the new
developments, the Company has added new products like nanospun towels, eco-lite towels (quick dry), cotton bamboo
towel, eucalyptus towel and texture towels in its product basket.
�
�
�
�
Availability of Skilled Manpower and comparatively lower cost:
Stable Political & Business Scenario:
Investment in Technology & Infrastructure:
Increasing demand:
ADVANTAGE WELSPUN - STRENGTHS AND OPPORTUNITIES
Global Scale:
The total capacity of Welspun is as under:
One stop shop for Home:
Consumer Research:
Multi Location Design Team:
Product Development and Innovation:
32
WELSPUN INDIA LIMITEDAnnual Report 2008 -09
India Portugal Mexico Total
1 mn sets
Basic Bedding
Bath Rugs
Bed Linen 10 mn sets 10 mn sets
Towel 38,200 tonnes 38,200 tonnes
10 mn pieces
1,07,496 spindles
DecorativeBeddings
1 mn sets
Yarn Spindles (nos) 1,07,496 spindles
-
-
-
-
-
-
-
-
-
-
1 mn pieces 11 mn pieces
3 mn units 3 mn units

33
On the Bed Linen front, a lot of product development has taken place in the second half of 2008-09 and Welspun has
added products like Ever Smooth Wrinkle Free, Quick Dry Sheets, Flexifit sheets and the Perfect Sheet incorporating all
the qualities mentioned.
• Welspun has a Marketing team in USA at Charlotte and in India which works on developing the
Packaging for different products. In order to ensure that the key functional product attributes are communicated to the
consumer at the retail floor, the Point Of Sale communication is also developed.
• Welspun has a portfolio of Own Brands and Licensed Brands. While own brands like Hygrocotton,
Luxus, Smart and Eversmooth Christy, Graccioza by Sorema are finding increasing customer recognition and acceptance,
Licensed Brands like Amy Butler, Waverly and Umbra provide access to retailers.
• Welspun is amongst the few manufacturers which provide Collaborative Forecasting, Planning and
Replenishment to its customers over more than 30 programs from POS to production at plant level.
• Welspun has presence at multiple locations across the world and uses this presence to
build the market intelligence for different markets. In addition to this secondary research using published Industry sources
helps to build the market intelligence.
• State-of-the art technology, machinery know-how from the best international suppliers and vertically
integrated plants, gives the Company a very strong footprint in this particular industry. Welspun is flexible, change
oriented and innovative.
• A strong client base and a great track record in terms of client servicing and on time delivery is a key strength.
• The exponential growth anticipated in the textile industry gives a great futuristic hope
for companies like us which have implemented process and technology of global standards and are ready to meet future
demands.
• Cotton is sourced locally, helping in lean manufacturing. In a nutshell, the Company has really
established synergies between raw material sourcing, manufacturing facilities and markets.
In a time when the main competitors like Springs Global & WestPoint Home have been losing revenues and money, Welspun has
been able to sustain its revenues in the global slowdown. In fact Welspun is the only supplier in the Top 15 Suppliers as per Home
Textiles Today, which has shown consistent growth over the last three years.(Home Textiles Today, co. websites)
Welspun has followed its defined strategy, improved product mix and optimised the utilisation of assets. It has been successful
in the optimisation of raw material cost and major input cost. During the year under review, the customers have appreciated the
new products developed by the company and it is expected that in 2009-10, Welspun will get significant jump in revenues &
volumes through the bed linen products.
In 2008-09 Welspun started its state of the art Rugs Plant at Vapi and has already placed product with large customers like Bed
Bath & Beyond and Macy's. The business for Mexico Bedding factory also improved since November'08 and with the License of
an eminent brand the business is expected to improve in 2009-10.
Welspun has over the last year been able to cement its position as a fully integrated complete home textile supplier. It has been
able to retain its market share of the Terry Towels product category and increase its share in the bed linen category.
Through Sorema of Portugal, Welspun has been able to set up a sales network in Europe in the key markets of Germany, Spain,
Benelux, Scandinavia in addition to UK and Portugal. Christy UK, inspite of a difficult market has been able to sustain its market
share in Terry Towels in the UK market. In the Bed Linen category in UK the consumer response has been good and the business is
expected to grow In the coming years.
Packaging and Point Of Sale:
Advantage of Brands:
,
Extended SCM:
Global Market intelligence:
Technology:
Reliability:
Projected growth of textile industry:
Access to raw materials:
Welspun's efforts to sharpen competitive edge

Welspun is further expanding/modernising its manufacturing capacities with an objective to attain increase in volume with
lower overhead, better quality and replacement of old technology with world class technology.
Welspun targets cost optimization with an aim to become the lowest cost producer of home textiles globally and further aims to
become the preferred partner in home textiles for global initiative with its business model.
In 2009-10 Welspun plans to:
Sustain its market share in Towels in USA and UK
Improve its market share in Bed Linen in all Markets
Utilise the Sales Network set up in Europe to increase sales across all product categories
Stabilise the sales of Faupel products in UK
Acquire/ License Brands
Increase revenues in Fashion Bedding, Basic Bedding and Bath Rugs
Develop new Markets like Mexico, Japan, Russia and China
Create a Sourcing & Quality infrastructure
Create sustainable products
Continuous focus on cost reduction at plants and subsidiaries
Product Development & Innovation
Developing a Competitive Advantage
• Offering a Business Proposition
Be a strategic partner to Customers
• Sharing of Common Objective with Customer
Maximize inventory turns
Optimize ROI for Customer & Welspun
• Integration
Supply Chain Integration with Client data base
• Quick response through USA distribution
• Efficient supply chain for filled products through Mexico
Building global scale
• Towel capacity among top three in the world
• Sheet capacity will be among top two in India and top five in the world
• Dec bedding and rugs also global scaleamong top 5 capacities in the world
• Manufacturing base in Mexico, Portugal and India
• Distribution facilities in India, Charlotte, Mexico, Portugal, UK
Welspun “Social” Initiatives
• Health & Environment
Initiation towards Carbon Credit - VAPI changing over to gas-based turbines in place of Furnace Oil generation
Social forestry by planting eucalyptus saplings outside the company premises.
Zero Discharge Effluent treatment plant with Sludge disposal, RO Plant & Salt Recovery
• Employee Benefits
Schooling, Transportation
Good Working Environment
• Awards & Certifications
EARTH CARE AWARD for major reduction of carbon emissions. Earth Care awards was founded by India's largest
media house, the Times of India and Jindal Steel Works in an effort to recognize local and relevant action in tackling
challenges posed by climate change.
Walmart Sustainability Award
• Training
5S, Lean Six Sigma, Process Training
�
�
�
�
�
�
�
�
�
�
�
�
�
�
�
�
�
�
�
�
�
�
�
34
WELSPUN INDIA LIMITEDAnnual Report 2008 -09

35
OUTLOOK
INTERNAL CONTROL SYSTEM AND THEIR ADEQUACY
Welspun is already a strategic vendor to the major retailers in the USA. It has been able to sustain its growth even in the current
economic scenario where the retail sales in its key market of US dropped since Sept'08. As a result of reduced consumer
spending the retailers also corrected the inventory in the entire supply chain leading to low orders.
In 2008-09 Welspun has signed a License for a leading brand for North America covering the categories of Fashion Bedding,
Fashion Bath, Blankets/ Throws and Area Rugs in addition to the earlier license of Bath, Solid Sheets and rugs. The new license
will help Welspun in becoming a key player in the Fashion Bedding segment through the manufacturing facility at Mexico.
Welspun today differentiates itself from the other manufacturers by focusing on Consumer Research driven innovations, use of
new technologies, a global manufacturing & sales footprint and ability to offer a comprehensive end-to- end solution to the
customers. A recent example of a consumer research driven innovation has been the Quick Dry Towel and the Perfect Sheet.
At Welspun, the internal control system encompasses the policies, processes, tasks, behaviours and other aspects of the
Company that taken together facilitates effective and efficient operation, quality of internal and external reporting, compliance
with applicable laws and regulations. Welspun's objectives, its internal organisation and the environment in which it operates
are continually evolving and, as a result, the risks it faces are continually changing. In order to make its internal control effective
and sound, Welspun thoroughly and regularly evaluates the nature and extent of the risks to which the Company is exposed. The
operation and monitoring of the system of internal control has been taken by individuals who collectively possess the necessary
skills, technical knowledge, objectivity and understanding of the Company and the industries and markets in which it operates.
Welspun also outsources management auditors to periodically check the adequacy of its systems and processes so as to make it
more responsive in this volatile environment. The qualified, experienced and independent Audit Committee of the Board of
Directors actively reviews the adequacy and effectiveness of internal controls systems and suggests improvements for
strengthening them. Welspun has a strong Management Information System which is an integral part of the control mechanism.
Welspun has successfully implemented an enterprise wide solution (ERP) in its textile plants, is in advanced stage of
implementation at WUSA, WAG and Welspun Mexico and is in the process of covering all its businesses, planning and accounting
processes.
The system is improved and modified continuously to meet the changes in business conditions, statutory and accounting
requirements.

DISCUSSION ON FINANCIAL PERFORMANCE
KEY FINANCIAL DATA ( Standalone)
1. REVENUE
a. Net Sales
The Company achieved net sales of Rs 13,444.40 mn in FY 2009 registering an increase of 8.34% over the previous
financial year on account of better unit price realization despite slowdown in major global markets and lower foreign
exchange realization.
b. Other income
The income from other sources dropped from Rs. 246.66 mn in FY 2008 to Rs. 171.60 mn in FY 2009.
The Company was proactive in adoption of Accounting Standard 30 'Financial Instruments: Recognition and
Measurement. Changes in the fair value of the hedging instruments that do not qualify for hedge accounting are
recognised in profit and loss account to the extent of Rs 231.80 mn.
Profit on cancellation of forward contracts dropped from Rs.114.92 mn to Rs.21.13 mn in FY 2009.
This has offset the non operating income from the sale of Welspun Gujarat Stahl Rohren Limited shares amounting
to Rs 221.35 mn.
The bearish capital market had its effect on the dividend income from the mutual fund transactions which stands
at Rs 5.86 mn in FY 2009 vis-à-vis Rs 18.70 mn in FY 2008.
�
�
�
�
(In Rs million except per share data)
Net Sales(net of excise) 13,444.40 100.00 12,409.44 100.00 1,034.96 8.34
Other Income 171.60 1.28 246.66 1.99 (75.06) - 30.43
Cost of Material 5,784.37 43.02 5,034.54 40.57 749.00 14.89
Manufacturing Expenses 3,670.56 27.30 3,304.23 26.63 366.33 11.09
Employee Cost 1,035.18 7.70 963.37 7.76 71.81 7.45
Selling Administration and
Other Expenses 987.10 7.34 1,418.92 11.43 (431.82) - 30.43
Reported EBIDTA 2,138.79 15.91 1,935.04 15.59 204.57 10.53
Financial Expenses 921.11 6.85 676.85 5.45 244.26 36.09
Depreciation 952.98 7.09 847.19 6.83 105.79 12.49
Taxes (51.66) - 0.38 151.86 1.22 (203.66) - 133.99
Net Income from Ordinary
Activities 316.73 2.36 259.14 2.12 58.18 20.59
Extraordinary Item (net of tax
expense) 7.33 0.05
-
3.81 -
Exceptional Items
3.52
PAT (Profit After Tax) 309.03 2.30 262.66 2.12 46.36 17.65
EPS (Basic and Diluted before
Extraordinary Item) 4.33 - 3.59 - 0.74 - 20.61
EPS (Basic and Diluted after
Extraordinary Item) 4.23 - 3.59 - 0.64 17.83
Particulars FY 08-09 % FY 07-08 % YOY change YOY % change
CAPACITY UTILIZATION
FY 08- 09 F Y 07-08
Product Unit Installed
Capacity
Actual
Production
Capacity
Utilisation
Installed
Capacity
Actual
Production
Capacity
Utilisation
Terry Towel MTPA 38,201 30,088 78.76% 37,074 29,822 80.44%
Bed Linen
Products
Mtrs 42.84mn 23.51mn 54.88% 35.7mn 28.38mn 79.50%
- -
-- - -
36
WELSPUN INDIA LIMITEDAnnual Report 2008 -09

2.
a. Cost of Materials
The Cost of Material stands at Rs. 5,784.37 mn and as a % age of Net sales, it is 43.02% in FY 2009 vis-à-vis 40.57% in
FY 2008. This was mainly due to increase in the minimum support prices (MSP) for cotton .
b. Manufacturing Expenses
Manufacturing Expenses on year to year basis has increased by 11.09% and amounted to Rs.3670.56 mn for FY
2009 mainly due to increase in power fuel and water charges. The power fuel and water charges amounted to Rs
1408.47 mn in FY 2009 vis-à-vis Rs 1018.25 mn in FY 2008.
c. Selling, Administration and Other Expenses
The selling administration and other expenses saw a considerable drop on year to year basis. In Q4 of FY
2009 the Company has routed its export sales through its then Indian subsidiary Welspun Global Brands Ltd .
Hence all the related selling and marketing expenses are booked in the subsidiary company .The claims , discounts
and rebates have also reduced due to better quality production and negotiation of claims.
d. Finance Expenses (Net)
The Company has relied heavily on borrowings from the financials institutions for the Phase II expansion at Anjar.
During the FY 2009, the Company's borrowings has increased by Rs 1,172.66 mn. Further due to increase in the
banks lending rate and resetting of interest on old borrowings the total financial expenses are higher.
e. Depreciation
The installed capacity of the Company 's terry towel production units increased from 37,074 mtpa in FY 2008 to
38201 mtpa in FY 2009 . Similarly, the installed capacity of the Company's Bed-Linen products increased from 35.7
mn mtrs in FY 2008 to 42.84 mn mtrs in FY 2009. This increase in installed capacity has resulted in higher
depreciation cost for the FY 2009.
The EBIDTA has remained constant for the two financials at 16% as a percentage of sales due to meager increase on both
sale prices and volume .
The Profit after tax from ordinary activities remained constant at approximate 2%as a percentage of sales but registered an
increase of 17.65% on year to year basis . The major contributing factor was recognition of Deferred Tax Asset of Rs. 75.23
mn on unabsorbed depreciation pertaining to Assessment Year 1998-99 and 2001-2002 due to Appellate Tribunal ruling in
Company's favor.
The Earning Per Share (Basic) (before extra-ordinary item) in FY 2009 stands at Rs. 4.33 per share as compared to Rs.3.59
per share in the FY 2008, due to better profit after tax position.
EXPENDITURE
3. EBIDTA
4. PROFIT AFTER TAX
5. EARNING PER SHARE (Basic)
by the government
, of 30.43%
,
Particulars
Share capital
Reserves and Surplus
Total Shareholders Equity
Less: Miscellaneous Expenditure to the
extent not written off or adjusted
Net Worth
Net Sales
Net Sales/ Net Worth
Net Profit/Loss after Tax
Return on Net Worth
Current Assets
Current Liabilities and Provisions
Current Ratio
Inventory Turnover Ratio
Inventory (Days)
Debtors Turnover Ratio (Sales / Debtors)
Days Sales Outstanding
FY 08-09 FY 07-08
780.90 780.90
4,821.37 4,807.29
5,602.27 5,588.19
- -
5,602.27 5,588.19
13,444.40 12,409.44
2.40 2.22
309.03 262.66
5.52% 4.70%
8,223.33 7,546.69
1,866.68 1,468.09
4.41 5.14
5.37 4.71
68.16 77.69
11.81 15.11
31.00 24.23
6. KEY FINANCIAL RATIOS
37
(In Rs million except ratios)

CONSOLIDATED ACCOUNTS:
HUMAN RESOURCE MANAGEMENT AND INDUSTRIAL RELATIONS
During FY 09, Net Sales at Rs. 16991.20 mn was marginally higher by 3.20%. Though the standalone sales have gone up by 8.34%
the consolidated sales is not up by the same % as sales to Subsidiaries made in March ‘09 were in transit or in subsidiary’s
inventory.
However, Earning Before Interest, Depreciation and Tax (also before Exceptional Items) (EBIDTA) from Ordinary Activities at Rs.
1658.41mn was lower by 18% as compared to EBIDTA of Rs. 2031.01 mn in FY 08. Profit / ( Loss) Before Tax (PBT) from Ordinary
Activities at (Rs. 643.27 mn) was lower by 289% of PBT of Rs. 341.04 mn for FY07-08. Net Loss after adjusting for share of
Associates and Minority Interest was Rs. 765.57 mn as against Net Loss of Rs.1.55 mn for FY 08.This variation in EBDITA, PBT and
PAT is mainly on account of sluggish market conditions prevailing across the globe and underutilization of the capacity at some of
the subsidiaries.
The Company has undertaken “Project Parivartan” with eminent consultants, The HAY Group, India for
Change Path Exercise with focus for business stability and robust organization to achieve the Company's vision. This project has
added significant value to business in terms of global realignment and streamlined operations. The Industrial Relations across
the units remained cordial during the year.
Cautionary Statement:
Statements in the Management Discussion and Analysis describing Welspun's objectives, projections and estimates are forward looking statements and
progressive, within the meaning of applicable security laws and regulations. Actual results may vary from those expressed or implied, depending upon
economic condition, Government policies and other incidental factors
“Group for Inter-Se Transfer of Shares:
As required under Clause 3(1)(e) of the Securities and Exchange Board of India (Substantial Acquisition of Shares and Takeovers) Regulations, 1997, persons
constituting “Group” (within the meaning as defined in the Monopolies and Restrictive Trade Practices Act, 1969) for the purpose of availing exemption from
applicability of the provisions of Regulations 10 to 12 of the aforesaid SEBI Regulations are 1) B.K.Goenka, 2) Dipali Goenka, 3) Radhika Goenka, 4) Vanshika
Goenka, 4) R.R.Mandawewala, 5) Pratima Mandawewala, 6) Abhishek Mandawewala, 7) Yash Mandawewala, 8) B.K.Goenka Trustee, B.K.Goenka Family Trust,
9) Welspun Wintex Ltd, 10) Welspun Mercantile Ltd., 11) Welspun Trading Ltd, 12) Krishiraj Trading Ltd., 13) Welspun India Ltd., 14) Methodical Inv & Fin Pvt.Ltd,
15) Welspun Syntex Ltd, 16) Welspun Zuchhi Textile Ltd, 17) Welspun Power & Steel Ltd.
38
WELSPUN INDIA LIMITEDAnnual Report 2008 -09

SHEETS
Capacity
Facilities
– 10 million sets
– Vapi, Gujarat, India– Anjar, Gujarat, India

40
WELSPUN INDIA LIMITEDAnnual Report 2008 -09
CORPORATE SOCIAL RESPONSIBILITY (CSR)
Welspun is committed to conduct business in a socially responsible and ethical manner. Sustaining mutually accountable and
responsible synergies, we serve with passion to our Customers, Shareholders, Employees & Society at large. Our commitments
towards Corporate Social Responsibility (CSR) have been carefully selected in align with our six guiding path (6E's). These are
Enrichment of mind, Enrichment of body, Education, Empathy, Empowerment of Women and Environment sustenance.
A dedicated CSR team consisting of a cross-section of different functions from across the company reviewed and prioritized the
issues to be addressed now and in the future.
Through stakeholder engagement we have been able to review our issues and objectives and ensure we have in place a process
to enable thorough, open and transparent dialogue with all our key stakeholders
Sustaining mutually accountable and responsible synergies, Welspun has adopted Corporate Social Responsibility policy in the
year 2008. The policy outlines processes, systems and minimum standards for managing CSR related activities throughout
Welspun. Some of the main features of the policy are given below…
Build a civic character, not just a business character.
Follow practices laid down by various UN and International bodies in our business to meet society's expectations.
Follow Ethical business conduct and practice the principles of accountability, honesty and integrity in all business
aspects. Besides this, we strictly comply with all the laws that regulate and apply to the company, its systems and the
conduct of its business.
Ensure consistency in performance of various activities/ projects.
Work with government and agencies to support and respect Human Rights. We promote universal respect for
observance of human rights and fundamental freedom - particularly those of our employees, the communities within
which we operate and parties with whom we do business, without distinction as to ethnicity, origin, religion, gender,
language or disability
At Welspun we believe that Local Stakeholder Engagement is extremely important and we adhere to a collaborative,
consultative approach in our communities by supporting innovative programs in health, education, environment, as
well as cultural and civic projects. We take utmost care to integrate community investment considerations into
decision-making and business practices and assist in local capacity building to develop mutually beneficial
relationships with communities.
Provide maximum employment and economic opportunities and strengthen Human Relations. We ensure to provide
maximum employment and economic opportunities in the communities where we operate and we make sure that
employees are treated fairly and with dignity and consideration for their goals and aspirations and that diversity in the
workplace is embraced. Fair labour policies, while respecting the national and local laws of the countries and
communities where we operate are practiced. We are additionally committed to provide equal opportunity in all
aspects of employment and will not engage in or tolerate unlawful workplace conduct, including discrimination,
intimidation, or harassment.
�
�
�
�
�
�
�

41
- - - 6E's- - -
Enrichment of mind
Enrichment of body
Education
Empathy
Empowerment of Women
Mental Wellness is an important dimension of health and wellness. It signifies a state of flourishing of the overall being. At
Welspun, we believe that nurturing of the mind helps to reach high levels of emotional, psychological, physical and social well-
being. In this endeavour, we conduct work/life balance & stress management workshops.
We recognize knowledge as information in action. It is a dynamic blend of experience, values, information and insights, against
which new experiences and information can be evaluated and consolidated. Welspun has started the drive in upgrading libraries
across its facilities. This endeavour also focuses upon accessing materials by electronic means. User friendly library software is
being developed and designed to meet the needs of the readers. Relaxation and yoga AV (Audio-video) collections to de-stress
and re-energize are available at library resources.
Living a healthier life improves the quality of life. Feeling physically better and having control over life can greatly increase
mental health as well. We believe achieving health and remaining healthy is an active process.
Welspun has organized a number of health and eye camps in the last year in association with the local NGOs like Abhishyam
foundation, Princey eye care, Local Gram Panchayat & local hospitals. It has served over 1500 people. Around 10 people availed
of eye surgical facilities and over 1,000 people received aids and appliances. In all, over one thousand populations have been
benefited by the CSR activities of Welspun.
In our seamless effort to improve the lives of children through education, “Welspun Vidya Mandir”, a school up to Standard 10
and 'Welspun Anganvadi', a pre-primary school has been set up for not only the children of Welspun employees but children of
the other local families could also attend. Further, we also support various education initiatives at all levels. This involves
granting aid to schools, acknowledging and rewarding meritorious students and an initiative called Welspun scholars. Welspun
scholars are a group of approximately 14 students, who yearly, seek full study-assistance from Welspun. We support these
students, the future of tomorrow, with all humility and passion.
Welspun consider empathy as a salient component in our activities. Effective understanding, communication and relationships
are essential to develop solutions and avoiding or diffusing conflict. By helping others, we help ourselves to grow. In this regard
from the CSR front we have worked with several NGOs and helped to promote the social cause like, Right to Information Act,
Differently-able, Legal Rights for Women, orphanage children etc.
Welspun enables women to realize their full potential. We work for equal access to women on health care, quality education,
career and vocational guidance, employment, equal remuneration, occupational health and safety, etc. Welspun builds and
strengthens partnerships with civil society, particularly women's organizations and work towards changing societal attitudes
and community practices by active participation and involvement of women.
Girl child is a cause very close to our hearts at Welspun. We are determined to priorities the cause of the Girl child. A little
amount of care, a handful of warmth and a heart full of love for a girl child can make a big difference. In this endeavour, Naya
Savera, campaign was launched in Mumbai. Around 35 employees took the pledge and adopted more than fifty girl child. These
overwhelming responses bolster our spirit to lead the initiatives in a long run.

Environment Sustenance.
We consider environmental conservation is closely intertwined with human welfare. Companies care concern for the
environment manifests itself at all its facilities, establishment and project sites. Ensures compliance with applicable Health
Safety and Environment (HSE) legislation Welspun environment conservation initiatives includes, eco-friendly production
processes, reuse and recycling, effluent treatment, use of clean energy, a green cover in its factories, large scale tree plantation,
campaigns on energy conservation, rain water harvesting and many more.
CSR activities of Welspun have touched the lives of many, including the beneficiaries, the employees, families of employees, the
management, families of management staff, etc. due to this strength of people, it gave rise to a snowball effect, year after year
our CSR initiative has started doing better and even today its work has been recognized and appreciated as amongst top 38
Companies contributing in the field of CSR (Source: Social Corporate Governance Award, 2008). We are making every effort in
social commitment and contribute one per cent of its profit after tax on several CSR initiatives. Thus we sustain our efforts and
not sporadic attempts at community development. It goes beyond charity to capacity building. This is reflected from the change
in the lives of people whom we have touched through our various programs and activities. Our commitment is the beacon
towards many new innovation and initiatives in CSR. In coming years, Welspun is determined to face newer challenges and
newer avenues with a meaningful approach and interventions towards social welfare activities.
42
WELSPUN INDIA LIMITEDAnnual Report 2008 -09

BATH ROBES
Capacity
Facilities
– 1 million pieces
– Vapi, Gujarat, India

44
WELSPUN INDIA LIMITEDAnnual Report 2008 -09
Financials Section
Standalone Accounts
45Audit Report
48Balance Sheet
50Schedules
49Profit & Loss Account
78Cashflow Statement
79Balance Sheet Abstract
80Section 212 disclosure
Consolidated Accounts
81Audit Report
82Balance Sheet
84Schedules
83Profit & Loss Account
109Cashflow Statement

AUDITORS' REPORT
TO THE MEMBERS OF WELSPUN INDIA LIMITED
Neeraj Gupta
Price Waterhouse & Co.
1. We have audited the attached Balance Sheet of Welspun India Limited (the “Company”) as at March 31, 2009 and the
related Profit and Loss Account and Cash Flow Statement for the year ended on that date annexed thereto, which we have
signed under reference to this report. These financial statements are the responsibility of the Management of the
Company. Our responsibility is to express an opinion on these financial statements based on our audit.
2. We conducted our audit in accordance with the auditing standards generally accepted in India. Those standards require
that we plan and perform the audit to obtain reasonable assurance about whether the financial statements are free of
material misstatement. An audit includes examining, on a test basis, evidence supporting the amounts and disclosures in
the financial statements. An audit also includes assessing the accounting principles used and significant estimates made by
Management, as well as evaluating the overall financial statement presentation. We believe that our audit provides a
reasonable basis for our opinion.
3. As required by the Companies (Auditor's Report) Order, 2003, as amended by the Companies (Auditor's Report)
(Amendment) Order, 2004 (together the “Order”) issued by the Central Government of India in terms of sub-section (4A) of
Section 227 of The Companies Act, 1956 of India (the “Act”) and on the basis of such checks of the books and records of the
Company as we considered appropriate and according to the information and explanations given to us, we give in the
Annexure a statement on the matters specified in paragraphs 4 and 5 of the said Order.
4. Further to our comments in the Annexure referred to in paragraph 3 above, we report that:
(a) We have obtained all the information and explanations which, to the best of our knowledge and belief, were necessary
for the purposes of our audit;
(b) In our opinion, proper books of account as required by law have been kept by the Company so far as appears from our
examination of those books;
(c) The Balance Sheet, Profit and Loss Account and Cash Flow Statement dealt with by this report are in agreement with
the books of account;
(d) In our opinion, the Balance Sheet, Profit and Loss Account and Cash Flow Statement dealt with by this report comply
with the accounting standards referred to in sub-section (3C) of Section 211 of the Act;
(e) On the basis of written representations received from the Directors, as on March 31, 2009, and taken on record by the
Board of Directors, none of the Directors is disqualified as on March 31, 2009 from being appointed as a director in
terms of clause (g) of sub-section (1) of Section 274 of the Act;
(f) In our opinion, and to the best of our information and according to the explanations given to us, the said financial
statements, together with the Notes thereon and attached thereto, give in the prescribed manner, the information
required by the Act, and also give, a true and fair view in conformity with the accounting principles generally accepted
in India:
(i) in the case of the Balance Sheet, of the state of affairs of the Company as at March 31, 2009;
(ii) in the case of the Profit and Loss Account, of the profit for the year ended on that date; and
(iii) in the case of the Cash Flow Statement, of the cash flows for the year ended on that date.
Partner
Membership No. F055158
For and on behalf of
Chartered Accountants
Mumbai, June 30, 2009
45

(b) According to the information and explanations given to us and records of the Company examined by us, there are
no dues of income tax, service tax, customs duty, wealth tax and cess which have not been deposited on account
Annexure to Auditors' Report referred to in paragraph 3 of the Auditors' Report of even date to the members of Welspun
India Limited on the financial statements for the year ended March 31, 2009
46
WELSPUN INDIA LIMITEDAnnual Report 2008 -09
(i) (a) The Company has maintained proper records showing full particulars, including quantitative details and situation
of fixed assets.
(b) The fixed assets of the Company have been physically verified by the Management during the year. No material
discrepancies between the book records and the physical inventory have been noticed. In our opinion, the
frequency of verification is reasonable.
(c) In our opinion, and according to the information and explanations given to us, a substantial part of fixe d assets
has not been disposed-of by the Company during the year.
(ii) (a) The inventory has been physically verified by the Management during the year. In our opinion, the frequency of
verification is reasonable.
(b) In our opinion, the procedures for the physical verification of inventory followed by the Management are
reasonable and adequate in relation to the size of the Company and the nature of its business.
(c) On the basis of our examination of the inventory records, in our opinion, the Company has maintained proper
records of inventory. The discrepancies noticed on physical verification of inventory as compared to book records
were not material.
(iii) (a) The Company has not granted any loans, secured or unsecured, to companies, firms or other parties covered in the
register maintained under Section 301 of the Act.
(b) The Company has not taken any loans, secured or unsecured, from companies, firms or other parties covered in
the register maintained under Section 301 of the Act.
(iv) In our opinion, there is an adequate internal control system commensurate with the size of the Company and the nature
of its business for the purchase of inventory, fixed assets and sale of goods. The Company’s operations do not involve
sale of services. Further, on the basis of our examination of the books and records of the Company, and according to
the information and explanations given to us, we have neither come across nor have been informed of any instances of
major weaknesses in the aforesaid internal control system.
(v) (a) In our opinion and according to the information and explanations given to us, the particulars of contracts or
arrangements referred to in Section 301 of the Act have been entered in the register required to be maintained
under that Section.
(b) In our opinion and according to the information and explanations given to us, the transactions made in pursuance
of contracts or arrangements entered in the register maintained under Section 301 of the Act and exceeding the
value of Rupees Five Lakhs in respect of any party during the year, have been made at prices which are
reasonable having regard to the prevailing market prices at the relevant time.
(vi) The Company has not accepted any deposits from the public within the meaning of Sections 58A and 58AA of the Act
and the rules framed there under.
(vii) In our opinion, the Company has an internal audit system commensurate with its size and the nature of its business.
(viii) We have broadly reviewed the book s of account maintained by the Company, in respect of products where, pursuant to
the rules made by the Central Government of India, the maintenance of cost records has been prescribed under clause
(d) of sub section (1) of Section 209 of the Act, and are of opinion that, prima facie, the prescribed accounts and records
have been made and maintained. We have not, however, made a detailed examination of the records with a view to
determine whether they are accurate or complete.
(ix) (a) According to the information and explanations given to us and the records of the Company examined by us, in our
opinion, the Company has been generally regular in depositing the undisputed statutory dues in respect of
provident fund, investor education and protection fund, employees’ state insurance, income tax, sales tax, wealth
tax, service tax, customs duty, excise duty, cess and other material statutory dues , as applicable, with the
appropriate authorities.
of any dispute. The particulars of dues of sales tax and excise duty as at March 31, 2009 which have not been
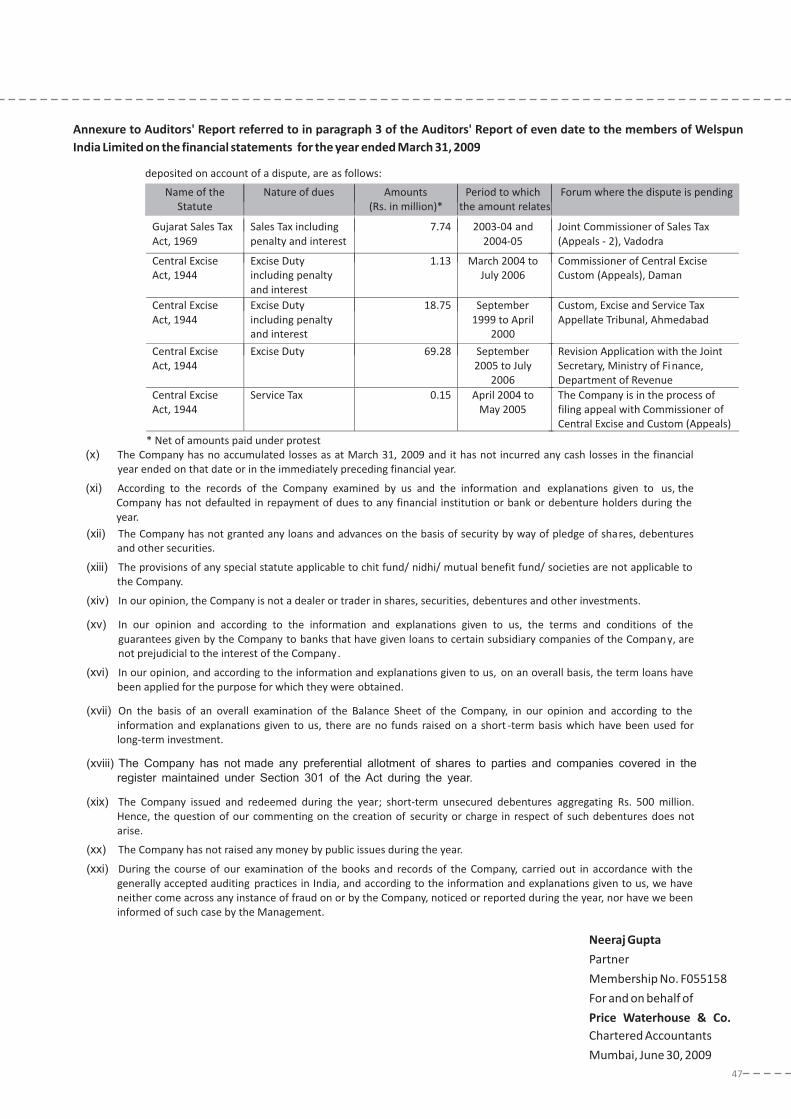
deposited on account of a dispute, are as follows:
* Net of amounts paid under protest
(x) The Company has no accumulated losses as at March 31, 2009 and it has not incurred any cash losses in the financial
year ended on that date or in the immediately preceding financial year.
(xi) According to the records of the Company examined by us and the information and explanations given to us, the
Company has not defaulted in repayment of dues to any financial institution or bank or debenture holders during the
year.
(xii) The Company has not granted any loans and advances on the basis of security by way of pledge of shares, debentures
and other securities.
(xiii) The provisions of any special statute applicable to chit fund/ nidhi/ mutual benefit fund/ societies are not applicable to
the Company.
(xiv) In our opinion, the Company is not a dealer or trader in shares, securities, debentures and other investments.
(xv) In our opinion and according to the information and explanations given to us, the terms and conditions of the
guarantees given by the Company to banks that have given loans to certain subsidiary companies of the Company, are
not prejudicial to the interest of the Company.
(xvi) In our opinion, and according to the information and explanations given to us, on an overall basis, the term loans have
been applied for the purpose for which they were obtained.
(xvii) On the basis of an overall examination of the Balance Sheet of the Company, in our opinion and according to the
information and explanations given to us, there are no funds raised on a short -term basis which have been used for
long-term investment.
(xviii) The Company has not made any preferential allotment of shares to parties and companies covered in the
register maintained under Section 301 of the Act during the year.
(xix) The Company issued and redeemed during the year; short-term unsecured debentures aggregating Rs. 500 million.
Hence, the question of our commenting on the creation of security or charge in respect of such debentures does not
arise.
(xx) The Company has not raised any money by public issues during the year.
(xxi) During the course of our examination of the books and records of the Company, carried out in accordance with the
generally accepted auditing practices in India, and according to the information and explanations given to us, we have
neither come across any instance of fraud on or by the Company, noticed or reported during the year, nor have we been
informed of such case by the Management.
47
Name of the
Statute
Nature of dues Amounts
(Rs. in million)*
Period to which
the amount relates
Forum where the dispute is pending
Gujarat Sales Tax
Act, 1969
Sales Tax including
penalty and interest
7.74 2003-04 and
2004-05
Joint Commissioner of Sales Tax
(Appeals - 2), Vadodra
Central Excise
Act, 1944
Excise Duty
including penalty
and interest
1.13 March 2004 to
July 2006
Commissioner of Central Excise
Custom (Appeals), Daman
Central Excise
Act, 1944
Excise Duty
including penalty
and interest
18.75 September
1999 to April
2000
Custom, Excise and Service Tax
Appellate Tribunal, Ahmedabad
Central Excise
Act, 1944
Excise Duty 69.28 September
2005 to July
2006
Revision Application with the Joint
Secretary, Ministry of Finance,
Department of Revenue
Central Excise
Act, 1944
Service Tax 0.15 April 2004 to
May 2005
The Company is in the process of
filing appeal with Commissioner of
Central Excise and Custom (Appeals)
Neeraj Gupta
Price Waterhouse & Co.
Partner
Membership No. F055158
For and on behalf of
Chartered Accountants
Mumbai, June 30, 2009
Annexure to Auditors' Report referred to in paragraph 3 of the Auditors' Report of even date to the members of Welspun
India Limited on the financial statements for the year ended March 31, 2009

48
BALANCE SHEET AS AT MARCH 31, 2009(Rs. In million)
As atMarch 31, 2009
780.904,821.375,602.27
16,089.09500.03
16,589.12
1,039.83
23,231.22
19,121.194,231.42
14,889.77884.04
15,773.81
54.05
1,046.71
2,105.631,523.91
888.133,705.668,223.33
1,821.6445.04
1,866.68
6,356.65
23,231.22
SCHEDULESAs at
March 31, 2008
SOURCES OF FUNDS
SHAREHOLDERS' FUNDSCapital 1 780.90Reserves and Surplus 2 4,807.29
5,588.19
LOAN FUNDSSecured Loans 3 15,235.71Unsecured Loans 4 182.72
15,418.43
DEFERRED TAX LIABILITY (NET) 5 1,104.00
22,110.62APPLICATION OF FUNDS
FIXED ASSETSGross Block 6A 17,033.88Less: Depreciation 3,327.58Net Block 13,706.30Capital Work-in-progress 1,358.19
15,064.49
Incidental Expenditure Pending Capitalisation/ Allocation 6B 62.78
INVESTMENTS 7 904.75
CURRENT ASSETS, LOANS AND ADVANCESInventories 8 2,901.92Sundry Debtors 9 753.41Cash and Bank Balances 10 920.51Loans and Advances and Other Current Assets 11 2,970.85
7,546.69LESS: CURRENT LIABILITIES AND PROVISIONS 12Liabilities 1,432.07Provisions 36.02
1,468.09
NET CURRENT ASSETS 6,078.60
22,110.62
NOTES TO ACCOUNTS 190
The Schedules referred to herein form an integral part of the Balance Sheet.
This is the Balance Sheet referred toin our report of the even date.
For and on behalf of the Board of Directors
Neeraj Gupta B. K. Goenka R. R. MandawewalaPartner Chairman & Managing DirectorMembership No. F055158For and on behalf ofPrice Waterhouse & Co.Chartered Accountants M. L. Mittal
Executive Director (Finance) Company Secretary
Mumbai, June 30, 2009 Mumbai, June 30, 2009
Joint Managing Director
D. K. Patil
WELSPUN INDIA LIMITEDAnnual Report 2008 -09

Year endedSCHEDULES March 31, 2008
IncomeSales 13 12,440.50Less : Excise Duty 31.06
12,409.44Other Income 14 246.66
12,656.101,015,471,136.03
ExpenditureMaterials and Manufacturing Expenses 15 8,338.77Employees' Remuneration and Benefits 16 963.37Selling, Administration and Other Expenses 17 1,418.92Finance Expenses (Net) 18 676.85Depreciation 847.19
12,245.10
Profit Before Exceptional Item And Taxation 411.00Exceptional Item 3.52Profit Before Taxation From Ordinary Activities 414.52
Profit/ (Loss) Before Taxation From Ordinary Activities
And From Continuing Operations
305.00
Provision For Taxation- Current Tax 44.50- Less : Minimum Alternative Tax Credit Availed (44.50)
-- Deferred Tax (Refer Note 26 on Schedule 19) 142.69- Fringe Benefit Tax 6.40
Profit After Taxation From Ordinary Activities And From Continuing Operations 155.91
Extraordinary Item (net of deferred tax credit of Rs. 3.77 million)
(Refer Note 27 on Schedule 19)
-
Profit/ (Loss) After Taxation From Continuing Operations (A) 155.91
Profit Before Taxation From Ordinary Activities And From Discontinuing Operations 109.52
- Fringe Benefit Tax 2.77Profit After Taxation From Ordinary Activities And From
Discontinuing Operations
(B) 106.75
Profit After Taxation (A) + (B) 262.66Profit and Loss Account Balance Brought Forward 1,430.29Profit Available For Appropriation 1,692.95
AppropriationsTransfer to Capital Redemption Reserve 30.00
Transfer from Debenture Redemption Reserve (29.67)Profit and Loss Account Balance Carried to Balance Sheet 1,692.62
1,692.95
Earnings Per Share (Rs.) - (Refer Note 24 on Schedule 19)- Basic and Diluted before Extraordinary Item 3.59- Basic and Diluted after Extraordinary Item 3.59
NOTES TO ACCOUNTS 19
The Schedules referred to herein form an integral part of the Profit and Loss Account.
This is the Profit and Loss Account referred toin our report of the even date.
For and on behalf of the Board of Directors
Neeraj Gupta B. K. Goenka R. R. MandawewalaPartner Chairman & Managing DirectorMembership No. F055158For and on behalf ofPrice Waterhouse & Co.Chartered Accountants M. L. Mittal
Executive Director (Finance) Company Secretary
Mumbai, June 30, 2009 Mumbai, June 30, 2009
Joint Managing Director
D. K. Patil
Year endedMarch 31, 2009
13,453.559.15
13,444.40171.60
13,616.00
9,454.931,035.18
987.10921.11952.98
13,351.30
264.70-
264.70
(50.47)
27.10(27.10)
-(60.40)
5.993.94
7.33
(3.39)
315.17
2.75312.42
309.031,692.622,001.65
-
-2,001.652,001.65
4.334.23
49
PROFIT AND LOSS ACCOUNT FOR THE YEAR ENDED MARCH 31, 2009(Rs. In million)

As at
March 31, 2008
815.00
110.00
235.00
1,160.00
730.90
50.00
2,710.37
-
2,710.37
72.26
2,638.11
398.38
30.00
428.38
29.67
29.67
-
48.18
-
1,692.62
4,807.29
12,305.02
39.90
2,890.79
15,235.71
0.40
182.32
182.72
1,645.67
8.08
19.02
11.75
4.53
498.29
-
541.67
1,104.00
As at
March 31, 2009SCHEDULE 1 : CAPITAL
Authorised
81,500,000 Equity Shares of Rs. 10 each 815.00
1,100,000 Redeemable Cumulative Preference Shares of Rs. 100 each 110.00
23,500,000 Redeemable Cumulative Preference Shares of Rs. 10 each 235.00
1,160.00Issued, Subscribed and Paid Up
73,089,519 Equity Shares of Rs. 10 each fully paid up 730.90
500,000 0% Redeemable Cumulative Preference Shares of Rs. 100 50.00
each fully paid up (Refer Note 9 on Schedule 19)
SCHEDULE 2 : RESERVES AND SURPLUS
Securities Premium Account
As per last Balance Sheet 2,638.11
Add : Additions during the year -
2,638.11
Less : Premium on Redemption of Preference Shares -
2,638.11
Capital Redemption Reserve
As per last Balance Sheet 428.38
Add : Transferred from Profit and Loss Account -
428.38
Debenture Redemption Reserve
As per last Balance Sheet -
Less : Transferred to Profit and Loss Account -
-
Capital Reserve - Forfeiture of Equity Warrants 48.18
Hedging Reserve Account (294.95)
Profit and Loss Account 2,001.65
#REF! 4,821.37
SCHEDULE 3 : SECURED LOANS
Term Loans (Refer Notes 10(a) and (b) on Schedule 19)
From Banks
- In Rupee 13,049.92
- In Foreign Currency -
Working Capital Loans from Banks (Refer Notes 10(c) and (d) on Schedule 19) 3,039.17
16,089.09
SCHEDULE 4 : UNSECURED LOANS
0.03
Short Term Loans from Banks 500.00
500.03
SCHEDULE 5 : DEFERRED TAX LIABILITY (NET)
(Refer Note 1(viii)(b) on Schedule 19)
Deferred Tax Liability arising on account of Timing differences in :
- Depreciation 1,932.16
Deferred Tax Asset arising on account of Timing differences in:
- Provision for Doubtful Debts/ Advances 8.50
- Provision for Unpaid Statutory Dues under Section 43B of the Income Tax Act, 1961 2.59
- Provision for Employee Benefits 14.66
- Provision for Diminution in Value of Investments -
- Unabsorbed Depreciation as per the Income Tax Act, 1961 865.58
- Provision for Others 1.00
892.33
1,039.83
Interest Free Sales Tax Loan (Repayable in six annual installments for each
disbursement till October 7, 2010) (Repayable within one year Rs. 0.01 million;
March 31, 2008 : Rs. 0.37 million)
780.90780.90
50
SCHEDULES ANNEXED TO AND FORMING PART OF THE BALANCE SHEET AS AT MARCH 31, 2009(Rs. In million)
WELSPUN INDIA LIMITEDAnnual Report 2008 -09

51
SC
HE
DU
LE6
A:
FIX
ED
AS
SE
TS
(Re
fer
No
tes
1(i
i),
(iv),
(v),
(xii
),(x
iii)
,2
0a
nd
23
on
Sch
ed
ule
19
)R
s.m
illi
on
PA
RT
ICU
LAR
SN
ET
BLO
CK
As
at
Ma
rch
31
,2
00
8
Ad
dit
ion
sd
uri
ng
the
ye
ar
De
leti
on
s/
Ad
just
me
nts
du
rin
gth
ey
ea
r
As
at
Ma
rch
.3
1,
20
09
Acc
um
ula
ted
up
toM
arc
h
31
,2
00
8
For
the
Yea
rO
nD
ele
tio
ns
du
rin
gth
ey
ea
r
Acc
um
ula
ted
up
to
Ma
rch
31
,2
00
9
As
at
Ma
rch
31
,
20
09
As
at
Ma
rch
31
,
20
08
Fre
eh
old
Lan
d7
2.6
52
6.6
0-
99
.25
--
--
99
.25
72
.65
Bu
ild
ing
s2
,54
4.9
83
92
.05
-2
,93
7.0
32
61
.62
70
.29
-3
31
.91
2,6
05
.12
2,2
83
.36
Lea
seh
old
Imp
rove
me
nts
2.1
74
4.9
8-
47
.15
0.5
61
.41
-1
.97
45
.18
1.6
1
Pla
nt
an
dM
ach
ine
ry(R
efe
rN
ote
1b
elo
w)
14
,07
8.3
21
,61
3.1
18
0.2
81
5,6
11
.15
2,9
20
.84
85
1.0
74
3.0
93
,72
8.8
21
1,8
82
.33
11
,15
7.4
8
Ve
hic
les
41
.93
0.7
23
.72
38
.93
13
.39
3.7
91
.32
15
.86
23
.07
28
.54
Fu
rnit
ure
an
dF
ixtu
res
98
.72
40
.80
3.0
51
36
.47
25
.60
7.1
51
.07
31
.68
10
4.7
97
3.1
2
Off
ice
Eq
uip
me
nt
38
.78
32
.37
2.7
26
8.4
38
.13
3.4
30
.94
10
.62
57
.81
30
.65
Co
mp
ute
rH
ard
wa
re1
23
.93
6.6
32
.94
12
7.6
27
2.6
71
3.6
82
.72
83
.63
43
.99
51
.26
Co
mp
ute
rS
oft
wa
re3
0.8
42
2.7
6-
53
.60
23
.21
2.1
6-
25
.37
28
.23
7.6
3
Go
od
wil
l1
.56
--
1.5
61
.56
--
1.5
6-
-
TO
TAL
17
,03
3.8
82
,18
0.0
29
2.7
11
9,1
21
.19
3,3
27
.58
95
2.9
84
9.1
44
,23
1.4
21
4,8
89
.77
13
,70
6.3
0
Pre
vio
us
Yea
r1
3,9
59
.77
3,1
10
.96
36
.85
17
,03
3.8
82
,49
0.8
58
47
.19
10
.46
3,3
27
.58
Ca
pit
al
Wo
rk-i
n-p
rog
ress
[(in
clu
din
gC
ap
ita
lA
dva
nce
sR
s.6
1.6
2m
illi
on
(Ma
rch
31
,2
00
8:
Rs.
18
4.1
0m
illi
on
)](R
efe
rN
ote
2b
elo
w).
88
4.0
41
,35
8.1
9
No
tes
15
,77
3.8
11
5,0
64
.49
1)
De
leti
on
s/A
dju
stm
en
tsfo
rP
lan
ta
nd
Ma
chin
ery
incl
ud
es
ad
just
me
nts
for
the
cap
ita
lsu
bsi
dy
of
Rs.
11
.03
mil
lio
n
(Pre
vio
us
yea
r:
Rs.
14
.79
mil
lio
n)
gra
nte
du
nd
er
the
Tech
no
log
yU
pg
rad
ati
on
Fu
nd
(TU
F)
Sch
em
e.
2)
Ca
pit
al
Wo
rk-i
n-p
rog
ress
incl
ud
es
ad
just
me
nt
for
the
cap
ita
lsu
bsi
dy
of
Rs.
28
.24
mil
lio
n(P
revio
us
Yea
r:
Rs.
Nil
)
gra
nte
du
nd
er
the
Tech
no
log
yU
pg
rad
ati
on
Fu
nd
(TU
F)
Sch
em
e.
GR
OS
SB
LOC
KD
EP
RE
CIA
TIO
N
SC
HE
DU
LES
AN
NE
XE
DT
OA
ND
FOR
MIN
GP
AR
TO
FT
HE
BA
LAN
CE
SH
EE
TA
SA
TM
AR
CH
31
,2
00
9

(Refer Notes 1(iii) and 20 on Schedule 19)
As atAs at
March 31, 2009 March 31, 2008
Opening Balance (A) 62.78 41.24
Add :
Raw Material Consumption during Trial Run 81.15 -
Stores and Spares Consumed 4.77 -
Dyes and Chemicals Consumed 15.05 -
Packing Material Consumed 8.47 -
Job Work Expenses 8.45 -
Power and Fuel 4.48 3.03
Freight, Forwarding and Coolie Charges 3.84 0.20
Repairs and Maintenance
- Others 0.10 0.25
Salaries, Wages, Bonus and Allowances 59.07 26.63
Contribution to Provident and Other Funds 4.01 0.65
Staff and Labour Welfare 1.01 0.34
Rent - 1.91
Rates and Taxes 0.43 1.49
Printing and Stationery 0.19 0.02
Travelling and Conveyance 5.83 9.17
Legal and Professional Charges 4.79 5.84
Insurance 1.55 3.18
Communication 0.11 0.66
Loss on Redemption/ Sale of Units of Mutual Funds (Net) 0.03 -
Postage and Courier 0.65 0.09
Vehicle Expenses 0.14 -
Advertising and Sales Promotion 9.52 -
Interest on Fixed Loans 97.52 138.13
Interest on Working Capital Loans 0.02 0.14
Discounting and Bank Charges 1.00 0.66
Loan Processing Charges - 2.40
Miscellaneous 8.02 4.86
(B) 320.20 199.65
Less :
Sales during Trial Run 118.83 -
Sale of Scrap 0.58 -
Export Benefits 8.90 -
Interest on Deposit Accounts - Gross 13.48 33.99
(Tax Deducted at Source Rs. 3.06 million; Previous Year : Rs. 7.24 million)
Interest on Bonds - Gross - 6.42
(Tax Deducted at Source : Rs. Nil; Previous Year : Rs. 1.21 million)
Profit on Redemption/ Sales of Units of Mutual Funds - 2.29
Dividend 2.91 30.09
Increase in Stocks During Trial Run 46.44 -
(C) 191.14 72.79
(A) + (B) - (C) 191.84 168.10
Less : Transferred to :
Plant and Machinery 110.36 87.11
Buildings 27.43 18.21
Incidental Expenditure Pending Capitalisation/ Allocation 54.05 62.78
SCHEDULE 6B : INCIDENTAL EXPENDITURE PENDING CAPITALISATION/ ALLOCATION
52
SCHEDULES ANNEXED TO AND FORMING PART OF THE BALANCE SHEET AS AT MARCH 31, 2009(Rs. In million)
WELSPUN INDIA LIMITEDAnnual Report 2008 -09

As atMarch 31, 2009
As atMarch 31, 2008
53
SCHEDULES ANNEXED TO AND FORMING PART OF THE BALANCE SHEET AS AT MARCH 31, 2009(Rs. In million)
SCHEDULE 7 : INVESTMENTS(Refer Note 1(vi) on Schedule 19)
Long Term
Non - Trade
Investment in Government Securities
National Saving Certificates
(Lodged with District Magistrate, Valsad)
Trade (At Cost)
(Unquoted)
In Wholly Owned Subsidiaries
1,500,000 Equity Shares of US $ 0.10 each, fully paid up of Welspun USA Inc.
(During the year, additional contribution of Rs. 275.78 million has been made)
5,000 Equity Shares of GBP 1 each, fully paid up of Welspun Holdings Private Limited,
Cyprus (Of the above, 1,000 shares have been pledged with bank for securingthe loan given to Welspun Home Textiles UK Limited, U.K.; the wholly ownedsubsidiary of Welspun Holdings Private Limited, Cyprus)
Nil (March 31, 2008 : 600) Equity Shares of CHF 1,000 each, CHF 200 paid up of
Welspun AG, Switzerland (Refer Note 6 on Schedule 19)
10,000 Equity Shares of Rs. 10 each fully paid up of BESA Developers andInfrastructure Private Limited
500,000 (March 31, 2008 : Nil) Equity Shares of Rs. 10 each fully paid up ofWelspun Global Brands Limited
50,000 (March 31, 2008 : Nil) Equity Shares of Rs. 10 each fully paid up ofWelspun Investments Limited
In Others
2,750,000 Equity Shares of Rs. 10 each fully paid up of Welspun Zucchi Textiles Limited
9,800,000 Equity Shares of Rs. 10 each fully paid up of Welspun Retail Limited
100 Equity Shares of Rs. 10 each fully paid up of Welspun Power and Steel Limited
3,320,000 Equity Shares of Rs. 10 each fully paid up of MEP Cotton Limited
Share Application Money Pending Allotment
* - Less than Rs. 10,000
(Quoted)283,500 Equity Shares of Rs. 10 each fully paid up of Welspun Syntex Limited
Less : Provision for Diminution
4,033,000 (March 31, 2008 : 7,133,000) Equity Shares of Rs. 5 each fully paid up ofWelspun Gujarat Stahl Rohren Limited
Current (At Lower of Cost and Fair Value)
Non Trade - (Unquoted, Unlisted)Investment In Mutual Funds Units of Rs. 10 each
Nil (March 31, 2008 : 600,357) DWS Installment Cash Plus Fund - Daily Dividend Plan
Nil (March 31, 2008 : 241,114) LICMF Liquid Fund - Dividend Plan
Nil (March 31, 2008 : 4,437,300) LICMF Floating Rate Fund - Short Term Plan -Dividend Option
Nil (March 31, 2008 : 23,668) Principal Floating Rate Fund - Daily DividendReinvestment Plan
Nil (March 31, 2008 : 13,490) Reliance Liquid Fund - Treasury Plan Retail Option
Investment In BondsNil (March 31, 2008 : 217) Zero Coupon Redeemable Deep Discount (2007
Series-II) Punjab Infrastructure Development Bonds
Aggregate of Unquoted Investments - At Book Value
Aggregate of Quoted Investments - At Book Value
- At Market Value
0.01
282.67
337.06
-
0.10
10.00
0.50
34.56
244.63
*
99.50
0.05
18.94
13.34
5.6032.03
-
-
-
-
-
-
1,046.71
1,009.08
37.63
301.32
0.01
6.89
337.06
4.05
0.10
-
-
34.56
244.63
*
99.50
0.05
18.94
13.34
5.6056.65
6.18
2.65
45.05
0.24
0.14
61.39
904.75
842.50
62.25
2,740.78

54
SCHEDULES ANNEXED TO AND FORMING PART OF THE BALANCE SHEET AS AT MARCH 31, 2009(Rs. In million)
WELSPUN INDIA LIMITEDAnnual Report 2008 -09
As at
March 31, 2008
SCHEDULE 8 : INVENTORIES
(Refer Note 1(vii) on Schedule 19)
Raw Materials 758.44
Work-in-Process 1,256.47
Finished Goods 622.47
Stores, Spares, Dyes and Chemicals 261.16
Traded Goods 3.38
2,901.92
SCHEDULE 9 : SUNDRY DEBTORS
(Refer Note 11(a) on Schedule 19)
Unsecured
Debts Outstanding for a period exceeding six months :
- Considered Good 45.00
- Considered Doubtful 10.93
55.93
Other Debts :
- Considered Good 708.41
- Considered Doubtful 5.42
713.83
Less : Provision for Doubtful Debts 16.35
753.41
SCHEDULE 10 : CASH AND BANK BALANCES
Cash on Hand 1.84
Cheques on Hand 6.21
Balances with Scheduled Banks
- In Current Accounts 168.83
- In Fixed Deposit Accounts 743.37
- In Exchange Earners Foreign Currency Accounts (USD 8,140.56; Previous Year :
USD 5,976.91)
0.26
920.51
SCHEDULE 11 : LOANS, ADVANCES AND OTHER CURRENT ASSETS
(Refer Notes 11(b) and 25 on Schedule 19)
LOANS AND ADVANCES
UnsecuredLoans to Subsidiary Companies
- Welspun USA Inc. 65.44
- Welspun Holdings Private Limited, Cyprus 393.92
- Welspun AG, Switzerland 155.97
- BESA Developers and Infrastructure Private Limited 31.50
646.83
Loan to Others -
Advance to Subsidiary Companies
6.44
- Welspun AG, Switzerland -
-
Advances Recoverable in Cash or in Kind or for Value to be Received
- Considered Good 236.12
- Considered Doubtful 7.42
243.54
Less : Provision for Doubtful Advances 7.42
236.12
Balances with Customs, Excise, Sales Tax and other Government Authorities 828.21
Advance Tax and Tax Deducted at Source (Net of Provision of Rs. 257 million; 34.39
March 31, 2008 : Rs. 229.90 million)
Minimum Alternative Tax Credit Entitlement 182.40
Deposits 348.00
2,282.39
- Welspun Holdings Private Limited, Cyprus
- Welspun Global Brands Limited
(includes deposits aggregating Rs. 536.31 million; March 31, 2008: Rs. 446.61 million pledged
with banks against term loans, overdraft, letters of credit and bank guarantee facilities)
As at
March 31, 2009
504.21
1,077.64
332.41
191.37
-
2,105.63
4.02
16.38
20.40
1,519.89
-
1,519.89
16.38
1,523.91
1.16
15.38
253.83
617.35
0.41
888.13
320.80
348.60
150.34
31.50
851.24
42.68
0.60
1.33
4.75
296.07
8.63
304.70
8.63
296.07
507.78
44.46
209.50
306.54
2,264.95

As atMarch 31, 2009
As atMarch 31, 2008
55
SCHEDULES ANNEXED TO AND FORMING PART OF THE BALANCE SHEET AS AT MARCH 31, 2009(Rs. In million)
As atMarch 31, 2008
621.11
-
38.49
7.79
21.07
688.46
2,970.85
0.75
1,195.78
-
53.94
-
39.11
17.2788.9336.29
1,432.07
1.45
-
34.57
36.021,468.09
OTHER CURRENT ASSETSTechnology Upgradation Fund Credit Receivable
Receivable from Welspun Holdings Private Limited, Cyprus (Refer Note 6 on Schedule 19)
Interest Accrued on Loans given to Subsidiaries
Interest Receivable under Subvention Scheme
Interest Accrued on Deposits
SCHEDULE 12 : CURRENT LIABILITIES AND PROVISIONS
CURRENT LIABILITIESSundry Creditors
- Total Outstanding Dues of Micro Enterprises and Small Enterprises (Refer Note 14 on Schedule 19)
- Total Outstanding Dues of Creditors other than Micro Enterprises and Small Enterprises
Mark-to-Market Loss on Options/ Forward Contracts
Amounts due to Subsidiary Companies
- Welspun USA Inc.
- Welspun Mexico S.A. de C.V
- Christy UK Limited
Advance Received from CustomersTemporary Overdraft with Scheduled BanksInterest Accrued but not Due
PROVISIONS
Fringe Benefit Tax (Net of Advance Tax Rs. 36.11 million; March 31, 2008 : Rs. 27.82 million)
Gratuity (Refer Note 1(ix)(b) and 18 on Schedule 19)
Leave Entitlement (Refer Note 1(ix)(c) on Schedule 19)
As atMarch 31, 2009
525.33
739.12
112.86
8.60
54.80
1,440.71
3,705.66
0.79
1,080.50
596.77
48.92
0.04
0.12
5.279.29
79.941,821.64
1.90
1.61
41.53
45.041,866.68

Year ended
March 31, 2008
778.45
5,488.08
6,266.53
758.44
5,508.09
84.80
267.35
1,053.24
1,320.59
-
-
-
-
622.47
1,256.47
1,878.94
(558.35)
212.18
1,062.34
237.34
116.88
-
1,018.25
621.19
33.51
2.54
3,304.23
8,338.77
Year ended
March 31, 2009
5,148.88
311.78
323.71
3,670.56
9,454.93
SCHEDULES ANNEXED TO AND FORMING PART OF THE PROFIT AND LOSS ACCOUNT FOR THE YEAR ENDED MARCH 31, 2009(Rs. In million)
WELSPUN INDIA LIMITEDAnnual Report 2008 -09
56
SCHEDULE 13 : SALES
Sales - Export
Sales - Local
Export Benefits
SCHEDULE 14 : OTHER INCOME
Rent (Tax Deducted at Source Rs. 1.90 million, Previous Year : Rs. 2.67 million)
Dividend - Trade Investments
Dividend - Others
Insurance Claim
Profit on Redemption/ Sale of Units in Mutual Funds
Profit on Sale of Bonds
Profit on Sale of Shares
Liabilities Written Back as no Longer Required
Provision for Doubtful Advances Written Back
Provision for Doubtful Debts Written Back
Profit on Cancellation of Forward Contracts
Exchange Gain/ (Loss) - Net
Job Work and Processing Charges
Excise and Sales Tax Benefit
Miscellaneous
10,782.13
997.46
11,779.59
660.91
12,440.50
11.18
7.13
18.70
17.05
1.23
4.97
-
0.53
4.89
0.94
114.92
(2.18)
22.23
36.55
8.52
246.66
8,402.05
4,151.48
12,553.53
900.02
13,453.55
7.85
10.70
5.86
0.43
3.60
2.00
221.35
1.43
-
-
21.13
(231.80)
25.95
92.30
10.80
171.60
Raw Materials Consumed
Opening Stock
Add: Purchases
Less: Closing Stock
Cost of Traded Goods Sold
Decrease/ (Increase) in Stocks
Opening Stock
Finished Goods
Work-in-Process
Add: Stock Transferred from Trial Run Production
Finished Goods
Work-in-Process
Less: Loss of Finished Goods and Work-in-Process inventory due to floods
Closing Stock
Finished Goods
Work-in-Process
Manufacturing Expenses
Stores and Spares Consumed
Dyes and Chemicals Consumed
Contract Labour Charges
Job Work Expenses
Excise Duty On Closing Stocks
Power, Fuel and Water Charges
Packing Charges
Repairs and Maintenance:
Plant and Machinery
Factory Building
758.44
4,894.65
5,653.09
504.21
622.47
1,256.47
1,878.94
16.03
30.41
46.44
191.62
332.41
1,077.64
1,410.05
219.89
1,077.59
212.38
89.71
2.68
1,408.47
633.06
20.42
6.36
SCHEDULE 15 : MATERIALS AND MANUFACTURING EXPENSES

Year endedMarch 31, 2008SCHEDULE 16 : EMPLOYEES' REMUNERATION AND BENEFITS
Salaries, Wages, Allowances and Other Benefits (Refer Note 18 on Schedule 19) 842.41Contribution to Provident and Other Funds (Refer Note 18 on Schedule 19) 62.32Managerial Remuneration (Refer Note 13 on Schedule 19) 17.43Staff and Labour Welfare 41.21
963.37
SCHEDULE 17 : SELLING, ADMINISTRATION AND OTHER EXPENSES
Claims, Discounts and Rebates 213.38Brokerage and Commission 55.08Freight, Forwarding and Coolie Charges 464.17Repairs and Maintenance - Others 10.59Directors' Sitting Fees 0.18Rent 59.81Rates and Taxes 6.93Printing and Stationery 10.41Travelling and Conveyance 91.09Legal and Professional Charges 40.73Insurance 56.17Communication 12.60Postage and Courier 22.96Loss on Sale/ Discarding of Fixed Assets (Net) 6.91Provision for Doubtful Debts 13.41Provision for Doubtful Advances 5.28Debts/ Advances Written off 5.57Design, Development and Testing Expenses 11.58Excise Benefits Receivable Written Off 43.23Royalty 2.10Advertising and Sales Promotion 223.26Donations 5.36Auditors' Remuneration- As Auditors 3.90- In other capacity - As Tax Auditors 0.60- Certification and Other Matters 0.22- Out of Pocket Expenses 0.09Miscellaneous 53.31
1,418.92
SCHEDULE 18 : FINANCE EXPENSES (NET)
Interest on Fixed Loans 409.42(net of interest subsidy of Rs. 534.47 million, Previous Year : Rs. 412.33 million)Interest on Debentures 11.26Interest on Working Capital Loans 270.09(net of interest subvention of Rs. 24.37 million, Previous Year : Rs. 38.64 million)Interest to Others 4.92Discounting and Bank Charges 64.31
760.00Less:Interest on Fixed Deposits -Gross 24.54(Tax Deducted at Source Rs. 1.83 million, Previous Year : Rs. 4.59 million)Interest on Loans given to Subsidiaries and Affiliates 34.28(Tax Deducted at Source Rs. 0.88 million, Previous Year : Rs. 0.99 million)Interest on Bonds (Tax Deducted at Source Rs. Nil, Previous Year : Rs. 0.44 million) 2.69Interest on Others - Gross 0.10(Tax Deducted at Source Rs. 0.01 million, Previous Year : Rs. 0.02 million)Cash Discount received 21.54
83.15
676.85
Year endedMarch 31, 2009
919.3474.758.17
32.921,035.18
91.8324.65
197.6913.650.14
88.974.148.37
88.42
64.6536.9520.5321.7215.080.031.214.25
12.98--
231.921.76
3.120.480.940.10
53.52987.10
634.28
6.53355.21
8.2055.47
1,059.69
43.63
79.78
-0.46
14.71138.58
921.11
57
(Rs. In million)
SCHEDULES ANNEXED TO AND FORMING PART OF THE PROFIT AND LOSS ACCOUNT FOR THE YEAR ENDED MARCH 31, 2009

SCHEDULES ANNEXED TO AND FORMING PART OF THE BALANCE SHEET AS AT MARCH 31, 2009 AND
PROFIT AND LOSS ACCOUNT FOR THE YEAR ENDED MARCH 31, 2009
SCHEDULE 19: NOTES TO ACCOUNTS
(i) Accounting Convention
The Financial Statements are prepared to comply in all material aspects with all the applicable accounting principles in
India, the applicable accounting standards notified under sub-section (3C) of Section 211 of the Companies Act, 1956
(the “Act”) and the other relevant provisions of the Act.
(ii) Fixed Assets
Fixed Assets are stated at cost (net of cenvat credit, wherever applicable) less accumulated depreciation and
impairment loss, if any. The cost includes cost of acquisition, construction, erection, installation etc., preoperative
expenses (including trial run) and borrowing costs incurred during pre-operational period. Cost of software includes
license fees and implementation/ integration expenses.
(iii) Incidental Expenditure Pending Capitalisation/ Allocation
Incidental expenditure pending capitalisation/ allocation represents expenses incurred during setting-up of
manufacturing facility including preoperative expenses for trial runs and borrowing cost incurred prior to the date of
commencement of commercial production. These expenses are net of sales during trial run and other income accrued
prior to the commencement of commercial production.
(iv) Borrowing Costs
Borrowing costs directly attributable to the acquisition/ construction of fixed assets are apportioned to the cost of the
fixed assets up to the date on which the asset is put to use/ commissioned.
(v) Depreciation
(a) Depreciation on fixed assets, other than leasehold improvements, is provided on straight-line method at the rates
and in the manner prescribed under Schedule XIV to the Act. Depreciation on additions/ deletions to fixed assets
is calculated pro-rata from/ up to the date of such additions/ deletions.
(b) Leasehold improvements are amortised on straight-line basis over the primary period of lease.
(c) Computer software is amortised on the straight-line method over a period of five years.
(d) Assets individually costing Rs. 5,000 or less are fully depreciated in the year of purchase.
(vi) Investments
Long term investments are stated at cost less provision, if any, for diminution in value other than temporary. Current
investments are carried at the lower of cost and fair value.
(vii) Inventories
(a) Inventories are valued at lower of cost and net realisable value.
(b) Cost of raw materials and stores and spares is determined on weighted average basis. Cost of traded goods is
determined on first-in-first-out basis. Cost of work-in-process and finished goods comprises of raw material,
direct labor, other direct costs and related overheads but exclude interest expense. Net realisable value is the
estimate of the selling price in the ordinary course of the business, less the estimated costs of completion and
estimated selling expenses.
(viii)Accounting for Taxes on Income/Minimum Alternate Tax Credit
(a)
The current tax is determined as the amount of tax payable in respect of taxable income for the year as per the
Income Tax Act, 1961, of India.
(b)
Deferred tax resulting from timing differences between book and tax profits is accounted for under the
liability method, at the current/ substantially enacted rate of tax to the extent that the timing differences are
expected to crystallise.
Deferred tax assets arising in situations where there are brought forward losses and unabsorbed depreciation
as per the Income Tax Act, 1961, of India, are recognised only when there is a virtual certainty supported by
convincing evidence that such assets will be realised.
1. Significant Accounting Policies
Current Taxation
Deferred Taxation
�
�
58
WELSPUN INDIA LIMITEDAnnual Report 2008 -09

(c)
Minimum Alternate Tax (MAT) paid in accordance with tax laws, which give rise to future economic benefits in the
form of adjustment of future tax liability, is recognized as an asset only when, based on convincing evidence, it is
probable that the future economic benefits associated with it will flow to the Company and the assets can be
measured reliably.
(ix) Employee Benefits
(a)
The Company contributes on a defined contribution basis to Employee's Provident Fund, Employee's State
Insurance Fund and Employee's Pension Scheme towards post employment benefits, all of which are
administered by the respective Government authorities, and has no further obligation beyond making its
contribution, which is expensed in the year to which it pertains.
(b)
The Company has a Defined Benefit Plan namely Gratuity for all its employees. The liability for the defined benefit
plan of Gratuity is determined on the basis of an actuarial valuation, calculated using projected unit credit method,
by an independent actuary at the year end.
Gratuity Fund is recognized by the income tax authorities and is administered through trustees. The Employee's
Gratuity Trust takes group gratuity policies with insurance companies.
Actuarial gains and losses which comprise experience adjustments and the effect of changes in actuarial
assumptions are recognised in the Profit and Loss Account.
(c)
The employees of the Company are entitled to leave as per the leave policy of the Company. The liability in respect
of unutilised leave balances is provided based on an actuarial valuation carried out by an independent actuary as
at the year end and charged to the Profit and Loss Account.
(x) Foreign Currency Transactions, Derivative Instruments and Hedge Accounting
(a) Foreign currency transactions are recorded at the exchange rates prevailing on the date of such transactions.
Monetary assets and liabilities as at the Balance Sheet date are translated at the rates of exchange prevailing at the
date of the Balance Sheet. Gains and losses arising on account of differences in foreign exchange rates on
settlement/ translation of monetary assets and liabilities are recognised in the Profit and Loss Account. Non-
monetary foreign currency items are carried at cost.
(b) In respect of forward contracts, other than forward contracts in respect of firm commitments and highly probable
forecast transactions, the premium or discount arising at the inception of forward exchange contract, is amortised
as expense or income over the life of the contract. Exchange differences on such contracts are recognised in the
Profit and Loss Account in the reporting period in which the exchange rates change. Any profit or loss arising on
cancellation or renewal of such a forward exchange contract is recognised as income or as expense for the period.
(c) In respect of forward contracts and currency options taken to hedge the risks associated with foreign currency
fluctuations relating to firm commitments and highly probable forecast transactions, with effect from April 1,
2008, the Company has early adopted the principles of AS 30 'Financial Instruments: Recognition and
Measurement”. Accordingly, foreign currency fluctuations relating to firm commitments and highly probable
forecast transactions are fair valued at each reporting date.
Changes in the fair value of these hedging instruments that are designated and considered as effective hedges of
highly probable forecasted transactions are recognised directly in shareholders' funds under 'Hedging Reserve
Account' to be recognised in the Profit and Loss Account when the underlying transaction occurs. Changes in the
fair value of the hedging instruments that do not qualify for hedge accounting are recognised in the Profit and Loss
Account as they arise.
(xi) Revenue Recognition
(a) Sales revenue is recognised on transfer of significant risks and rewards of ownership of the goods to the buyer.
Domestic sales are recognised on dispatch to customers. Export sales are recognised on the date of cargo receipts,
bill of lading or other relevant documents, in accordance with the terms and conditions for sales. Realised
exchange differences on export debtors are included in sales.
Minimum Alternate Tax Credit
Defined Contribution Plans
Defined Benefit Plans
Employee Leave Entitlement
SCHEDULES ANNEXED TO AND FORMING PART OF THE BALANCE SHEET AS AT MARCH 31, 2009 AND
PROFIT AND LOSS ACCOUNT FOR THE YEAR ENDED MARCH 31, 2009
59

Alleged improper re-credit of duty paid through PLA under Notification no. 39/2001 –CE
dated July 31, 2001 in respect of goods sold from the factory during the period from
February 2006 to September 2007. The Assistant Commissioner of Central Excise has
passed the order against the Company. The Company has preferred an appeal with the
Commissioner of Central Excise (Appeals) – Rajkot.
318.58 -
(b) Export benefits arising from Duty Entitlement Pass Book (DEPB) and Duty Drawback scheme are recognised on
shipment.
(c) Dividends are accounted for when the right to receive dividend is established.
(xii) Government Grants
Government grants are accounted for when it is reasonably certain that ultimate collection will be made. Capital grants
relating to specific assets are reduced from the gross value of the Fixed Assets. Revenue grants, in the nature of interest
subsidy under the Technology Upgradation Fund Scheme (TUFS) are adjusted against 'Interest on Fixed Loans'.
Revenue grants in the nature of interest subvention on 'Rupee Export Credit Loans' are adjusted against 'Interest on
Working Capital Loans'.
(xiii)Impairment of Assets
The Company assesses at each balance sheet date whether there is any indication that an asset may be impaired. If any
such indication exists, the Company estimates the recoverable amount of the asset. If such recoverable amount of the
asset or recoverable amount of the cash generating unit to which the asset belongs is less than its carrying amount, the
carrying amount is reduced to its recoverable amount. The reduction is treated as an impairment loss and is
recognised in the Profit and Loss Account. If at the Balance Sheet date there is an indication that if a previously
assessed impairment loss no longer exists, the recoverable amount is reassessed and the asset is reflected at the
recoverable amount.
(xiv)Provisions and Contingent Liabilities
The Company recognises a provision when there is a present obligation as a result of a past event that probably
requires an outflow of resources and a reliable estimate can be made of the amount of the obligation. A disclosure for a
contingent liability is made when there is a possible obligation or a present obligation that may, but probably will not,
require an outflow of resources. Where there is a possible obligation or a present obligation but the likelihood of
outflow of resources is remote, no provision or disclosure as specified in Accounting Standard 29 “ Provisions,
Contingent Liabilities and Contingent Assets”, issued by the Institute of Chartered Accountants of India is made.
(xv) Employees Stock Option Schemes
Stock options granted to employees under Employee Stock Option Schemes are accounted as per the accounting
treatment prescribed in the Guidance Note on Accounting for Employee Share-based Payments issued by the Institute
of Chartered Accountants of India.
(xvi)Accounting Estimates
The preparation of financial statements requires estimates and assumptions to be made that affect the reported
amounts of assets and liabilities on the date of financial statements and the reported amounts of revenue and
expenses during the reporting period. Difference between the actual results and the estimates are recognized in the
period in which the results are known/ materialised.
2. Contingent Liabilities not provided for :
60
Description
As at
March 31, 2009
Rs. million
As at
March 31, 2008
Rs. million
Excise, Customs and Service Tax
Alleged excess clearance of cotton yarn in Domestic Tariff Area over and above the limit
specified in para 9.9 (b) of the Exim Policy 1997-2002. The Company has deposited
Rs. 0.70 million under protest and filed an appeal with the Customs, Excise and Service Tax
Appellate Tribunal (CESTAT), Ahmedabad against the order passed by Commissioner
(Appeals) of Central Excise and Customs.
19.45 18.50
Alleged manufacture and clearance of texturised yarn without payment of excise duty
and without entering into statutory records. Further, there was an alleged shortage of
Polyester Texturised yarn in physical stock as compared to the stock as per statutory
records. The case has been settled in the Company’s favour during the current year.
- 12.76
318.58
WELSPUN INDIA LIMITEDAnnual Report 2008 -09
SCHEDULES ANNEXED TO AND FORMING PART OF THE BALANCE SHEET AS AT MARCH 31, 2009 AND
PROFIT AND LOSS ACCOUNT FOR THE YEAR ENDED MARCH 31, 2009

Description
As at
March 31, 2009
Rs. million
As at
March 31, 2008
Rs. million
Alleged improper grant of refund for duty paid through PLA by Assistant Commissioner
under Rule 18 of Central Excise Rules during the period from September 2005 to July
2006. The Commissioner (Appeals) of Customs and Central Excise has passed the order
against the Company. The Company has filed Revision Application with the Joint
Secretary, Ministry of Finance, Department of Revenue.
69.28 -
Alleged improper cenvat credit availed and non payment of excise duty under
Notification No. 214/86 – CE dated 25-03-1986, on furnace oil used for manufacturing
of goods on job work during the period April 2002 to March 2008. The Company has
filed its reply against the show cause notices issued by Joint Commissioner and
Commissioner of Customs and Central Excise, Daman. During the year, based on the
review and comments made by the Committee of Chief Commissioners, the
Commissioner has made an application to CESTAT to withdraw his order passed in April
2008 in respect of non payment of excise duty.
3.33 72.60
Alleged non-payment of cess on cotton consumed during the period April 2002 to
February 2007 under 'The Produce Cess Act, 1966'. The Company has filed appeals with
Commissioner of Custom and Central Excise, Daman against the orders passed by the
Assistant Commissioner of Custom and Central Excise, Vapi. The case has been settled
in the Company’s favour during the current year.
- 1.56
Alleged improper abatement of service tax on payments made to Goods Transport
Agency under Notification No. 32/04-ST dated 3 -12-2004. The Company has filed its
reply against the show cause notice issued by the Commissioner of Central Excise and
Customs, Daman.
45.51 29.27
Alleged service tax credit based on improper documents.The Company has received an
order from Commissioner, Centr al Excise & Customs, Daman demanding the amount of
duty, interest and penalty. The Company filed an appeal against the order with
Commissioner of Central Excise & Customs (Appeals), Daman
0.15 0.15
Alleged procurement of furnace oil without payment of duty by wrongly availing the
exemptions contained in the Notification No. 1/95-CE 04-01-1995. The excise
department had preferred an appeal with the Supreme Court against CESTAT,
Ahmedabad order. The Supreme Court has upheld the matter in the Company’s favour
in January 2009.
- 14.81
Alleged procurement of furnace oil without payment of duty by wrongly availing the
exemptions contained in the Notification No. 53/97-CUS 03-06-1997. The excise
department had preferred a civil appeal with the Supreme Court against CESTAT,
Ahmedabad’s order passed in favour of the Company. The Supreme Court has upheld
the matter in the Company’s favour in January 2009.
- 11.47
Alleged improper cenvat credit availed on “racks” classified as capital goods, which are
used for storage of finished goods.
The Company received an order from Additional Commissioner, Central Excise &
Customs, Daman dated 11.02.2009 demanding the amount of duty, interest and
penalty. The Company has paid Rs. 0.07 million under protest and filed an appeal
against the order with Commissioner of Central Excise & Customs (Appeals), Daman in
March 2009.
1.82 -
Alleged improper availment of cenvat credit on service tax paid on insurance premia
paid for availing insurance services that are not used in or in relation to manufacture of
final products.
The Company has received a show-cause notice from Assistant Commissioner of Central
Excise and Customs, Vapi against which it has filed a reply.
0.03 -
Stamp Duty :
Disputed stamp duty liability on De-merger Scheme. The Company has paid Rs. 1.74
million under protest.
4.46 4.46
Sales Tax :
The Deputy Commissioner of Sales Tax has issued an assessment order for the financial
year 2003-04 and raised the demand on purchase of Furnace oil during the year 2003-
04 in respect of purchases made by the Company at a concessional rate of tax. The
Company has deposited Rs. 0.09 million under protest and has filed an appeal with the
Joint Commissioner of Sales Tax, Vadodra.
1.07 0.97
The Deputy Commissioner of Sales Tax has issued an assessment order for the financial
year 2004-05 and raised the demand on purchase of Furnace oil during the year 2004-
05 in respect of purchases made by the Company at a concessional rate of tax. The
Company has filed an appeal with the Joint Commissioner of Sales Tax, Vadodra.
6.75 -
61
SCHEDULES ANNEXED TO AND FORMING PART OF THE BALANCE SHEET AS AT MARCH 31, 2009 AND
PROFIT AND LOSS ACCOUNT FOR THE YEAR ENDED MARCH 31, 2009

62
FEMA :
The Appellate Tribunal for Foreign Exchange, New Delhi has issued an order for
contravention of the provision of Section 18(2) of the Foreign Exchange Regulation Act,
1973 read with Section 49(3) and (4) of Foreign Exchange Management Act, 1999 in
respect of non-realisation of export proceeds. The Company has filed an appeal with
the Delhi High Court.
0.90 0.90
Others:
Uncalled liability of 800 CHF per share, in respect of partly paid 600 equity shares of
Welspun AG, a subsidiary company
- 19.37
Accumulated dividend on cumulative redeemable preference shares 17.41 17.41
Claims against the Company not acknowledged as debts 2.65 2.17
Bills discounted in respect of export debtors 684.55 1,999.32
Description
As at
March 31, 2009
Rs. million
As at
March 31, 2008
Rs. million
3 (a) Guarantees given by banks on behalf of the Company 79.14
(b) Corporate Guarantees / Undertakings given by the Company :
-
undertaking provided in an earlier year in favour of Bank of
India, Manchester Branch, for securing loan of GBP 10 million
granted to Welspun Home Textiles UK Limited for acquisition of
CHT Holdings Limited. Amount as at March 31, 2008 represents
the aforesaid indemnity and undertaking provided to Bank of
India, Manchester Branch for the term loan of GBP 7.5 million
given by the bank to Welspun Home Textile UK Limited
597.74
- Guarantees aggregating USD 7.92 million (March 31, 2008 : USD 1.8
million) on behalf of Welspun USA Inc. (WUSA) (Subsidiary
Company) to Nautica Apparel Inc. in respect of all paymen t
obligations of WUSA under license agreements entered between
WUSA and Nautica Apparel Inc.
72.23
- Guarantee on behalf of Welspun Mexico SA de CV (WELMEX)
(Subsidiary Company) to HSBC México, S.A.., Institución de Banca
Múltiple, Grupo Financiero (HSBC Mexico) to secure repayment of
advances, credit and such other facilities extended / to be extended
by HSBC Mexico to WELMEX
300.00
- Guarantee of USD 19 million on behalf of WUSA to Verde Chihuahua
Industrial S de RL de CV (Verde), in respect of all payments by WUSA
as a tenant under lease agreement between WUSA and Verde.
762.38
- Guarantee of USD 1.12 million on behalf of WELMEX to Nautica
Apparel Inc. in respect of all payment obligations of W ELMEX under
the License Agreement entered between WELMEX and Nautica
Apparel Inc.
-
- Guarantee on behalf of Welspun Global Brands Limited (WGBL)
(Subsidiary Company) in favour of Bank of India to secure
repayment of loans extended / to be extended by Bank of India to
WGBL.
-
(c) In accordance with the EPCG Scheme, imports of capital goods are
allowed to be made duty free and under Advance License Scheme,
imports of raw material are allowed to be made duty free, subject to
the condition that the Company will fulfill, in future, a specified
amount of export obligation within a specified time. Based on the
current operating plan, the Company would fulfill its export
obligation within the specified time period. Amount of duty saved
on imports of above goods against which export obligation is yet to
be fulfilled.
274.13
(d) Estimated amount of contracts (net of advances) remaining to be
executed on capital account and not provided for.
781.12
As at
March 31, 2009
Rs. million
As at
March 31, 2008
Rs. million30.67
724.89
401.75
300.00
963.68
56.81
210.00
55.41
36.22
Guarantee issued in the current year in lieu of the indemnity and
WELSPUN INDIA LIMITEDAnnual Report 2008 -09
SCHEDULES ANNEXED TO AND FORMING PART OF THE BALANCE SHEET AS AT MARCH 31, 2009 AND
PROFIT AND LOSS ACCOUNT FOR THE YEAR ENDED MARCH 31, 2009
Description

63
Marketing Division Investment & Treasury
Division
Total
Particulars
As at March
31,2009
As at March
31, 2008
As at March
31, 2009
As at March
31, 2008
As at March
31, 2009
As at March
31, 2008
Total Assets to be disposed of 880.51 592.63 233.34 56.55 1113.85 649.18
Total Liabilities to be settled 653.75 - - - 653.75 -
Rs. million
SCHEDULES ANNEXED TO AND FORMING PART OF THE BALANCE SHEET AS AT MARCH 31, 2009 AND
PROFIT AND LOSS ACCOUNT FOR THE YEAR ENDED MARCH 31, 2009
4. On December 20, 2007, the Company acquired 76% of the equity shareholding in SOREMA-Tapetes E Cortinas DE Banho,
S.V., Portugal (“SOREMA”) through Welspun Holdings Private Limited (WHPL), its wholly owned subsidiary, for
consideration of Euro 6,329,431.21 as specified in the Share Purchase Agreement. Further, the Company, through WHPL,
has entered into a Put and Call Option Agreement to buy remaining 24% equity shareholding in SOREMA, 8% each; on or
after January 1, 2011, January 1, 2012 and January 1, 2013 respectively, at a consideration to be determined based on the
respective average EBITDA of SOREMA for last two financial years prior to these dates.
5. On July 3, 2006, the Company had acquired 85% of the equity shareholding in CHT Holdings Limited - holding company of
Christy Group (“Christy”) through conduits of wholly owned subsidiaries (“WOS”) and through these WOS had also entered
into a put and call option agreement to buy the remaining 15% equity shareholding in Christy. On April 2, 2008, the
Company, through the conduits, acquired the remaining 15% of the equity shareholding in CHT Holdings Limited at a
consideration of GBP 2.356 million.
6. During the year, certain loans aggregating Rs. 726.95 million (equivalent to CHF 16.88 million) given to Welspun AG (WAG), a
wholly owned subsidiary, were converted into investments in the equity share capital of WAG. Subsequently, on March 16,
2009 vide an Assignment dated March 16, 2009, the Company transferred the entire investment aggregating CHF 17 million
at cost in equity shares of WAG to Welspun Holdings Private Limited, a wholly owned subsidiary of the Company.
7. (a) (i) Pursuant to 'the Composite Scheme of Arrangement in the nature of demerger and transfer of Marketing Division
of Welspun India Limited to Welspun Global Brands Limited and Investment & Treasury Division to Welspun
Investments Limited and Restructure of Capital of these companies' (the “Scheme”) as approved by the Board of
Directors of the Company on September 15, 2008 and the shareholders in the Court convened meeting held on
January 13, 2009 and filed with the Registrar of Companies on June 12, 2009, the Marketing Division of the
Company and the Investment & Treasury Division of the Company were transferred to Welspun Global Brands
Limited (WGBL) and Welspun Investments Limited (WINL), respectively, with effect from April 1, 2009 (the
“Appointed date”).
(ii) As per the Scheme, assets and liabilities of the Marketing Division of the Company will be transferred to WGBL with
effect from the Appointed date. Upon the transfer, WGBL will issue 1 equity share of Rs. 10 each credited as fully
paid up to the shareholders of Welspun India Limited for every 10 equity shares held by them in Welspun India
Limited. On September 17, 2008, the Company acquired 500,000 equity shares of Rs. 10 each representing the
entire share capital of WGBL at a premium of Rs. 10 per share. WGBL was acquired for the purpose of transfer of
“Marketing Division” of the Company to a wholly owned subsidiary pursuant to the Scheme.
(iii) Further, as per the Scheme, the assets and liabilities of the Investment & Treasury Division of the Company will be
transferred to WINL with effect from the Appointed date. Upon the transfer, WINL will issue 1 equity share of Rs. 10
each credited as fully paid up to the shareholders of Welspun India Limited for every 20 equity shares held by them
in Welspun India Limited. On October 7, 2008, the Company formed WINL by investing Rs. 500,000 in the equity
share capital of WINL. WINL was formed for the purpose of transfer of “Investment & Treasury Division” of the
Company to a wholly owned subsidiary pursuant to the Scheme.
(b) Information relating to the discontinuing operations :
(i) Date of the initial disclosure event : September 15, 2008
(ii) Period in which the discontinuance is expected to be completed : Financial year 2009-2010
(iii) Carrying amounts as at March 31, 2009 and March 31, 2008 of the total assets to be disposed of and the total
liabilities to be settled:

Marketing Division Investment & Treasury Division TotalParticulars For the year
ended March
31, 2009
For the year
ended March
31, 2009
For the year
ended March
31, 2009
Revenue 774.20 1,182.33 232.05 7.13 1,006.25 1,189.46
Operating Expenses 691.08 1,079.94 - - 691.08 1,079.94
Pre - Tax Profit s 83.12 102.39 232.05 7.13 315.17 109.52
Fringe Benefit Tax 2.75 2.77 - - 2.75 2.77
64
Marketing Division Investment & Treasury DivisionParticulars
For the year ended
March 31, 2009
For the year ended
March 31, 2008
For the year ended
March 31, 2009
For the year ended
March 31, 2008
Cash flows from Operating activities 86.01 108.04 - -
Cash flows from Investing activities - - 256.67 7.13
Cash flows from Financing activities 50.00 - - -
Summary of Stock Options No. of Stock Options Weighted Average Exercise Price (Rs.)
Options outstanding on April 1, 2008 1,494,000 110.80
Options granted during the year -
Options forfeited/lapsed during the year 204,000 110.80
Options exercised during the year -
Options outstanding on March 31, 2009 1,290,000 110.80
Options vested but not exercised on March 31, 2009 516,000 110.80
No. of Stock Options Weighted Average remaining life in years Weighted Average Exercise Price (Rs.)
258,000 1.13 110.80
258,000 2.13 110.80
387,000 3.13 110.80
387,000 4.13 110.80
WELSPUN INDIA LIMITEDAnnual Report 2008 -09
Rs. million
Rs. million
SCHEDULES ANNEXED TO AND FORMING PART OF THE BALANCE SHEET AS AT MARCH 31, 2009 AND
PROFIT AND LOSS ACCOUNT FOR THE YEAR ENDED MARCH 31, 2009
For the year
ended March
31, 2008
For the year
ended March
31, 2008
For the year
ended March
31, 2008
iv) Amount of revenue, expenses, pre - tax profit and tax in respect of the ordinary activities attributable to the
discontinuing operations
(v) Amounts of net cash flows attributable to discontinuing Operations
8. On May 17, 2006, the Company issued Employee Stock Options under the Employee Stock Options Scheme (the “Scheme”)
to employees of the Company and its subsidiaries with a right to subscribe to equity shares at a price of Rs. 110.80 per equity
share (closing market price as on May 16, 2006). The salient features of the Scheme are as under:
(i) Vesting : Options to vest over a period of four years from the date of their grants as under :
- 20% of the Options granted to vest at each of the 1st and 2nd Anniversaries of the date of grant.
- 30% of the Options granted to vest at each of the 3rd and 4th Anniversaries of the date of grant.
(ii) Exercise: Options vested with an employee will be exercisable within 3 years from the date of their vesting by
subscribing to the number of equity shares in the ratio of one equity share for every option, at the latest available
closing market price of the equity shares, prior to the date of grant. In the event of cessation of employment due
to death, resignation or otherwise the Options may lapse or be exercisable in the manner specifically provided for
in the Scheme.
Information in respect of options outstanding as at March 31, 2009

65
The compensation costs of stock options granted to employees are accounted by the Company using the intrinsic value
method. Since, on the date of grant of option, quoted market price of the underlying equity shares of the Company was
equal to the exercise price of an option, no expense or liability arising from the Scheme has been recognised.
The fair value of the options as per the 'Black Scholes' model is Rs. 63.39. Had the Company adopted fair value method
in respect of options granted, the employee compensation cost would have been higher by Rs. 14.36 million, Profit
After Tax lower by Rs. 14.36 million and the basic and diluted earning per share would have been lower by Re. 0.20.
9. 500,000 0% Redeemable Preference Shares of Rs. 100 each fully paid up are redeemable at par in the year 2009-2010 or
after repayment of all outstanding term liabilities and preference shares held by banks and financial institutions as on April
1, 2000 and interest and dividend thereon; whichever is later.
10. (a) Term loans from banks including interest thereon are secured by way of first charge on entire movable and immovable
properties of the Company, both present and future, ranking pari passu, subject to prior charge on specific assets as per
10(b) below and on current assets as per 10(c) and (d) below against borrowing from banks for working capital finance.
(b) In addition to 10(a) above, term loans from Banks aggregating Rs. Nil (March 31, 2008: Rs. 47.20 million) and Rs.
4,215.75 million (March 31, 2008: Rs. 4,509.10 million) and interest thereon, are secured by exclusive charge pari
passu, inter se, on specific fixed assets of the Company and by lien on fixed deposits of the Company, respectively.
(c) The working capital loan towards overdraft facility aggregating Rs. 266.50 million (March 31, 2008: Rs. Nil) is secured by
subservient charge on company's entire current asset and Technology Upgradation Fund subsidy receivable from
Government of India for textile industries towards term loan borrowing by the Company and against collateral of post
dated cheques.
(d) The working capital loans (other than referred in 10(c) above), which includes cash credit, packing credit, and demand
loans from banks, are secured by hypothecation of raw materials, finished and semi finished goods, stores and spares
and book debts of the Company and second charge on entire fixed assets of the Company.
11.(a) Sundry debtors include Rs. 1,121.08 million (March 31, 2008: Rs. 179.73 million) due from subsidiaries as below :
(b) Deposits of Rs. Nil (March 31, 2008: Rs. 9.20 million) given against use of office premises to a company in which some of
the Directors are interested as members.
12. Interest in Joint Venture
(a) The Company has accounted the investments in Joint Ventures in Welspun Zucchi Textiles Limited (WZTL) and MEP
Cotton Private Limited (MCPL) in accordance with Accounting Standard 13, Accounting for Investments.
(b) The Company's share of contingent liability of WZTL and MCPL is Rs. 7.43 million (March 31, 2008: Rs. 3.67 million)
and Rs. 15.61 million (March 31, 2008: Rs. 70.34 million), respectively.
(c) The Company's share of the aggregate amounts of assets and liabilities as at March 31, 2009 and income and
*Less than Rs. 10,000/-
As at March 31, 2009 As at March 31, 2008
Welspun USA Inc. * 150.91
Christy UK Limited 37.53 9.13
Christy USA LLC - 8.88
Welspun Mexico S.A. de C.V 6.95 2.04
Welspun AG 172.10 8.77
Welspun Global Brands Limited 872.16 -
SOREMA – Tapetes E Cortinas De Banho, S.A. 32.34 -
Total 1,121.08 179.73
Rs. million
SCHEDULES ANNEXED TO AND FORMING PART OF THE BALANCE SHEET AS AT MARCH 31, 2009 AND
PROFIT AND LOSS ACCOUNT FOR THE YEAR ENDED MARCH 31, 2009

expenditure of WZTL and MCPL for the year ended March 31, 2009 are as under:
13. Managerial Remuneration and Sitting Fees paid/ payable to directors:
Note: Provisions for leave entitlement and post retirement benefits which are based on actuarial valuations done on an overall company basis are excluded above.
Remuneration paid to the Managing Director and a Whole Time Director is in excess of the maximum amount payable as prescribed
under Schedule XIII to the Act by Rs. 0.45 million and Rs. 0.76 million, respectively. Such excess awaits approval of the shareholders of the
Company, by a special resolution in a general meeting of the Company. Due to inadequacy of profits as computed under Section 198 of
the Act, no commission is being paid for the year ended March 31, 2009.
Computation of Net Profit for the year ended March 31, 2008 in accordance with Section 198 of the Companies Act, 1956:
66
WZTL MCPL
Particulars March 31, 2009 March 31, 2008 March 31, 2009 March 31, 2008
Assets 101.63 89.20 422.22 649.84
Liabilities (excluding Share capital and Reserves
and Surplus)
40.73 34.72 355.46 539.34
Income 171.93 140.88 523.89 431.51
Expenditure (including provision for taxes) 166.33 140.55 585.33 431.01
Year ended March 31, 2008
Net Profit 414.52
Add:
Managerial Remuneration and Sitting Fees 17.61
Depreciation as per the Profit and Loss Account 847.19
Provision for doubtful debts/ advances 18.69
Loss on sale/ discarding of fixed assets 6.91
Provision for diminution in value of Investments -
1,304.92
Less:
Provision for doubtful debts/ advances written back 5.83
Profit on redemption/ sale of units in Mutual Funds 1.23
Profit on sale of bonds 4.97
Gain on Premature Redemption of Debentures 3.52
Depreciation as per Section 350 of the Act 847.19
Net profit as per Section 198 of the Act 442.18
Maximum remuneration payable under the Companies Act, 1956 @ 10% of the above 44.22
Restricted to 17.43
WELSPUN INDIA LIMITEDAnnual Report 2008 -09
Rs. million
Year ended March 31, 2009 Year ended March 31, 2008
Managing / Whole time directors
(i) Salary and Allowances 7.72 8.13
(ii) Perquisites 0.45 0.46
(iii) Commission to Managing Director and a
Wholetime Director- 8.84
Total 8.17 17.43
Directors other than Managing / Whole time directors
Sitting fees 0.14 0.18
Total 8.31 17.61
Rs. Million
Rs. million
SCHEDULES ANNEXED TO AND FORMING PART OF THE BALANCE SHEET AS AT MARCH 31, 2009 AND
PROFIT AND LOSS ACCOUNT FOR THE YEAR ENDED MARCH 31, 2009

* less than Rs. 1,000
The above information and that given in Schedule 12- “Current Liabilities and Provisions” regarding micro and small enterprises
has been determined to the extent such parties have been identified on the basis of information available with the Company.
15. Details of Purchase and Sale of Investments during the year ended March 31, 2009
INVESTMENTS Number of Shares/
Units Purchased
during the Year ended
March 31, 2009
Number of Shares/
Units Sold during
the Year ended
March 31, 2009
Welspun Global Brands Limited 500,000 -
Welspun Investment Limited 50,000 -
Welspun Gujarat Stahl Rohren Limited - 3,100,000
Welspun AG, Switzerland 16,400 17,000
Birla Sun Life Cash Plus - Institutional - Daily Dividend Reinvestment 5,884,327 5,884,327
Canara Robeco Liquid Fund - Institutional - Daily Dividend Reinvestment Option 4,157,544 4,157,544
DBS Chola Liquid Inst Daily Dividend Reinvestment Plan 858,418 858,418
DWS Installment Cash Plus Fund - Daily Dividend Plan 3,472 603,829
Fortis Money Plus Institutional Plan - Daily Dividend Plan 12,602,046 12,602,046
Fortis Overnight Fund - Institutional Plan - Daily Dividend Plan 13,004,890 13,004,890
HSBC Cash Fund - Institutional Plus - Daily Dividend Reinvestment Option 2,880,593 2,880,593
ING Liquid Fund Super Institutional - Daily Dividend Reinvestment Option 31,064,650 31,064,650
JM High Liquidity Fund - Super Institutional - Daily Dividend Reinvestment Option 237,427 237,427
JP Morgan India Liquid Fund - Super Institutional Daily Dividend- Reinvestment Option 2,243,358 2,243,358
LICMF Floating Rate Fund - Short Term Plan - Dividend Plan 268,751,322 273,188,622
LICMF Income Plus Fund - Daily Dividend Plan 295,252,773 295,252,773
LICMF Liquid Fund - Daily Dividend Reinvestment Plan 29,924,159 29,924,159
LICMF Liquid Plan - Dividend Plan 47,801,796 48,042,910
LICMF Saving Plus Plan - Daily Dividend Reinvestment 10,694,446 10,694,446
Lotus India Liquid Fund - Institutional Daily Dividend 5,004,537 5,004,537
Principal Floating Rate Fund SMP Institutional Option - Daily Dividend Reinvestment 779 24,447
Reliance Liquid Fund - Treasury Plan Retail Option 128 13,618
SBI Magnum Insta Cash Fund - Daily Dividend Option 1,574,351 1,574,351
SBI Premier Liquid Fund - Institutional Plan - Daily Dividend 1,045,584 1,045,584
Tata Liquid Super High Investment Fund - Daily Dividend 184,162 184,162
UTI Money Market Fund - Daily Dividend Option - Reinvestment 5,764,291 5,764,291
UTI Treasury Advantage Fund - Institutional Plan - Daily Dividend Option - Reinvestment 100,116 100,116
Rs. million
Particulars
Year ended March
31, 2009
Year ended March
31, 2008
i) the principal amount and the interest duet thereon (to be shown separately) remaining
unpaid to any supplier as at the end of each accounting year;
- Principal
- Interest due thereon
0.78
0.01
0.75
*
ii) the amount of interest paid by the buyer in terms of section 16 of the Micro, Small and
Medium Enterprises Development Act, 2006, along with the amount of the payment made
to the supplier beyond the appointed day during each accounting year;
- Principal
- Interest
1.75
*
0.10
0.27
iii) the amount of interest due and payable for th e period of delay in making payment (which
have been paid but beyond the appointed day during the year) but without adding the
interest specified under the Micro, Small and Medium Enterprises Development Act, 2006;
- -
iv) the amount of interest accrued and remaining unpaid at the end of each accounting year;
-Total interest Accrued
- Interest remaining unpaid0.01
0.01
*
*
v) the amount of further interest remaining due and payable even in the succeeding years,
until such date when the interest dues as above are actually paid to the small enterprise,
for the purpose of disallowance as a deductible expenditure under section 23 of the Micro,
Small and Medium Enterprises Development Act, 2006.
0.01 *
SCHEDULES ANNEXED TO AND FORMING PART OF THE BALANCE SHEET AS AT MARCH 31, 2009 AND
PROFIT AND LOSS ACCOUNT FOR THE YEAR ENDED MARCH 31, 2009
67
14. Disclosure for Micro and Small Enterprises:

16. a) Additional information pursuant to Part II of Schedule VI to the Companies Act, 1956.
16. b) Detailed information in respect of opening and closing stocks, production, purchases and sales in respect of each class
of goods produced and traded :
68
WELSPUN INDIA LIMITEDAnnual Report 2008 -09
a) Licensed Capacity Not Applicable
As per the Industrial Policy declared in July 1991, as amended in April 1993,
no licences are required for the products manufactured by the Company.
Installed Capacity as at March 31, 2009 (As certified by Management)
Cotton Terry Towels 38,201 (March 31, 2008 : 37,074) M.T.
Cotton Yarn 28,326 (March 31, 2008 : 28,295) M.T.
Bed Sheets 42,840 (March 31, 2008 : 35,700) 000' Mtrs
Rugs 10,151 (March 31, 2008 : Nil) M.T.
Notes:
1. Previous Year figures are given in brackets.
2. Cotton Yarn production includes captive consumption of 26,455.80 MT (Previous Year : 21,948 MT).
3. Grey Fabric - Bed Linen Products production includes captive consumption of 2,223.99 MT (Previous Year : Nil).
4. Sales Rugs includes 309.54 MT (Previous Year : Nil) of Rs. 118.83 million (Previous Year : Rs. Nil) sold during Trial Run (Refer Schedule 6B).
5. Sales Others includes Rs. 0.58 million (Previous Year : Rs. Nil) sold during Trial Run (Refer Schedule 6B).
Class of Goods Unit Production
Quantity (Rs. million) Quantity Quantity (Rs. million) Quantity (Rs. million) Quantity (Rs. million)
Manufactured
Terry Towels MT 1,618.05 281.60 30,088.17 - - 31,018.92 7,975.30 687.30 141.22
(894.09) (159.87) (29,822.17) - - (29,098.21) (7,162.75) (1,618.05) (281.60)
Cotton Yarn (Refer Note 2) MT 359.49 39.04 26,980.70 - - 884.40 67.82 - -
(312.67) (30.65) (24,465.28) - - (2,471.04) (188.00) (359.49) (39.04)
Bed Linen Products 000 Mtrs 2,303.85 295.18 23,513.32 - - 24,264.27 3,557.05 1,552.90 141.59
(646.85) (66.34) (28,381.51) - - (26,724.51) (3,836.11) (2,303.85) (295.18)
Decorative Bedding 000 Mtrs - - 2,195.79 - - 1,963.97 255.40 231.82 15.58
- - - - - - - - -
Grey Fabric - Bed Linen Products
(Refer Note 3)
000 Mtrs - - 4,349.44 - - 2,125.45 128.51 - -
- - (3,072.74) - - (3,072.74) (262.04) - -
Rugs (Refer Note 4) MT - - 450.15 309.54 118.83 140.61 30.40
- - - - - - -
Others (Refer Note 5) 6.65 - 262.70 3.62
(10.49) - (248.20) (6.65)
Traded
Cotton - - - 286.00 60.68 286.00 57.78 - -
MT - - - (11.10) (0.79) (11.10) (0.50) - -
Cotton Yarn MT 54.61 3.38 - 54.62 0.91 109.23 7.38 - -
- - - (545.50) (36.50) (490.89) (32.72) (54.61) (3.38)
Bed Linen Products 000 PCS - - - 520.40 209.58 520.40 211.38 - -
- - - (496.51) (41.72) (496.51) (38.36) - -
Others - 37.23 30.79 -
- (9.17) (10.91) -
Total 625.85 308.40 12,672.94 332.41
(267.35) (88.18) (11,779.59) (625.85)
Stocks at Commencement Purchases Sales Stocks at Close
SCHEDULES ANNEXED TO AND FORMING PART OF THE BALANCE SHEET AS AT MARCH 31, 2009 AND
PROFIT AND LOSS ACCOUNT FOR THE YEAR ENDED MARCH 31, 2009

UNIT Qty. (Rs. million) Qty. (Rs. million)
c) Raw Material Consumed:
Cotton Yarn* MT 20,766.65 2,714.80 19,057.00 2,711.44
Cotton MT 24,317.80 1,604.55 29,358.00 1,836.47
Fabric Consumed** MT 1,171.65 207.38 846.00 166.26
Bed Linen Fabrics 000 Mtrs. 6,537.28 703.30 6,573.00 793.92
Total 5,230.03 5,508.09
d) Value of Imported and Indigenous Raw Materials and Stores, Spare Parts Consumed and Percentage
1. Raw Material % (Rs. million) % (Rs. million)
Imported @ 10.64% 556.35 6.89% 379.47
Indigenous @ 89.36% 4,673.68 93.11% 5,128.62
Total 100.00% 5,230.03 100.00% 5,508.09
2. Stores and Spares and Dyes and Chemicals
Imported # 12.42% 163.55 8.87 113.09
Indigenous # 87.58% 1,153.75 91.13 1,161.43
Total 100% 1,317.30 100.00 1,274.52
Year ended Year ended
March 31, 2009 March 31, 2008
(Rs. million) (Rs. million)
e) Value of Imports on CIF Basis:
Raw Materials 544.83 522.64
Stores & Spares and Dyes & Chemicals 203.87 121.97
Capital Goods 1,003.11 1,653.94
Packing Material 12.85 9.67
Total 1,764.66 2,308.22
f) FOB Value Of Exports 9,224.35 10,131.14
g) Expenditure in Foreign Currency
Travelling 3.79 7.57
Commission 21.52 53.32
Professional Charges 23.19 5.48
Claims, Discount and Rebate 78.91 102.27
Freight 52.48 103.37
Advertisement and Sales Promotion 210.84 165.84
Interest - 8.17
Others 23.91 9.83
Total 414.64 455.85
@ Includes imported raw material Rs. 42.37 million (Previous Year : Rs. Nil) and indigenous raw material Rs. 38.78 million
(Previous Year : Rs. Nil) consumed during Trial Run (Refer Schedule 6B)
# Includes imported stores & spares and dyes & chemicals Rs. 2.22 million (Previous Year : Rs. Nil) and indigenous stores & spares
and dyes & chemicals Rs. 17.60 million (Previous Year : Rs. Nil) consumed during Trial Run (Refer Schedule 6B)
Year ended Year ended
March 31, 2009 March 31, 2008
*Includes 381.06 MT (Previous Year : Nil) of Rs. 63.94 million (Previous Year : Rs. Nil) consumed during Trial Run (Refer Schedule 6B)
** Includes 139.89 MT (Previous Year : Nil) of Rs. 17.21 million (Previous Year : Rs. Nil) consumed during Trial Run (Refer Schedule 6B)
Year ended Year ended
March 31, 2009 March 31, 2008
69
SCHEDULES ANNEXED TO AND FORMING PART OF THE BALANCE SHEET AS AT MARCH 31, 2009 AND
PROFIT AND LOSS ACCOUNT FOR THE YEAR ENDED MARCH 31, 2009

17. Disclosure of Derivative Instruments
A. Derivative instruments outstanding at the year end :
i) Forward Exchange and Option Contracts to hedge the foreign currency exposure for payments to be received against
exports and other receivables:
ii) Forward Exchange and Option Contracts to hedge the foreign currency exposure for payments to be made against
imports and other payables:
B. As of the Balance Sheet date, the foreign currency exposure not hedged by a derivative instrument or otherwise is
amounting to Rs. 1,774.03 million (March 31, 2008 : Rs. 1,372.98 million).
C. Pursuant to the adoption of AS-30 with effect from April 1, 2008 as given in Note 1(x)(c) above, the Company has
debited and carried forward loss aggregating Rs. 294.95 million arising on fair valuation of hedging instruments that
are considered effective, in the ‘Hedging Reserve Account’ instead of the earlier policy of recognising such losses in the
Profit and Loss Account.
The following table summarizes activity in the Hedging Reserve related to all derivatives classified as cash flow hedges
during the year ended March 31, 2009
The entire balance of Hedging Reserve Account as at March 31, 2009 of Rs. 294.95 million pertaining to 'Marketing
Division' of the Company will be transferred to Welspun Global Brands Limited with effect from April 1, 2009, pursuant
to demerger and transfer of 'Marketing Division' as referred in Note 7 above, to Welspun Global Brands Limited
70
WELSPUN INDIA LIMITEDAnnual Report 2008 -09
Currency
March 31, 2009 March 31, 2008
USD 161.38 114.28
(Equivalent Rs.) (7,769.93) (4,640.87)
EURO 0.69 2.00
(Equivalent Rs.) (46.44) (116.33)
Forward Exchange Contracts and Option Contracts
Particulars Year ended March 31, 2009
Balance as at the beginning of the year
Unrealised gain/ (losses) on cash flow hedging derivatives during the
year
Net gains/ (losses) reclassified into net income on occurrence of
hedged transactions
Balance as at Year end
-
(903.54)
(608.59)
(294.95)
Currency
March 31, 2009 March 31, 2008
USD 1.44 12.38(Equivalent Rs.) (73.95) (496.33)EURO 0.76 10.91(Equivalent Rs.) (49.62) (647.26)JPY - 59.40(Equivalent Rs.) - (23.83)
Forward Exchange Contracts and Option Contracts
(Rs. million)
(Rs. million)
(Rs. million)
SCHEDULES ANNEXED TO AND FORMING PART OF THE BALANCE SHEET AS AT MARCH 31, 2009 AND
PROFIT AND LOSS ACCOUNT FOR THE YEAR ENDED MARCH 31, 2009

18. The Company has classified the various benefits provided to employees as under :-
I Defined Contribution Plans
a. Employers' Contribution to Provident Fund
b. Employers' Contribution to Employee’s State Insurance
c. Employers' Contribution to Employee’s Pension Scheme, 1995Rs. million
During the year, the Company has recognised the following amounts in the Profit and Loss Account: 2008-09 2007-08
- Employers' Contribution to Provident Fund * 32.03 25.56
- Employers' Contribution to Employee’s State Insurance * 6.69 7.32
- Employers' Contribution to Employee’s Pension Scheme * 36.03 29.44
* Included in Contribution to Provident and Other Funds (Refer Schedule 16)
II Defined Benefit Plan
Contribution to Gratuity Fund(% p.a.)
a. Major Assumptions 2008-09 2007-08
Discount Rate : - Staff 7.50 8.50
- Worker 7.25 8.50
Expected Rate of Return on Plan Assets 8.00 8.00
Salary Escalation Rate @ 5.00 6.00
@ The estimates for future salary increases considered takes into account the inflation, seniority,
promotion and other relevant factors. Rs. million
b. Change in the Present Value of Obligation 2008-09 2007-08
Opening Present Value of Obligation 47.23 36.83
Current Service Cost 11.72 11.19
Interest Cost 4.02 3.13
Benefit paid (12.01) (6.10)
Actuarial Loss on Obligations 1.20 2.18
Closing Present Value of Obligation 52.16 47.23
Rs. million
c. Change in Fair Value of Plan Assets 2008-09 2007-08
Opening Fair Value of Plan Assets 53.24 34.02
Expected Return on Plan Assets 4.26 2.72
Actuarial (loss)/gain on Plan Assets (7.53) 5.10
Contributions 9.48 17.50
Benefits paid (8.90) (6.10)
Closing Fair Value of Plan Assets 50.55 53.24
Rs. million
d. Reconciliation of Present Value of Defined Benefit Obligation and the Fair Value of Assets As At
March 31, 2009
As At
March 31, 2008
Present Value of Funded Obligation 52.16 47.23
Fair Value of Plan Assets 50.55 53.24
Funded Status (1.61) 6.01
Present Value of Unfunded Obligation 1.61 -
Assets recognised in the balance Sheet and included under Loans, Advances and Other Current Assets
(Refer Schedule 11)
- 6.01
Unfunded Net Liability Recognised in the Balance Sheet disclosed under Current Liabilities and
Provisions (Refer Schedule 12)
1.61 -
e. Amount recognised in the Balance Sheet
Present Value of Obligation 52.16 47.23
Fair Value of Plan Assets 50.55 53.24
Liability/ (Assets) recognised in the balance Sheet and included under Current Liabilities and Provisions 1.61 (6.01)
(Refer Schedule 12) respectively and under Loans, Advance & Other Current Assets (Refer Schedule 11)
Rs. million
f. Expenses Recognised in the Profit and Loss Account 2008-09 2007-08
Current Service Cost 11.72 11.19
Interest Cost 4.02 3.13
Expected Return on Plan Assets (4.26) (2.72)
Net Actuarial Loss/(gain) Recognised in the period 8.73 (2.92)
Total expenses Recognised in the Profit and Loss Account ** 20.21 8.68
Actual (Loss)/Return on Plan Assets (3.27) 7.82
** Included in Salary, Wages, Allowances and Other Benefits (Refer Schedule 16)
71
SCHEDULES ANNEXED TO AND FORMING PART OF THE BALANCE SHEET AS AT MARCH 31, 2009 AND
PROFIT AND LOSS ACCOUNT FOR THE YEAR ENDED MARCH 31, 2009

19. In accordance with the Company's policy given in Note 1(x) above, net exchange loss of Rs. 1,060.59 million (Previous Year:
net exchange gain of Rs. 379.21 million) has been accounted in Profit and Loss Account.
20. Borrowing Costs aggregating Rs. 99.99 million; Previous Year: Rs. 145.69 million (net of interest subsidy of Rs. 90.66 million;
Previous Year: Rs. 156.16 million) attributable to the acquisition or construction of qualifying assets are capitalised during
the year as part of the cost of such assets.
(I) Information about Primary Business Segment
The Company is exclusively engaged in the business of Home Textiles which, in the context of Accounting Standard 17
on Segment Reporting, issued by the Institute of Chartered Accountants of India, is considered to constitute a single
primary segment. Thus, the segment revenue, segment results, total carrying amount of segment assets, total
carrying amount of segment liabilities, total cost incurred to acquire segment assets, total amount of charge for
depreciation during the year are all as reflected in the financial statements for the year ended March 31, 2009 and as on
that date.
(ii) Information about Secondary Geographical Segments:
(iii) Notes:
(a) The Segment revenue in the geographical segments considered for disclosure are as follows:
- Revenue within India includes sales to customers located within India and earnings in India.
- Revenue outside India includes sales to customers located outside India, earnings outside India and export
benefits on sales made to customers located outside India.
(b) Segment revenue, results, assets and liabilities include the respective amounts identified to each of the segments
and amounts allocated on a reasonable basis.
21. Segment Information for the year ended March 31, 2009.
WELSPUN INDIA LIMITEDAnnual Report 2008 -09
India Outside India Total
March 31,
2009
March 31,
2008
March 31,
2009
March 31,
2008
March 31,
2009
March 31,
2008
External Revenue 4,142.33 966.40 9,302.07 11,443.04 13,444.40 12,409.44
Carrying Amount of Segment Assets 23,037.88 21,581.67 2060.02 1,997.04 25,097.90 23,578.71
Capital Expenditure
(excluding the Incidental Expenditure
Pending Capitalisation/ Allocation)
1,705.87 3,167.48 - - 1,705.87 3,167.48
Rs. million
SCHEDULES ANNEXED TO AND FORMING PART OF THE BALANCE SHEET AS AT MARCH 31, 2009 AND
PROFIT AND LOSS ACCOUNT FOR THE YEAR ENDED MARCH 31, 2009
72
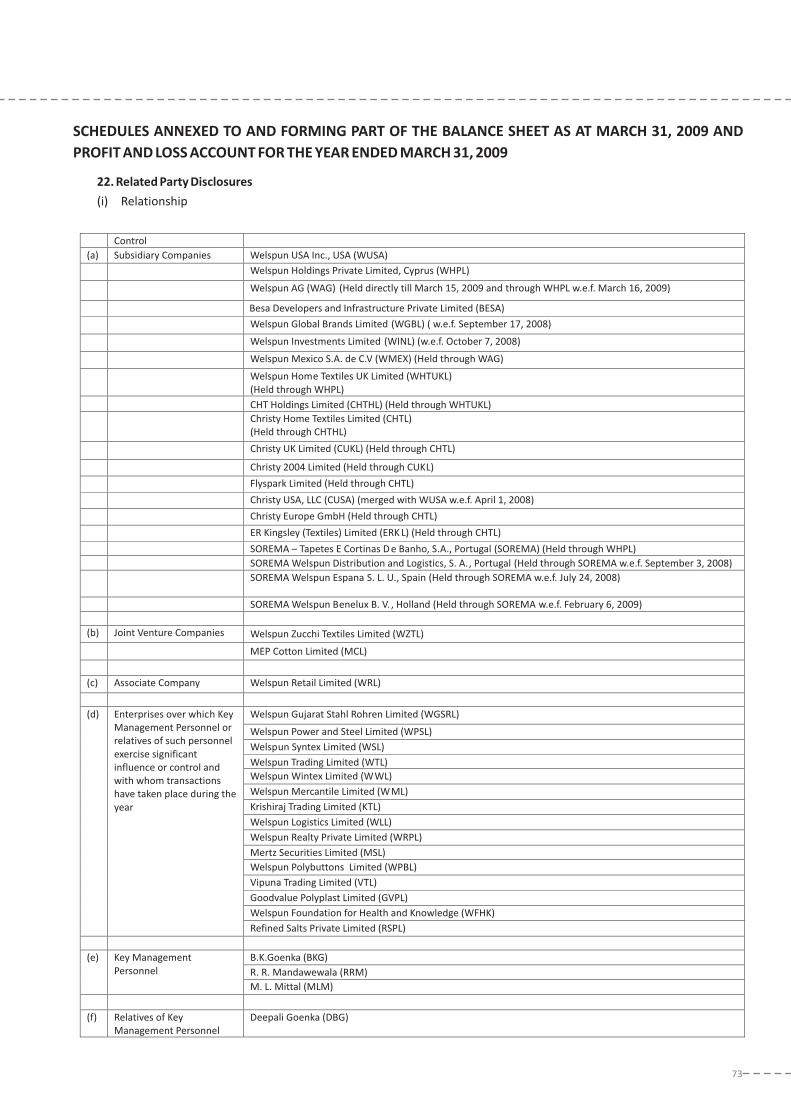
22. Related Party Disclosures
(i) Relationship
73
Control
(a) Subsidiary Companies Welspun USA Inc., USA (WUSA)
Welspun Holdings Private Limited, Cyprus (WHPL)
Welspun AG (WAG) (Held directly till March 15, 2009 and through WHPL w.e.f. March 16, 2009)
Besa Developers and Infrastructure Private Limited (BESA)
Welspun Global Brands Limited (WGBL) ( w.e.f. September 17, 2008)
Welspun Investments Limited (WINL) (w.e.f. October 7, 2008)
Welspun Mexico S.A. de C.V (WMEX) (Held through WAG)
Welspun Home Textiles UK Limited (WHTUKL)
(Held through WHPL)
CHT Holdings Limited (CHTHL) (Held through WHTUKL)
Christy Home Textiles Limited (CHTL)
(Held through CHTHL)
Christy UK Limited (CUKL) (Held through CHTL)
Christy 2004 Limited (Held through CUKL)
Flyspark Limited (Held through CHTL)
Christy USA, LLC (CUSA) (merged with WUSA w.e.f. April 1, 2008)
Christy Europe GmbH (Held through CHTL)
ER Kingsley (Textiles) Limited (ERK L) (Held through CHTL)
SOREMA – Tapetes E Cortinas D e Banho, S.A., Portugal (SOREMA) (Held through WHPL)
SOREMA Welspun Distribution and Logistics, S. A., Portugal (Held through SOREMA w.e.f. September 3, 2008)
SOREMA Welspun Espana S. L. U., Spain (Held through SOREMA w.e.f. July 24, 2008)
SOREMA Welspun Benelux B. V. , Holland (Held through SOREMA w.e.f. February 6, 2009)
(b) Joint Venture Companies Welspun Zucchi Textiles Limited (WZTL)
MEP Cotton Limited (MCL)
(c) Associate Company Welspun Retail Limited (WRL)
Welspun Gujarat Stahl Rohren Limited (WGSRL)
Welspun Power and Steel Limited (WPSL)
Welspun Syntex Limited (WSL)
Welspun Trading Limited (WTL)
Welspun Wintex Limited (WWL)
Welspun Mercantile Limited (WML)
Krishiraj Trading Limited (KTL)
Welspun Logistics Limited (WLL)
Welspun Realty Private Limited (WRPL)
Mertz Securities Limited (MSL)
Welspun Polybuttons Limited (WPBL)
Vipuna Trading Limited (VTL)
Goodvalue Polyplast Limited (GVPL)
Welspun Foundation for Health and Knowledge (WFHK)
(d) Enterprises over which Key
Management Personnel or
relatives of such personnel
exercise significant
influence or control and
with whom transactions
have taken place during the
year
Refined Salts Private Limited (RSPL)
B.K.Goenka (BKG)
R. R. Mandawewala (RRM)
(e) Key Management
Personnel
M. L. Mittal (MLM)
(f) Relatives of Key
Management Personnel
Deepali Goenka (DBG)
SCHEDULES ANNEXED TO AND FORMING PART OF THE BALANCE SHEET AS AT MARCH 31, 2009 AND
PROFIT AND LOSS ACCOUNT FOR THE YEAR ENDED MARCH 31, 2009

WELSPUN INDIA LIMITEDAnnual Report 2008 -09
22
(ii)
Foll
ow
ing
are
the
tra
nsa
ctio
ns
wit
hre
late
dp
art
ies
me
nti
on
ed
in(i
)a
bo
ve
an
dth
ey
ea
r-e
nd
ba
lan
ces
Rs.
mil
lio
n
PA
RT
ICU
LAR
SW
US
AW
HP
LB
ES
AW
GB
LW
INL
SO
RE
MA
WA
GW
ME
XC
UK
LC
US
AE
RK
LW
ZT
LM
CL
WR
LW
GS
RL
Tra
nsa
ctio
ns
du
rin
gth
ey
ea
r
Loa
ns,
Ad
van
ces
an
dD
ep
osi
tsg
ive
n5
45
.29
0.4
1-
0.5
0-
-6
55
.58
--
--
--
42
.68
-
(14
1.6
6)
(61
8.8
9)
(31
.50
)(1
55
.18
)(2
0.0
0)
(22
0.0
0)
Re
pa
ym
en
to
fLo
an
s,A
dva
nce
sa
nd
De
po
sits
giv
en
49
.87
11
.63
--
--
--
--
--
--
-
(98
.50
)(4
80
.66
)(1
00
.00
)
De
po
sits
Re
ceiv
ed
5.0
6-
--
--
--
--
--
--
-
(12
.40
)
Pu
rch
ase
of
Go
od
s-
--
--
--
-3
.00
--
-1
8.7
60
.02
49
8.0
1
(11
.07
)(1
.86
)(1
6.1
8)
(71
.73
)
Pu
rch
ase
of
Se
rvic
es/
Exp
en
ses
incu
rre
d1
93
.84
--
--
0.2
80
.04
-1
3.4
6-
-2
2.1
45
.66
13
.35
4.4
8
(98
.63
)(1
.36
)(3
.15
)(0
.21
)(2
.01
)(1
.12
)
Sa
leo
fG
oo
ds/
DE
PB
Lice
nse
s1
,00
5.6
2-
-3
,38
7.4
6-
33
.01
21
2.7
21
6.3
12
59
.74
64
.00
-4
0.4
6-
51
1.3
52
1.2
4
(70
5.6
2)
(8.7
7)
(2.0
4)
(20
3.1
6)
(34
.64
)(0
.45
)(1
5.4
8)
(41
2.6
1)
(13
.42
)
Job
Ch
arg
es
Re
ceiv
ed
--
--
--
--
--
--
-1
.33
-
(0.6
8)
(12
.28
)
Sa
leo
fS
erv
ice
s/E
xpe
nse
sin
curr
ed
30
.34
4.9
4-
0.1
40
.31
0.2
92
.16
#0
.17
--
3.2
7-
9.8
36
9.7
3
(1.8
8)
(6.4
4)
(25
.35
)(3
.89
)(6
.67
)(5
1.2
0)
Sa
leo
fF
ixe
dA
sse
ts-
--
--
--
7.0
7-
--
--
--
(0.2
3)
Pu
rch
ase
of
Fix
ed
Ass
ets
/C
ap
ita
lG
oo
ds
--
--
--
--
0.4
8-
--
--
4.7
2
(9.6
1)
(11
1.5
0)
(0.1
1)
(35
.78
)
Ca
pit
al
Ad
van
ce-
--
--
2.9
3-
--
--
--
--
Inte
rest
Inco
me
16
.47
32
.49
--
--
26
.94
--
--
--
3.8
8-
(4.0
7)
(24
.89
)(0
.95
)(4
.37
)
Cla
ims,
Dis
cou
nt
an
dR
eb
ate
10
.94
--
--
--
-4
.95
--
0.1
4-
--
(2.0
2)
(3.0
5)
(0.4
5)
(65
.91
)
Re
mu
ne
rati
on
an
dC
om
mis
sio
n-
--
--
--
--
--
--
--
Div
ide
nd
Re
ceiv
ed
--
--
--
--
--
--
--
10
.70
(7.1
3)
Do
na
tio
n-
--
--
--
--
--
--
--
Sh
are
Ap
pli
cati
on
Mo
ne
yP
aid
--
--
--
--
--
--
--
-
(0.0
5)
Inve
stm
en
tM
ad
ed
uri
ng
the
yea
r2
75
.78
*-
--
--
72
6.9
5*
--
--
--
--
Pu
rch
ase
of
sha
res
of
WG
BL
du
rin
gth
eye
ar
--
--
--
0-
--
--
--
-
(0.1
0)
(4.0
5)
(89
.45
)(1
22
.50
)
Sa
leo
fin
vest
me
nt
du
rin
gth
eye
ar
-7
37
.29
@-
--
--
--
--
--
--
Clo
sin
gB
ala
nce
Loa
ns,
Ad
van
ces
an
dD
ep
osi
tsre
ceiv
ed
5.0
6-
--
--
--
--
-1
0.0
0-
-1
0.4
0
(10
.00
)
Loa
ns,
Ad
van
ces
an
dD
ep
osi
tsg
ive
n(I
ncl
ud
ing
Oth
er
Cu
rre
nt
Ass
ets
)
34
5.6
01
,15
1.0
43
1.5
00
.60
--
18
1.1
6-
--
--
20
.03
42
.86
1.2
3
(71
.43
)(4
25
.47
)(3
1.5
0)
(15
6.9
2)
(6.4
4)
(20
.00
)(1
1.1
0)
De
bto
rs(N
et
of
Bil
lsD
isco
un
ted
wit
hB
an
ks)
#-
-8
72
.16
-3
2.3
41
72
.10
6.9
53
7.5
3-
-1
0.2
0-
25
7.9
2-
(15
0.9
1)
(8.7
7)
(2.0
4)
(9.1
3)
(8.8
8)
(2.7
8)
(25
4.4
0)
(0.1
6)
Cre
dit
ors
44
.86
--
--
0.2
80
.49
-#
--
0.0
5-
#-
(53
.94
)(1
.36
)(4
2.2
4)
(11
.51
)
Inve
stm
en
ts2
82
.67
33
7.0
60
.10
10
.00
0.5
0-
--
--
-3
4.5
69
9.5
02
44
.63
32
.03
(6.8
9)
(33
7.0
6)
(0.1
0)
(4.0
5)
(34
.56
)(9
9.5
0)
(24
4.6
3)
(56
.65
)
Sh
are
Ap
pli
cati
on
Mo
ne
yP
en
din
gA
llo
tme
nt
--
--
--
--
--
--
0.0
5-
-
(0.0
5)
No
tes:
Pre
vio
us
yea
rfi
gu
res
are
giv
en
inb
rack
ets
.
*In
vest
me
nt
ma
de
du
rin
gth
eye
ar
iso
ut
of
con
vers
ion
of
loa
ns
giv
en
.
@S
ha
res
of
WA
Gso
ldto
WH
PL
#Le
ssth
an
Rs.
10
,00
0
SC
HE
DU
LES
AN
NE
XE
DT
OA
ND
FOR
MIN
GP
AR
TO
FT
HE
BA
LAN
CE
SH
EE
TA
SA
TM
AR
CH
31
,20
09
AN
DP
RO
FIT
AN
DLO
SS
AC
CO
UN
TFO
RT
HE
YE
AR
EN
DE
DM
AR
CH
31
,20
09
74

75
SC
HE
DU
LES
AN
NE
XE
DT
OA
ND
FOR
MIN
GP
AR
TO
FT
HE
BA
LAN
CE
SH
EE
TA
SA
TM
AR
CH
31
,20
09
AN
DP
RO
FIT
AN
DLO
SS
AC
CO
UN
TFO
RT
HE
YE
AR
EN
DE
DM
AR
CH
31
,20
09
No
tes:
Pre
vio
us
yea
rfi
gu
res
are
giv
en
inb
rack
ets
.
*In
vest
me
nt
ma
de
du
rin
gth
eye
ar
iso
ut
of
con
vers
ion
of
loa
ns
giv
en
.
@S
ha
res
of
WA
Gso
ldto
WH
PL
#Le
ssth
an
Rs.
10
,00
0
22
(ii)
Fo
llo
win
gare
the
tran
sacti
on
sw
ith
rela
ted
part
ies
men
tio
ned
in(i
)ab
ove
an
dth
eyear-
en
db
ala
nces
PA
RT
ICU
LA
RS
Tra
nsacti
on
sd
uri
ng
the
year
Lo
an
s,A
dva
nce
sa
nd
De
po
sits
giv
en
Re
pa
ym
en
to
fL
oa
ns,A
dva
nce
sa
nd
De
po
sits
giv
en
De
po
sits
Re
ce
ive
d
Pu
rch
ase
of
Go
od
s
Pu
rch
ase
of
Se
rvic
es/
Exp
en
se
sin
cu
rre
d
Sa
leo
fG
oo
ds/
DE
PB
Lic
en
se
s
Jo
bC
ha
rge
sR
ece
ive
d
Sa
leo
fS
erv
ice
s/
Exp
en
se
sin
cu
rre
d
Sa
leo
fF
ixe
dA
sse
ts
Pu
rch
ase
of
Fix
ed
Asse
ts/
Ca
pita
lG
oo
ds
Ca
pita
l Ad
va
nce
Inte
rest
Inco
me
Cla
ims,
Dis
co
un
ta
nd
Re
ba
te
Re
mu
ne
ratio
na
nd
Co
mm
issio
n
Div
ide
nd
Re
ce
ive
d
Do
na
tio
n
Sh
are
Ap
plic
atio
nM
on
ey
Pa
id
Inve
stm
en
tM
ad
ed
uri
ng
the
ye
ar
Pu
rch
ase
of
sh
are
so
fW
GB
Ld
uri
ng
the
ye
ar
Sa
leo
fin
ve
stm
en
td
uri
ng
the
ye
ar
Clo
sin
gB
ala
nce
Lo
an
s,A
dva
nce
sa
nd
De
po
sits
rece
ive
d
Lo
an
s,A
dva
nce
sa
nd
De
po
sits
giv
en
(In
clu
din
gO
the
r
Cu
rre
ntA
sse
ts)
De
bto
rs(N
et
of
Bill
sD
isco
un
ted
with
Ba
nks)
Cre
ditors
Inve
stm
en
ts
Sh
are
Ap
plic
atio
nM
on
ey
Pe
nd
ing
Allo
tme
nt
Rs.
mil
lio
n
WP
SL
WS
LW
TL
WW
LW
ML
KT
LW
LLW
RP
LV
TL
GV
PL
MS
LW
PB
LR
SP
LW
FH
KB
KG
RR
MM
LMD
BG
--
--
--
--
--
--
17
.90
--
--
(23
.40
)(2
50
.00
)(6
.00
)(1
1.5
0)
--
--
-2
3.4
01
6.2
0-
-1
.67
-9
.20
--
--
-
(12
.00
)(9
.00
)
--
--
--
--
--
--
--
--
-
58
.63
5.4
7-
--
--
--
-0
.93
--
--
--
(77
.82
)(1
2.8
3)
47
.39
4.6
9-
--
--
24
.95
--
4.4
2-
--
--
--
(26
.61
)(0
.72
)(1
.42
)(0
.52
)(3
.27
)
3.7
12
.44
--
--
--
--
0.0
5-
--
--
-
(9.5
5)
(0.5
9)
--
--
--
--
--
--
--
--
-
12
.63
3.5
31
.67
--
0.0
1-
--
--
--
--
--
(4.8
2)
(1.5
1)
-1
.36
--
--
--
--
--
--
--
-
3.6
3-
--
--
--
--
--
--
--
-
(11
1.5
4)
(20
.29
)
--
--
--
--
--
--
--
--
-
--
--
--
--
--
--
--
--
-
--
--
--
--
--
--
--
--
-
--
--
--
--
--
--
-2
.85
2.1
63
.16
2.2
3
(7.4
2)
(6.7
4)
(3.2
7)
(2.5
1)
--
--
--
--
--
--
--
--
-
--
--
--
--
--
--
--
--
-
(2.1
0)
--
--
--
--
--
--
--
--
-
--
--
--
--
--
--
--
--
-
--
2.5
02
.50
2.5
02
.50
--
--
--
--
##
-#
--
--
--
--
--
--
--
--
-
--
--
--
--
--
--
--
--
-
0.2
8-
--
--
23
3.8
0-
-1
3.3
4-
-2
9.4
0-
--
-
(23
.40
)(2
50
.00
)(1
5.0
0)
(9.2
0)
(11
.50
)
-1
.41
--
--
--
--
#-
--
--
-
-0
.23
--
--
--
--
0.0
4-
--
--
-
(0.5
7)
(0.4
2)
(4.4
2)
(4.4
2)
#5
.60
--
--
--
--
--
--
--
-
(5.6
0)
--
--
--
--
--
--
--
--
-
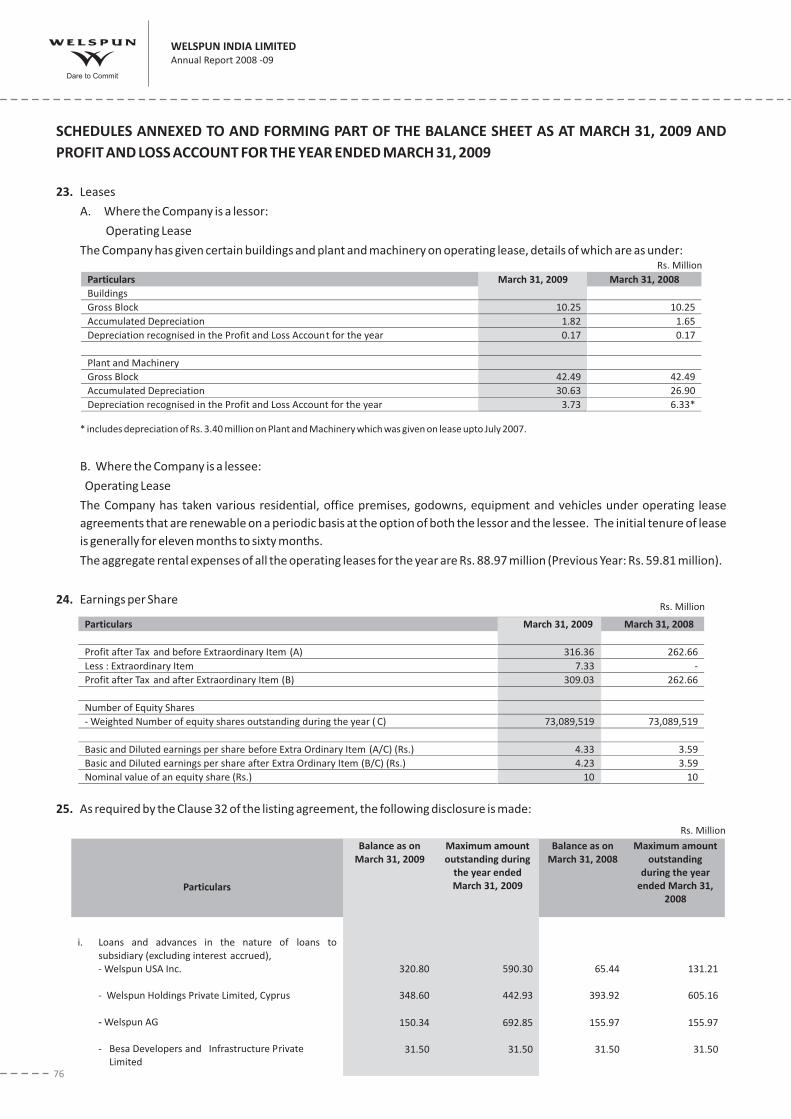
23.
24.
25.
Leases
A. Where the Company is a lessor:
Operating Lease
The Company has given certain buildings and plant and machinery on operating lease, details of which are as under:
B. Where the Company is a lessee:
Operating Lease
The Company has taken various residential, office premises, godowns, equipment and vehicles under operating lease
agreements that are renewable on a periodic basis at the option of both the lessor and the lessee. The initial tenure of lease
is generally for eleven months to sixty months.
The aggregate rental expenses of all the operating leases for the year are Rs. 88.97 million (Previous Year: Rs. 59.81 million).
Earnings per Share
As required by the Clause 32 of the listing agreement, the following disclosure is made:
* includes depreciation of Rs. 3.40 million on Plant and Machinery which was given on lease upto July 2007.
Particulars March 31, 2009 March 31, 2008
Buildings
Gross Block 10.25 10.25
Accumulated Depreciation 1.82 1.65
Depreciation recognised in the Profit and Loss Account for the year 0.17 0.17
Plant and Machinery
Gross Block 42.49 42.49
Accumulated Depreciation 30.63 26.90
Depreciation recognised in the Profit and Loss Account for the year 3.73 6.33*
Particulars March 31, 2009 March 31, 2008
Profit after Tax and before Extraordinary Item (A) 316.36 262.66
Less : Extraordinary Item 7.33 -
Profit after Tax and after Extraordinary Item (B) 309.03 262.66
Number of Equity Shares
- Weighted Number of equity shares outstanding during the year ( C) 73,089,519 73,089,519
Basic and Diluted earnings per share before Extra Ordinary Item (A/C) (Rs.) 4.33 3.59
Basic and Diluted earnings per share after Extra Ordinary Item (B/C) (Rs.) 4.23 3.59
Nominal value of an equity share (Rs.) 10 10
Particulars
Balance as on
March 31, 2009
Maximum amount
outstanding during
the year ended
March 31, 2009
Balance as on
March 31, 2008
Maximum amount
outstanding
during the year
ended March 31,
2008
i. Loans and advances in the nature of loans to
subsidiary (excluding interest accrued),
- Welspun USA Inc.
- Welspun Holdings Private Limited, Cyprus
- Welspun AG
- Besa Developers and Infrastructure Private
Limited
320.80
348.60
150.34
31.50
590.30
442.93
692.85
31.50
65.44
393.92
155.97
31.50
131.21
605.16
155.97
31.50
Rs. Million
Rs. Million
Rs. Million
WELSPUN INDIA LIMITEDAnnual Report 2008 -09
SCHEDULES ANNEXED TO AND FORMING PART OF THE BALANCE SHEET AS AT MARCH 31, 2009 AND
PROFIT AND LOSS ACCOUNT FOR THE YEAR ENDED MARCH 31, 2009
76

26.
27.
28
29
The Income Tax Department had disallowed certain expenditure claimed by the Company in its income tax returns for the
Assessment Years 1998-1999 and 2001-2002. During the year, the Income Tax Appellate Tribunal decided the matter in the
Company's favour, consequent to which, the Company has recognised deferred tax asset aggregating Rs. 75.23 million on
unabsorbed depreciation pertaining to the aforesaid assessment years.
Due to floods at the Company's manufacturing unit at Anjar in the year 2008, certain inventory, machinery and buildings
were damaged. Loss arising on account of these floods (net of insurance claim received) aggregating Rs. 11.10 million has
been included under 'Extraordinary item' in the Profit and Loss Account. The extraordinary item disclosed is net of tax
impact of Rs. 3.77 million.
. Refer Annexure for additional information to Part IV of Schedule VI to the Act.
. Prior year comparatives have been reclassified to conform with the current year's presentation, wherever applicable.
ii. Loans and advances in the nature of loans to
associates
- Welspun Retail Limited 42.68 42.68 - -
iii. Loans and advances in the nature of loans where there
is no repayment schedule, or interest below rate
specified as per Section 372A of the Companies Act,
1956.
- Welspun USA Inc.
- Welspun Holdings Private Limited, Cyprus
- Welspun AG
- Besa Developers and Infrastructure Private
Limited
-
-
-
-
-
-
-
-
65.44
393.92
155.97
31.50
131.21
605.16
155.97
31.50
iv. Loans and advances in the nature of loans to firms/
companies in which directors are interested
- - - -
v. Investments by the Loanee in the shares of the
Company as on March 31, 2009
- - - -
Particulars
Balance as on
March 31, 2009
Maximum amount
outstanding during
the year ended
March 31, 2009
Balance as on
March 31, 2008
Maximum amount
outstanding
during the year
ended March 31,
2008
Signatures to Schedules 1 to 19 forming part of the Accounts
For and on behalf of the Board of Directors
Neeraj Gupta B. K. Goenka R. R. MandawewalaPartner Chairman & Managing DirectorMembership No. F055158For and on behalf ofPrice Waterhouse & Co.Chartered Accountants M. L. Mittal
Executive Director (Finance) Company Secretary
Mumbai, June 30, 2009 Mumbai, June 30, 2009
Joint Managing Director
D. K. Patil
77
SCHEDULES ANNEXED TO AND FORMING PART OF THE BALANCE SHEET AS AT MARCH 31, 2009 AND
PROFIT AND LOSS ACCOUNT FOR THE YEAR ENDED MARCH 31, 2009

For the Year Ended For the Year Ended
March 31, 2009 March 31, 2008
Rs. million Rs. million Rs. million
78
WELSPUN INDIA LIMITEDAnnual Report 2008 -09
CASH FLOW STATEMENT FOR THE YEAR ENDED MARCH 31, 2009
A. CASH FLOW FROM OPERATING ACTIVITIES
Net Profit Before Tax 264.70 414.52
Adjustments for :
Depreciation 952.98 847.19
Unrealised Foreign Exchange Differences (49.93) (20.84)
Loss on Sale of Fixed Assets 15.08 6.91
Gain on Premature Redemption of Debentures - (3.52)
Profit on Redemption/ Sale of Units of Mutual Funds (3.60) (1.23)
Profit on Sale of Bonds (2.00) (4.97)
Profit on sale of Shares (221.35) -
Dividend (16.56) (25.83)
Liabilities Written Back as no Longer Required (1.43) (0.53)
Provision for Doubtful Debts/ Advances Written Back - (5.83)
Provision for Doubtful debts/ Advances 1.24 18.69
Debts/ Advances Written off 4.25 5.57
Excise Benefits Receivable Written Off - 43.23
Extraordinary Item (11.10) -
Provision for diminution in value of Investments - -
Interest Income and Cash Discount Received (138.58) (83.15)
Interest and Other Expenses 1,059.69 760.00
1,588.69 1,535.69
Operating Profit Before Working Capital Changes 1,853.39 1,950.21
Adjustments for changes in working capital :
Trade and Other Receivables (1,395.52) (653.30)
Inventories 796.29 (535.48)
Current Liabilities and Provisions 68.63 526.88
(530.60) (661.90)
Cash Flow Generated from Operations 1,322.79 1,288.31
Income Tax and Fringe Benefit Tax paid (45.46) (88.41)
Net Cash Flow from Operating Activities 1,277.33 1,199.90
B. CASH FLOW USED IN INVESTING ACTIVITIES
Purchase of Fixed Assets (Including Capital Work-in-progress) (1,739.59) (3,160.72)
Sale of Fixed Assets 17.46 4.69
Capital Subsidy 39.27 14.79
Purchase of Investment in Subsidiaries (net of sales) (282.23) (4.15)
Sale of Other Investments (net of purchases) 367.22 771.03
Dividend Received 16.56 25.83
Interest Received 14.96 9.35
Net Cash Flow used in Investing Activities (1,566.35) (2,339.18)
C. CASH FLOW FROM FINANCING ACTIVITIES
Redemption of Preference Shares - (102.26)
Redemption of Debentures - (168.08)
Proceeds from Borrowings - Long Term 1,770.73 2,012.08
Repayment of Borrowings - Long Term (1,074.23) (788.12)
Proceeds/ Repayments of Other Borrowings 465.69 432.82
Interest and Other Finance Expenses Paid (905.55) (966.53)
Net Cash Flow from Financing Activities 256.64 419.91
( A + B + C ) (32.38) (719.37)
Cash and Cash Equivalents at the beginning of the year 920.51 1,639.88
Cash and Cash Equivalents at the end of the year 888.13 920.51
Net Decrease in Cash and Cash Equivalents (32.38) (719.37)
(0.00)NOTES : 0.001. The Cash Flow Statement has been prepared under the "Indirect method" as set out in Accounting Standard - 3 on
Cash Flow Statements issued by the Institute of Chartered Accountants of India.
2. Previous year's comparatives have been reclassified to conform with the current year's presentation, wherever applicable.
This is the Cash Flow Statement referred to in out report of even date.
Neeraj Gupta
Partner
Membership No. F055158
For and on behalf of
Price Waterhouse & Co.
Chartered Accountants
Mumbai, June 30, 2009
For and on behalf of the Board of Directors
B. K. Goenka R. R. Mandawewala
Chairman and Managing Director
M. L. Mittal D. K. Patil
Director (Finance) Company Secretary
Mumbai, June 30, 2009
Joint Managing Director

79
Additional Information pursuant to Part IV of Schedule VI to the Act.Balance Sheet Abstract and Company's General Business Profile
ANNEXURE
I Registration Details
Registration No. U 9 9 9 9 9 M H 1 9 8 5 P T C 0 3 5 0 9 2 State Code 0 4
Balance Sheet Date 3 1 0 3 2 0 0 9
II Capital Raised During the Year (Amount in Rs. Thousands)
Rights Issue
N I L N I L
Private Placement
N I L N I L
III Position of Mobilisation and Deployment of Funds (Amount in Rs. Thousands)
Total Liabilities Total Assets
2 5 0 9 7 7 0 3 2 5 0 9 7 7 0 3
Sources of Funds Paid-up Capital Equity Warrants
7 8 0 9 0 0 N I L
Reserves and Surplus Secured Loans
4 8 2 1 3 7 2 1 6 0 8 9 0 9 0
Unsecured Loans Deferred Tax Liability (Net)
5 0 0 0 3 0 1 0 3 9 8 3 0
Application of Funds Net Fixed Assets Incidental Expenditure Pending Capitalisation/ Allocation
1 5 7 7 3 8 1 0 5 4 0 5 2
Investments Net Current Assets
1 0 4 6 7 1 0 6 3 5 6 6 5 0
Accumulated Losses Miscellaneous Expenditure
N I L N I L
IV Performance of Company (Amount in Rs. Thousands)
Turnover (including Other Income) Total Expenditure
1 3 6 1 6 0 0 0 1 3 3 6 2 3 0 3
+ - Profit/Loss Before Tax + - Profit/Loss after Tax
2 5 3 6 9 7 3 0 9 0 2 8
(Please tick appropriate box + for Positive, - for Negative) (Please tick appropriate box + for Positive, - for Negative)
Earnings Per Share after extraordinary
+ - items (Basic and Diluted) (In Rs.) Dividend Rate %
4 . 2 3 - - -
Public Issue
Bonus Issue
Date Month Year
V Generic Names of Three Principal Products / Services of Company (as per monetary terms)
Item Code No. (ITC Code) Product Description
6 3 0 4 9 2 5 0 C O T T O N T E R R Y T O W E L
6 3 0 4 1 9 1 0 C O T T O N B E D S H E E T
5 2 0 5 1 1 0 0 C O T T O N Y A R N
On behalf of the Board of Directors
B. K. Goenka R. R. Mandawewala
Chairman & Managing Director Joint Managing Director
M. L. Mittal D. K. Patil
Executive Director (Finance) Company Secretary
Mumbai, June 30, 2009

*C
on
soli
da
ted
Fig
ure
for
the
Co
mp
an
ya
nd
all
it's
sub
sid
iari
es
isg
ive
n.
STA
TE
ME
NT
PU
RS
UA
NT
TO
SE
CT
ION
21
2O
FT
HE
CO
MP
AN
IES
AC
T,1
95
6,
RE
LAT
ING
TO
SU
BS
IDIA
RY
CO
MP
AN
IES
1N
am
eo
fth
esu
bsi
dia
ryco
mp
an
yW
els
pu
nU
SA
Inc.
We
lsp
un
Ho
ldin
gs
Pvt.
Ltd
.
We
lsp
un
Ho
me
Text
ile
sU
K
Ltd
.
CH
T
Ho
ldin
gs
Ltd
.
Ch
rist
y
Ho
me
Text
ile
sLt
d.
Ch
rist
yU
K
Ltd
.
ER
Kin
gsl
ey
(Te
xtil
es)
Ltd
.
Ch
rist
y2
00
4
Ltd
.
Fly
spa
rkLt
d.
Ch
rist
y
Eu
rop
e
Gm
bH
We
lsp
un
AG
We
lsp
un
Me
xico
SA
de
CV
SO
RE
MA
-
Tap
ete
sE
Co
rtin
as
DE
Ba
nh
o,
S.A
.
Be
sa
De
velo
pe
rs
an
d
Infr
ast
ruct
ur
eP
riva
te
Lim
ite
d
SO
RE
MA
We
lsp
un
Dis
trib
uti
on
& L
og
isti
cs,
S.
A.,
Po
rtu
ga
l
SO
RE
MA
We
lsp
un
Esp
an
aS
.L.
U.,
Sp
ain
SO
RE
MA
We
lsp
un
Be
ne
lux
B.
V.,
Ho
lla
nd
We
lsp
un
Glo
ba
l
Bra
nd
sLi
mit
ed
We
lsp
un
Inve
stm
en
ts
Lim
ite
d
2F
ina
nci
al
Yea
ro
fth
esu
bsi
dia
rye
nd
ed
on
31
-Ma
r-0
93
1-M
ar-
09
31
-Ma
r-0
93
1-M
ar-
09
31
-Ma
r-0
93
1-M
ar-
09
31
-Ma
r-0
93
1-M
ar-
09
31
-Ma
r-0
93
1-M
ar-
09
31
-Ma
r-0
93
1-M
ar-
09
31
-Ma
r-0
93
1-M
ar-
09
31
-Ma
r-0
93
1-M
ar-
09
31
-Ma
r-0
93
1-M
ar-
09
31
-Ma
r-0
9
Sh
are
so
fth
esu
bsi
dia
ryC
om
pa
ny
he
ldo
nth
ea
bo
ve
da
tea
nd
ext
en
to
fh
old
ing
(i)
Eq
uit
ysh
are
s1
,50
0,0
00
com
mo
n
sto
cko
fU
SD
0.1
0e
ach
.
5,0
00
Eq
uit
y
Sh
are
so
f
GB
P1
ea
ch
full
yp
aid
up
4,0
00
,00
1
Eq
uit
y
Sh
are
so
f
GB
P1
ea
ch
full
yp
aid
up
40
,10
0
ord
ina
ry
sha
res
of
GB
P0
.01
ea
ch
40
0o
rdin
ary
sha
res
of
GB
P1
ea
ch
60
0'A
'
ord
ina
ry
sha
res
of
GB
P1
ea
ch
1,0
00
ord
ina
ry
sha
res
of
GB
P1
ea
ch
2,0
00
ord
ina
ry
sha
res
of
GB
P1
ea
ch
1o
rdin
ary
sha
reo
fG
BP
1e
ach
1o
rdin
ary
sha
reo
fG
BP
1e
ach
EU
RO
25
,56
4.5
9
17
00
0sh
are
s
of
CH
F1
,00
0
ea
chp
aid
up
pe
rsh
are
50
,00
0
sha
res
of
1
pe
soe
ach
45
,60
0
sha
res
of
Eu
ro1
0e
ach
10
,00
0
eq
uit
y
sha
res
of
Rs.
10
ea
ch
38
00
sha
res
of
Eu
ro1
0
ea
ch
38
00
sha
res
of
Eu
ro1
0
ea
ch
13
68
sha
res
of
Eu
ro1
0
ea
ch
50
0,0
00
eq
uit
y
sha
res
of
Rs.
10
ea
ch
50
,00
0e
qu
ity
sha
res
of
Rs.
10
ea
ch
(ii)
Ext
en
to
fh
old
ing
10
0%
10
0%
10
0%
10
0%
10
0%
10
0%
10
0%
10
0%
10
0%
10
0%
10
0%
10
0%
76
%1
00
%7
6%
76
%7
6%
10
0%
10
0%
Ne
tA
gg
rega
tea
mo
un
to
fp
rofi
ts/
(lo
sse
s)o
fsu
bsi
dia
ry
for
the
ab
ove
fin
an
cia
lye
ar
sofa
ra
sth
ey
con
cern
Me
mb
ers
of
We
lsp
un
Ind
iaLi
mit
ed
(i)
De
alt
wit
hin
acc
ou
nts
of
We
lsp
un
Ind
iaLi
mit
ed
US
D
(20
2,6
03
)
GB
P
(42
2,3
64
)
GB
P
76
3,0
83
GB
P*
(33
,31
,96
5)
N.A
.N
.A.
N.A
.N
.A.
N.A
.N
.A.
US
D
(88
,51
,21
2.6
6)
US
D
(14
,75
,39
1.1
3)
EU
RO
S
(47
9,9
37
.02
)
N.A
.N
.A.
N.A
.N
.A.
6,4
03
,02
0.2
9(3
51
,12
7.5
8)
(ii)
No
td
ea
ltw
ith
inth
ea
cco
un
tso
fW
els
pu
nIn
dia
Lim
ite
d
N.A
.N
.A.
N.A
.N
.A.
N.A
.N
.A.
N.A
.N
.A.
N.A
.N
.A.
N.A
.N
.A.
EU
RO
S
(15
1,5
59
.06
)
N.A
.N
.A.
N.A
.N
.A.
N.A
.N
.A.
Ne
ta
gg
rega
tea
mo
un
to
fp
rofi
ts/
(lo
sse
s)fo
rp
revio
us
fin
an
cia
lye
ars
of
the
sub
sid
iary
as
far
as
itco
nce
rns
the
me
mb
ers
of
We
lsp
un
Ind
iaLi
mit
ed
(i)
De
alt
wit
hin
the
acc
ou
nts
of
We
lsp
un
Ind
iaLi
mit
ed
US
D
11
84
7
GB
P
(15
81
31
)
GB
P
(98
58
26
)
GB
P*
1,3
13
,07
1.5
0
N.A
.N
.A.
N.A
.N
.A.
N.A
.N
.A.
US
D
(1,4
56
,77
5.5
7)
US
D
39
,75
7.0
7
EU
RO
S
31
,09
8.8
1
N.A
.N
.A.
N.A
.N
.A.
N.A
.N
.A.
(ii)
No
td
ea
ltw
ith
inth
ea
cco
un
tso
fW
els
pu
nIn
dia
Lim
ite
d
N.A
.N
.A.
N.A
.G
BP
*
23
1,7
18
.50
GB
P
19
3,0
00
GB
P
83
2,0
00
GB
P
20
0,0
00
GB
P
42
4,0
00
Eu
ro*
16
6,0
00
N.A
.N
.A.
EU
RO
S
9,8
20
.68
N.A
.
3 4 5
NO
TA
PP
LIC
AB
LEA
ST
HE
SE
CO
MPA
NIE
SB
EC
AM
ES
UB
SID
IAR
IES
OF
WE
LSP
UN
IND
IALI
MIT
ED
DU
RIN
GT
HE
YE
AR
20
08
-09
For
an
do
nb
eh
alf
of
the
Bo
ard
of
Dir
ect
ors
B.
K.
Go
en
ka
R.
R.
Ma
nd
aw
ew
ala
Ch
air
ma
na
nd
Ma
na
gin
gD
ire
cto
r
M.
L.M
itta
lD
.K
.P
ati
l
Dir
ect
or
(Fin
an
ce)
Co
mp
an
yS
ecr
eta
ryD
ate
:3
0th
Jun
e,
20
09
Pla
ce:
Mu
mb
ai
Join
tM
an
ag
ing
Dir
ect
or
80
WELSPUN INDIA LIMITEDAnnual Report 2008 -09
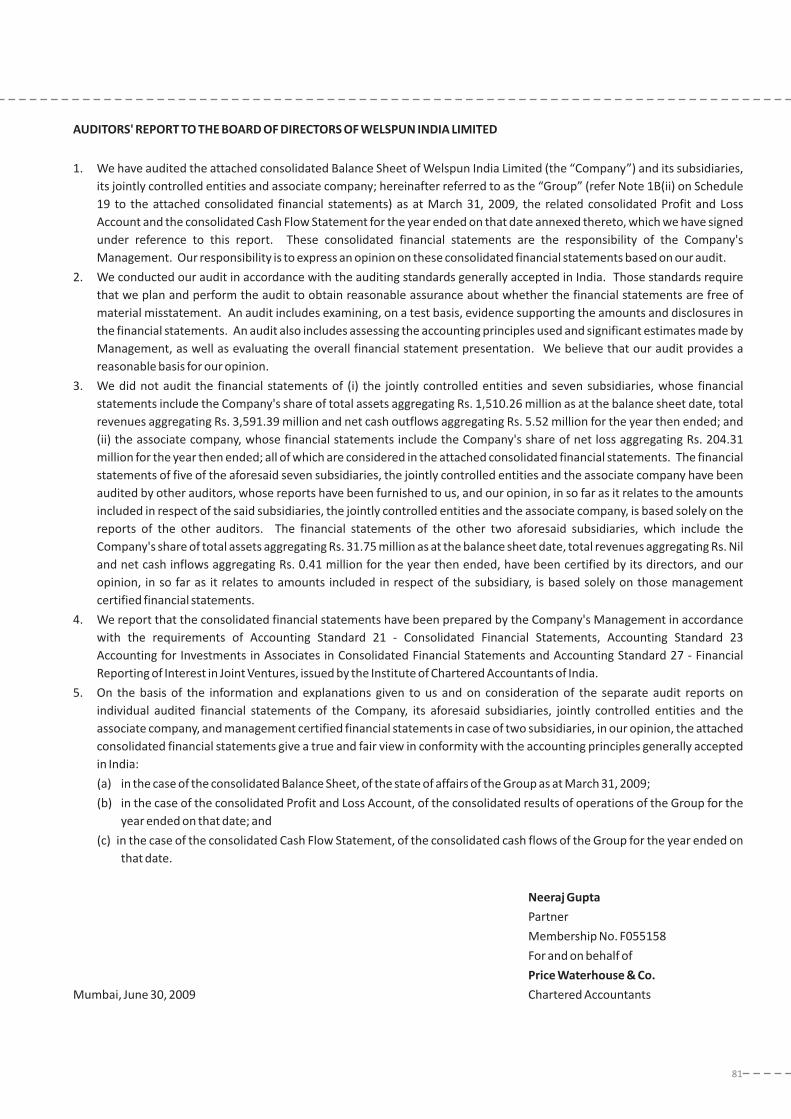
AUDITORS' REPORT TO THE BOARD OF DIRECTORS OF WELSPUN INDIA LIMITED
Neeraj Gupta
Price Waterhouse & Co.
1. We have audited the attached consolidated Balance Sheet of Welspun India Limited (the “Company”) and its subsidiaries,
its jointly controlled entities and associate company; hereinafter referred to as the “Group” (refer Note 1B(ii) on Schedule
19 to the attached consolidated financial statements) as at March 31, 2009, the related consolidated Profit and Loss
Account and the consolidated Cash Flow Statement for the year ended on that date annexed thereto, which we have signed
under reference to this report. These consolidated financial statements are the responsibility of the Company's
Management. Our responsibility is to express an opinion on these consolidated financial statements based on our audit.
2. We conducted our audit in accordance with the auditing standards generally accepted in India. Those standards require
that we plan and perform the audit to obtain reasonable assurance about whether the financial statements are free of
material misstatement. An audit includes examining, on a test basis, evidence supporting the amounts and disclosures in
the financial statements. An audit also includes assessing the accounting principles used and significant estimates made by
Management, as well as evaluating the overall financial statement presentation. We believe that our audit provides a
reasonable basis for our opinion.
3. We did not audit the financial statements of (i) the jointly controlled entities and seven subsidiaries, whose financial
statements include the Company's share of total assets aggregating Rs. 1,510.26 million as at the balance sheet date, total
revenues aggregating Rs. 3,591.39 million and net cash outflows aggregating Rs. 5.52 million for the year then ended; and
(ii) the associate company, whose financial statements include the Company's share of net loss aggregating Rs. 204.31
million for the year then ended; all of which are considered in the attached consolidated financial statements. The financial
statements of five of the aforesaid seven subsidiaries, the jointly controlled entities and the associate company have been
audited by other auditors, whose reports have been furnished to us, and our opinion, in so far as it relates to the amounts
included in respect of the said subsidiaries, the jointly controlled entities and the associate company, is based solely on the
reports of the other auditors. The financial statements of the other two aforesaid subsidiaries, which include the
Company's share of total assets aggregating Rs. 31.75 million as at the balance sheet date, total revenues aggregating Rs. Nil
and net cash inflows aggregating Rs. 0.41 million for the year then ended, have been certified by its directors, and our
opinion, in so far as it relates to amounts included in respect of the subsidiary, is based solely on those management
certified financial statements.
4. We report that the consolidated financial statements have been prepared by the Company's Management in accordance
with the requirements of Accounting Standard 21 - Consolidated Financial Statements, Accounting Standard 23
Accounting for Investments in Associates in Consolidated Financial Statements and Accounting Standard 27 - Financial
Reporting of Interest in Joint Ventures, issued by the Institute of Chartered Accountants of India.
5. On the basis of the information and explanations given to us and on consideration of the separate audit reports on
individual audited financial statements of the Company, its aforesaid subsidiaries, jointly controlled entities and the
associate company, and management certified financial statements in case of two subsidiaries, in our opinion, the attached
consolidated financial statements give a true and fair view in conformity with the accounting principles generally accepted
in India:
(a) in the case of the consolidated Balance Sheet, of the state of affairs of the Group as at March 31, 2009;
(b) in the case of the consolidated Profit and Loss Account, of the consolidated results of operations of the Group for the
year ended on that date; and
(c) in the case of the consolidated Cash Flow Statement, of the consolidated cash flows of the Group for the year ended on
that date.
Partner
Membership No. F055158
For and on behalf of
Mumbai, June 30, 2009 Chartered Accountants
81

82
WELSPUN INDIA LIMITEDAnnual Report 2008 -09
CONSOLIDATED BALANCE SHEET AS AT MARCH 31, 2009
19 (0.00) (0.00)(0.00)
The Schedules referred to herein form an integral part of the Consolidated Balance Sheet.
For and on behalf of the Board of Directors
B. K. Goenka R. R. Mandawewala
Chairman & Managing Director
M. L. Mittal
Executive Director (Finance) Company Secretary
Mumbai, June 30, 2009
Joint Managing Director
D. K. Patil
SOURCES OF FUNDS
SHAREHOLDERS' FUNDSCapitalReserves and Surplus
Minority Interest
LOAN FUNDSSecured LoansUnsecured Loans
DEFERRED TAX LIABILITY (NET)
APPLICATION OF FUNDS
FIXED ASSETSGross BlockLess : DepreciationNet BlockCapital Work-in-progress
Incidental Expenditure Pending Capitalisation/ Allocation
INVESTMENTS
CURRENT ASSETS, LOANS AND ADVANCESInventoriesSundry DebtorsCash and Bank BalancesLoans, Advances and Other Current Assets
LESS : CURRENT LIABILITIES AND PROVISIONSLiabilitiesProvisions
NET CURRENT ASSETS
NOTES TO ACCOUNTS
This is the Consolidated Balance Sheet referred to in our report of the even date.
Neeraj Gupta
PartnerMembership No. F055158For and on behalf ofPrice Waterhouse & Co.
Chartered Accountants
Mumbai, June 30, 2009
As at As atMarch 31, 2009 March 31, 2008
SCHEDULES Rs. million Rs. million
1 780.90 780.902 3,659.35 4,500.20
4,440.25 5,281.10
20.30 194.01
3 18,186.71 17,048.054 529.62 303.79
18,716.33 17,351.84
5 1,046.70 1,085.51
24,223.58 23,912.46
6A 21,813.34 19,556.135,146.42 4,327.48
16,666.92 15,228.65997.27 1,599.33
17,664.19 16,827.98
6B 55.28 65.94
7 314.16 273.89
8 4,215.28 3,846.659 1,434.95 1,384.0710 1,197.87 1,298.6411 2,557.85 2,404.64
9,405.95 8,934.0012
3,141.65 2,148.9874.35 40.37
3,216.00 2,189.35
6,189.95 6,744.65
24,223.58 23,912.46

CONSOLIDATED PROFIT AND LOSS ACCOUNT FOR THE YEAR ENDED MARCH 31, 2009
INCOMESalesLess : Excise Duty
Other Income
EXPENDITUREMaterials and Manufacturing ExpensesEmployees' Remuneration and BenefitsSelling, Administration and Other ExpensesFinance Expenses (Net)Depreciation
PROFIT/ (LOSS) BEFORE EXCEPTIONAL ITEMS AND TAXATIONExceptional Items (Refer Note 20 on Schedule 19)PROFIT/ (LOSS) BEFORE TAXATION FROM ORDINARY ACTIVITIES
PROFIT/ (LOSS) BEFORE TAXATION FROM ORDINARY ACTIVITIES AND FROM CONTINUING OPERATIONSProvision For Taxation- Current Tax- Less : Minimum Alternative Tax Credit Availed
- Deferred Tax- Fringe Benefit TaxPROFIT/ (LOSS) AFTER TAXATION FROM ORDINARY ACTIVITIES AND FROM CONTINUING OPERATIONSExtraordinary Item (net of deferred tax credit of Rs. 3.77 million) (Refer Note 25 on Schedule 19)PROFIT/ (LOSS) AFTER TAXATION FROM CONTINUING OPERATIONS
PROFIT/ (LOSS) BEFORE TAXATION FROM ORDINARY ACTIVITIES AND FROMDISCONTINUING OPERATIONS AND BEFORE SHARE OF LOSS OF ASSOCIATE ANDMINORITY INTERESTProvision For Taxation- Current Tax- Deferred Tax- Fringe Benefit TaxPROFIT/ (LOSS) AFTER TAXATION FROM ORDINARY ACTIVITIES AND FROMDISCONTINUING OPERATIONS AND BEFORE SHARE OF LOSS OF ASSOCIATE ANDMINORITY INTERESTShare of Associate's Net LossPROFIT/ (LOSS) AFTER TAXATION FROM ORDINARY ACTIVITIES AND FROMDISCONTINUING OPERATIONS AND BEFORE SHARE OF LOSS OF MINORITY INTEREST
Minority's Share of Profit/ (Loss) in Certain Subsidiary CompaniesPROFIT/ (LOSS) AFTER TAXATION FROM ORDINARY ACTIVITIES AND FROMDISCONTINUING OPERATIONS
NET PROFIT/ (LOSS)
Profit and Loss Account Balance Brought Forward
PROFIT AVAILABLE FOR APPROPRIATION
APPROPRIATIONSTransfer to Capital Redemption ReserveTransfer from Debenture Redemption ReserveProfit and Loss Account Balance Carried to Balance Sheet
Loss Per Share (Rs.) - (Refer Note 26 on Schedule 19)- Basic and Diluted before Extraordinary Item- Basic and Diluted after Extraordinary Item
NOTES TO ACCOUNTS
The Schedules referred to herein form an integral part of the Consolidated Profit and Loss Account.
This is the Consolidated Profit and Loss Account referred to in our report of the even date.
Neeraj GuptaPartnerMembership No. F055158For and on behalf ofPrice Waterhouse & Co.Chartered Accountants
Year endedMarch 31, 2009
Rs. million
17,000.359.15
16,991.20254.34
17,245.54
11,339.942,034.262,212.951,176.561,086.57
17,850.28
(604.74)(38.52)
(643.26)
(98.36)
31.95(27.10)
4.85(62.99)
2.97(43.19)
7.33(50.52)
(544.90)
(53.31)27.84
6.21(525.64)
(204.31)(729.95)
(14.90)(715.05)
(765.57)
1,374.83
609.26
--
609.26609.26
10.3710.47
Year endedMarch 31, 2008
Rs. million
16,495.1931.26
16,463.93377.61
16,841.54
10,783.141,698.582,328.81
781.94951.74
16,544.21
297.3343.71
341.04
146.88
45.39(44.50)
0.89142.86
2.890.24-
0.24
194.16
53.31(14.41)
6.51148.75
(146.45)2.30
4.09(1.79)
(1.55)
1,376.71
1,375.16
30.00(29.67)
1,374.831,375.16
0.020.02
SCHEDULES
13
14
15161718
(A)
(B)
(A) + (B)
19
For and on behalf of the Board of Directors
B. K. Goenka R. R. MandawewalaChairman & Managing Director
M. L. MittalExecutive Director (Finance) Company Secretary
Joint Managing Director
D. K. Patil
Mumbai, June 30, 2009 Mumbai, June 30, 2009
83

84
WELSPUN INDIA LIMITEDAnnual Report 2008 -09
SCHEDULES ANNEXED TO AND FORMING PART OF THE CONSOLIDATED BALANCE SHEET AS AT MARCH 31, 2009
SCHEDULE 1 : CAPITAL
Authorised81,500,000 Equity Shares of Rs. 10 each1,100,000 Redeemable Cumulative Preference Shares of Rs. 100 each
23,500,000 Redeemable Cumulative Preference Shares of Rs. 10 each
Issued, Subscribed and Paid Up73,089,519 Equity Shares of Rs. 10 each fully paid up
500,000 0% Redeemable Cumulative Preference Shares of Rs. 100each fully paid up (Refer Note 12 on Schedule 19)
Less : Adjustment for 50 Equity Shares representing 50% of 100 equity shares of Welspun India Limitedheld by Welspun Zucchi Textiles Limited, a jointly controlled entity.
* Less than Rs. 1,000
SCHEDULE 2 : RESERVES AND SURPLUS
Securities Premium AccountAs per last Balance SheetLess : Premium on Redemption of Preference Shares
Capital Redemption ReserveAs per last Balance SheetAdd : Transferred from Profit and Loss Account
Debenture Redemption ReserveAs per last Balance SheetLess : Transferred to Profit and Loss Account
Capital Reserve - Forfeiture of Equity Warrants
Capital Reserve- Arising on Dilution in Shareholding of Associate Company (Refer Note 7 on Schedule 19)- Arising on Dilution of Interest in Joint Venture- Arising on Acquisition of Interest in Joint Venture
Hedging Reserve
Foreign Exchange Translation Reserve
Profit and Loss Account[includes Share in Joint Ventures - Loss of Rs. 27.46 million (March 31, 2008 : Profit of Rs. 20.81 million)]
SCHEDULE 3 : SECURED LOANS
Term Loans (Refer Notes 11(a) & 11(b) on Schedule 19)- From Banks
- In Rupee- In Foreign Currency
Working Capital Loans from Banks (Refer Notes 11(c) & 11(d) on Schedule 19)
Hire Purchase Finance Loans from Banks
Share in Joint Venture
SCHEDULE 4 : UNSECURED LOANS
Interest Free Sales Tax Loan (Repayable in six annual installments for each disbursement tillOctober 7, 2010) (Repayable within one year Rs. 0.01 million; March 31, 2008 : Rs. 0.37 million)Short Term Loans from Banks
Share in Joint Venture
815.00110.00235.00
1,160.00
730.9050.00
780.90
*
780.90
2,710.3772.26
2,638.11
398.3830.00
428.38
29.6729.67
-48.18
--
0.080.08
-
10.62
1,374.834,500.20
12,305.021,069.76
3,153.79
5.0016,533.57
514.48
17,048.05
0.40
288.43
14.96
303.79
As atMarch 31, 2008
Rs. million
As atMarch 31, 2009
Rs. million
815.00110.00235.00
1,160.00
730.9050.00
780.90
*
780.90
2,638.11-
2,638.11
428.38-
428.38
---
48.18
380.3928.070.08
408.54
(332.63)
(140.49)
609.263,659.35
13,049.921,256.44
3,603.72
-17,910.08
276.63
18,186.71
0.03
500.00
29.59
529.62

SCHEDULE 6A : FIXED ASSETS
(Refer Notes 1(C)(i), (ii), (iii), (iv), (xi), 14 and 19 on Schedule 19) Rs. million
PARTICULARS As at
March 31, 2008
As at
March 31, 2009
Accumulated upto
March 31, 2008
Accumulated upto
March 31, 2009
As at
March 31, 2009
As at
March 31, 2008
Freehold Land 72.65 99.25 - - 99.25 72.65
Buildings 2,545.47 2,985.58 261.62 331.99 2,653.59 2,283.85
Leasehold Improvements 16.23 88.44 12.86 4.23 84.21 3.37
Plant and Machinery (Refer Note 1 below) 14,956.14 16,426.74 3,549.73 4,167.34 12,259.40 11,406.41
Vehicles (Refer Note 2 below) 64.54 69.30 30.36 35.99 33.31 34.18
Furniture and Fixtures 292.29 390.14 142.07 198.11 192.03 150.22
Office Equipment 74.28 131.00 37.53 38.49 92.51 36.75
Computer Hardware 218.25 259.95 137.84 157.47 102.48 80.41
Computer Software 50.69 95.71 27.53 37.73 57.98 23.16
Goodwill on Consolidation of Subsidiaries and
Jointly controlled Entities933.13 961.17 49.39 75.49
885.68 883.74
Goodwill on Amalgamation 1.56 1.56 1.56 1.56 - -
Development Expenditure 52.22 70.15 51.57 66.81 3.34 0.65
TOTAL 19,277.45 21,578.99 4,302.06 5,115.21 16,463.78 14,975.39
Share in Joint Venture 278.68 234.35 25.42 31.21 203.14 253.26
TOTAL 19,556.13 21,813.34 4,327.48 5,146.42 16,666.92 15,228.65
Previous Year 15,330.87 19,556.13 3,113.94 4,327.48
Capital Work-in-progress [including Capital Advances Rs. 86.18 million (March 31, 2008 : Rs. 215.32 million)] 958.70 1,543.76
Share in Joint Venture [including Capital Advances Rs. 15.54 million (March 31, 2008 : Rs. 5.98 million)] 38.57 55.57
997.27 1,599.33
17,664.19 16,827.98
GROSS BLOCK DEPRECIATION NET BLOCK
Notes:
1) Net book value of Plant and Machinery of Rs. 8.77 million (March 31, 2008 : Rs. 21.60 million) is acquired under finance lease.
2) Net book value of Vehicles of Rs. 5.97 million (March 31, 2008 : Rs. Nil) is acquired under finance lease.
3) Capital Work-in-progress includes adjustment for capital subsidy of Rs. 28.24 million (Previous year : Rs. Nil) granted under the Technology
Upgradation Fund (TUF) Scheme.
SCHEDULES ANNEXED TO AND FORMING PART OF THE CONSOLIDATED BALANCE SHEET AS AT MARCH 31, 2009
As atMarch 31, 2008
Rs. million
As atMarch 31, 2009
Rs. million
SCHEDULE 5 : DEFERRED TAX LIABILITY (NET)(Refer Note 1C(vii)(b) on Schedule 19)
Deferred Tax Liability arising on account of Timing differences in :- Depreciation
Deferred Tax Asset arising on account of Timing differences in:- Provision for Doubtful Debts/ Advances- Provision for Unpaid Statutory Dues- Provision for Employee Benefits- Provision for Diminution in Value of Investments- Deferred Rent- Unabsorbed Depreciation and Net Operating Losses- Provision for Others
Share in Joint Venture
1,926.69
20.085.78
14.66-
0.23836.53
1.00878.28
(1.71)
1,046.70
1,626.66
8.1519.0211.754.530.28
498.30-
542.03
0.88
1,085.51
85

As atMarch 31, 2008
Rs. million
As atMarch 31, 2009
Rs. million(Refer Notes 1C(ii) on Schedule 19)
Opening Balance (A)
Add :
Raw Material Consumption during Trial Run
Stores and Spares Consumed
Dyes and Chemicals Consumed
Packing Material Consumed
Job Work Expenses
Power and Fuel
Freight, Forwarding and Coolie Charges
Repairs and Maintenance
- Others
Salaries, Wages, Bonus and Allowances
Contribution to Provident and Other Funds
Staff and Labour Welfare
Rent
Rates and Taxes
Printing and Stationery
Travelling and Conveyance
Legal and Professional Charges
Insurance
Communication
Loss on Redemption/ Sale of Units of Mutual Funds (Net)
Postage and Courier
Vehicle Expenses
Advertising and Sales Promotion
Interest on Fixed Loans
Interest on Working Capital Loans
Discounting and Bank Charges
Loan Processing Charges
Miscellaneous
Less :
Sales during Trial Run
Sale of Scrap
Export Benefits
Interest on Deposit Accounts - Gross
(Tax Deducted at Source Rs. 3.06 million; Previous Year : Rs. 7.24 million)
Interest on Bonds - Gross
(Tax Deducted at Source : Rs. Nil; Previous Year : Rs. 1.21 million)
Profit on Redemption/ Sales of Units of Mutual Funds
Dividend
Increase in Stocks During Trial Run
Less : Transferred to :
Plant and Machinery
Buildings
Incidental Expenditure Pending Capitalisation/ Allocation
Share in Joint Venture
Total Incidental Expenditure Pending Capitalisation/ Allocation
SCHEDULE 6B : INCIDENTAL EXPENDITURE PENDING CAPITALISATION/ ALLOCATION
65.94 41.24
81.15 -
4.77 -
15.05 -
8.47 -
8.45 -
4.48 3.03
3.84 0.20
0.10 0.25
59.07 26.63
4.01 0.65
1.01 0.34
- 1.91
0.43 1.49
0.19 0.02
5.83 9.17
4.79 5.84
1.55 3.18
0.11 0.66
0.03 -
0.65 0.09
0.14 -
9.52 -
97.52 138.13
0.02 0.14
1.00 0.66
- 2.40
8.02 4.86
(B) 320.20 199.65
118.83 -
0.58 -
8.90 -
13.48 33.99
- 6.42
- 2.29
2.91 30.09
46.44 -
(C) 191.14 72.79
(A) + (B) - (C) 195.00 168.10
113.52 87.11
27.43 18.21
54.05 62.78
1.23 3.16
55.28 65.94
86
WELSPUN INDIA LIMITEDAnnual Report 2008 -09
SCHEDULES ANNEXED TO AND FORMING PART OF THE CONSOLIDATED BALANCE SHEET AS AT MARCH 31, 2009

SCHEDULES ANNEXED TO AND FORMING PART OF THE CONSOLIDATED BALANCE SHEET AS AT MARCH 31, 2009
As atMarch 31, 2008
Rs. million
As atMarch 31, 2009
Rs. millionSCHEDULE 7 : INVESTMENTS(Refer Note 1(C)(v) on Schedule 19)
Non - TradeInvestment in Government SecuritiesNational Saving Certificates(Lodged with District Magistrate, Valsad)
Trade - Long Term (At Cost)(Unquoted)In Others
9,800,000 Equity Shares of Rs. 10 each fully paid up of Welspun Retail LimitedCost of acquisition (including goodwill of Rs. 0.02 million)Add : Increase in carrying value arising on dilution in shareholding(Refer Note 7 on Schedule 19)Less : Company's Share of Loss as at the year end
100 Equity Shares of Rs. 10 each fully paid up of Welspun Power and Steel Limited* - Less than Rs. 10,000
(Quoted)283,500 Equity Shares of Rs. 10 each fully paid up of Welspun Syntex Limited
Less : Provision for Permanent Diminution
4,033,000 (March 31, 2008 : 7,133,000) Equity Shares of Rs. 5 each fully paid up of WelspunGujarat Stahl Rohren Limited
Current (At Lower of Cost and Fair Value)Non Trade - (Unquoted, Unlisted)
Investment In Mutual Funds Units of Rs. 10 eachNil (March 31, 2008 : 600,357) DWS Installment Cash Plus Fund - Daily Dividend PlanNil (March 31, 2008 : 241,114) LICMF Liquid Fund - Dividend PlanNil (March 31, 2008 : 4,437,300) LICMF Floating Rate Fund - Short Term Plan - Dividend OptionNil (March 31, 2008 : 23,668) Principal Floating Rate Fund - Daily Dividend Reinvestment PlanNil (March 31, 2008 : 13,490) Reliance Liquid Fund - Treasury Plan Retail Option
Investment In BondsNil (March 31, 2008 : 217) Zero Coupon Redeemable Deep Discount (2008 Series-II) Punjab
Infrastructure Development Bonds
Share in Joint Venture
Aggregate of Unquoted Investments - At Book ValueAggregate of Quoted Investments - At Book ValueAggregate of Quoted Investments- At Market Value
0.01
244.63-
244.63148.7795.86
*
18.9413.345.60
56.65
6.182.65
45.050.240.14
54.26
61.39
273.77
0.12
273.89
211.6462.25
2,740.78
0.01
244.63380.39625.02353.08271.94
*
18.9413.345.60
32.03
------
-
309.58
4.58
314.16
276.5337.63
301.32
SCHEDULE 8 : INVENTORIES(Refer Note 1(C)(vi) on Schedule 19)
Raw MaterialsWork-in-ProcessFinished Goods and Traded Goods (Refer Note 23 on Schedule 19)Stores, Spares, Dyes and Chemicals
Share in Joint Venture
848.411,260.061,313.49
264.333,686.29
160.36
3,846.65
794.401,099.801,944.19
209.524,047.91
167.37
4,215.28
87
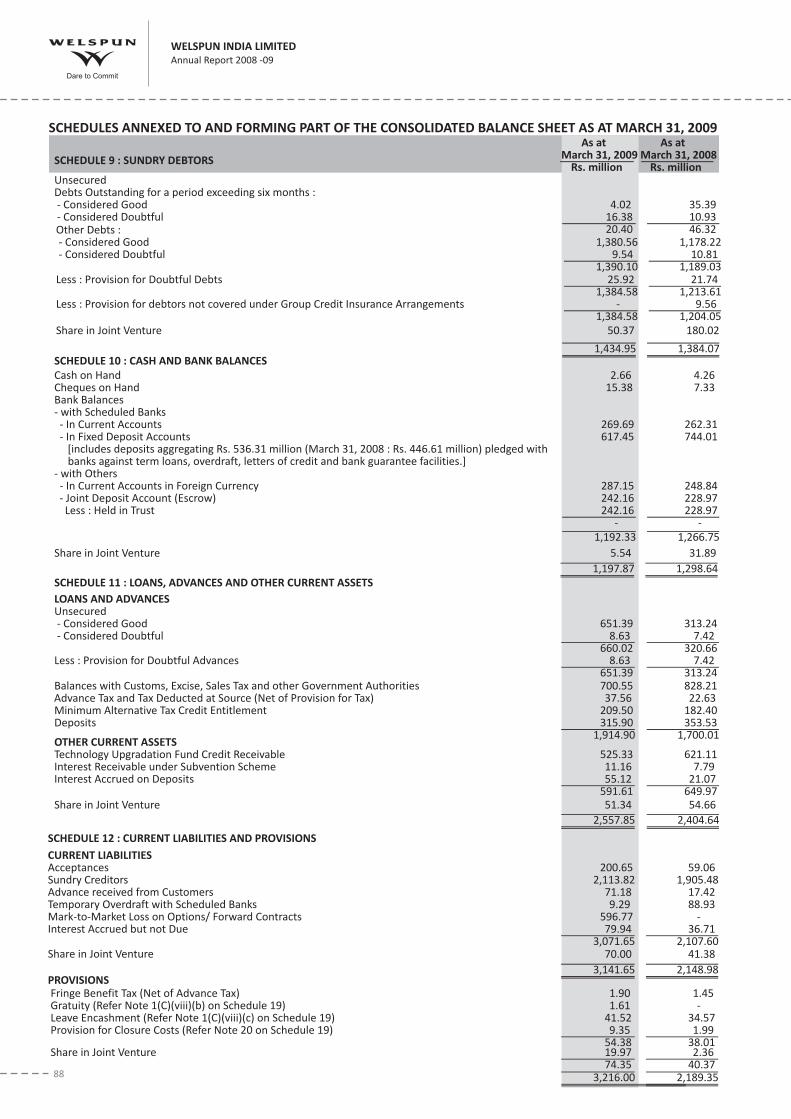
88
WELSPUN INDIA LIMITEDAnnual Report 2008 -09
SCHEDULES ANNEXED TO AND FORMING PART OF THE CONSOLIDATED BALANCE SHEET AS AT MARCH 31, 2009As at
March 31, 2008Rs. million
As atMarch 31, 2009
Rs. millionSCHEDULE 9 : SUNDRY DEBTORS
UnsecuredDebts Outstanding for a period exceeding six months :- Considered Good- Considered DoubtfulOther Debts :- Considered Good- Considered Doubtful
Less : Provision for Doubtful Debts
Less : Provision for debtors not covered under Group Credit Insurance Arrangements
Share in Joint Venture
SCHEDULE 10 : CASH AND BANK BALANCES
Cash on HandCheques on HandBank Balances- with Scheduled Banks- In Current Accounts- In Fixed Deposit Accounts
against term loans, overdraft, letters of credit and bank guarantee facilities.]banks- with Others- In Current Accounts in Foreign Currency
Share in Joint Venture
[includes deposits aggregating Rs. 536.31 million (March 31, 2008 : Rs. 446.61 million) pledged with
- Joint Deposit Account (Escrow)Less : Held in Trust
35.3910.9346.32
1,178.2210.81
1,189.0321.74
1,213.619.56
1,204.05
180.02
1,384.07
4.267.33
262.31744.01
248.84228.97228.97
-
1,266.75
31.89
1,298.64
4.0216.3820.40
1,380.569.54
1,390.1025.92
1,384.58-
1,384.58
50.37
1,434.95
2.6615.38
269.69617.45
287.15242.16242.16
-
1,192.33
5.54
1,197.87
SCHEDULE 11 : LOANS, ADVANCES AND OTHER CURRENT ASSETS
LOANS AND ADVANCESUnsecured- Considered Good- Considered Doubtful
Less : Provision for Doubtful Advances
Balances with Customs, Excise, Sales Tax and other Government Authorities
Minimum Alternative Tax Credit EntitlementDeposits
OTHER CURRENT ASSETSTechnology Upgradation Fund Credit ReceivableInterest Receivable under Subvention SchemeInterest Accrued on Deposits
Share in Joint Venture
Advance Tax and Tax Deducted at Source (Net of Provision for Tax)
313.247.42
320.667.42
313.24828.2122.63
182.40353.53
1,700.01
621.117.79
21.07649.97
54.66
2,404.64
651.398.63
660.028.63
651.39700.5537.56
209.50315.90
1,914.90
525.3311.1655.12
591.61
51.34
2,557.85
SCHEDULE 12 : CURRENT LIABILITIES AND PROVISIONS
CURRENT LIABILITIESAcceptancesSundry CreditorsAdvance received from CustomersTemporary Overdraft with Scheduled BanksMark-to-Market Loss on Options/ Forward ContractsInterest Accrued but not Due
Share in Joint Venture
PROVISIONSFringe Benefit Tax (Net of Advance Tax)Gratuity (Refer Note 1(C)(viii)(b) on Schedule 19)Leave Encashment (Refer Note 1(C)(viii)(c) on Schedule 19)Provision for Closure Costs (Refer Note 20 on Schedule 19)
Share in Joint Venture
59.061,905.48
17.4288.93
-36.71
2,107.6041.38
2,148.98
1.45-
34.571.99
38.012.36
40.372,189.35
200.652,113.82
71.189.29
596.7779.94
3,071.6570.00
3,141.65
1.901.61
41.529.35
54.3819.9774.35
3,216.00

SCHEDULES FORMING PART OF THE CONSOLIDATED PROFIT AND LOSS ACCOUNT FOR THE YEAR ENDED MARCH 31, 2009
SCHEDULE 13 : SALESSalesExport Benefits
Share in Joint Venture
SCHEDULE 14 : OTHER INCOME
Rent (Tax Deducted at Source Rs. 1.90 million, Previous Year : Rs. 2.67 million)
DividendInsurance ClaimProfit on Redemption/ Sale of Units in Mutual FundsProfit on Sale of SharesProfit on Sale of BondsProfit on Sale of Fixed AssetsLiabilities Written Back as no Longer RequiredProvision for Doubtful Advances Written BackProvision for Doubtful Debts Written BackProfit on Cancellation of Forward ContractsExchange Loss (Net)Job Charges ReceivedExcise and Sales Tax BenefitsRoyalty IncomeMiscellaneous
Share in Joint Venture
SCHEDULE 15 : MATERIALS AND MANUFACTURING EXPENSES
Materials Consumed (Refer Note 23 on Schedule 19)Opening Stock of Raw Material, Work-in-Process, Finished Goods and Traded GoodsAdd : Adjustment on acquisition of Subsidiaries
Add : Purchases of Raw Material and Traded Goods
Less : Closing Stock of Raw Material, Work-in-Process, Finished Goods and Traded Goods
Manufacturing ExpensesStores and Spares ConsumedDyes and Chemicals ConsumedContract Labour ChargesJob Work ExpensesPower and FuelPacking ChargesRepairs and Maintenance:- Plant and Machinery- Factory Building
Share in Joint Venture
15,267.96660.91
15,928.87
566.32
16,495.19
11.18
25.8317.051.24-
4.9779.250.534.890.96
114.92(2.17)22.2336.559.76
44.15371.34
6.27
377.61
2,939.46118.28
3,057.747,233.59
10,291.333,421.966,869.37
241.731,065.57
237.34127.29
1,043.71631.86
35.674.08
3,387.25526.52
10,783.14
15,261.951,045.13
16,307.08
693.27
17,000.35
7.85
16.560.433.60
221.352.00-
1.43--
21.13(169.52)
25.9592.307.84
20.87251.79
2.55
254.34
3,421.96-
3,421.967,325.87
10,747.833,838.386,909.45
249.491,077.59
212.38114.37
1,493.90635.11
25.538.32
3,816.69613.80
11,339.94
Year endedMarch 31, 2008
Rs. million
Year endedMarch 31, 2009
Rs. million
89

90
WELSPUN INDIA LIMITEDAnnual Report 2008 -09
SCHEDULE 16 : EMPLOYEES' REMUNERATION AND BENEFITS
Salaries, Wages, Allowances and Other Benefits (Refer Note 15 on Schedule 19)Contribution to Provident and Other FundsManagerial RemunerationStaff and Labour Welfare
Share in Joint Venture
SCHEDULE 17 : SELLING, ADMINISTRATION AND OTHER EXPENSES
Claims, Discounts and RebatesBrokerage and CommissionFreight, Forwarding and Coolie ChargesRepairs and Maintenance - OthersDirectors' Sitting FeesRentRates and TaxesPrinting and StationeryTravelling and ConveyanceLegal and Professional ChargesInsuranceCommunicationPostage and CourierLoss on Sale/ Discarding of Fixed Assets (Net)Provision for Doubtful DebtsProvision for Doubtful AdvancesDebts/ Advances Written offDesign Development and Testing ExpensesExcise Benefits Receivable Written OffRoyaltyAdvertising and Sales PromotionDonationsAuditors' Remuneration- As Auditors- In other capacity - As Tax Auditors- Certification and Other Matters- Out of Pocket ExpensesMiscellaneous
Share in Joint Venture
SCHEDULE 18 : FINANCE EXPENSES (NET)
Interest on Fixed Loans(net of interest subsidy of Rs. 534.47 million, Previous Year : Rs. 412.33 million)Interest on DebenturesInterest on Working Capital Loans(net of interest subvention of Rs. 26.93 million, Previous Year : Rs. 38.64 million)Interest to OthersDiscounting and Bank ChargesLease Rentals
Less :Interest on Fixed Deposits - Gross(Tax Deducted at Source Rs. 1.83 million, Previous Year : Rs. 4.59 million)Interest on Bonds - Gross(Tax Deducted at Source Rs. Nil, Previous Year : Rs. 0.44 million)Interest on Others - Gross(Tax Deducted at Source Rs. 0.01 million, Previous Year : Rs. 0.02 million)Cash Discount received
Share in Joint Venture
Year endedMarch 31, 2008
Rs. million
1,538.7574.8617.4352.22
1,683.26
15.32
1,698.58
401.05255.22568.6129.180.25
166.8720.2913.11
136.4883.1883.1126.5628.33
-20.285.28
15.6220.5943.23
116.02187.54
6.90
11.254.240.220.09
78.012,321.51
7.30
2,328.81
451.91
11.26282.91
3.8873.061.21
824.23
31.74
2.69
0.75
21.54767.51
14.43
781.94
Year endedMarch 31, 2009
Rs. million
1,791.60122.04
38.0762.24
2,013.95
20.31
2,034.26
235.20258.69374.17
58.440.25
287.0040.6111.71
169.71112.74
69.5045.6221.7215.1210.13
5.404.70
71.13-
119.53128.45
2.46
10.772.940.970.46
108.272,165.69
47.26
2,212.95
660.00
6.53415.32
40.2174.03
0.081,196.17
45.73
-
5.92
14.711,129.81
46.75
1,176.56
SCHEDULES FORMING PART OF THE CONSOLIDATED PROFIT AND LOSS ACCOUNT FOR THE YEAR ENDED MARCH 31, 2009

SCHEDULE 19 : NOTES TO ACCOUNTS
1) Significant Accounting Policies
A. Basis of Accounting
The consolidated financial statements are prepared under historical cost convention in accordance with generally accepted
accounting principles applicable in India and the Accounting Standards issued by the Institute of Chartered Accountants of
India.
B. Principles of Consolidation
(i) The consolidated financial statements relate to Welspun India Limited (the “Company”), its Subsidiary Companies,
Joint Venture Companies and Associate Company. The consolidated financial statements have been prepared on
the following basis:
(a) The financial statements of the Company and its Subsidiary Companies have been combined on a line-by-line
basis by adding together the book values of like items of assets, liabilities, income and expenses, after fully
eliminating intra-group balances, intra-group transactions and resulting unrealised profits or losses on intra-
group transactions.
(b) The difference between the cost of investment in the subsidiaries over the Company's portion of equity of the
subsidiary is recognised in the financial statements as Goodwill or Capital Reserve.
(c) Minority Interest in the net assets of consolidated subsidiaries consist of :
- the amount of equity attributable to minorities at the date on which investment in a subsidiary is made
and
- the minorities' share of movements in equity since the date the parent subsidiary relationship comes into
existence.
(d) In the consolidated financial statements, the Company has reported its interest in the Joint Venture
Companies, using proportionate consolidation method whereby the Company's share of each of the assets,
liabilities, income and expenses of the jointly controlled entities is reported as separate line items, after
eliminating proportionate unrealised profits or losses attributable to the interest of the Company.
(e) Investments in Associates have been accounted for under AS-23 using equity method whereby the
investment is initially recorded at cost, identifying any goodwill/ capital reserve arising at the time of
acquisition. The carrying amount of the investment is adjusted thereafter for the post acquisition change in
the investor's share of net assets of the investee.
On occasion, an associate company accounted for by the equity method may issue its shares to third parties as
either a public offering or private placement at per share amounts in excess of or less than Parent Company's
average per share carrying value. With respect to such transactions, the resulting gains/ losses arising from
the dilution of interest are recorded as Capital Reserve/ Goodwill.
The consolidated statement of profit and loss reflects the investor's share of the results of operations of the
investee.
(f) The consolidated financial statements have been prepared using uniform accounting policies for like
transactions and other events in similar circumstances and are prepared to the extent possible, in the same
manner as the Company's separate financial statements.
SCHEDULES ANNEXED TO AND FORMING PART OF THE CONSOLIDATED BALANCE SHEET AS AT MARCH 31, 2009 AND
CONSOLIDATED PROFIT AND LOSS ACCOUNT FOR THE YEAR ENDED MARCH 31, 2009
91

(ii) The Subsidiary Companies, Joint Venture Companies and Associate Company considered in the consolidated
financial statements are:
C. Significant Accounting Policies
(i) Fixed Assets
Fixed Assets are stated at cost (net of cenvat credit, wherever applicable) less depreciation. The cost includes cost
of acquisition, construction, erection, installation etc., preoperative expenses (including trial run) and borrowing
costs incurred during pre-operational period.
Cost of software includes license fees and implementation/ integration expenses.
(ii) Incidental Expenditure Pending Capitalisation/ Allocation
Incidental expenditure pending capitalisation/ allocation represents expenses incurred during setting-up of
manufacturing facility including preoperative expenses for trial runs and borrowing cost incurred prior to the date
of commencement of commercial production. These expenses are net of sales during trial run and other income
accrued prior to the commencement of commercial production.
(iii) Borrowing Costs
Borrowing costs directly attributable to the acquisition/ construction of fixed assets are apportioned to the cost of
the fixed assets up to the date on which the asset is put to use/ commissioned.
92
WELSPUN INDIA LIMITEDAnnual Report 2008 -09
Name of the Company Relationship Country of
Incorporation
% Voting power held
as at March 31, 2009
Welspun USA Inc. (WUSA) Subsidiary U.S.A. 100.00
Welspun Holdings Private Limited, Cyprus (WHPL) Subsidiary Cyprus 100.00
Welspun AG (WAG) (Held directly till March 15, 2009 and through
WHPL w.e.f. March 16, 2009)
Subsidiary Switzerland 100.00
Welspun Mexico S.A. de C.V (WMEX)
(Held through WAG)
Subsidiary Mexico 100.00
Welspun Home Textiles UK Limited (WHTUKL)
(Held through WHPL)
Subsidiary U.K. 100.00
CHT Holdings Limited (CHTHL)
(Held through WHTUKL)
Subsidiary U.K. 100.00
Christy Home Textiles Limited (CHTL)
(Held through CHTHL)
Subsidiary U.K. 100.00
Christy UK Limited (CUKL)
(Held through CHTL)
Subsidiary U.K. 100.00
Christy 2004 Limited
(Held through CUKL)
Subsidiary U.K. 100.00
Flyspark Limited
(Held through CHTL)
Subsidiary U.K. 100.00
Christy Europe GmbH
(Held through CHTL)
Subsidiary Germany 100.00
ER Kingsley (Textiles) Limited
(Held through CHTL)
Subsidiary U.K. 100.00
SOREMA – Tapetes E Cortinas De Banho, S.A. (SOREMA) (Held
through WHPL)
Subsidiary Portugal 76.00
SOREMA Welspun Distribution & Logistics, S. A., Portugal (Held
through SOREMA w.e.f. September 3, 2008)
Subsidiary Portugal 76.00
SOREMA Welspun Espana S. L. U., Spain (Held through SOREMA
w.e.f. July 24, 2008)
Subsidiary Spain 76.00
SOREMA Welspun Benelux B. V., Holland (Held through SOREMA
w.e.f. February 6, 2009)
Subsidiary Holland 76.00
Besa Developers and Infrastructure Private Limited (BESA) Subsidiary India 100.00
Welspun Global Brands Limited (WGBL) (w.e.f. September 17,
2008)
Subsidiary India 100.00
Welspun Investments Limited (WINL) (w.e.f. October 7, 2008 ) Subsidiary India 100.00
Welspun Zucchi Textiles Limited (WZTL) Joint Venture India 50.00
MEP Cotton Limited (MCL) Joint Venture India 26.94
Welspun Retail Limited Associate India 41.65
SCHEDULES ANNEXED TO AND FORMING PART OF THE CONSOLIDATED BALANCE SHEET AS AT MARCH 31, 2009 AND
CONSOLIDATED PROFIT AND LOSS ACCOUNT FOR THE YEAR ENDED MARCH 31, 2009

(iv) Depreciation and Amortisation
(a) Depreciation on Fixed Assets is provided on the straight-line method so as to write off the cost of fixed assets
over estimated useful lives of the assets. Depreciation on additions/ deletions to fixed assets is calculated
pro-rata from/ up to the date of such additions/ deletions except in case of a subsidiary company, where the
depreciation is calculated at 50% of the rate arrived based on the useful lives of such assets in the year of
additions/ deletions.
(b) Computer software is amortised on the straight-line method over a period of three to five years.
(c) Leasehold Land is amortised over the period of lease in case of a jointly controlled entities.
(d) Amortisation of leasehold improvements is computed on the straight line method over the term of the
related lease including extensions which are reasonably expected to occur, which is not in excess of the
estimated useful lives of such improvements.
(e) Goodwill arising on consolidation of a certain subsidiary sub-group is amortised on a straight line basis over its
estimated useful economic life of 20 years. Further, goodwill on consolidation is tested for impairment on an
annual basis.
(f) Development Expenditure is amortised on a straight line basis over a period of 3 years.
(v) Investments
(a) Long term investments are stated at cost less provision, if any, for permanent diminution in value. Current
investments are carried at the lower of cost and fair value.
(b) Investment in Associate is accounted for using the equity method (Refer note 1(B)(i)(e) above).
(vi) Inventories
(a) Inventories are valued at lower of cost and net realisable value.
(b) Cost of raw materials and stores and spares is determined on weighted average basis except in case of jointly
controlled entities, where the same is determined on first-in-first-out basis. Cost of traded goods is
determined on weighted average basis. Cost of work-in-process and finished goods comprises of raw
material, direct labour, other direct costs and related overheads but exclude interest expense. Net realisable
value is the estimate of the selling price in the ordinary course of the business, less the estimated costs of
completion and estimated selling expenses.
(vii) Accounting for Taxes on Income/ Minimum Alternate Tax Credit
Income tax expense comprises current tax and deferred tax charge or credit.
(a) Current Taxation
Current tax is determined as the amount of tax payable in respect of taxable income for the year.
(b) Deferred Taxation
Deferred tax resulting from timing differences between book and tax profits is accounted for under the
liability method, at the current/ substantially enacted rate of tax to the extent that the timing differences
are expected to crystallise.
Deferred tax assets arising in situations where there are brought forward losses and unabsorbed
depreciation, are recognised only when there is a virtual certainty supported by convincing evidence that
such assets will be realised.
(c) Minimum Alternate Tax Credit
Minimum Alternate Tax (MAT) paid in accordance with tax laws, which give rise to future economic benefits in
the form of adjustment of future tax liability, is recognized as an asset only when, based on convincing
evidence, it is probable that the future economic benefits associated with it will flow to the Company and the
assets can be measured reliably.
�
�
SCHEDULES ANNEXED TO AND FORMING PART OF THE CONSOLIDATED BALANCE SHEET AS AT MARCH 31, 2009 AND
CONSOLIDATED PROFIT AND LOSS ACCOUNT FOR THE YEAR ENDED MARCH 31, 2009
93

(viii)Employee Benefits
(a) Defined Contribution Plans
Contributions made on a defined contribution basis towards post employment benefits to Employee's
Provident Fund, Employee's State Insurance Fund, Employee's Pension Scheme and various other social
security funds generally administered by the respective Government authorities in respect of which there is
no further obligation beyond making the contribution are expensed in the year to which it pertains.
(b) Defined Benefit Plans
The liability for the defined benefit plan of Gratuity of the Company, jointly controlled entities and associate is
determined on the basis of an actuarial valuation by an independent actuary at the year end, which is
calculated using projected unit credit method as per Accounting Standard 15 (revised 2005) Employee
Benefits ('AS 15').
(c) Employee Leave Entitlement
The employees of the Company, jointly controlled entities and associate are entitled to leave as per the
applicable leave policies of their employers. The liability in respect of unutilised leave balances is provided
based on an actuarial valuation carried out by an independent actuary as at the year end and charged to the
Profit and Loss Account as per Accounting Standard 15 (revised 2005) Employee Benefits ('AS 15').
(ix) Foreign Currency Transactions, Derivative Instruments and Hedge Accounting
(a) In respect of the Company, it's subsidiaries incorporated in India, it's integral foreign operations, jointly
controlled entities and associate, foreign currency transactions are recorded at the exchange rates prevailing
on the date of such transactions. Monetary assets and liabilities as at the Balance Sheet date are translated at
the rates of exchange prevailing at the date of the Balance Sheet. Gains and losses arising on account of
differences in foreign exchange rates on settlement/ translation of monetary assets and liabilities are
recognised in the Profit and Loss Account. Non-monetary foreign currency items are carried at cost.
(b) In respect of forward contracts, other than forward contracts in respect of firm commitments and highly
probable forecast transactions, the premium or discount arising at the inception of forward exchange
contract, is amortised as expense or income over the life of the contract. Exchange differences on such
contracts are recognised in the Profit and Loss Account in the reporting period in which the exchange rates
change. Any profit or loss arising on cancellation or renewal of such a forward exchange contract is
recognised as income or as expense for the period.
(c) In respect of forward contracts and currency options taken to hedge the risks associated with foreign currency
fluctuations relating to firm commitments and highly probable forecast transactions, with effect from April 1,
2008, the Company has early adopted the principles of AS 30 'Financial Instruments: Recognition and
Measurement”. Accordingly, foreign currency fluctuations relating to firm commitments and highly probable
forecast transactions are fair valued at each reporting date.
Changes in the fair value of these hedging instruments that are designated and considered as effective hedges
of highly probable forecasted transactions are recognised directly in shareholders' funds under 'Hedging
Reserve Account' to be recognised in the Profit and Loss Account when the underlying transaction occurs.
Changes in the fair value of the hedging instruments that do not qualify for hedge accounting are recognised
in the Profit and Loss Account as they arise.
(d) In respect of non-integral operations, assets and liabilities are translated using the exchange rates in effect at
the balance sheet date, for revenue, costs and expenses using the average exchange rates prevailing during
the reporting periods and for share capital, using the exchange rate at the date of transaction. The resultant
translation exchange gain/ loss has been disclosed as Foreign Currency Translation Reserve under Reserves
and Surplus.
(x) Revenue Recognition
i. Sales revenue is recognised on transfer of significant risks and rewards of ownership of the goods to the buyer.
94
WELSPUN INDIA LIMITEDAnnual Report 2008 -09
SCHEDULES ANNEXED TO AND FORMING PART OF THE CONSOLIDATED BALANCE SHEET AS AT MARCH 31, 2009 AND
CONSOLIDATED PROFIT AND LOSS ACCOUNT FOR THE YEAR ENDED MARCH 31, 2009

Domestic sales are recognised on dispatch to customers. Export sales are recognised on the date of cargo receipts,
bill of lading or other relevant documents, in accordance with the terms and conditions for sales. Realised
exchange differences on export debtors are included in sales.
ii. Export benefits arising from Duty Entitlement Pass Book (DEPB) and Duty Drawback scheme are recognised on
shipment.
iii. Dividends are accounted for when the right to receive dividend is established.
(xi) Government Grants
Government grants are accounted for when it is reasonably certain that ultimate collection will be made. Capital
grants relating to specific assets are reduced from the gross value of the Fixed Assets. Revenue grants, in the
nature of interest subsidy under the Technology Upgradation Fund Scheme (TUFS) are adjusted against 'Interest
on Fixed Loans'. Revenue grants in the nature of interest subvention on 'Rupee Export Credit Loans' are adjusted
against 'Interest on Working Capital Loans'.
(xii) Impairment of Assets
At each balance sheet date an assessment is made as to whether there is any indication that an asset may be
impaired. If any such indication exists, the recoverable amount of the asset is estimated. If such recoverable
amount of the asset or recoverable amount of the cash generating unit to which the asset belongs is less than its
carrying amount, the carrying amount is reduced to its recoverable amount. The reduction is treated as an
impairment loss and is recognised in the Profit and Loss Account. If at the Balance Sheet date there is an indication
that if a previously assessed impairment loss no longer exists, the recoverable amount is reassessed and the asset
is reflected at the recoverable amount.
(xiii)Provisions and Contingent Liabilities
A provision is recognised when there is a present obligation as a result of a past event that probably requires an
outflow of resources and a reliable estimate can be made of the amount of the obligation. A disclosure for a
contingent liability is made when there is a possible obligation or a present obligation that may, but probably will
not, require an outflow of resources. Where there is a possible obligation or a present obligation but the
likelihood of outflow of resources is remote, no provision or disclosure as specified in Accounting Standard 29 “
Provisions, Contingent Liabilities and Contingent Assets”, issued by the Institute of Chartered Accountants of India
is made.
(xiv)Employees Stock Option Schemes
Stock options granted to employees under Employee Stock Option Schemes are accounted as per the accounting
treatment prescribed in the Guidance Note on Accounting for Employee Share-based Payments issued by the
Institute of Chartered Accountants of India.
(xv) Accounting Estimates
The preparation of financial statements requires estimates and assumptions to be made that affect the reported
amounts of assets and liabilities on the date of financial statements and the reported amounts of revenue and
expenses during the reporting period. Difference between the actual results and the estimates are recognised in
the period in which the results are known/ materialised.
SCHEDULES ANNEXED TO AND FORMING PART OF THE CONSOLIDATED BALANCE SHEET AS AT MARCH 31, 2009 AND
CONSOLIDATED PROFIT AND LOSS ACCOUNT FOR THE YEAR ENDED MARCH 31, 2009
95

2) Contingent Liabilities not provided for:
96
WELSPUN INDIA LIMITEDAnnual Report 2008 -09
Description
As at
March 31, 2009
Rs. million
As at
March 31, 2008
Rs. million
Excise, Customs and Service Tax
Alleged excess clearance of cotton yarn in Domestic Tariff Area over and above the
limit specified in para 9.9 (b) of the Exim Policy 1997-2002. The Company has
deposited Rs. 0.70 million under protest and filed an appeal with the Customs,
Excise and Service Tax Appellate Tribunal (CESTAT), Ahmedabad against the order
passed by Commissioner (Appeals) of Central Excise and Customs.
19.45 18.50
Alleged manufacture and clearance of texturised yarn without payment of excise
duty and without entering into statutory records. Further, there was an alleged
shortage of Polyester Texturised yarn in physical stock as compared to the stock as
per statutory records. The case has been settled in the Company’s favour during
the current year.
- 12.76
Alleged improper re-credit of duty paid through PLA under Notification no. 39/2001
–CE dated July 31, 2001 in respect of goods sold from the factory during the period
from February 2006 to September 2007. The Assistant Commissioner of Central
Excise has passed the order against the Company. The Company has preferred an
appeal with the Commissioner of Central Excise (Appeals) – Rajkot.
318.58 -
Alleged improper grant of refund for duty paid through PLA by Assistant
Commissioner under Rule 18 of Central Excise Rules during the period from
September 2005 to July 2006. The Commissioner (Appeals) of Customs and Central
Excise has passed the order against the Company. The Company has filed Revision
Application with the Joint Secretary, Ministry of Finance, Department of Revenue.
69.28 -
Alleged improper cenvat credit availed and non payment of excise duty under
Notification No.214/86 – CE dated 25-03-1986, on furnace oil used for
manufacturing of goods on job work during the period April 2002 to March 2008.
The Company has filed its reply against the show cause notices issued by Joint
Commissioner and Commissioner of Customs and Central Excise, Daman. During
the year, based on the review and com ments made by the Committee of Chief
Commissioners, the Commissioner has made an application to CESTAT to withdraw
his order passed in April 2008 in respect of non payment of excise duty.
3.33 72.60
Alleged non-payment of cess on cotton consumed during the period April 2002 to
February 2007 under 'The Produce Cess Act, 1966'. The Company has filed appeals
with Commissioner of Custom and Central Excise, Daman against the orders passed
by the Assistant Commissioner of Custom and Central Excise, Vapi. The case has
been settled in the Company’s favour during the current year.
- 1.56
Alleged improper abatement of service tax on payments made to Goods Transport
Agency under Notification No. 32/04-ST dated 3-12-2004. The Company has filed its
reply against the show cause notice issued by the Commissioner of Central Excise
and Customs, Daman.
45.51 29.27
Alleged service tax credit based on improper documents. The Company has
received an order from Commissioner, Central Excise & Customs, Daman
demanding the amount of duty, interest and penalty. The Company filed an appeal
against the order with Commissioner of Central Excise & Customs (Appeals),
Daman.
0.15 0.15
Alleged procurement of furnace oil without payment of duty by wrongly availing
the exemptions contained in the Notification No. 1/95-CE 04-01-1995. The excise
department had preferred an appeal with the Supreme Court against CESTAT,
Ahmedabad order passed in favour of the Company. The Supreme Court has
upheld the matter in the Company’s favour in January 2009.
- 14.81
Alleged procurement of furnace oil without payment of duty by wrongly availing
the exemptions contained in the Notification No. 53/97-CUS 03-06-1997. The
excise department had preferred a civil appeal with the Supreme Court against
CESTAT, Ahmedabad’s order passed in favour of the Company. The Supreme Court
has upheld the matter in the Company’s favour in January 2009.
- 11.47
SCHEDULES ANNEXED TO AND FORMING PART OF THE CONSOLIDATED BALANCE SHEET AS AT MARCH 31, 2009 AND
CONSOLIDATED PROFIT AND LOSS ACCOUNT FOR THE YEAR ENDED MARCH 31, 2009

Description
As at
March 31, 2009
Rs. million
As at
March 31, 2008
Rs. million
Alleged improper cenvat credit availed on “racks” classified as capital goods, which
are used for storage of finished goods.
The Company received an order from Additional Commissioner, Central Excise &
Customs, Daman dated 11.02.2009 demanding the amount of duty, interest and
penalty. The Company has paid Rs. 0.07 million under protest and filed an appeal
against the order with Commissioner of Central Excise & Customs (Appeals), Daman
on 27.03.2009.
1.82 -
Alleged improper availment of cenvat credit on service tax paid on insurance
peimia paid for availing insurance services that are not used in or in relation to
manufacture of final products.
The Company has received a show-cause notice from Assistant Commissioner of
Central Excise and Customs, Vapi against which it has filed a reply.
0.03 -
Stamp Duty :
Disputed stamp duty liability on De-merger Scheme. The Company has paid Rs.
1.74 million under protest.
4.46 4.46
Company’s share of stamp duty demand raised by Gujarat Government from WZTL
(a jointly controlled entity) for which WZTL has filed an Appeal with the High Court
of Gujarat.
0.18 -
Sales Tax :
The Deputy Commissioner of Sales Tax has issued an assessment order for the
financial year 2003-04 and raised the demand on purchase of Furnace oil during
the year 2003-04 in respect of purchases made by the Company at a concessional
rate of tax. The Company has deposited Rs. 0.09 million under protest and has filed
an appeal with the Joint Commissioner of Sales Tax, Vadodra.
1.07 0.97
The Deputy Commissioner of Sales Tax has issued an assessment order for the
financial year 2004-05 and raised the demand on purchase of Furnace oil during
the year 2004-05 in respect of purchases made by the Company at a concessional
rate of tax. The Company has filed an appeal with the Joint Commissioner of Sales
Tax, Vadodra.
6.75 -
FEMA :
The Appellate Tribunal for Foreign Exchange, New Delhi has issued an order for
contravention of the provision of Section 18(2) of the Foreign Exchange Regulation
Act, 1973 read with Section 49(3) and (4) of Foreign Exchange Management Act,
1999 in respect of non-realisation of export proceeds. The Company has filed an
appeal with the Delhi High Court.
0.90 0.90
Description
As at
March 31, 2009
Rs. million
As at
March 31, 2008
Rs. million
INCOME TAX
Company’s share of income tax demand raised by Income tax Authorities on
WZTL (a jointly controlled entity) for which an appeal has been filed by WZTL
before the first appellate authority.
7.23 -
Others:
Accumulated dividend on cumulative redeemable preference shares . 17.41 17.41
Claims against the Company not acknowledged as debts. 2.72 2.17
Bills discounted in respect of export debtors [including the Company’s share of
Rs. Nil (March 31, 2008 : 74.01 million) in jointly controlled entities].
1,021.30 1,856.12
SCHEDULES ANNEXED TO AND FORMING PART OF THE CONSOLIDATED BALANCE SHEET AS AT MARCH 31, 2009 AND
CONSOLIDATED PROFIT AND LOSS ACCOUNT FOR THE YEAR ENDED MARCH 31, 2009
97

4) -
5) -
6)
7)
8) -
9)
On December 20, 2007, the Company acquired 76% of the equity shareholding in SOREMA Tapetes E Cortinas DE Banho,
S.A., Portugal (“SOREMA”) through Welspun Holdings Private Limited (WHPL), its wholly owned subsidiary, for
consideration of Euro 6,329,431.21 as specified in the Share Purchase Agreement. Further, the Company, through WHPL,
has entered into a Put and Call Option Agreement to buy remaining 24% equity shareholding in SOREMA, 8% each; on or
after January 1, 2011, January 1, 2012 and January 1, 2013 respectively, at a consideration to be determined based on the
respective average EBITDA of SOREMA for last two financial years prior to these dates.
On July 3, 2006, the Company had acquired 85% of the equity shareholding in CHT Holdings Limited holding company of
Christy Group (“Christy”) through conduits of wholly owned subsidiaries (“WOS”) and through these WOS had also entered
into a put and call option agreement to buy the remaining 15% equity shareholding in Christy. On April 2, 2008, the
Company, through the conduits, acquired the remaining 15% of the equity shareholding in CHT Holdings Limited at a
consideration of GBP 2.356 million.
During the year, certain loans aggregating Rs. 726.95 million (equivalent to CHF 16.88 million) given to Welspun AG (WAG), a
wholly owned subsidiary, were converted into investments in the equity share capital of WAG. Subsequently, on March 16,
2009, the Company transferred the entire investment in equity shares of WAG aggregating CHF 17 million to Welspun
Holdings Private Limited, a wholly owned subsidiary of the Company.
An Associate of the Parent Company, Welspun Retail Limited (“WRL”) made a private placement of its equity on November
3, 2008. Subsequent to the private placement, the Parent Company's shareholding in WRL has diluted from 49% to 41.65%.
The private placement was made at a price which was in excess of the Company's average per share carrying value as on the
date of private placement. The resultant gain of Rs. 380.39 million has been recorded as Capital Reserve.
During the year, SOREMA Tapetes E Cortinas De Banho, S.A. (SOREMA), a Subsidiary of the Parent Company, formed the
following fully owned subsidiaries as follows ;-
(a) SOREMA Welspun Distribution & Logistics
(b) SOREMA Welspun Espana
(c) SOREMA Welspun Benelux
to expand its activity in Spain, Holland, Belgium, Luxembourg and other European Union countries.
The Consolidated Financial Statements include net liability aggregating Rs. 0.62 million and net loss aggregating Rs. 6.39
million pertaining to the above fully owned subsidiaries of SOREMA.
(a) (i) Pursuant to 'the Composite Scheme of Arrangement in the nature of demerger and transfer of Marketing Division
of Welspun India Limited to Welspun Global Brands Limited and Investment & Treasury Division to Welspun
Investments Limited and Restructure of Capital of these companies' (the “Scheme”) as approved by the Board of
Directors of the Company on September 15, 2008 and the shareholders in the Court convened meeting held on
98
WELSPUN INDIA LIMITEDAnnual Report 2008 -09
Description
As at
March 31,2009
Rs. million
As at
March 31, 2008
Rs. million
(a) Guarantees given by banks on behalf of the Company and its subsidiaries
[including the Company’s share of Rs. 0.24 million (March 31, 2008 : Rs. 0.24
million) in Jointly Controlled entities and Rs. 9.28 million (March 31, 2008 :
Rs. 0.33 million) in associates]
296.43 285.81
(b) In accordance with the EPCG Scheme, imports of capital goods are allowed to
be made duty free and under Advance License Scheme, imports of raw
material are allowed to be made duty free, subject to the condition that the
Company will fulfill, in future, a specified amount of export obligation within
a specified time. Based on the current operating plan, the Company would
fulfill its export obligation within the specified time period. Amount of duty
saved on imports of above goods against which export obligation is yet to be
fulfilled [including companies share of Rs. 15.54 million (March 31, 2008: Rs.
28.84 million) in jointly controlled entities].
70.95 302.97
(c) Estimated amount of contracts (net of advances) remaining to be executed
on capital account and not provided for [including the Company’s share of
Rs. 0.67 million (March 31, 2008 : Rs. 33.78 million) in jointly controlled
entities].
36.89 876.61
3)
SCHEDULES ANNEXED TO AND FORMING PART OF THE CONSOLIDATED BALANCE SHEET AS AT MARCH 31, 2009 AND
CONSOLIDATED PROFIT AND LOSS ACCOUNT FOR THE YEAR ENDED MARCH 31, 2009

9)
January 13, 2009 and filed with the Registrar of Companies on June 12, 2009, the Marketing Division of the Company
and the Investment & Treasury Division of the Company were transferred to Welspun Global Brands Limited (WGBL)
and Welspun Investments Limited (WINL), respectively, with effect from April 1, 2009 (the “Appointed date”).
(ii) As per the Scheme, assets and liabilities of the Marketing Division of the Company will be transferred to WGBL
with effect from the Appointed date. Upon the transfer, WGBL will issue 1 equity share of Rs. 10 each credited as fully
paid up to the shareholders of Welspun India Limited for every 10 equity shares held by them in Welspun India Limited.
On September 17, 2008, the Company acquired 500,000 equity shares of Rs. 10 each representing the entire share
capital of WGBL at a premium of Rs. 10 per share. WGBL was acquired for the purpose of transfer of “Marketing
Division” of the Company to a wholly owned subsidiary pursuant to the Scheme.
(Iii) Further, as per the Scheme, the assets and liabilities of the Investment & Treasury Division of the Company will be
transferred to WINL with effect from the Appointed date. Upon the transfer, WINL will issue 1 equity share of Rs. 10
each credited as fully paid up to the shareholders of Welspun India Limited for every 20 equity shares held by them in
Welspun India Limited. On October 7, 2008, the Company formed WINL by investing Rs. 500,000 in the equity share
capital of WINL. WINL was formed for the purpose of transfer of “Investment & Treasury Division” of the Company to a
wholly owned subsidiary pursuant to the Scheme.
(b) Information relating to a discontinuing operation:
(i) Date of the initial disclosure event : September 15, 2008
(ii) Period in which the discontinuance is expected to be completed : Financial year 2009-2010
(iii) Carrying amounts, as at March 31, 2009 and as at March 31, 2008, of the total assets to be disposed of and the total
liabilities to be settled:
(iv) Amount of revenue, expenses, pre - tax profit and tax in respect of the ordinary activities attributable to the
discontinuing operations:
Marketing Division Investment & Treasury
Division
TotalParticulars
As at March 31,
2009
As at March
31, 2008
As at
March 31,
2009
As at
March 31,
2008
As at
March 31,
2009
As at March
31, 2008
Total Assets to be disposed of 2,620.84 3,037.01 233.34 56.55 2,854.18 3,093.56
Total Liabilities to be settled 3,783.99 2,636.18 - - 3,783.99 2,636.18
(Rs. Million)
Marketing Division Investment & Treasury
Division
TotalParticulars
Revenue 6,895.84 5,360.84 232.05 7.13 7,127.89 5,367.97
Operating Expenses 7,672.79 5,173.81 - - 7,672.79 5,173.81
Pre-Tax Profits / (Loss) before
share of Loss of Associate and
Minority Interest
(776.95) 187.03 232.05 7.13 (544.90) 194.16
Fringe Benefit Tax 2.75 2.77 - - 2.75 2.77
(Rs. Million)
SCHEDULES ANNEXED TO AND FORMING PART OF THE CONSOLIDATED BALANCE SHEET AS AT MARCH 31, 2009 AND
CONSOLIDATED PROFIT AND LOSS ACCOUNT FOR THE YEAR ENDED MARCH 31, 2009
For theyear endedMarch 31,
2009
For theyear endedMarch 31,
2008
For theyear endedMarch 31,
2009
For theyear endedMarch 31,
2008
For theyear endedMarch 31,
2009
For theyear endedMarch 31,
2008
99

(v) Amounts of Net cash flows attributable to discontinuing Operations.
On May 17, 2006, the Company has issued Employee Stock Options under the Employee Stock Options Scheme (the
“Scheme”) to employees of the Company and its subsidiaries with a right to subscribe to equity shares at a price of Rs.
110.80 per equity share (closing market price as on May 16, 2006). The salient features of the Scheme are as under:
(i) Vesting: Options to vest over a period of four years from the date of their grants as under :
- 20% of the Options granted to vest at each of the 1st and 2nd Anniversaries of the date of grant.
- 30% of the Options granted to vest at each of the 3rd and 4th Anniversaries of the date of grant.
(ii) Exercise: Options vested with an employee will be exercisable within 3 years from the date of their vesting by
subscribing to the number of equity shares in the ratio of one equity share for every option, at the latest available
closing market price of the equity shares, prior to the date of grant. In the event of cessation of employment due to
death, resignation or otherwise the Options may lapse or be exercisable in the manner specifically provided for in the
Scheme.
Information in respect of options outstanding as at March 31, 2009
The compensation costs of stock options granted to employees are accounted by the Company using the intrinsic value
method. Since, on the date of grant of option, quoted market price of the underlying equity shares of the Company was
equal to the exercise price of an option, hence, no expense or liability arising from the Scheme has been recognised.
The fair value of the options as per the 'Black Scholes' model is Rs. 63.39. Had the Company adopted fair value method in
respect of options granted, the employee compensation cost would have been higher by Rs. 14.36 million, Profit after Tax
lower by Rs. 14.36 million and the basic and diluted earning per share would have been lower by Re. 0.20.
(a) Term loans from banks and financial institutions including interest thereon are secured by way of first charge on entire
movable and immovable properties of the Company, both present and future, ranking pari passu, subject to prior
charge on specific assets as per 11(b) below and on current assets as per 11(c) and (d) below against borrowing from
banks for working capital finance. Certain term loans of a subsidiary are also collaterally secured by shares owned by
group companies. Further, certain term loans of a subsidiary are secured by way of charge on it's plant and equipments.
10)
11)
Marketing Division Investment and Treasury DivisionParticulars
For the year ended
March 31, 2009
For the year ended
March 31, 2008
For the year ended
March 31, 2009
For the year ended
March 31, 2008
Cash flows from Operating
activities
64.90 (22.09) - -
Cash flows from Investing
activities
(537.18) (976.03) 256.67 7.13
Cash flows from Financing
activities
(8.64) 971.13 - -
100
WELSPUN INDIA LIMITEDAnnual Report 2008 -09
(Rs. Million)
Summary of Stock Options No. of Stock Options Weighted Average Exercise Price (Rs.)
Options outstanding on April 1, 2008 1,494,000 110.80
Options granted during the year -
Options forfeited/lapsed during the year 204,000 110.80
Options exercised during the year -
Options outstanding on March 31, 2009 1,290,000 110.80
Options vested but not exercised on March 31, 2009 516,000 110.80
No. of Stock Options Weighted Average remaining life in
years
Weighted Average Exercise Price (Rs.)
258,000 1.13 110.80
258,000 2.13 110.80
387,000 3.13 110.80
387,000 4.13 110.80
SCHEDULES ANNEXED TO AND FORMING PART OF THE CONSOLIDATED BALANCE SHEET AS AT MARCH 31, 2009 AND
CONSOLIDATED PROFIT AND LOSS ACCOUNT FOR THE YEAR ENDED MARCH 31, 2009

(b) In addition to 11(a) above, term loans from Banks aggregating Rs. Nil (March 31, 2008 : Rs. 47.20 million) and Rs.
4,215.75 million (March 31, 2008 : Rs. 4,509.10 million) and interest thereon, are secured by exclusive charge pari
passu, inter se, on specific fixed assets of the Company and by lien on fixed deposits of the Company, respectively.
(c) The working capital loan towards overdraft facility aggregating Rs. 266.50 million (March 31, 2008 : Rs. Nil) is secured
by subservient charge on Company's entire current asset and Technology Upgradation Fund subsidy receivable from
Government of India for textile industries towards term loan borrowing by the company and against collateral of post
dated cheques.
(d) The working capital loans (other than referred in 11(c) above), (which includes cash credit, packing credit, and demand
loans from banks) are secured by hypothecation of raw materials, finished and semi finished goods, stores and spares
and book debts of the Company and second charge on entire fixed assets of the Company. The working capital loans of
the subsidiaries are secured by hypothecation of inventory, book debts and fixed assets of the respective subsidiaries.
500,000 0% Redeemable Preference Shares of Rs. 100 each fully paid up are redeemable at par in the year 2009-2010
or after repayment of all outstanding term liabilities and preference shares held by banks and financial institutions as
on April 1, 2000 and interest and dividend thereon; whichever is later.
In accordance with the Company's policy given in Note 1(C)(ix) above, net exchange loss of Rs. 1,092.20 million (Previous
Year: net exchange gain of Rs. 383.42 million) which includes the Company's share of net exchange loss of Rs. 3.97 (Previous
Year: net exchange gain of Rs. 5.82 million) in jointly controlled entities, has been accounted in Profit and Loss Account.
Borrowing Costs aggregating Rs. 101.79 million; Previous Year: Rs. 152.35 million (net of interest subsidy of Rs. 90.66
million; Previous Year: Rs. 156.16 million) attributable to the acquisition or construction of qualifying assets are capitalised
during the year as part of the cost of such assets which includes the Company's share of Rs. 1.80 million (Previous Year: Rs.
5.82 million) in jointly controlled entities.
12)
13)
14)
15) The Company has classified the various benefits provided to employees as under :-
I Defined Contribution Plans
a. Employers' Contribution to Provident Fund
b. Employers' Contribution to Employee’s State Insurance
c. Employers' Contribution to Employee’s Pension Scheme, 1995
d. Employers' Contribution to 401(k) Retirement Plan
e. Other Social Security Funds
During the year, the Company has recognised the following amounts in the Profit and Loss Account:
- Employers' Contribution to Provident Fund*
- Employers' Contribution to Employee’s State Insurance*
- Employers' Contribution to Employee’s Pension Scheme*
- Other Social Security Funds
The Company's share of expenses recognised in the Profit and Loss Account in jointly controlled entities.
* Included in Contribution to Provident and Other Funds (Refer Schedule 16)
II Defined Benefit Plan
Contribution to Gratuity Fund
a. Major Assumptions
Discount Rate - Staff
Discount Rate - Worker
Expected Rate of Return on Plan Assets
Salary Escalation Rate@ The estimates for future salary increases considered takes into account the inflation, seniority,
promotion and other relevant factors.
Rs. million
2008-09 2007-08
32.03 25.56
6.69 7.32
36.03 29.45
47.29 12.54
1.28 0.95
(% p.a.)
2008-09 2007-08
7.50 8.50
7.25 8.50
8.00 8.00
5.00 6.00@
SCHEDULES ANNEXED TO AND FORMING PART OF THE CONSOLIDATED BALANCE SHEET AS AT MARCH 31, 2009 AND
CONSOLIDATED PROFIT AND LOSS ACCOUNT FOR THE YEAR ENDED MARCH 31, 2009
101

16) Segment Information for the year ended March 31, 2009
(i) Information about Primary Business Segment
The companies forming part of consolidated financial statements are exclusively engaged in the business of Home
Textiles. This, in the context of Accounting Standard 17 on Segment Reporting, issued by the Institute of Chartered
Accountants of India, is considered to constitute a single primary segment. Thus, the segment revenue, segment
results, total carrying amount of segment assets, total carrying amount of segment liabilities, total cost incurred to
acquire segment assets, total amount of charge for depreciation during the year are all as reflected in the financial
statements for the year ended March 31, 2009 and as on that date.
b. Change in the Present Value of Obligation
Opening Present Value of Obligation
Current Service Cost
Interest Cost
Past Service Cost
Benefit paid
Actuarial Losses on Obligations
Closing Present Value of Obligation
c. Change in Fair Value of Plan Assets
Opening Fair Value of Plan Assets
Expected Return on Plan Assets
Actuarial (loss)/ gain on Plan Assets
Contributions
Benefits paid
Closing Fair Value of Plan Assets
Rs. million
2008-09 2007-08
47.23 36.83
11.72 11.19
4.02 3.13
(12.01) (6.10)
1.20 2.18
52.16 47.23
Rs. million
2008-09 2007-08
53.24 34.02
4.26 2.72
(7.53) 5.10
9.48 17.50
(8.90) (6.10)
50.55 53.24
d. Reconciliation of Present Value of Defined Benefit Obligation and the Fair Value of Assets
Present Value of Funded Obligation
Fair Value of Plan Assets
Funded Status
Present Value of Unfunded ObligationAssets recognised in the balance Sheet and included under Loans, Advances and OtherCurrent AssetsUnfunded Net Liability Recognised in the Balance Sheet disclosed under Current Liabilities
and Provisions (Refer Schedule 12)
e. Amount recognised in the Balance Sheet
Present Value of Obligation
Fair Value of Plan AssetsLiability/ (Assets) recognised in the Balance Sheet
f. Expenses Recognised in the Profit and Loss Account
Current Service Cost
Interest Cost
Expected Return on Plan Assets
Net Actuarial Loss/ (gain) Recognised in the period
Total expenses Recognised in the Profit and Loss Account**
Actual (Loss)/ Return on Plan Assets
** Included in Salary, Wages, Allowances and Other Benefits (Refer Schedule 16)
The Company's share of expenses recognised in the Profit and Loss Account in jointly control entities.
The Company's share of (Assets)/ Liability recognised in the balance Sheet in jointly control entities.
Rs. millionAs at March 31,
2009As at March 31,
2008
52.16 47.23
50.55 53.24
(1.61) 6.01
1.61 -
- 6.011.61 -
52.16 47.23
50.55 53.241.61 (6.01)
Rs. million
2008-09 2007-08
11.72 11.19
4.02 3.13
(4.26) (2.72)
8.73 (2.92)
20.21 8.68**
(3.27) 7.82
0.51 0.34
0.27 0.66
102
WELSPUN INDIA LIMITEDAnnual Report 2008 -09
SCHEDULES ANNEXED TO AND FORMING PART OF THE CONSOLIDATED BALANCE SHEET AS AT MARCH 31, 2009 AND
CONSOLIDATED PROFIT AND LOSS ACCOUNT FOR THE YEAR ENDED MARCH 31, 2009

(ii) Information about Secondary Geographical Segments:
A subsidiary of the Company has four separate trademark licensing agreements, under which it could utilize
certain names on towels.
The future minimum annual royalties, image fund fees and merchandise coordinator fees obligations as at March 31, 2009
were as follows:
Related Party Disclosures
(i) Relationship
(iii) Notes:
(a) The Segment revenue in the geographical segments considered for disclosure are as follows:
- Revenue within India includes sales to customers located within India and earnings in India.
- Revenue outside India includes sales to customers located outside India, earnings outside India and export benefits on
sales made to customers located outside India.
(b) Segment revenue, results, assets and liabilities include the respective amounts identified to each of the segments and
amounts allocated on a reasonable basis.
17)
18)
India Outside India Total
March
31, 2009
March
31, 2008
March
31, 2009
March
31, 2008
March
31, 2009
March
31, 2008
External Revenue 1,163.36 1,075.35 15,827.84 15,388.58 16,991.20 16,463.93
Carrying Amount of Segment Assets 21,408.07 22,141.93 6,031.51 3,959.88 27,439.58 26,101.81
Capital Expenditure
(excluding the Incidental Expenditure
Pending Capitalisation/ Allocation) 1,754.06 3,310.86 441.24 465.63 2,195.30 3,776.49
(Rs. Million)
Year ended March 31 Royalty Image Fund and Merchandise Coordinator Fees Total
2010 114.94 31.36 146.30
2011 66.17 42.57 108.74
2012 41.12 38.48 79.60
222.23 112.41 334.64
Control
(a) Joint Venture Companies Welspun Zucchi Textiles Limited (WZTL)
(Extent of holding – 50%)
MEP Cotton Limited (MC L)
(Extent of holding – 26.94%)
(b) Associate Company Welspun Retail Limited (WRL)
(Extent of holding – 41.65%)
Welspun Gujarat Stahl Rohren Limited (WGSRL)
Welspun Power and Steel Limited (WPSL)
Welspun Syntex Limited (WSL)
Welspun Trading Limited (WTL)
Welspun Wintex Limited (WWL)
Welspun Mercantile Limited (WML)
Krishiraj Trading Limited (KTL)
Welspun Logistics Limited (WLL)
Welspun Realty Private Limited (WRPL)
Mertz Securities Limited (MSL)
Welspun Polybuttons Limited (WPBL)
Refined Salts Private Limited (RSPL)
Vipuna Trading Limited (VTL)
Goodvalue Polyplast Limited (GVPL)
(c) Enterprises over which Key
Management Personnel or relatives
of such personnel exercise
significant influence or control and
with whom transactions have taken
place during the year
Welspun Foundation for Health and Knowledge (WFHK)
B. K. Goenka (BKG)
R. R. Mandawewala (RRM)
(d) Key Management
Personnel
M. L. Mittal (MLM)
(e) Relatives of Key Management
Personnel
Deepali Goenka (DBG)
SCHEDULES ANNEXED TO AND FORMING PART OF THE CONSOLIDATED BALANCE SHEET AS AT MARCH 31, 2009 AND
CONSOLIDATED PROFIT AND LOSS ACCOUNT FOR THE YEAR ENDED MARCH 31, 2009
103
(Rs. million)

104
WELSPUN INDIA LIMITEDAnnual Report 2008 -09
18
)(i
i)Fo
llo
win
ga
reth
etr
an
sact
ion
sw
ith
rela
ted
pa
rtie
sm
en
tio
ne
din
(i)
ab
ov
ea
nd
the
ye
ar-
en
db
ala
nce
s
PA
RT
ICU
LAR
SW
ZT
LM
CL
WR
LW
GS
RL
WP
SL
WS
LW
TL
WW
LW
ML
KT
LW
LLW
RP
LV
TL
GV
PL
MS
LW
PB
LR
SP
LW
FH
KB
KG
RR
MM
LMD
BG
Tra
nsa
ctio
ns
du
rin
gth
ey
ea
r
Loa
ns,
Ad
van
ces
an
dD
ep
osi
tsg
ive
n-
-4
2.6
8-
--
--
--
--
--
--
-1
7.9
0-
--
-
(20
.00
)(2
20
.00
)(2
3.4
0)
(25
0.0
0)
(6.0
0)
(11
.50
)
Re
pa
ym
en
to
fLo
an
s,A
dva
nce
sa
nd
De
po
sits
giv
en
--
--
--
--
--
23
.40
16
.20
--
1.6
7-
9.2
0-
--
--
(10
0.0
0)
(12
.00
)(9
.00
)
De
po
sits
Re
ceiv
ed
--
--
--
--
--
--
--
--
--
--
--
(12
.40
)
Pu
rch
ase
of
Go
od
s-
18
.76
0.0
24
98
.01
58
.63
5.4
7-
--
--
--
--
0.9
3-
--
--
-
(1.8
6)
(16
.18
)(7
1.7
3)
(77
.82
)(1
2.8
3)
Pu
rch
ase
of
Se
rvic
es/
Exp
en
ses
incu
rre
d2
2.1
45
.66
13
.35
4.4
84
7.3
94
.69
--
--
-2
4.9
5-
-4
.42
--
--
--
-
(0.2
1)
(2.0
1)
(1.1
2)
(26
.61
)(0
.72
)(1
.42
)(0
.52
)(3
.27
)
Sa
leo
fG
oo
ds/
DE
PB
Lice
nse
s4
0.4
6-
51
1.3
52
1.2
43
.71
2.4
4-
--
--
--
--
0.0
5-
--
--
-
(15
.48
)(4
12
.61
)(1
3.4
2)
(9.5
5)
(0.5
9)
Job
Ch
arg
es
Re
ceiv
ed
--
1.3
3-
--
--
--
--
--
--
--
--
--
(0.6
8)
(12
.28
)
Sa
leo
fS
erv
ice
s/E
xpe
nse
sin
curr
ed
3.2
7-
9.8
36
9.7
31
2.6
33
.53
1.6
7-
--
0.0
1-
--
--
--
--
--
(3.8
9)
(6.6
7)
(51
.20
)(4
.82
)(1
.51
)
Sa
leo
fF
ixe
dA
sse
ts-
--
--
1.3
6-
--
--
--
--
--
--
--
-
(0.2
3)
Pu
rch
ase
of
Fix
ed
Ass
ets
/C
ap
ita
l Go
od
s-
--
4.7
23
.63
--
--
--
--
--
--
--
--
-
(0.1
1)
(35
.78
)(1
11
.54
)(2
0.2
9)
Inte
rest
Inco
me
--
3.8
8-
--
--
--
--
--
--
--
--
--
(4.3
7)
Cla
ims,
Dis
cou
nt
an
dR
eb
ate
0.1
4-
--
--
--
--
--
--
--
--
--
--
(0.4
5)
(65
.91
)
Re
mu
ne
rati
on
an
dC
om
mis
sio
n-
--
--
--
--
--
--
--
--
-2
.85
2.1
63
.16
2.2
3
(7.4
2)
(6.7
4)
(3.2
7)
(2.5
1)
Div
ide
nd
Re
ceiv
ed
--
-1
0.7
0-
--
--
--
--
--
--
--
--
-
(7.1
3)
Do
na
tio
n-
--
--
--
--
--
--
--
--
--
--
-
(2.1
0)
Sh
are
Ap
pli
cati
on
Mo
ne
yP
aid
--
--
--
--
--
--
--
--
--
--
--
(0.0
5)
Pu
rch
ase
of
sha
res
of
WG
BL
du
rin
gth
eye
ar
--
--
--
2.5
02
.50
2.5
02
.50
--
--
--
--
##
-
(89
.45
)(1
22
.50
)
Clo
sin
gB
ala
nce
Loa
ns,
Ad
van
ces
an
dD
ep
osi
tsre
ceiv
ed
10
.00
--
10
.40
--
--
--
--
--
--
--
--
--
(10
.00
)
Loa
ns,
Ad
van
ces
an
dD
ep
osi
tsg
ive
n(I
ncl
ud
ing
Inte
rest
Acc
rue
do
nLo
an
)
-0
.03
42
.86
1.2
30
.28
--
--
--
23
3.8
0-
-1
3.3
4-
-2
9.4
0-
--
-
(20
.00
)(1
1.1
0)
(23
.40
)(2
50
.00
)(1
5.0
0)
(9.2
0)
(11
.50
)
De
bto
rs(N
et
of
Bil
lsD
isco
un
ted
wit
hB
an
ks)
10
.20
-2
57
.92
--
1.4
1-
--
--
--
--
#-
--
--
-
(2.7
8)
(25
4.4
0)
(0.1
6)
Cre
dit
ors
0.0
5-
#3
2.0
3-
0.2
3-
--
--
--
--
0.0
4-
--
--
-
(11
.51
)(0
.57
)(0
.42
)(4
.42
)(4
.42
)
Inve
stm
en
ts3
4.5
69
9.5
02
44
.63
56
.65
#5
.60
--
--
--
--
--
--
--
--
(34
.56
)(9
9.5
0)
(24
4.6
3)
(56
.65
)(5
.60
)
Sh
are
Ap
pli
cati
on
Mo
ne
yP
en
din
gA
llo
tme
nt
-0
.05
--
--
--
--
--
--
--
--
--
--
(0.0
5)
No
tes:
Pre
vio
us
yea
rfi
gu
res
are
giv
en
inb
rack
ets
.
#Le
ssth
an
Rs.
10
,00
0
Rs.
mil
lio
n
SC
HE
DU
LES
AN
NE
XE
DT
OA
ND
FOR
MIN
GP
AR
TO
FT
HE
CO
NS
OLI
DA
TE
DB
ALA
NC
ES
HE
ET
AS
AT
MA
RC
H3
1,
20
09
AN
DC
ON
SO
LID
AT
ED
PR
OF
ITA
ND
LOS
SA
CC
OU
NT
FOR
TH
EY
EA
RE
ND
ED
MA
RC
H3
1,
20
09
#

19) Leases
A. Where the Company is a lessor :
Operating Lease
Certain buildings and plant and machinery have been given on operating lease, details of which are as under:
* Includes depreciation of Rs. 3.40 million on plant and machinery which was given on lease upto July 2007.
B. Where the Company is a lessee :
(i) Finance Lease
Future obligation towards lease rentals under the lease agreements as on March 31, 2009 is Rs. 41.87 million
(March 31, 2008 : Rs. 25.71 million)
Previous Year figures are given in brackets.
MLP : Minimum Lease Payments
PV : Present Value
(i) Operating Lease
The Company, some of its subsidiaries and one of it's jointly controlled entities have taken various residential,
office premises, godowns and vehicles under operating lease agreements that are renewable on a periodic basis at
the option of both the lessor and the lessee. The initial tenure of lease is generally for eleven months to sixty
months.
The minimum rental payments under the operating leases under non-cancellable lease term as at March 31, 2009
are as under:
Previous Year figures are given in brackets
* Including the Company's share of Rs. 0.04 million (March 31, 2008 : Rs. 0.11 million) in jointly controlled
entities
**Including the Company's share of Rs. Nil (March 31, 2008 : Rs. 0.01 million) in jointly controlled entities
The aggregate rental expenses of all the operating leases for the year are Rs. 287.29 million (Previous Year: Rs.
167.43 million) which includes the Company's share of Rs. 0.29 million (Previous Year Rs. 0.56 million) in jointly
controlled entities.
Particulars March 31, 2009 March 31, 2008
Buildings
Gross Block 10.25 10.25
Accumulated Depreciation 1.82 1.65
Depreciation recognised in the Profit and Loss Account for the year 0.17 0.17
Plant and Machinery
Gross Block 42.49 42.49
Accumulated Depreciation 30.63 26.90
Depreciation recognised in the Profit and Loss Account for the year 3.73 6.33*
Description Not later than 1 year Later than 1 year and not later
than 5 years
Later than 5
years
Total
MLP PV MLP PV MLP PV MLP PV
Plant and Machinery 19.29
(13.76)
17.86
(12.74)
22.58
(11.95)
19.37
(10.25)
-
-
-
-
41.87
(25.71)
37.23
(22.99)
Not later than 1 year Later than 1 year and not later than 5 years Later than 5 years
167.38*
(86.98)
767.61**
(489.34)
100.49
(229.13)
SCHEDULES ANNEXED TO AND FORMING PART OF THE CONSOLIDATED BALANCE SHEET AS AT MARCH 31, 2009 AND
CONSOLIDATED PROFIT AND LOSS ACCOUNT FOR THE YEAR ENDED MARCH 31, 2009
Rs. million
Rs. million
Rs. million
105

20)
21)
Provisions for Closure Costs
Exceptional items for the year represent costs incurred by one of the Subsidiaries to exit an arrangement with a retailer. The
cost includes severance cost and write off of shop fixtures and fittings.
Disclosure of Interest in Joint Ventures
106
WELSPUN INDIA LIMITEDAnnual Report 2008 -09
Rs. million
Opening Balance 1.99
Add: Additional provision made 38.52
Less: Amounts Utilised 31.16
Closing Balance 9.35
As at
March 31, 2009
As at
March 31, 2008
I ASSETS
1. Fixed Assets 241.71 308.83
2. Incidental Expenditure Pending
Capitalisation/ Allocation
1.23 3.16
3. Investments 4.58 0.12
4. Deferred Tax Asset – Net 1.71 -
5. Current Assets, Loans and Advances
a) Inventories 167.37 160.36
b) Sundry Debtors 50.37 180.02
c) Cash and Bank Balances 5.54 31.89
d) Loans, Advances and Other Current
Assets
51.34 54.66
II LIABILITIES
1. Shareholders’ Funds – Reserves and Surplus
(excluding Share Premium)
(27.46) 20.81
2. Secured Loans 276.63 514.48
3. Unsecured Loans 29.59 14.96
4. Deferred Tax Liability – Net - 0.88
5. Current Liabilities and Provisions
a) Liabilities 70.00 41.38
b) Provisions 19.97 2.36
For the year ended
March 31, 2009
For the year ended
March 31, 2008
III INCOME
1. Sales (net of excise duty) 693.27 566.12
2. Other Income 2.55 6.27
695.82 572.39
IV EXPENDITURE
1. Materials and Manufacturing Expenses 613.80 526.52
2. Employees’ Remuneration and Benefit 20.31 15.32
3. Selling, Administration and Other
Expenses
47.26 7.30
4. Finance Expenses (Net) 46.75 14.43
5. Depreciation 15.58 6.69
743.70 570.26
(Loss)/ Profit before taxation (47.88) 2.13
Provision for taxation
(including deferred taxation)
7.96 1.30
(Loss)/ Profit after taxation (55.84) 0.83
Rs. million
Rs. million
SCHEDULES ANNEXED TO AND FORMING PART OF THE CONSOLIDATED BALANCE SHEET AS AT MARCH 31, 2009 AND
CONSOLIDATED PROFIT AND LOSS ACCOUNT FOR THE YEAR ENDED MARCH 31, 2009

23)
24)
Certain Subsidiary Companies' accounting systems do not track purchases/ consumption of raw materials and purchases of
traded goods separately. Hence, for the purposes of presentation in Schedule 15, opening stock of raw materials, work in
process, finished goods and traded goods are grouped together, purchase of raw materials and traded goods are grouped
together and closing stock of raw materials, work in process, finished goods and traded goods are grouped together.
Similarly, inventories of finished goods and traded goods are grouped together under Schedule 8.
The Income Tax Department had disallowed certain expenditure claimed by the Company in its income tax returns for the
Assessment Years 1998-1999 and 2001-2002. During the year, the Income Tax Appellate Tribunal decided the matter in the
22) Disclosure of Derivative Instruments
A Derivative instruments outstanding at the year end :
i) Forward Exchange and Option Contracts to hedge the foreign currency exposure for payments to be
received against exports and other receivables: (Rs. million)
Currency
March 31, 2009 March 31, 2008
USD 186.91 114.28
(Equivalent Rs.) (9,052.89) (4,640.87)
EURO 0.69 2.00
(Equivalent Rs.) (46.44) (116.33)
ii) Forward Exchange and Option Contracts to hedge the foreign currency exposure for payments to be
made against imports and other payables:
(Rs. million)
Currency
March 31, 2009 March 31, 2008
USD 1.44 12.38
(Equivalent Rs.) (73.95) (496.33)
EURO 0.76 10.91
(Equivalent Rs.) (49.62) (647.26)
JPY - 59.40
(Equivalent Rs.) - (23.83)
B Pursuant to the adoption of AS-30 with effect from April 1, 2008 as given in Note 1(x)(c) above, forward
loss aggregating Rs. 294.95 million arising on fair valuation of hedging instruments that are considered
effective are debited and carried forward, in ‘Hedging Reserve Account’ instead of the earlier policy of
recognising such losses in the Profit and Loss Account.
C The following table summarizes activity in the Hedging Reserve related to all derivatives classified as
cash flow hedges during the year ended March 31, 2009
(Rs. million)
Particulars Year ended March 31, 2009 Year ended March 31, 2008
Balance as at the beginning of the year - -
Unrealised gain/ (losses) on cash flow
hedging derivatives during the year (941.22) -
Net gains/ (losses) reclassified into net
income on completion of hedged
transactions (608.59) -
Balance as at Year end (332.63) -
Forward Exchange Contracts and Option Contracts
Forward Exchange Contracts and Option Contracts
SCHEDULES ANNEXED TO AND FORMING PART OF THE CONSOLIDATED BALANCE SHEET AS AT MARCH 31, 2009 AND
CONSOLIDATED PROFIT AND LOSS ACCOUNT FOR THE YEAR ENDED MARCH 31, 2009
107
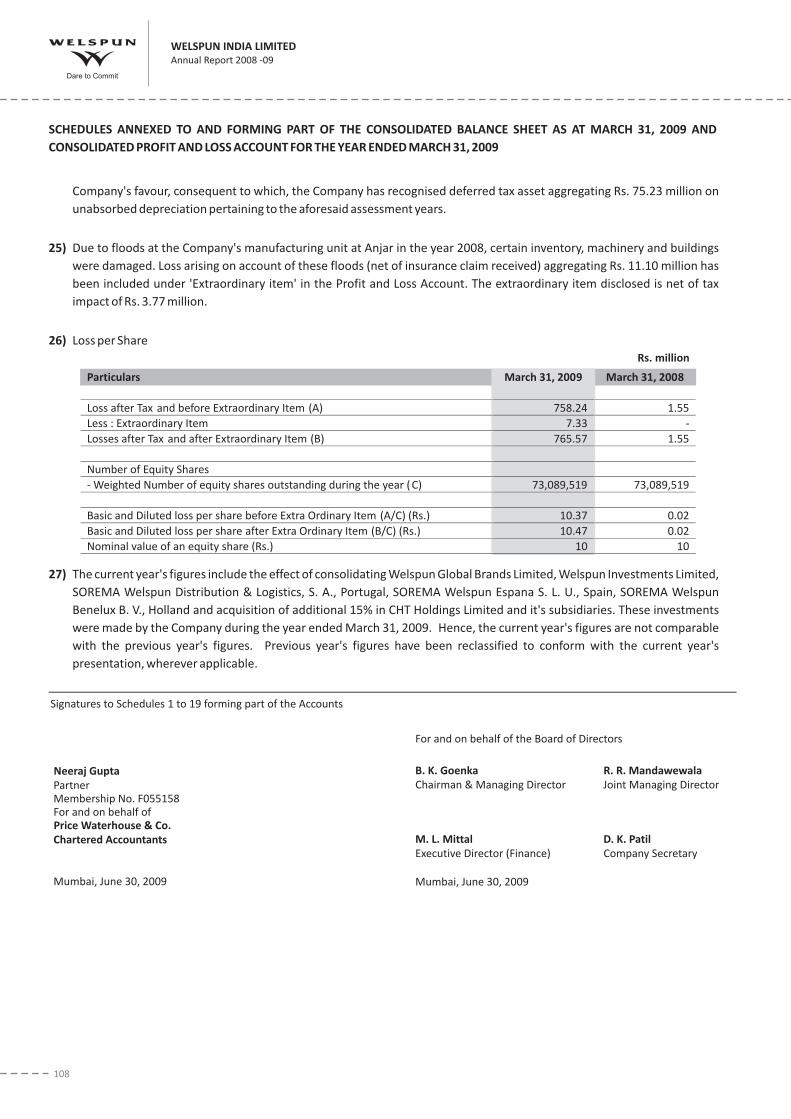
Company's favour, consequent to which, the Company has recognised deferred tax asset aggregating Rs. 75.23 million on
unabsorbed depreciation pertaining to the aforesaid assessment years.
Due to floods at the Company's manufacturing unit at Anjar in the year 2008, certain inventory, machinery and buildings
were damaged. Loss arising on account of these floods (net of insurance claim received) aggregating Rs. 11.10 million has
been included under 'Extraordinary item' in the Profit and Loss Account. The extraordinary item disclosed is net of tax
impact of Rs. 3.77 million.
Loss per Share
The current year's figures include the effect of consolidating Welspun Global Brands Limited, Welspun Investments Limited,
SOREMA Welspun Distribution & Logistics, S. A., Portugal, SOREMA Welspun Espana S. L. U., Spain, SOREMA Welspun
Benelux B. V., Holland and acquisition of additional 15% in CHT Holdings Limited and it's subsidiaries. These investments
were made by the Company during the year ended March 31, 2009. Hence, the current year's figures are not comparable
with the previous year's figures. Previous year's figures have been reclassified to conform with the current year's
presentation, wherever applicable.
25)
26)
27)
Particulars March 31, 2009 March 31, 2008
Loss after Tax and before Extraordinary Item (A) 758.24 1.55
Less : Extraordinary Item 7.33 -
Losses after Tax and after Extraordinary Item (B) 765.57 1.55
Number of Equity Shares
- Weighted Number of equity shares outstanding during the year ( C) 73,089,519 73,089,519
Basic and Diluted loss per share before Extra Ordinary Item (A/C) (Rs.) 10.37 0.02
Basic and Diluted loss per share after Extra Ordinary Item (B/C) (Rs.) 10.47 0.02
Nominal value of an equity share (Rs.) 10 10
108
WELSPUN INDIA LIMITEDAnnual Report 2008 -09
For and on behalf of the Board of Directors
B. K. Goenka R. R. Mandawewala
Chairman & Managing Director
M. L. Mittal
Executive Director (Finance) Company Secretary
Mumbai, June 30, 2009
Joint Managing Director
D. K. Patil
Signatures to Schedules 1 to 19 forming part of the Accounts
Neeraj Gupta
PartnerMembership No. F055158For and on behalf ofPrice Waterhouse & Co.
Chartered Accountants
Mumbai, June 30, 2009
SCHEDULES ANNEXED TO AND FORMING PART OF THE CONSOLIDATED BALANCE SHEET AS AT MARCH 31, 2009 AND
CONSOLIDATED PROFIT AND LOSS ACCOUNT FOR THE YEAR ENDED MARCH 31, 2009
Rs. million

109
CONSOLIDATED CASH FLOW STATEMENT FOR THE YEAR ENDED MARCH 31, 2009For the Year Ended For the Year Ended
March 31, 2009 March 31, 2008
Rs. million Rs. millionRs. million
A. CASH FLOW FROM OPERATING ACTIVITIES
Net Profit Before Tax (643.26) 341.04
Adjustments for :
Depreciation 1,086.57 951.74
Exceptional Items (Refer Note 20 on Schedule 19) (38.52) (43.71)
Unrealised Foreign Exchange Differences 12.14 (27.73)
Loss/ (Profit) on Sale of Fixed Assets 15.12 (79.25)
Profit on Redemption/ Sale of Units of Mutual Funds (3.60) (1.24)
Profit on Sale of Bonds (2.00) (4.97)
Profit on sale of Shares (221.35) -
Dividend (16.56) (25.83)
Liabilities Written Back as no Longer Required (1.43) (0.53)
Provision for Doubtful Debts/ Advances Written Back - (5.85)
Provision for Doubtful Debts/ Advances 15.53 25.56
Debts/ Advances Written off 4.70 15.62
Excise Benefits Receivable Written Off - 43.23
Extraordinary Item (11.10) -
Interest Income and Cash Discount Received (66.36) (56.72)
Finance Expenses 1,242.92 838.66
2,016.06 1,628.98
Operating Profit Before Working Capital Changes 1,372.80 1,970.02
Adjustments for changes in working capital :
Trade and Other Receivables (199.46) (597.70)
Inventories (368.63) (495.56)
Current Liabilities and Provisions 715.04 465.36
146.95 (627.90)
Cash Flow Generated from Operations 1,519.75 1,342.12
Income Tax and Fringe Benefit Tax paid (51.08) (101.31)
Net Cash Flow from Operating Activities 1,468.67 1,240.81
B. CASH FLOW FROM INVESTING ACTIVITIES
Purchase of Fixed Assets (Including Capital Work-in-progress) (2,100.24) (3,776.35)
Sale of Fixed Assets 10.40 160.20
Capital Subsidy 39.27 14.79
Sale of Investments 175.05 222.14
Dividend Received 16.56 25.83
Interest Received 17.60 19.69
Net Cash Flow used in Investing Activities (1,841.36) (3,333.70)
C. CASH FLOW FROM FINANCING ACTIVITIES
Redemption of Preference Shares - (102.26)
Redemption of Debentures - (168.08)
Proceeds from Long Term Borrowings (Net of Repayments) 898.80 1,499.16
Proceeds from Other Borrowings (Net of Repayments) 465.69 1,277.42
Finance Expenses Paid (1,092.57) (1,045.41)
Net Cash Flow from Financing Activities 271.92 1,460.83
( A + B + C ) (100.77) (632.06)
Cash and Cash Equivalents at the beginning of the year 1,298.64 1,886.15
Cash and Cash Equivalents taken over from erstwhile SOREMA – Tapetes E
Cortinas De Banho, S.A.,a subsidiary Company- 44.55
Cash and Cash Equivalents at the end of the year 1,197.87 1,298.64
Net Decrease in Cash and Cash Equivalents (100.77) (632.06)
NOTES :
1. The Cash Flow Statement has been prepared under the "Indirect method" as set out in Accounting Standard - 3 on
Cash Flow Statements issued by the Institute of Chartered Accountants of India.
2. Previous year's comparatives have been reclassified to conform with the current year's presentation, wherever applicable.
This is the Consolidated Cash Flow referred to in our report of the even date.
For and on behalf of the Board of Directors
B. K. Goenka R. R. Mandawewala
Chairman & Managing Director
M. L. Mittal
Executive Director (Finance) Company Secretary
Mumbai, June 30, 2009
D. K. Patil
Joint Managing Director
Neeraj Gupta
Partner
Membership No. F055158
For and on behalf of
Price Waterhouse & Co.
Chartered Accountants
Mumbai, June 30, 2009

STA
TE
ME
NT
PU
RS
UA
NT
TO
SE
CT
ION
21
2O
FT
HE
CO
MP
AN
IES
AC
T,1
95
6,
RE
LAT
ING
TO
SU
BS
IDIA
RY
CO
MP
AN
IES
Rs.
inm
illi
on
Na
me
of
the
sub
sid
iary
com
pa
ny
We
lsp
un
USA
Inc.
We
lsp
un
Ho
ldin
gs
Pv
t.
Ltd
.
We
lsp
un
Ho
me
Text
ile
sU
K
Ltd
.
CH
T
Ho
ldin
gs
Ltd
.
Ch
rist
yH
om
e
Text
ile
sLt
d.
Ch
rist
yU
K
Ltd
.
ER
Kin
gsl
ey
(Te
xtil
es)
Ltd
.
Ch
rist
y2
00
4
Ltd
.
Fly
spa
rkLt
d.
Ch
rist
y
Eu
rop
e
Gm
bH
We
lsp
un
AG
We
lsp
un
Me
xico
SA
de
CV
SO
RE
MA
-
Tap
ete
sE
Co
rtin
as
DE
Ba
nh
o,
S.A
.
SO
RE
MA
We
lsp
un
Dis
trib
uti
on
&Lo
gis
tics
,S
.
A.,
Po
rtu
ga
l
SO
RE
MA
We
lsp
un
Esp
an
aS
.L.
U.,
Sp
ain
SO
RE
MA
We
lsp
un
Be
ne
lux
B.
V.,
Ho
lla
nd
Be
sa
De
velo
pe
rs
an
d
Infr
ast
ruct
ur
eP
riva
te
Lim
ite
d
We
lsp
un
Glo
ba
l
Bra
nd
s
Lim
ite
d
We
lsp
un
Inve
stm
en
ts
Lim
ite
d
Fin
an
cia
lYe
ar
of
the
sub
sid
iary
en
de
do
n3
1-M
ar-
09
31
-Ma
r-0
93
1-M
ar-
09
31
-Ma
r-0
93
1-M
ar-
09
31
-Ma
r-0
93
1-M
ar-
09
31
-Ma
r-0
93
1-M
ar-
09
31
-Ma
r-0
93
1-M
ar-
09
31
-Ma
r-0
93
1-M
ar-
09
31
-Ma
r-0
93
1-M
ar-
09
31
-Ma
r-0
93
1-M
ar-
09
31
-Ma
r-0
93
1-M
ar-
09
Sh
are
Ca
pit
al
6.8
90
.42
33
9.4
40
.03
0.0
80
.08
0.1
6-
-1
.62
73
1.0
00
.18
34
.21
3.3
73
.37
1.2
10
.10
5.0
00
.50
Re
serv
es
&S
urp
lus
27
6.2
33
16
.12
97
.27
69
8.4
08
6.9
15
9.0
74
1.6
87
2.9
11
.89
(4.3
1)
(50
7.0
8)
(17
5.5
0)
66
.84
(1.9
6)
(4.4
3)
(2.3
8)
-(2
5.8
8)
(0.3
5)
Tota
lA
sse
ts(F
ixe
dA
sse
ts+
Inve
stm
en
ts+
Cu
rre
nt
Ass
ets
)
1,8
95
.81
1,4
68
.09
1,2
89
.30
1,4
84
.95
78
5.1
31
,81
8.8
25
9.0
89
50
.33
21
2.5
41
0.8
74
36
.32
42
9.6
86
66
.31
78
.48
9.9
01
.55
31
.60
91
7.1
00
.15
Tota
lLi
ab
ilit
ies
(De
bts
+C
urr
en
tLi
ab
ilit
ies)
1,6
12
.69
1,1
51
.55
85
2.5
97
86
.52
69
8.1
41
,75
9.6
71
7.3
27
7.4
22
10
.65
13
.56
21
2.3
96
05
.00
56
5.2
67
7.0
71
0.9
62
.72
31
.50
93
7.9
8-
Inve
stm
en
t(e
xclu
din
gin
vest
me
nts
insu
bsi
dia
rie
s)-
--
--
--
--
--
--
--
-
0.0
00
.00
0.0
00
.00
0.0
00
.00
0.0
00
.00
0.0
00
.00
0.0
00
.00
0.0
00
.00
0.0
00
.00
0.0
00
.00
0.0
0
Turn
ove
r2
,22
2.1
1-
-2
,85
3.8
3-
2,7
55
.50
94
.45
--
48
.93
22
9.0
51
71
.86
43
8.0
7-
7.3
30
.11
-3
,17
9.6
5-
Pro
fit
be
fore
Taxa
tio
n(9
.48
)(7
.18
)1
84
.17
(33
4.2
1)
90
.56
(15
7.4
4)
6.3
70
.03
-2
.72
(40
7.4
2)
(18
1.3
0)
(52
.16
)(1
.88
)(4
.24
)(2
.28
)-
11
.85
(0.3
5)
Pro
vis
ion
for
Taxa
tio
n-
--
(21
.40
)(4
.19
)(3
7.8
3)
1.8
60
.01
-0
.78
-0
.44
(10
.27
)-
--
-5
.45
-
Pro
fit
aft
er
Taxa
tio
n(9
.48
)(7
.18
)1
84
.17
(31
2.8
1)
94
.75
(11
9.6
1)
4.5
10
.02
-1
.94
(40
7.4
2)
(18
1.7
4)
(41
.89
)(1
.88
)(4
.24
)(2
.28
)-
6.4
0(0
.35
)
Pro
po
sed
Div
ide
nd
--
--
--
--
--
--
--
--
--
-
*Le
ssth
an
Rs.
10
,00
0/-
**
Co
nso
lid
ate
dF
igu
refo
rth
eC
om
pa
ny
an
da
llit
’s
sub
sid
iari
es
isg
ive
n.
For
an
do
nb
eh
alf
of
the
Bo
ard
of
Dir
ect
ors
B.
K.
Go
en
ka
R.
R.
Ma
nd
aw
ew
ala
Ch
air
ma
n&
Ma
na
gin
gD
ire
cto
r
M.
L.M
itta
l
Exe
cuti
veD
ire
cto
r(F
ina
nce
)C
om
pa
ny
Se
cre
tary
D.
K.
Pa
til
Join
tM
an
ag
ing
Dir
ect
or
Mu
mb
ai,
Jun
e3
0,
20
09
Pla
ce:
Mu
mb
ai
110
WELSPUN INDIA LIMITEDAnnual Report 2008 -09

����������� ��
Name ______________________________
Address ____________________________
___________________________________
_____________________________________
____________________________________
Tel. ________________________________
E-mail _____________________________
Folio No. ____________________________
D.O.B. _____________________________
Bill No. ______________________________
Bill Date
Bill Amount ___________________________
Store _______________________________
______________________________
India’s Largest Retailer In Home Furnishing
and Home Decor
10% OFF*
India’s 1st Chain of Organised
Retail Stores for Home Fashion
15% OFF*
*conditions applyValidity: Aug 1st 08 - Jan 31st 09

Dare to Commit
Dare to Commit