DANGOTE CEMENT PLC attributable to owners of the Company 566,123,339 545,064,392 ... Gratuity and...
20
30 SEPTEMBER 2014 DANGOTE CEMENT PLC INTERIM FINANCIAL STATEMENTS
Transcript of DANGOTE CEMENT PLC attributable to owners of the Company 566,123,339 545,064,392 ... Gratuity and...
30 SEPTEMBER 2014
DANGOTE CEMENT PLC
INTERIM FINANCIAL STATEMENTS
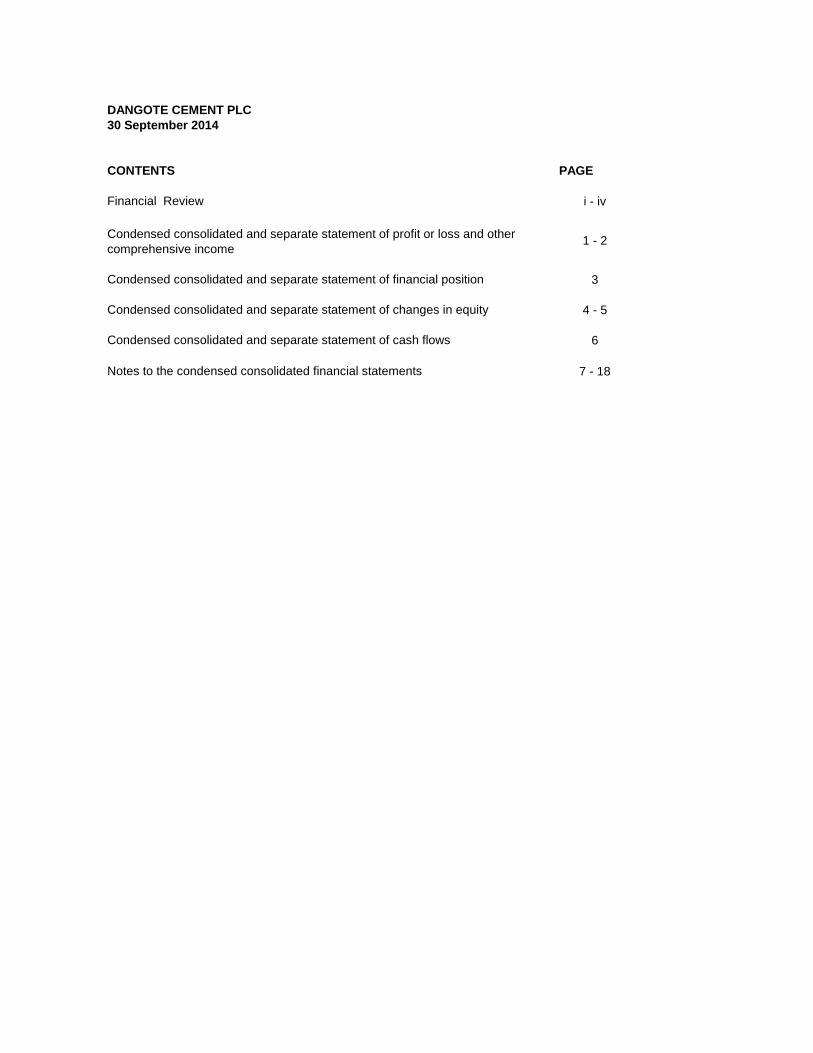
DANGOTE CEMENT PLC
30 September 2014
CONTENTS PAGE
Financial Review i - iv
1 - 2
3
4 - 5
Condensed consolidated and separate statement of cash flows 6
Notes to the condensed consolidated financial statements 7 - 18
Condensed consolidated and separate statement of profit or loss and other
comprehensive income
Condensed consolidated and separate statement of financial position
Condensed consolidated and separate statement of changes in equity
Dangote Cement Plc
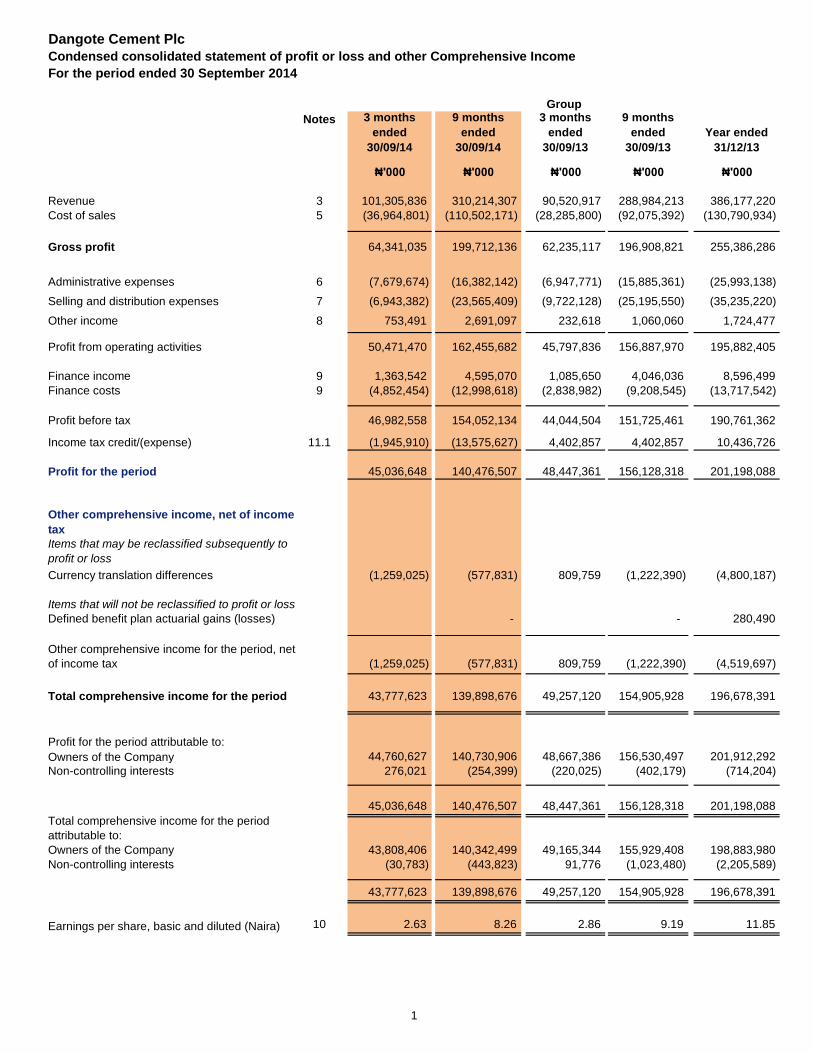
Condensed consolidated statement of profit or loss and other Comprehensive Income
For the period ended 30 September 2014
Notes 3 months
ended
30/09/14
9 months
ended
30/09/14
3 months
ended
30/09/13
9 months
ended
30/09/13
Year ended
31/12/13
₦'000 ₦'000 ₦'000 ₦'000 ₦'000
Revenue 3 101,305,836 310,214,307 90,520,917 288,984,213 386,177,220
Cost of sales 5 (36,964,801) (110,502,171) (28,285,800) (92,075,392) (130,790,934)
Gross profit 64,341,035 199,712,136 62,235,117 196,908,821 255,386,286
Administrative expenses 6 (7,679,674) (16,382,142) (6,947,771) (15,885,361) (25,993,138)
Selling and distribution expenses 7 (6,943,382) (23,565,409) (9,722,128) (25,195,550) (35,235,220)
Other income 8 753,491 2,691,097 232,618 1,060,060 1,724,477
Profit from operating activities 50,471,470 162,455,682 45,797,836 156,887,970 195,882,405
Finance income 9 1,363,542 4,595,070 1,085,650 4,046,036 8,596,499
Finance costs 9 (4,852,454) (12,998,618) (2,838,982) (9,208,545) (13,717,542)
Profit before tax 46,982,558 154,052,134 44,044,504 151,725,461 190,761,362
Income tax credit/(expense) 11.1 (1,945,910) (13,575,627) 4,402,857 4,402,857 10,436,726
Profit for the period 45,036,648 140,476,507 48,447,361 156,128,318 201,198,088
Other comprehensive income, net of income
tax
Items that may be reclassified subsequently to
profit or loss
Currency translation differences (1,259,025) (577,831) 809,759 (1,222,390) (4,800,187)
Items that will not be reclassified to profit or loss
Defined benefit plan actuarial gains (losses) - - 280,490
Other comprehensive income for the period, net
of income tax (1,259,025) (577,831) 809,759 (1,222,390) (4,519,697)
Total comprehensive income for the period 43,777,623 139,898,676 49,257,120 154,905,928 196,678,391
Profit for the period attributable to:
Owners of the Company 44,760,627 140,730,906 48,667,386 156,530,497 201,912,292
Non-controlling interests 276,021 (254,399) (220,025) (402,179) (714,204)
45,036,648 140,476,507 48,447,361 156,128,318 201,198,088
Total comprehensive income for the period
attributable to:
Owners of the Company 43,808,406 140,342,499 49,165,344 155,929,408 198,883,980
Non-controlling interests (30,783) (443,823) 91,776 (1,023,480) (2,205,589)
43,777,623 139,898,676 49,257,120 154,905,928 196,678,391
Earnings per share, basic and diluted (Naira) 10 2.63 8.26 2.86 9.19 11.85
Group
1
Dangote Cement Plc
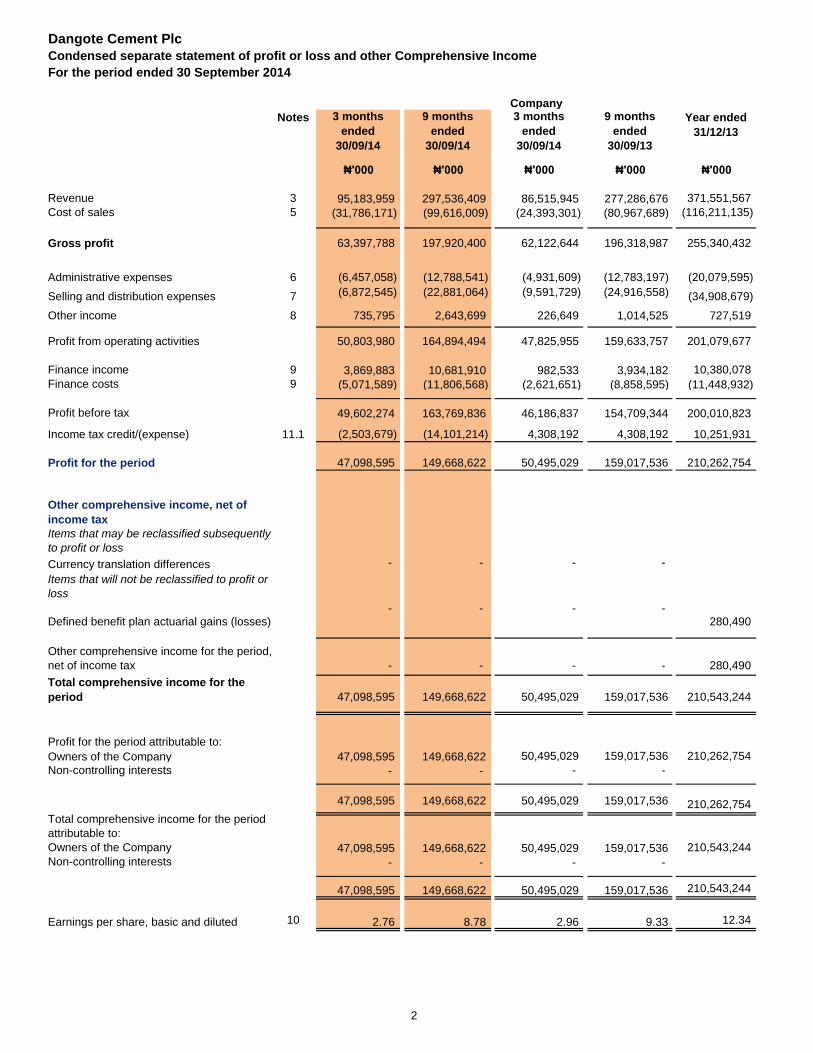
Condensed separate statement of profit or loss and other Comprehensive Income
For the period ended 30 September 2014
Notes 3 months
ended
30/09/14
9 months
ended
30/09/14
3 months
ended
30/09/14
9 months
ended
30/09/13
Year ended
31/12/13
₦'000 ₦'000 ₦'000 ₦'000 ₦'000
Revenue 3 95,183,959 297,536,409 86,515,945 277,286,676 371,551,567
Cost of sales 5 (31,786,171) (99,616,009) (24,393,301) (80,967,689) (116,211,135)
Gross profit 63,397,788 197,920,400 62,122,644 196,318,987 255,340,432
Administrative expenses 6 (6,457,058) (12,788,541) (4,931,609) (12,783,197) (20,079,595)
Selling and distribution expenses 7 (6,872,545) (22,881,064) (9,591,729) (24,916,558) (34,908,679)
Other income 8 735,795 2,643,699 226,649 1,014,525 727,519
Profit from operating activities 50,803,980 164,894,494 47,825,955 159,633,757 201,079,677
Finance income 9 3,869,883 10,681,910 982,533 3,934,182 10,380,078
Finance costs 9 (5,071,589) (11,806,568) (2,621,651) (8,858,595) (11,448,932)
Profit before tax 49,602,274 163,769,836 46,186,837 154,709,344 200,010,823
Income tax credit/(expense) 11.1 (2,503,679) (14,101,214) 4,308,192 4,308,192 10,251,931
Profit for the period 47,098,595 149,668,622 50,495,029 159,017,536 210,262,754
Other comprehensive income, net of
income tax
Items that may be reclassified subsequently
to profit or loss
Currency translation differences - - - -
Items that will not be reclassified to profit or
loss
Defined benefit plan actuarial gains (losses) - - - -
280,490
Other comprehensive income for the period,
net of income tax - - - - 280,490
Total comprehensive income for the
period 47,098,595 149,668,622 50,495,029 159,017,536 210,543,244
Profit for the period attributable to:
Owners of the Company 47,098,595 149,668,622 50,495,029 159,017,536 210,262,754
Non-controlling interests - - - -
47,098,595 149,668,622 50,495,029 159,017,536 210,262,754
Total comprehensive income for the period
attributable to:
Owners of the Company 47,098,595 149,668,622 50,495,029 159,017,536 210,543,244
Non-controlling interests - - - -
47,098,595 149,668,622 50,495,029 159,017,536 210,543,244
Earnings per share, basic and diluted
(Naira)
10 2.76 8.78 2.96 9.33 12.34
Company
2
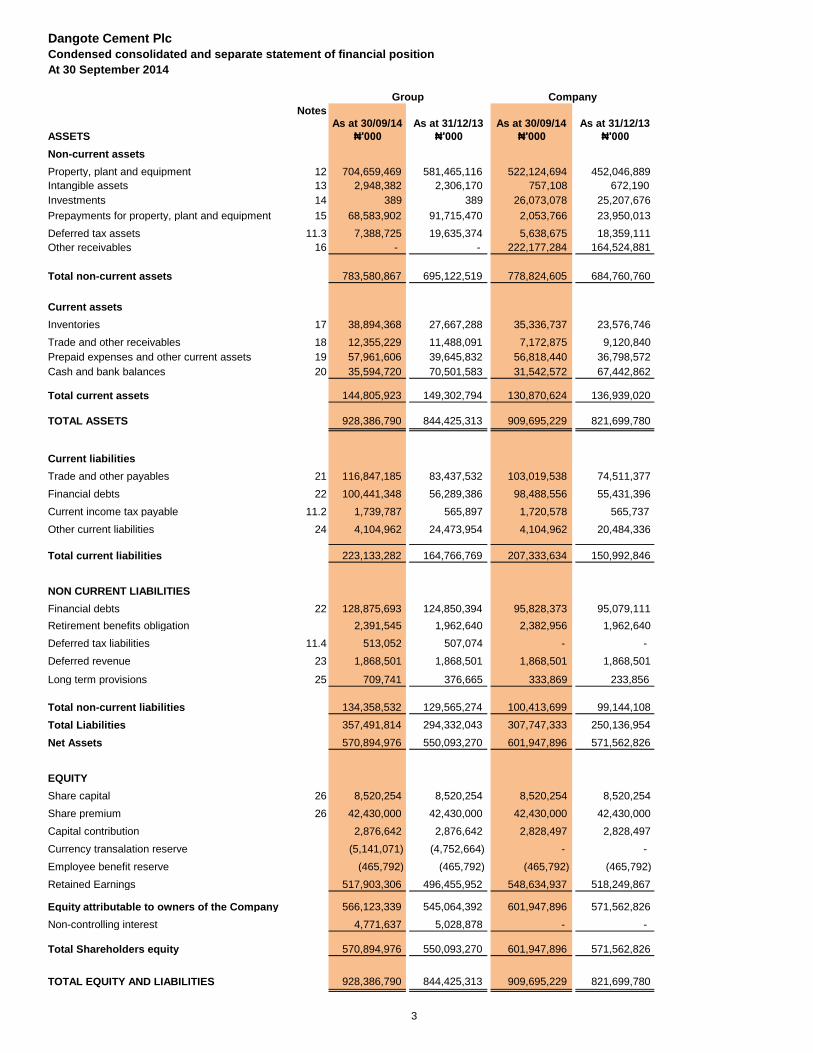
Dangote Cement Plc
Condensed consolidated and separate statement of financial position
At 30 September 2014
Notes
As at 30/09/14 As at 31/12/13 As at 30/09/14 As at 31/12/13
ASSETS ₦'000 ₦'000 ₦'000 ₦'000
Non-current assets
Property, plant and equipment 12 704,659,469 581,465,116 522,124,694 452,046,889
Intangible assets 13 2,948,382 2,306,170 757,108 672,190
Investments 14 389 389 26,073,078 25,207,676
Prepayments for property, plant and equipment 15 68,583,902 91,715,470 2,053,766 23,950,013
Deferred tax assets 11.3 7,388,725 19,635,374 5,638,675 18,359,111
Other receivables 16 - - 222,177,284 164,524,881
Total non-current assets 783,580,867 695,122,519 778,824,605 684,760,760
Current assets
Inventories 17 38,894,368 27,667,288 35,336,737 23,576,746
Trade and other receivables 18 12,355,229 11,488,091 7,172,875 9,120,840
Prepaid expenses and other current assets 19 57,961,606 39,645,832 56,818,440 36,798,572
Cash and bank balances 20 35,594,720 70,501,583 31,542,572 67,442,862
Total current assets 144,805,923 149,302,794 130,870,624 136,939,020
TOTAL ASSETS 928,386,790 844,425,313 909,695,229 821,699,780
Current liabilities
Trade and other payables 21 116,847,185 83,437,532 103,019,538 74,511,377
Financial debts 22 100,441,348 56,289,386 98,488,556 55,431,396
Current income tax payable 11.2 1,739,787 565,897 1,720,578 565,737
Other current liabilities 24 4,104,962 24,473,954 4,104,962 20,484,336
Total current liabilities 223,133,282 164,766,769 207,333,634 150,992,846
NON CURRENT LIABILITIES
Financial debts 22 128,875,693 124,850,394 95,828,373 95,079,111
Retirement benefits obligation 2,391,545 1,962,640 2,382,956 1,962,640
Deferred tax liabilities 11.4 513,052 507,074 - -
Deferred revenue 23 1,868,501 1,868,501 1,868,501 1,868,501
Long term provisions 25 709,741 376,665 333,869 233,856
Total non-current liabilities 134,358,532 129,565,274 100,413,699 99,144,108
Total Liabilities 357,491,814 294,332,043 307,747,333 250,136,954
Net Assets 570,894,976 550,093,270 601,947,896 571,562,826
EQUITY
Share capital 26 8,520,254 8,520,254 8,520,254 8,520,254
Share premium 26 42,430,000 42,430,000 42,430,000 42,430,000
Capital contribution 2,876,642 2,876,642 2,828,497 2,828,497
Currency transalation reserve (5,141,071) (4,752,664) - -
Employee benefit reserve (465,792) (465,792) (465,792) (465,792)
Retained Earnings 517,903,306 496,455,952 548,634,937 518,249,867
Equity attributable to owners of the Company 566,123,339 545,064,392 601,947,896 571,562,826
Non-controlling interest 4,771,637 5,028,878 - -
570,894,976 550,093,270 601,947,896 571,562,826
TOTAL EQUITY AND LIABILITIES 928,386,790 844,425,313 909,695,229 821,699,780
Group Company
Total Shareholders equity
3

Dangote Cement Plc
Condensed consolidated statement of changes in equity
For the period ended 30 September 2014
Employee Currency Attributable Non -Share Share Retained Benefit translation Capital to the owners controlling Total
capital premium Earnings reserve reserve Contribution of the parent interests
Group ₦'000 ₦'000 ₦'000 ₦'000 ₦'000 ₦'000 ₦'000 ₦'000 ₦'000
Balance at 1 January 2013 8,520,254 42,430,000 361,130,672 (746,282) (1,443,862) 2,876,642 412,767,424 7,234,467 420,001,891
Profit for the period - - 156,530,497 156,530,497 (402,179) 156,128,318
-
Total comprehensive income for the
period - - 156,530,497 - (601,089) - 155,929,408 (1,023,480) 154,905,928
Payment of dividends - - (51,121,522) (51,121,522) - (51,121,522)
Balance at 30 Septembere 2013 8,520,254 42,430,000 466,539,647 (746,282) (2,044,951) 2,876,642 517,575,310 6,210,987 523,786,297
Balance at 1 January 2014 8,520,254 42,430,000 496,455,952 (465,792) (4,752,664) 2,876,642 545,064,392 5,028,878 550,093,270
Profit for the period - - 140,730,906 - - - 140,730,906 (254,399) 140,476,507
Total comprehensive income for the
period - - 140,730,906 - (388,407) - 140,342,499 (443,823) 139,898,676
Effect of additional acquisition in
subsidiaries - 186,582 186,582
Payment of dividends (119,283,552) (119,283,552) - (119,283,552)
Balance at 30 September 2014 8,520,254 42,430,000 517,903,306 (465,792) (5,141,071) 2,876,642 566,123,339 4,771,637 570,894,976
(577,831) - - (388,407) (189,424)
(621,301) (1,222,390) - (601,089) (601,089)
Other comprehensive income for the
period, net of income tax
Other comprehensive income for the
period, net of income tax (388,407) - - -
4

Dangote Cement Plc
Condensed separate statement of changes in equity
For the period ended 30 September 2014
Share
capital
Company ₦'000 ₦'000 ₦'000 ₦'000 ₦'000 ₦'000
Balance at 1 January 2013 8,520,254 42,430,000 2,828,497 374,574,125 (746,282) 427,606,594
Profit for the period 159,017,536 159,017,536
Other comprehensive income for the period, net of
income tax - - - -
- -
Total comprehensive income for the period - - - 159,017,536 - 159,017,536
Payment of dividends - (51,121,522) (51,121,522)
Balance at 30 September 2013 8,520,254 42,430,000 2,828,497 482,470,139 (746,282) 535,502,608
Balance at 1 January 2014 8,520,254 42,430,000 2,828,497 518,249,867 (465,792) 571,562,826
Profit for the period 149,668,622 149,668,622
Total comprehensive income for the period - - - 149,668,622 - 149,668,622
Payment of dividends - - - (119,283,552) - (119,283,552)
Balance at 30 September 2014 8,520,254 42,430,000 2,828,497 548,634,937 (465,792) 601,947,896
Total
- - - -
Employee
benefit
reserve
- - Other comprehensive income for the period, net of
income tax
Share
premium
Retained
earnings
Capital
contribution
5
Dangote Cement Plc
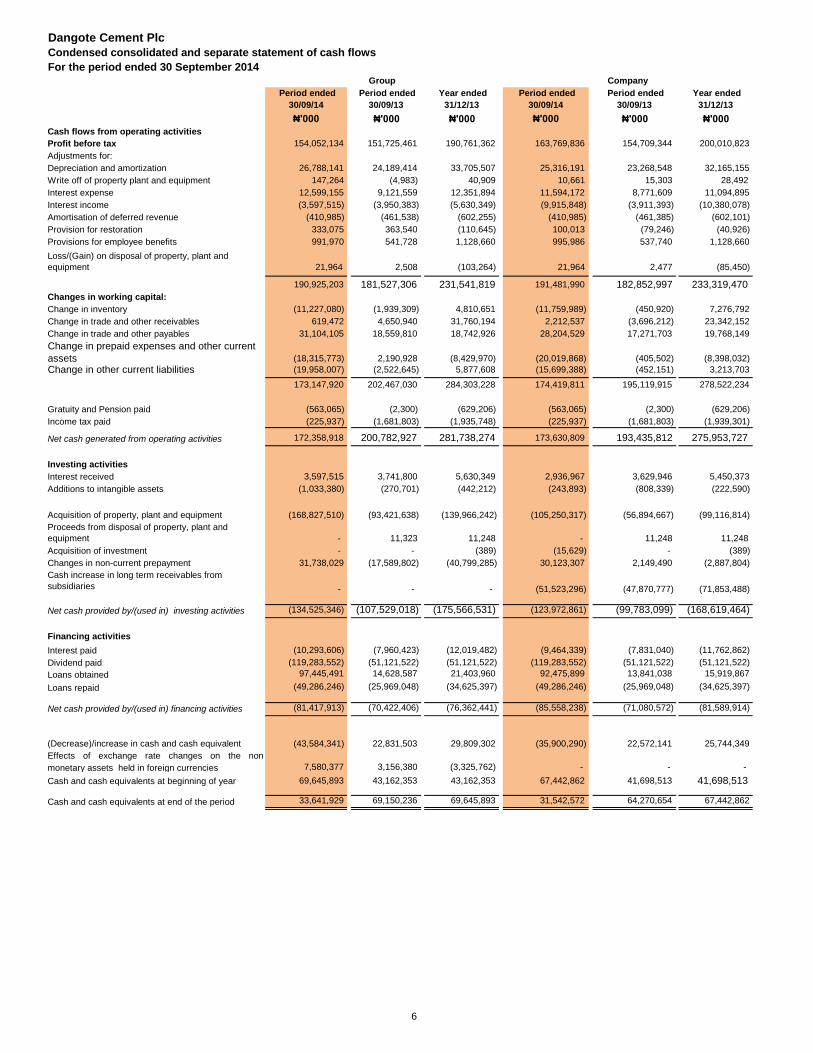
Condensed consolidated and separate statement of cash flows
For the period ended 30 September 2014
Period ended
30/09/14
Period ended
30/09/13
Year ended
31/12/13
Period ended
30/09/14
Period ended
30/09/13
Year ended
31/12/13
₦'000 ₦'000 ₦'000 ₦'000 ₦'000 ₦'000
Cash flows from operating activities
Profit before tax 154,052,134 151,725,461 190,761,362 163,769,836 154,709,344 200,010,823
Adjustments for:
Depreciation and amortization 26,788,141 24,189,414 33,705,507 25,316,191 23,268,548 32,165,155
Write off of property plant and equipment 147,264 (4,983) 40,909 10,661 15,303 28,492
Interest expense 12,599,155 9,121,559 12,351,894 11,594,172 8,771,609 11,094,895
Interest income (3,597,515) (3,950,383) (5,630,349) (9,915,848) (3,911,393) (10,380,078)
Amortisation of deferred revenue (410,985) (461,538) (602,255) (410,985) (461,385) (602,101)
Provision for restoration 333,075 363,540 (110,645) 100,013 (79,246) (40,926)
Provisions for employee benefits 991,970 541,728 1,128,660 995,986 537,740 1,128,660
Loss/(Gain) on disposal of property, plant and
equipment 21,964 2,508 (103,264) 21,964 2,477 (85,450)
190,925,203 181,527,306 231,541,819 191,481,990 182,852,997 233,319,470
Changes in working capital:
Change in inventory (11,227,080) (1,939,309) 4,810,651 (11,759,989) (450,920) 7,276,792
Change in trade and other receivables 619,472 4,650,940 31,760,194 2,212,537 (3,696,212) 23,342,152
Change in trade and other payables 31,104,105 18,559,810 18,742,926 28,204,529 17,271,703 19,768,149
Change in prepaid expenses and other current
assets (18,315,773) 2,190,928 (8,429,970) (20,019,868) (405,502) (8,398,032)
Change in other current liabilities (19,958,007) (2,522,645) 5,877,608 (15,699,388) (452,151) 3,213,703
173,147,920 202,467,030 284,303,228 174,419,811 195,119,915 278,522,234
Gratuity and Pension paid (563,065) (2,300) (629,206) (563,065) (2,300) (629,206)
Income tax paid (225,937) (1,681,803) (1,935,748) (225,937) (1,681,803) (1,939,301)
Net cash generated from operating activities 172,358,918 200,782,927 281,738,274 173,630,809 193,435,812 275,953,727
Investing activities
Interest received 3,597,515 3,741,800 5,630,349 2,936,967 3,629,946 5,450,373
Additions to intangible assets (1,033,380) (270,701) (442,212) (243,893) (808,339) (222,590)
Acquisition of property, plant and equipment (168,827,510) (93,421,638) (139,966,242) (105,250,317) (56,894,667) (99,116,814)
Proceeds from disposal of property, plant and
equipment - 11,323 11,248 - 11,248 11,248
Acquisition of investment - - (389) (15,629) - (389)
Changes in non-current prepayment 31,738,029 (17,589,802) (40,799,285) 30,123,307 2,149,490 (2,887,804)
Cash increase in long term receivables from
subsidiaries - - - (51,523,296) (47,870,777) (71,853,488)
Net cash provided by/(used in) investing activities (134,525,346) (107,529,018) (175,566,531) (123,972,861) (99,783,099) (168,619,464)
Financing activities
Interest paid (10,293,606) (7,960,423) (12,019,482) (9,464,339) (7,831,040) (11,762,862)
Dividend paid (119,283,552) (51,121,522) (51,121,522) (119,283,552) (51,121,522) (51,121,522)
Loans obtained 97,445,491 14,628,587 21,403,960 92,475,899 13,841,038 15,919,867
Loans repaid (49,286,246) (25,969,048) (34,625,397) (49,286,246) (25,969,048) (34,625,397)
Net cash provided by/(used in) financing activities (81,417,913) (70,422,406) (76,362,441) (85,558,238) (71,080,572) (81,589,914)
(Decrease)/increase in cash and cash equivalent (43,584,341) 22,831,503 29,809,302 (35,900,290) 22,572,141 25,744,349
Effects of exchange rate changes on the non
monetary assets held in foreign currencies 7,580,377 3,156,380 (3,325,762) - - -
Cash and cash equivalents at beginning of year 69,645,893 43,162,353 43,162,353 67,442,862 41,698,513 41,698,513
Cash and cash equivalents at end of the period 33,641,929 69,150,236 69,645,893 31,542,572 64,270,654 67,442,862
Group Company
6

Dangote Cement Plc
Notes to the condensed consolidated and separate financial statements
For the period ended 30 September 2014
1 General Information
2 Significant accounting policies
Basis of preparation
The Company's full financial statements for the year ended 31 December 2013 have been prepared in
accordance with International Financial Reporting Standards as issued by the Internatioanl Accounting
Standards Board ("IASB"), and interpretations issued by the International Financial Reporting Interpretations
Committee of the IASB (together “IFRS”) and requirements of the Companies and Allied Matters Act (CAMA) of
Nigeria and the Financial Reporting Council (FRC) Act of Nigeria.
These interim consolidated financial and separate statements have been prepared in accordance with IAS 34
Interim Financial Reporting. They do not include all disclosures that would otherwise be required in a complete
set of financial statements and should be read in conjunction with the 2013 annual report.
The registered address of the Company is located at 1 Alfred Rewane Road, Ikoyi, Lagos, Nigeria.
The principal activity of the Company and subsidiaries (together referred to as “the Group”) is to operate plants
for the preparation, manufacture, and distribution of cement and related products. The Company’s production
activities are currently undertaken at Obajana town in Kogi State, Gboko in Benue State and Ibese in Ogun
State; all in Nigeria. Information in respect of the subsidiaries locations is disclosed in note 14.
Dangote Cement Plc (“the Company”) was incorporated in Nigeria as a public limited liability company on 4
November, 1992 and commenced operations in January 2007 under the name Obajana Cement Plc. The name
was changed on 14 July 2010 to Dangote Cement Plc.
Its parent company is Dangote Industries Limited (“DIL” or “the Parent Company”). Its ultimate controlling party
is Alhaji Aliko Dangote.
The consolidated financial statements of the Group for the period ended 30 September 2014 comprise the
Company and its subsidiaries.
The separate financial statements of the Company for the period ended 30 September 2014 comprise the
Company only.
These consolidated and separate financial statements for the period ended 30 September 2014 have been
approved for issue by the Directors on 28 October 2014
Dangote Cement Group Plc has consistenly applied the same accounting policies and methods of computation
in its interim consolidated and separate financial statements as in its 2013 annual financial statements.
None of the new standards, interpretations and amendments, effective for the first time from 1 January 2014,
have had a material effect on the financial statements.
The financial statements have been prepared on the historical cost basis except for financial instruments that
are measured at revalued amounts or fair values, as explained in the accounting policies below. Historical cost is
generally based on the fair value of the consideration given in exchange for assets.
Fair Values
Fair value is the price that would be received to sell an asset or paid to transfer a liability in an orderly
transaction between market participants at the measurement date, regardless of whether that price is directly
observable or estimated using another valuation technique. In estimating the fair value of an asset or a liability,
the Group takes into account the characteristics of the asset or liability that market participants would take into
account when pricing the asset or liability at the measurement date. Fair value for measurement and/or
disclosure purposes in these consolidated financial statements is determined on such a basis, except for leasing
transactions that are within the scope of IAS 17, and measurements that have some similarities to fair value but
are not fair value, such as net realisable value in IAS 2 or value in use in IAS 36.
Basis of Consolidation
Previous year/periods numbers have been regrouped and reclassified to conform to current period disclosure
The Group condensed financial statements incorporate the financial statements of the Parent Company and its
subsidiaries made up to 30 September 2014. Control is achieved where the investor; (i) has power over the
investee entity (ii) is exposed, or has rights, to variable returns from the investee entity as a result of its
involvement, and (iii) can exercise some power over the investee to affect its returns.
The Company reassesses whether or not it still controls an investee and if facts and circumstances indicate that
there are changes to one or more of the three elements of control listed above.
The financial statements of subsidiaries are included in the consolidated financial statements from the date that
control commences until the date that control ceases. The accounting policies of subsidiaries have been
changed when necessary to align them with the policies adopted by the Group.
Income and expenses of subsidiaries acquired or disposed of during the year are included or excluded in the
consolidated statement of profit or loss and other comprehensive income from the effective date of acquisition
and up to the effective date of disposal, as appropriate. Total comprehensive income of subsidiaries is attributed
to the owners’ of the Company and to the non-controlling interests even if this results in the non-controlling
interest having a deficit balance.
In the Company’s separate financial statements, investments in subsidiaries are carried at cost less any
impairment that has been recognised in profit or loss.
7
Dangote Cement Plc
Notes to the condensed consolidated and separate financial statements
For the period ended 30 September 2014
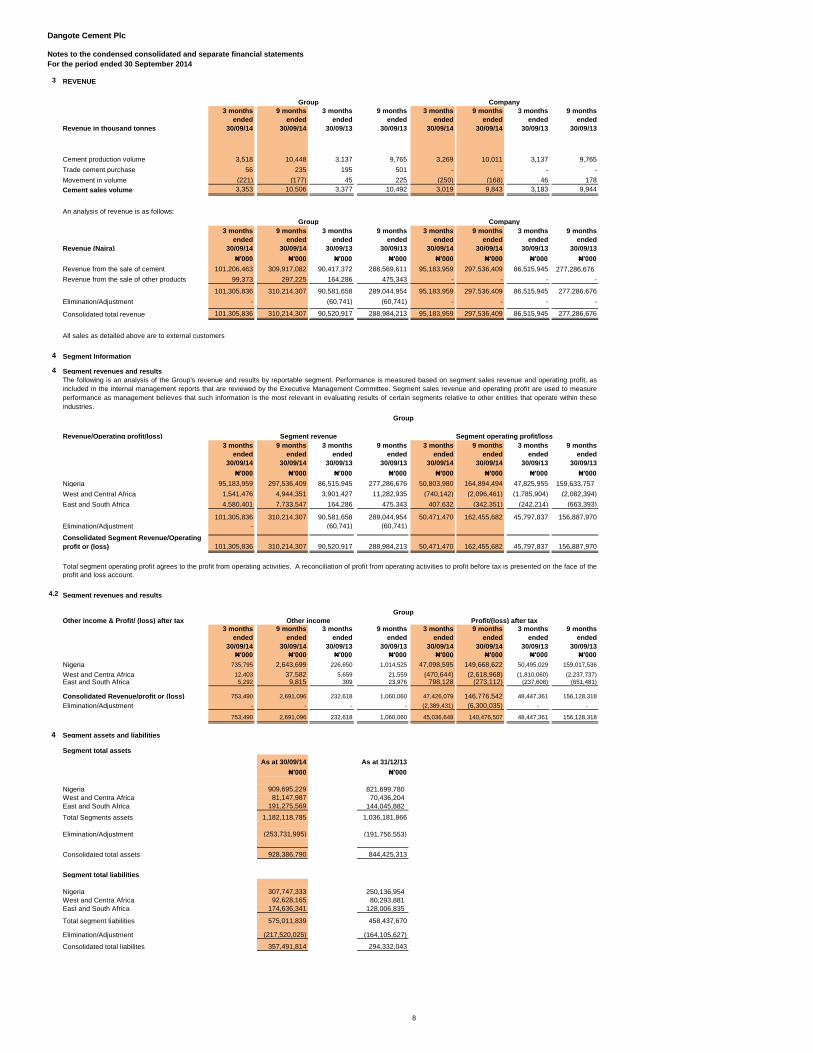
3 REVENUE
Revenue in thousand tonnes
3 months
ended
30/09/14
9 months
ended
30/09/14
3 months
ended
30/09/13
9 months
ended
30/09/13
3 months
ended
30/09/14
9 months
ended
30/09/14
3 months
ended
30/09/13
9 months
ended
30/09/13
Cement production volume 3,518 10,448 3,137 9,765 3,269 10,011 3,137 9,765
Trade cement purchase 56 235 195 501 - - - -
Movement in volume (221) (177) 45 225 (250) (168) 46 178
Cement sales volume 3,353 10,506 3,377 10,492 3,019 9,843 3,183 9,944
An analysis of revenue is as follows:
Revenue (Naira)
3 months
ended
30/09/14
9 months
ended
30/09/14
3 months
ended
30/09/13
9 months
ended
30/09/13
3 months
ended
30/09/14
9 months
ended
30/09/14
3 months
ended
30/09/13
9 months
ended
30/09/13
₦'000 ₦'000 ₦'000 ₦'000 ₦'000 ₦'000 ₦'000 ₦'000
Revenue from the sale of cement 101,206,463 309,917,082 90,417,372 288,569,611 95,183,959 297,536,409 86,515,945 277,286,676
Revenue from the sale of other products 99,373 297,225 164,286 475,343 - - - -
101,305,836 310,214,307 90,581,658 289,044,954 95,183,959 297,536,409 86,515,945 277,286,676
Elimination/Adjustment - (60,741) (60,741) - - - -
Consolidated total revenue 101,305,836 310,214,307 90,520,917 288,984,213 95,183,959 297,536,409 86,515,945 277,286,676
All sales as detailed above are to external customers
4 Segment Information
4 Segment revenues and results
Revenue/Operating profit/loss)
3 months
ended
30/09/14
9 months
ended
30/09/14
3 months
ended
30/09/13
9 months
ended
30/09/13
3 months
ended
30/09/14
9 months
ended
30/09/14
3 months
ended
30/09/13
9 months
ended
30/09/13
₦'000 ₦'000 ₦'000 ₦'000 ₦'000 ₦'000 ₦'000 ₦'000
Nigeria 95,183,959 297,536,409 86,515,945 277,286,676 50,803,980 164,894,494 47,825,955 159,633,757
West and Central Africa 1,541,476 4,944,351 3,901,427 11,282,935 (740,142) (2,096,461) (1,785,904) (2,082,394)
East and South Africa 4,580,401 7,733,547 164,286 475,343 407,632 (342,351) (242,214) (663,393)
101,305,836 310,214,307 90,581,658 289,044,954 50,471,470 162,455,682 45,797,837 156,887,970
Elimination/Adjustment - (60,741) (60,741)
Consolidated Segment Revenue/Operating
profit or (loss) 101,305,836 310,214,307 90,520,917 288,984,213 50,471,470 162,455,682 45,797,837 156,887,970
4.2 Segment revenues and results
Other income & Profit/ (loss) after tax
3 months
ended
30/09/14
9 months
ended
30/09/14
3 months
ended
30/09/13
9 months
ended
30/09/13
3 months
ended
30/09/14
9 months
ended
30/09/14
3 months
ended
30/09/13
9 months
ended
30/09/13
₦'000 ₦'000 ₦'000 ₦'000 ₦'000 ₦'000 ₦'000 ₦'000
Nigeria 735,795 2,643,699 226,650 1,014,525 47,098,595 149,668,622 50,495,029 159,017,536
West and Centra Africa 12,403 37,582 5,659 21,559 (470,644) (2,618,968) (1,810,060) (2,237,737)
East and South Africa 5,292 9,815 309 23,976 798,128 (273,112) (237,608) (651,481)
Consolidated Revenue/profit or (loss) 753,490 2,691,096 232,618 1,060,060 47,426,079 146,776,542 48,447,361 156,128,318
Elimination/Adjustment - - - - (2,389,431) (6,300,035) - -
753,490 2,691,096 232,618 1,060,060 45,036,648 140,476,507 48,447,361 156,128,318
4 Segment assets and liabilities
Segment total assets
As at 30/09/14 As at 31/12/13
₦'000 ₦'000
Nigeria 909,695,229 821,699,780
West and Centra Africa 81,147,987 70,436,204
East and South Africa 191,275,569 144,045,882
Total Segments assets 1,182,118,785 1,036,181,866
Elimination/Adjustment (253,731,995) (191,756,553)
Consolidated total assets 928,386,790 844,425,313
Segment total liabilities
Nigeria 307,747,333 250,136,954
West and Centra Africa 92,628,165 80,293,881
East and South Africa 174,636,341 128,006,835
Total segment liabilities 575,011,839 458,437,670
Elimination/Adjustment (217,520,025) (164,105,627)
Consolidated total liabilites 357,491,814 294,332,043
Total segment operating profit agrees to the profit from operating activities. A reconciliation of profit from operating activities to profit before tax is presented on the face of the
profit and loss account.
The following is an analysis of the Group's revenue and results by reportable segment. Performance is measured based on segment sales revenue and operating profit, as
included in the internal management reports that are reviewed by the Executive Management Committee. Segment sales revenue and operating profit are used to measure
performance as management believes that such information is the most relevant in evaluating results of certain segments relative to other entities that operate within these
industries.
CompanyGroup
Group
CompanyGroup
Segment operating profit/lossSegment revenue
Group
Profit/(loss) after taxOther income
8

Dangote Cement Plc
Notes to the condensed consolidated and separate financial statements
For the period ended 30 September 2014
5 Cost of sales
3 months
ended
30/09/14
9 months
ended
30/09/14
3 months
ended
30/09/13
9 months
ended
30/09/13
3 months
ended
30/09/14
9 months
ended
30/09/14
3 months
ended
30/09/13
9 months
ended
30/09/13
₦'000 ₦'000 ₦'000 ₦'000 ₦'000 ₦'000 ₦'000 ₦'000
Material Consumed 9,684,170 26,156,675 11,151,618 30,458,970 4,992,537 16,594,368 7,325,631 20,282,349
Fuel & Power Consumed 18,706,352 51,667,352 11,810,852 33,696,778 18,252,828 50,962,370 11,801,181 33,586,534
Royalty (refer (a) below) 133,493 344,250 77,485 370,100 133,493 344,250 77,485 370,100 Salaries and related staff costs 2,213,135 6,870,713 2,035,269 6,188,214 2,206,141 6,621,046 2,035,269 6,188,214
Depreciation & amortization 5,103,369 15,760,287 4,218,971 14,309,006 4,866,428 15,233,421 4,176,517 14,170,104
Other Production expenses 4,600,047 11,677,827 4,028,418 10,470,955 4,554,887 11,330,531 3,948,022 10,298,088
(Increase )/Decrease in Finished
Goods and work in process (3,475,765) (1,974,933) (5,036,813) (3,418,631) (3,220,143) (1,469,977) (4,970,804) (3,927,700)
36,964,801 110,502,171 28,285,800 92,075,392 31,786,171 99,616,009 24,393,301 80,967,689
(a)
6 Administrative expense
3 months
ended
30/09/14
9 months
ended
30/09/14
3 months
ended
30/09/13
9 months
ended
30/09/13
3 months
ended
30/09/14
9 months
ended
30/09/14
3 months
ended
30/09/13
9 months
ended
30/09/13
₦'000 ₦'000 ₦'000 ₦'000 ₦'000 ₦'000 ₦'000 ₦'000
Salaries and related staff costs 2,995,852 7,162,861 2,800,743 6,279,970 2,479,218 5,668,264 1,355,361 4,134,006
Corporate social responsibility 915,192 1,736,908 518,331 1,116,076 910,967 1,699,769 517,937 1,115,681
Management fee (refer (a) below) 241,700 926,247 335,722 627,055 241,700 926,247 335,722 627,055
Depreciation and Amortisation 1,578,045 2,620,999 1,172,738 2,354,310 968,541 1,725,216 509,192 1,622,549
Audit fees 35,910 150,910 52,120 150,289 32,871 134,250 49,963 138,797
Others 1,912,975 3,784,217 2,068,117 5,357,661 1,823,761 2,634,795 2,163,434 5,145,109
7,679,674 16,382,142 6,947,771 15,885,361 6,457,058 12,788,541 4,931,609 12,783,197
7 Selling and distribution
3 months
ended
30/09/14
9 months
ended
30/09/14
3 months
ended
30/09/13
9 months
ended
30/09/13
3 months
ended
30/09/14
9 months
ended
30/09/14
3 months
ended
30/09/13
9 months
ended
30/09/13
₦'000 ₦'000 ₦'000 ₦'000 ₦'000 ₦'000 ₦'000 ₦'000
Depreciation 2,764,109 8,406,855 2,571,493 7,526,098 2,763,415 8,357,552 2,522,058 7,475,866
Advertisement and promotion 753,230 2,753,614 931,171 2,422,477 745,099 2,235,923 801,987 2,193,717
Haulage expenses 3,426,043 12,404,940 6,219,464 15,246,975 3,364,031 12,287,589 6,267,684 15,246,975
6,943,382 23,565,409 9,722,128 25,195,550 6,872,545 22,881,064 9,591,729 24,916,558
8 Other income
3 months
ended
30/09/14
9 months
ended
30/09/14
3 months
ended
30/09/13
9 months
ended
30/09/13
3 months
ended
30/09/14
9 months
ended
30/09/14
3 months
ended
30/09/13
9 months
ended
30/09/13
₦'000 ₦'000 ₦'000 ₦'000 ₦'000 ₦'000 ₦'000 ₦'000
Insurance claims 7,375 78,313 (207) 155,599 7,375 78,313 (207) 155,599
Government grant 136,735 414,842 153,252 461,384 134,635 410,985 153,252 461,384
Sundry income 609,381 2,197,942 79,573 443,077 593,785 2,154,401 73,604 397,542
753,491 2,691,097 232,618 1,060,060 735,795 2,643,699 226,649 1,014,525
Royalty payable is charged based on volume of extraction made during the year. This is in accordance with the agreement with the Federal Ministry of Mines
and Steel Development.
Group Company
CompanyGroup
(a) The management fee is charged by Dangote Industries Limited for management and corporate services provided to Gboko plant. It is based on sales on the
respective units net of discounts, rebates and applicable concessions provided to customers.
Group Company
CompanyGroup
9
Dangote Cement Plc
Notes to the condensed consolidated and separate financial statements
For the period ended 30 September 2014
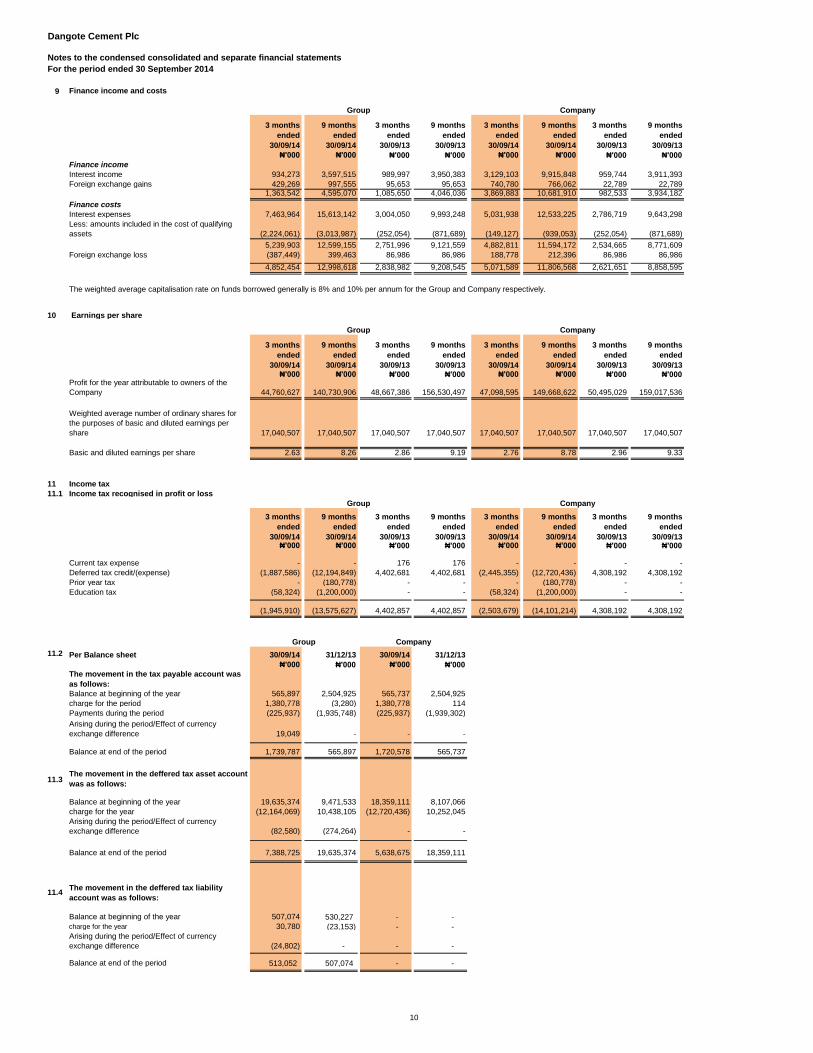
9 Finance income and costs
3 months
ended
30/09/14
9 months
ended
30/09/14
3 months
ended
30/09/13
9 months
ended
30/09/13
3 months
ended
30/09/14
9 months
ended
30/09/14
3 months
ended
30/09/13
9 months
ended
30/09/13
₦'000 ₦'000 ₦'000 ₦'000 ₦'000 ₦'000 ₦'000 ₦'000
Finance income
Interest income 934,273 3,597,515 989,997 3,950,383 3,129,103 9,915,848 959,744 3,911,393
Foreign exchange gains 429,269 997,555 95,653 95,653 740,780 766,062 22,789 22,789 1,363,542 4,595,070 1,085,650 4,046,036 3,869,883 10,681,910 982,533 3,934,182
Finance costs
Interest expenses 7,463,964 15,613,142 3,004,050 9,993,248 5,031,938 12,533,225 2,786,719 9,643,298
Less: amounts included in the cost of qualifying
assets (2,224,061) (3,013,987) (252,054) (871,689) (149,127) (939,053) (252,054) (871,689)
5,239,903 12,599,155 2,751,996 9,121,559 4,882,811 11,594,172 2,534,665 8,771,609
Foreign exchange loss (387,449) 399,463 86,986 86,986 188,778 212,396 86,986 86,986 4,852,454 12,998,618 2,838,982 9,208,545 5,071,589 11,806,568 2,621,651 8,858,595
10 Earnings per share
3 months
ended
30/09/14
9 months
ended
30/09/14
3 months
ended
30/09/13
9 months
ended
30/09/13
3 months
ended
30/09/14
9 months
ended
30/09/14
3 months
ended
30/09/13
9 months
ended
30/09/13₦'000 ₦'000 ₦'000 ₦'000 ₦'000 ₦'000 ₦'000 ₦'000
Profit for the year attributable to owners of the
Company 44,760,627 140,730,906 48,667,386 156,530,497 47,098,595 149,668,622 50,495,029 159,017,536
Weighted average number of ordinary shares for
the purposes of basic and diluted earnings per
share 17,040,507 17,040,507 17,040,507 17,040,507 17,040,507 17,040,507 17,040,507 17,040,507
Basic and diluted earnings per share 2.63 8.26 2.86 9.19 2.76 8.78 2.96 9.33
11 Income tax
11.1 Income tax recognised in profit or loss
3 months
ended
30/09/14
9 months
ended
30/09/14
3 months
ended
30/09/13
9 months
ended
30/09/13
3 months
ended
30/09/14
9 months
ended
30/09/14
3 months
ended
30/09/13
9 months
ended
30/09/13₦'000 ₦'000 ₦'000 ₦'000 ₦'000 ₦'000 ₦'000 ₦'000
Current tax expense - - 176 176 - - - -
Deferred tax credit/(expense) (1,887,586) (12,194,849) 4,402,681 4,402,681 (2,445,355) (12,720,436) 4,308,192 4,308,192
Prior year tax - (180,778) - - - (180,778) - -
Education tax (58,324) (1,200,000) - - (58,324) (1,200,000) - -
(1,945,910) (13,575,627) 4,402,857 4,402,857 (2,503,679) (14,101,214) 4,308,192 4,308,192
11.2 Per Balance sheet 30/09/14 31/12/13 30/09/14 31/12/13
₦'000 ₦'000 ₦'000 ₦'000
The movement in the tax payable account was
as follows:
Balance at beginning of the year 565,897 2,504,925 565,737 2,504,925
charge for the period 1,380,778 (3,280) 1,380,778 114
Payments during the period (225,937) (1,935,748) (225,937) (1,939,302)
Arising during the period/Effect of currency
exchange difference 19,049 - - -
Balance at end of the period 1,739,787 565,897 1,720,578 565,737
11.3The movement in the deffered tax asset account
was as follows:
Balance at beginning of the year 19,635,374 9,471,533 18,359,111 8,107,066
charge for the year (12,164,069) 10,438,105 (12,720,436) 10,252,045
Arising during the period/Effect of currency
exchange difference (82,580) (274,264) - -
Balance at end of the period 7,388,725 19,635,374 5,638,675 18,359,111
11.4The movement in the deffered tax liability
account was as follows:
Balance at beginning of the year 507,074 530,227 - -
charge for the year 30,780 (23,153) - -
Arising during the period/Effect of currency
exchange difference (24,802) - - -
Balance at end of the period 513,052 507,074 - -
Group Company
CompanyGroup
The weighted average capitalisation rate on funds borrowed generally is 8% and 10% per annum for the Group and Company respectively.
Group Company
Group Company
10
Dangote Cement Plc
Notes to the condensed consolidated and separate financial statements
For the period ended 30 September 2014
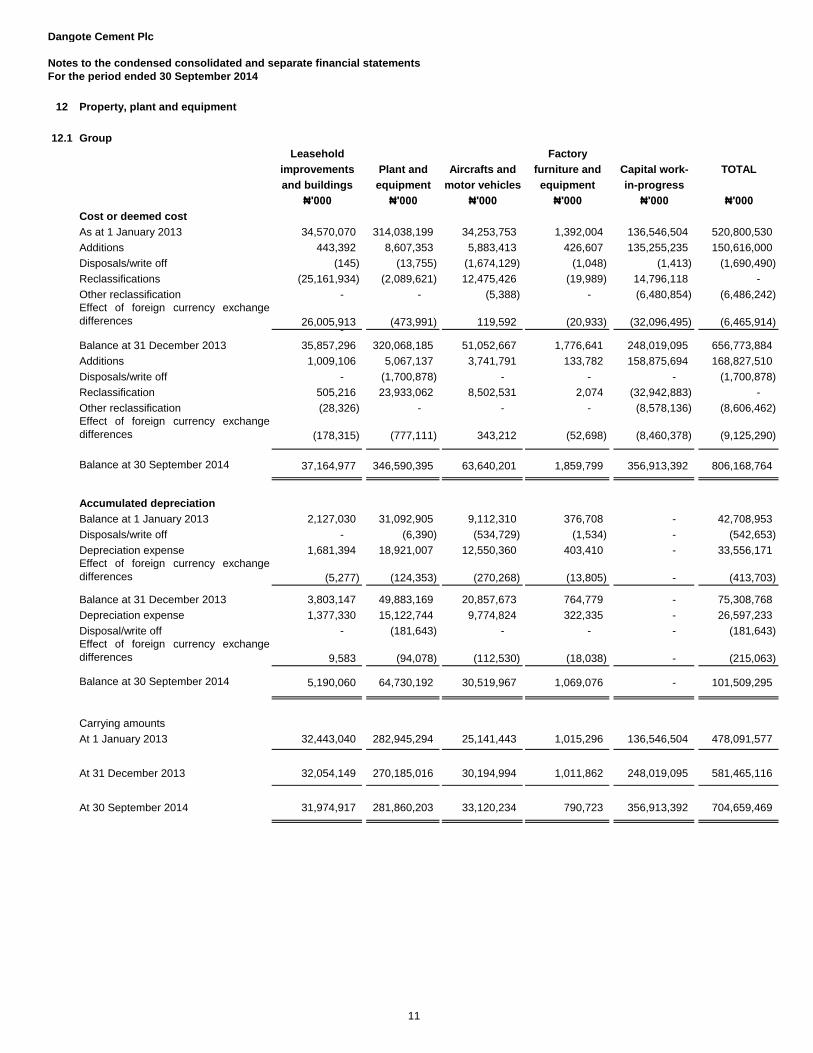
12 Property, plant and equipment
12.1 Group
Leasehold Factory
improvements Plant and Aircrafts and furniture and Capital work- TOTAL
and buildings equipment motor vehicles equipment in-progress
₦'000 ₦'000 ₦'000 ₦'000 ₦'000 ₦'000
Cost or deemed cost
As at 1 January 2013 34,570,070 314,038,199 34,253,753 1,392,004 136,546,504 520,800,530
Additions 443,392 8,607,353 5,883,413 426,607 135,255,235 150,616,000
Disposals/write off (145) (13,755) (1,674,129) (1,048) (1,413) (1,690,490)
Reclassifications (25,161,934) (2,089,621) 12,475,426 (19,989) 14,796,118 -
Other reclassification - - (5,388) - (6,480,854) (6,486,242)
Effect of foreign currency exchange
differences 26,005,913 (473,991) 119,592 (20,933) (32,096,495) (6,465,914) -
Balance at 31 December 2013 35,857,296 320,068,185 51,052,667 1,776,641 248,019,095 656,773,884
Additions 1,009,106 5,067,137 3,741,791 133,782 158,875,694 168,827,510
Disposals/write off - (1,700,878) - - - (1,700,878)
Reclassification 505,216 23,933,062 8,502,531 2,074 (32,942,883) -
Other reclassification (28,326) - - - (8,578,136) (8,606,462)
Effect of foreign currency exchange
differences (178,315) (777,111) 343,212 (52,698) (8,460,378) (9,125,290)
Balance at 30 September 2014 37,164,977 346,590,395 63,640,201 1,859,799 356,913,392 806,168,764
Accumulated depreciation
Balance at 1 January 2013 2,127,030 31,092,905 9,112,310 376,708 - 42,708,953
Disposals/write off - (6,390) (534,729) (1,534) - (542,653)
Depreciation expense 1,681,394 18,921,007 12,550,360 403,410 - 33,556,171
Effect of foreign currency exchange
differences (5,277) (124,353) (270,268) (13,805) - (413,703)
Balance at 31 December 2013 3,803,147 49,883,169 20,857,673 764,779 - 75,308,768
Depreciation expense 1,377,330 15,122,744 9,774,824 322,335 - 26,597,233
Disposal/write off - (181,643) - - - (181,643)
Effect of foreign currency exchange
differences 9,583 (94,078) (112,530) (18,038) - (215,063)
Balance at 30 September 2014 5,190,060 64,730,192 30,519,967 1,069,076 - 101,509,295
Carrying amounts
At 1 January 2013 32,443,040 282,945,294 25,141,443 1,015,296 136,546,504 478,091,577
At 31 December 2013 32,054,149 270,185,016 30,194,994 1,011,862 248,019,095 581,465,116
At 30 September 2014 31,974,917 281,860,203 33,120,234 790,723 356,913,392 704,659,469
11
Dangote Cement Plc
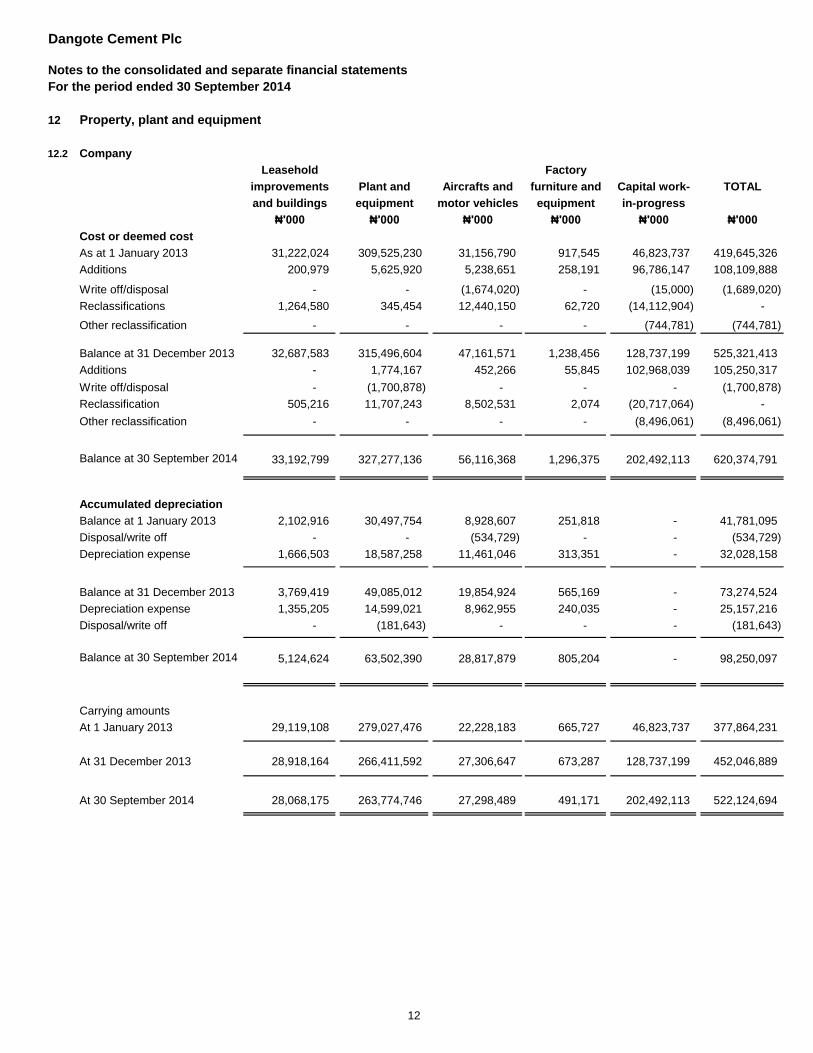
Notes to the consolidated and separate financial statements
For the period ended 30 September 2014
12 Property, plant and equipment
12.2 Company
Leasehold Factory
improvements Plant and Aircrafts and furniture and Capital work- TOTAL
and buildings equipment motor vehicles equipment in-progress
₦'000 ₦'000 ₦'000 ₦'000 ₦'000 ₦'000
Cost or deemed cost
As at 1 January 2013 31,222,024 309,525,230 31,156,790 917,545 46,823,737 419,645,326
Additions 200,979 5,625,920 5,238,651 258,191 96,786,147 108,109,888
Write off/disposal - - (1,674,020) - (15,000) (1,689,020)
Reclassifications 1,264,580 345,454 12,440,150 62,720 (14,112,904) -
Other reclassification - - - - (744,781) (744,781)
Balance at 31 December 2013 32,687,583 315,496,604 47,161,571 1,238,456 128,737,199 525,321,413
Additions - 1,774,167 452,266 55,845 102,968,039 105,250,317
Write off/disposal - (1,700,878) - - - (1,700,878)
Reclassification 505,216 11,707,243 8,502,531 2,074 (20,717,064) -
Other reclassification - - - - (8,496,061) (8,496,061)
Balance at 30 September 2014 33,192,799 327,277,136 56,116,368 1,296,375 202,492,113 620,374,791
Accumulated depreciation
Balance at 1 January 2013 2,102,916 30,497,754 8,928,607 251,818 - 41,781,095
Disposal/write off - - (534,729) - - (534,729)
Depreciation expense 1,666,503 18,587,258 11,461,046 313,351 - 32,028,158 - -
Balance at 31 December 2013 3,769,419 49,085,012 19,854,924 565,169 - 73,274,524
Depreciation expense 1,355,205 14,599,021 8,962,955 240,035 - 25,157,216
Disposal/write off - (181,643) - - - (181,643)
Balance at 30 September 2014 5,124,624 63,502,390 28,817,879 805,204 - 98,250,097
Carrying amounts
At 1 January 2013 29,119,108 279,027,476 22,228,183 665,727 46,823,737 377,864,231
At 31 December 2013 28,918,164 266,411,592 27,306,647 673,287 128,737,199 452,046,889
At 30 September 2014 28,068,175 263,774,746 27,298,489 491,171 202,492,113 522,124,694
12

Dangote Cement Plc
Notes to the condensed consolidated and separate financial statements
For the period ended 30 September 2014
13
13.1 Group
Computer
software
Exploration
assets Total
₦'000 ₦'000 ₦'000
Cost
Balance at 1 January 2013 442,116 1,648,062 2,090,178
Additions 308,157 134,055 442,212
Other reclassifications 585,749 - 585,749
Adjustment (1,867) - (1,867)
Effect of foreign currency exchange differences (35,759) (287,027) (322,786)
Balance at 31 December 2013 1,298,396 1,495,090 2,793,486
Additions 534,585 498,795 1,033,380
Write off/disposal - (136,603) (136,603)
Effect of foreign currency exchange difference (12,298) (68,868) (81,166)
Balance at 30 September 2014 1,820,683 1,788,414 3,609,097
Accumulated amortisation
Balance at 1 January 2013 363,444 - 363,444
Amortisation expense 149,335 - 149,335
Adjustment (813) (813)
Effect of foreign currency exchange differences (24,650) - (24,650)
Balance at 31 December 2013 487,316 - 487,316
Amortisation expense 179,660 11,248 190,908
Effect of foreign currency exchange difference (17,078) (431) (17,509)
Balance at 30 September 2014 649,898 10,817 660,715
Carrying amounts
At 1 January 2013 78,672 1,648,062 1,726,734
At 31 December 2013 811,080 1,495,090 2,306,170
At 30 September 2014 1,170,785 1,777,597 2,948,382
Intangible assets
13

Dangote Cement Plc
Notes to the condensed consolidated and separate financial statements
For the period ended 30 September 2014
13
13.2 Company
Computer
software
Other
intangibles Total
₦'000 ₦'000 ₦'000
Cost
Balance at 1 January 2013 225,604 - 225,604.00
Additions 222,590 - 222,590.00
Other reclassification 585,749 585,749.00
Balance at 31 December 2013 1,033,943 - 1,033,943
Additions 243,893 - 243,893
Balance at 30 September 2014 1,277,836 - 1,277,836
Accumulated amortisation
Balance at 1 January 2013 224,756 - 224,756.00
Amortisation expense 136,997 - 136,997.00
Balance at 31 December 2013 361,753 - 361,753
Amortisation expense 158,975 - 158,975
Balance at 30 September 2014 520,728 - 520,728
Carrying amounts
At 1 January 2013 848 - 848
At 31 December 2013 672,190 - 672,190
At 30 September 2014 757,108 - 757,108
Intangible assets
14
Dangote Cement Plc
Notes to the condensed consolidated and separate financial statements
For the period ended 30 September 2014
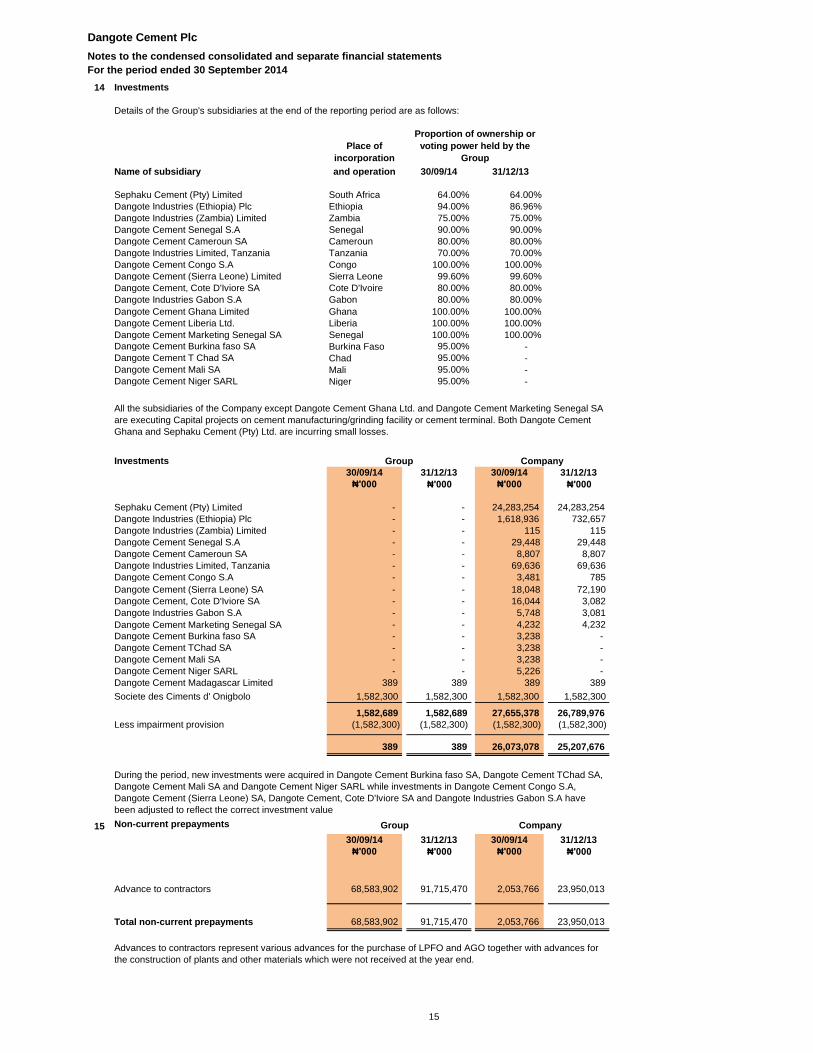
14 Investments
Details of the Group's subsidiaries at the end of the reporting period are as follows:
Name of subsidiary and operation 30/09/14 31/12/13
Sephaku Cement (Pty) Limited South Africa 64.00% 64.00%
Dangote Industries (Ethiopia) Plc Ethiopia 94.00% 86.96%
Dangote Industries (Zambia) Limited Zambia 75.00% 75.00%
Dangote Cement Senegal S.A Senegal 90.00% 90.00%
Dangote Cement Cameroun SA Cameroun 80.00% 80.00%
Dangote Industries Limited, Tanzania Tanzania 70.00% 70.00%
Dangote Cement Congo S.A Congo 100.00% 100.00%
Dangote Cement (Sierra Leone) Limited Sierra Leone 99.60% 99.60%
Dangote Cement, Cote D'Iviore SA Cote D'Ivoire 80.00% 80.00%
Dangote Industries Gabon S.A Gabon 80.00% 80.00%
Dangote Cement Ghana Limited Ghana 100.00% 100.00%
Dangote Cement Liberia Ltd. Liberia 100.00% 100.00%
Dangote Cement Marketing Senegal SA Senegal 100.00% 100.00%
Dangote Cement Burkina faso SA Burkina Faso 95.00% -
Dangote Cement T Chad SA Chad 95.00% -
Dangote Cement Mali SA Mali 95.00% -
Dangote Cement Niger SARL Niger 95.00% -
Investments
30/09/14 31/12/13 30/09/14 31/12/13
₦'000 ₦'000 ₦'000 ₦'000
Sephaku Cement (Pty) Limited - - 24,283,254 24,283,254
Dangote Industries (Ethiopia) Plc - - 1,618,936 732,657
Dangote Industries (Zambia) Limited - - 115 115
Dangote Cement Senegal S.A - - 29,448 29,448
Dangote Cement Cameroun SA - - 8,807 8,807
Dangote Industries Limited, Tanzania - - 69,636 69,636
Dangote Cement Congo S.A - - 3,481 785
Dangote Cement (Sierra Leone) SA - - 18,048 72,190
Dangote Cement, Cote D'Iviore SA - - 16,044 3,082
Dangote Industries Gabon S.A - - 5,748 3,081
Dangote Cement Marketing Senegal SA - - 4,232 4,232
Dangote Cement Burkina faso SA - - 3,238 -
Dangote Cement TChad SA - - 3,238 -
Dangote Cement Mali SA - - 3,238 -
Dangote Cement Niger SARL - - 5,226 -
Dangote Cement Madagascar Limited 389 389 389 389
Societe des Ciments d' Onigbolo 1,582,300 1,582,300 1,582,300 1,582,300
1,582,689 1,582,689 27,655,378 26,789,976
Less impairment provision (1,582,300) (1,582,300) (1,582,300) (1,582,300)
389 389 26,073,078 25,207,676
15 Non-current prepayments
30/09/14 31/12/13 30/09/14 31/12/13
₦'000 ₦'000 ₦'000 ₦'000
Advance to contractors 68,583,902 91,715,470 2,053,766 23,950,013
Total non-current prepayments 68,583,902 91,715,470 2,053,766 23,950,013
Advances to contractors represent various advances for the purchase of LPFO and AGO together with advances for
the construction of plants and other materials which were not received at the year end.
CompanyGroup
Place of
incorporation
Company
Proportion of ownership or
voting power held by the
Group
Group
All the subsidiaries of the Company except Dangote Cement Ghana Ltd. and Dangote Cement Marketing Senegal SA
are executing Capital projects on cement manufacturing/grinding facility or cement terminal. Both Dangote Cement
Ghana and Sephaku Cement (Pty) Ltd. are incurring small losses.
During the period, new investments were acquired in Dangote Cement Burkina faso SA, Dangote Cement TChad SA,
Dangote Cement Mali SA and Dangote Cement Niger SARL while investments in Dangote Cement Congo S.A,
Dangote Cement (Sierra Leone) SA, Dangote Cement, Cote D'Iviore SA and Dangote Industries Gabon S.A have
been adjusted to reflect the correct investment value
15

Dangote Cement Plc
Notes to the condensed consolidated and separate financial statements
For the period ended 30 September 2014
16 Other receivables
30/09/14 31/12/13 30/09/14 31/12/13
₦'000 ₦'000 ₦'000 ₦'000
Non Current
Entities controlled by the company 222,177,284 164,524,881 - -
17 Inventories
30/09/14 31/12/13 30/09/14 31/12/13
₦'000 ₦'000 ₦'000 ₦'000
Finished goods 3,446,838 3,022,790 3,355,718 2,539,486
Work-in-progress 3,256,166 1,705,281 2,267,049 1,613,305
Raw materials 2,724,613 3,002,453 1,807,660 1,614,985
Packaging materials 1,532,563 1,221,501 1,163,828 1,120,276
Consumables 4,140,493 3,968,817 4,060,815 3,906,947
Fuel 7,964,465 3,717,367 7,897,999 3,680,771
Spare parts 14,425,457 9,434,740 13,969,792 8,988,935
Goods-in-transit 1,403,773 1,594,339 813,876 112,041 -
38,894,368 27,667,288 35,336,737 23,576,746
18 Trade and other recievables
30/09/14 31/12/13 30/09/14 31/12/13
₦'000 ₦'000 ₦'000 ₦'000
Trade receivables 6,352,632 9,386,389 3,609,054 9,093,143
Impairment allowance on trade receiveables (2,637,873) (2,716,140) (2,632,625) (2,632,625)
3,714,759 6,670,249 976,429 6,460,518
Deposits for supplies 3,227,730 2,244,611 2,987,190 1,222,038
Staff loans and advances 791,100 640,723 757,416 602,606
Other receiveables 4,621,640 1,932,508 2,451,840 835,678
12,355,229 11,488,091 7,172,875 9,120,840
30/09/14 31/12/13 30/09/14 31/12/13
₦'000 ₦'000 ₦'000 ₦'000
19 Prepaid expenses and other current assets
Advance to contractors 33,991,628 23,301,601 32,979,239 20,941,803
Deposit for import 19,071,427 12,616,503 19,071,425 12,602,408
Rent and insurance 1,274,437 1,095,512 1,143,662 1,008,243
Total current prepayments 54,337,492 37,013,616 53,194,326 34,552,454
Related party transactions - current
Parent company - - - -
Entities controlled by the parent company 3,150,778 2,158,775 3,150,778 1,772,677
Affiliates and associates of parent company 473,336 473,441 473,336 473,441
Total current receivables from related parties 3,624,114 2,632,216 3,624,114 2,246,118
Prepaid expenses and other current assets 57,961,606 39,645,832 56,818,440 36,798,572
Company
Amount owed to related
parties
Group
Company Group
Group Company
Amount owed by related
parties
The balances represent expenditure on projects in African countries. As these are not likely to be
repaid within the next twelve months, they have been reclassified under non-current assets.
Company
16
Dangote Cement Plc
Notes to the condensed consolidated and separate financial statements
For the period ended 30 September 2014
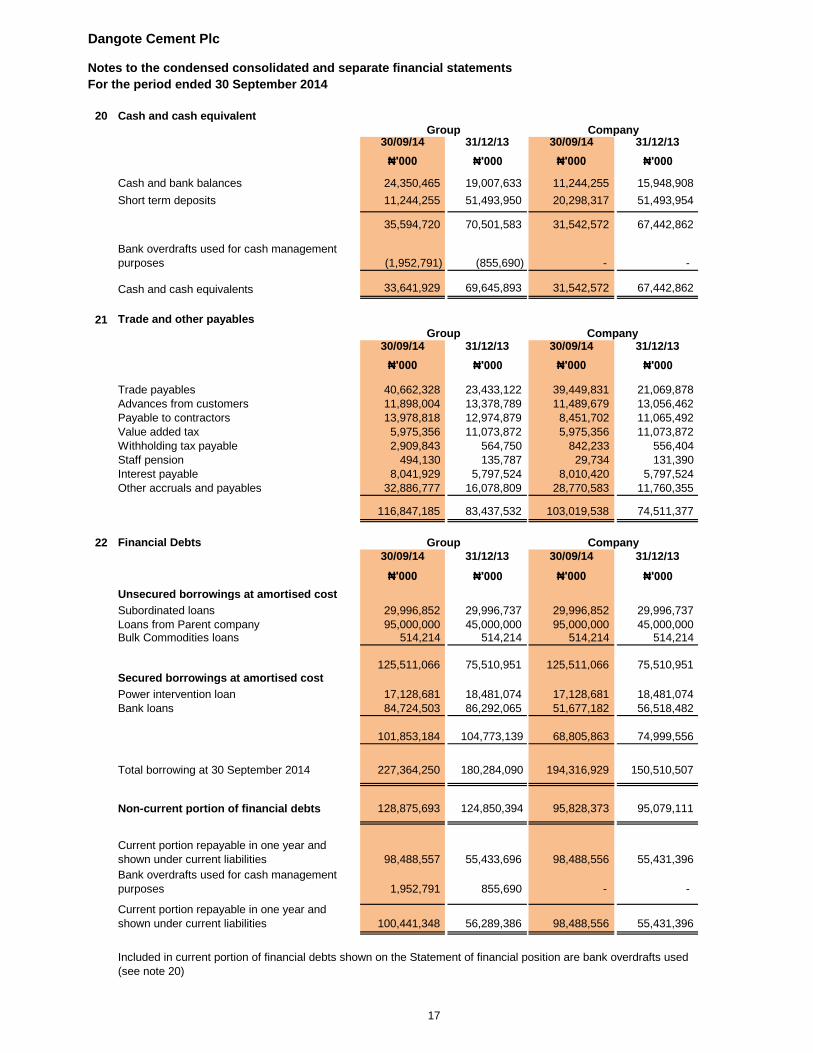
20 Cash and cash equivalent
30/09/14 31/12/13 30/09/14 31/12/13
₦'000 ₦'000 ₦'000 ₦'000
Cash and bank balances 24,350,465 19,007,633 11,244,255 15,948,908
Short term deposits 11,244,255 51,493,950 20,298,317 51,493,954
35,594,720 70,501,583 31,542,572 67,442,862
Bank overdrafts used for cash management
purposes (1,952,791) (855,690) - -
Cash and cash equivalents 33,641,929 69,645,893 31,542,572 67,442,862
21 Trade and other payables
30/09/14 31/12/13 30/09/14 31/12/13
₦'000 ₦'000 ₦'000 ₦'000
Trade payables 40,662,328 23,433,122 39,449,831 21,069,878
Advances from customers 11,898,004 13,378,789 11,489,679 13,056,462
Payable to contractors 13,978,818 12,974,879 8,451,702 11,065,492
Value added tax 5,975,356 11,073,872 5,975,356 11,073,872
Withholding tax payable 2,909,843 564,750 842,233 556,404
Staff pension 494,130 135,787 29,734 131,390
Interest payable 8,041,929 5,797,524 8,010,420 5,797,524
Other accruals and payables 32,886,777 16,078,809 28,770,583 11,760,355
116,847,185 83,437,532 103,019,538 74,511,377
22 Financial Debts
30/09/14 31/12/13 30/09/14 31/12/13
₦'000 ₦'000 ₦'000 ₦'000
Unsecured borrowings at amortised cost
Subordinated loans 29,996,852 29,996,737 29,996,852 29,996,737
Loans from Parent company 95,000,000 45,000,000 95,000,000 45,000,000 Bulk Commodities loans 514,214 514,214 514,214 514,214
125,511,066 75,510,951 125,511,066 75,510,951 Secured borrowings at amortised cost
Power intervention loan 17,128,681 18,481,074 17,128,681 18,481,074
Bank loans 84,724,503 86,292,065 51,677,182 56,518,482
101,853,184 104,773,139 68,805,863 74,999,556
Total borrowing at 30 September 2014 227,364,250 180,284,090 194,316,929 150,510,507
Non-current portion of financial debts 128,875,693 124,850,394 95,828,373 95,079,111
Current portion repayable in one year and
shown under current liabilities 98,488,557 55,433,696 98,488,556 55,431,396
Bank overdrafts used for cash management
purposes 1,952,791 855,690 - -
Current portion repayable in one year and
shown under current liabilities 100,441,348 56,289,386 98,488,556 55,431,396
Included in current portion of financial debts shown on the Statement of financial position are bank overdrafts used
(see note 20)
CompanyGroup
Group Company
Group Company
17
Dangote Cement Plc
Notes to the condensed consolidated and separate financial statements
For the period ended 30 September 2014
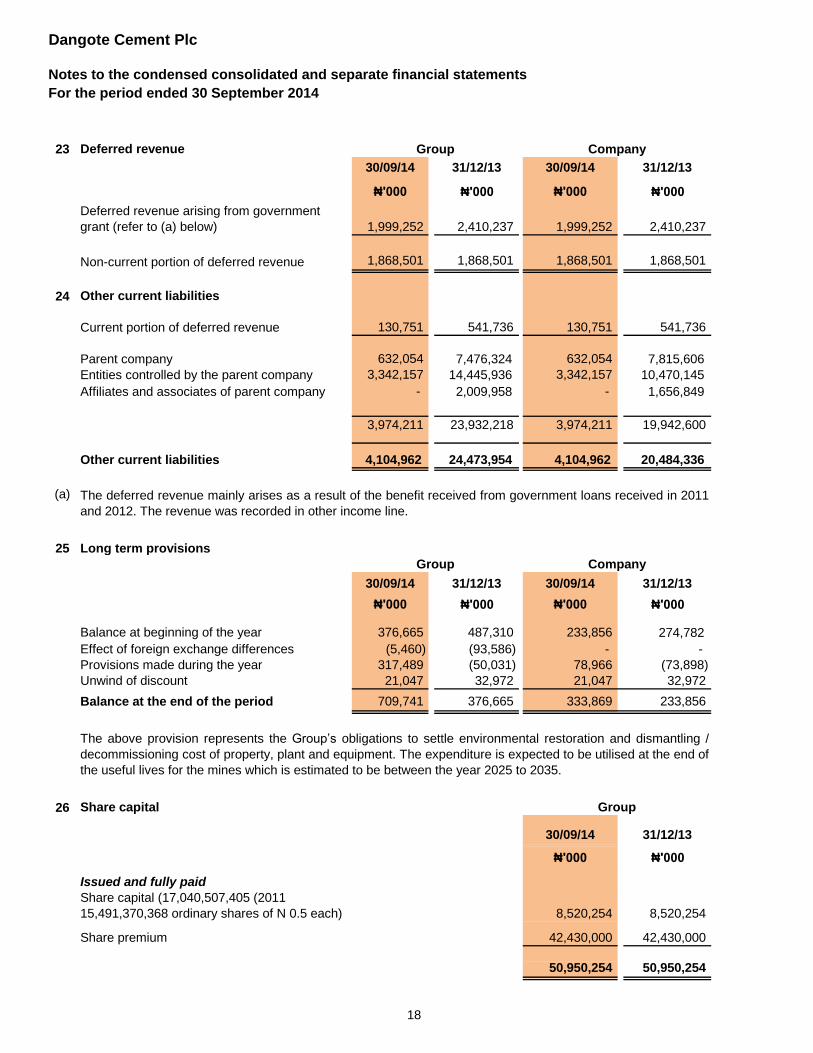
23 Deferred revenue
30/09/14 31/12/13 30/09/14 31/12/13
₦'000 ₦'000 ₦'000 ₦'000
Deferred revenue arising from government
grant (refer to (a) below) 1,999,252 2,410,237 1,999,252 2,410,237
Non-current portion of deferred revenue 1,868,501 1,868,501 1,868,501 1,868,501
24 Other current liabilities
Current portion of deferred revenue 130,751 541,736 130,751 541,736
Parent company 632,054 7,476,324 632,054 7,815,606
Entities controlled by the parent company 3,342,157 14,445,936 3,342,157 10,470,145
Affiliates and associates of parent company - 2,009,958 - 1,656,849
3,974,211 23,932,218 3,974,211 19,942,600
Other current liabilities 4,104,962 24,473,954 4,104,962 20,484,336
(a)
25 Long term provisions
30/09/14 31/12/13 30/09/14 31/12/13
₦'000 ₦'000 ₦'000 ₦'000
Balance at beginning of the year 376,665 487,310 233,856 274,782
Effect of foreign exchange differences (5,460) (93,586) - -
Provisions made during the year 317,489 (50,031) 78,966 (73,898)
Unwind of discount 21,047 32,972 21,047 32,972
Balance at the end of the period 709,741 376,665 333,869 233,856
26 Share capital
30/09/14 31/12/13N'000 N'000
₦'000 ₦'000
Issued and fully paid
Share capital (17,040,507,405 (2011
15,491,370,368 ordinary shares of N 0.5 each) 8,520,254 8,520,254
Share premium 42,430,000 42,430,000
50,950,254 50,950,254
The deferred revenue mainly arises as a result of the benefit received from government loans received in 2011
and 2012. The revenue was recorded in other income line.
Group Company
Group
Group Company
The above provision represents the Group’s obligations to settle environmental restoration and dismantling /
decommissioning cost of property, plant and equipment. The expenditure is expected to be utilised at the end of
the useful lives for the mines which is estimated to be between the year 2025 to 2035.
18