Dairy Situation and Outlook Geoff Benson Dept. of Agricultural & Resource Economics NC State...
56
Dairy Situation and Outlook Geoff Benson Dept. of Agricultural & Resource Economics NC State University Southern Agricultural Outlook Conference Atlanta, September 24-26, 2007
-
date post
22-Dec-2015 -
Category
Documents
-
view
217 -
download
1
Transcript of Dairy Situation and Outlook Geoff Benson Dept. of Agricultural & Resource Economics NC State...

Dairy Situation and Outlook
Geoff BensonDept. of Agricultural & Resource EconomicsNC State University
Southern Agricultural Outlook ConferenceAtlanta, September 24-26, 2007

22
Topics National Short-term Situation and
OutlookNational dairy policiesDemandSupply
Regional Outlook Summary and Conclusions Implications

3
National Dairy Programs
3

4
Dairy Programs
Price support program Milk Income Loss Contract –
MILC Tariff Rate Quotas on imports Federal Orders Cooperatives Working Together
– CWT
4

5
Price Support Program Authorized until Dec 31, 2007 Government acts as a buyer of last resort
for cheese, butter and nonfat dry milk Support price is $9.90/cwt, basically
unchanged since 1990 Current product prices are:
Cheese at $1.1314/lb -- blocksButter at $1.05/lb -- bulkNFDM at $0.80/lb -- unfortified
Indirectly supports farm prices
5

6
Price Support Program Important historically, now provides a low
safety net Since 1989, Government purchases have
been seasonal & relatively smallButter in the early 1990s, NFDM more recently
Farm prices have been market driven and have been very volatile Seasonality in production and sales Inelastic supply & demand Market psychology
6

77
1/75 75 75 75 75 75 75 75 75 75 75 751/76 76 76 76 76 76 76 76 76 76 76 761/77 77 77 77 77 77 77 77 77 77 77 771/78 78 78 78 78 78 78 78 78 78 78 781/79 79 79 79 79 79 79 79 79 79 79 791/80 80 80 80 80 80 80 80 80 80 80 801/81 81 81 81 81 81 81 81 81 81 81 811/82 82 82 82 82 82 82 82 82 82 82 821/83 83 83 83 83 83 83 83 83 83 83 8319841/84 84 84 84 84 84 84 84 84 84 841/85 85 85 85 85 85 85 85 85 85 85 851/86 86 86 86 86 86 86 86 86 86 86 861/87 87 87 87 87 87 87 87 87 87 87 871/88 88 88 88 88 88 88 88 88 88 88 881/89 89 89 89 89 89 89 89 89 89 89 891/9090909090909090909090901/91 91 91 91 91 91 91 91 91 91 91 911/92 92 92 92 92 92 92 92 92 92 92 921/93 93 93 93 93 93 93 93 93 93 93 931/94 94 94 94 94 94 94 94 94 94 94 941/95 95 95 95 95 95 95 95 95 95 95 951/96 96 96 96 96 96 96 96 96 96 96 961/97 97 97 97 97 97 97 97 97 97 97 971/98 98 98 98 98 98 98 98 98 98 98 981/99 99 99 99 99 99 99 99 99 99 99 991/00 00 00 00 00 00 00 00 00 00 00 001/01 01 01 01 01 01 01 01 01 01 01 011/02 02 02 02 02 02 02 02 02 02 02 021/03 03 03 03 03 03 03 03 03 03 03 031/04 04 04 04 04 04 04 04 04 04 04 041/05 05 05 05 05 05 05 05 05 05 05 051/06 06 06 06 06 06 06 06 06 06 06 061/07 07 07 07 07 07 07 070.00
2.00
4.00
6.00
8.00
10.00
12.00
14.00
16.00
18.00
20.00
22.00
Federal Dairy Support and Class III (Cheese) Milk Prices, Monthly, 1975-2007
Dairy Support
Class III Milk
$/1
00
lb

8
Milk Income Loss Contract MILC
A countercyclical income support program passed as part of the 2002 Farm Bill; sunset date Sept. 30, 2005
The Agricultural Reconciliation Act of 2005 reauthorized the program through August 31, 2007 (MILC-X)
MILK-X extended one month as part of an Iraq/Katrina/Veterans funding bill. As a consequence, MILC is included in the 2007 Farm Bill baseline
8

9
MILC-X Program Trigger and cap
National target price or trigger for payments = $16.94/cwt Class I price in the Boston zone, Northeast federal order
Payments are limited to 2.4 mil. lb. of milk per operation per fiscal year ~ 125 cows @19,000 lb/cow/year
MILC payment rate was 45% when the Class I price was below $16.94
MILK-X payment rate is 34% of the difference
9

10
MILC Impacts….US All Milk Price
MILC Payment
$/cwt
MILC as % of All
Milk
FY 2002* $12.72 $1.08 9.0%
FY 2003 $11.91 $1.46 12.2%
FY 2004 $15.64 $0.22 1.4%
FY 2005 $15.37 $0.00 0.0%
FY 2006 $13.24 $0.50 3.8%
10
* 10 Months

1111

1212
Federal Orders Classify milk based on use
Class I = Fluid milkClass II = “Soft” productsClass III = CheeseClass IV = Butter & NFDM
Set monthly minimum class prices based on wholesale prices for cheese, butter and non-fat solids, yield factors, make allowances = Derived demand for milk
Establish pooling rules determining which handlers and producers are in an order
Audit milk handlers

13
Federal Orders 7 orders pay on components – most milk
is used for manufacturing in these FOs 4 high fluid use order markets pay on a
per 100 lb. of milk basis, including the Appalachian and Southeast Orders
Requested changes:Larger “make allowances”Higher Class I & II pricesModifications to Class III & IV formulas Increased transportation credits and new
incentives to move milk and reduce costs in FO 5 and 7

14
CWT Program Dairy coop members of the National Milk
Producers Federation operate a voluntary supply management program to cut production and boost prices
Funded by an assessment Supported by coops with ~70% of milk
1. Herd Reduction – 4 “rounds” with ~ 200,000 cows removed
2. Production Reduction – 1 round3. Export subsidies, mainly cheese
FAPRI estimated impact on milk prices of $2 bil. through first 3 rounds of buyouts

15
Farm Bill Dairy Programs House dairy legislation is similar
to the expiring farm bill Senate?
Some are seeking a higher MILC trigger price and a higher percentage payment rate
The new DFWT wants a national, mandatory “CWT” buyout program
Change federal milk market orders
15

16
Market Demand Cheese &
byproducts Fluid milks &
butterfat Butter & ice-
cream Milk powders
and components
Organic & specialty products

1717
.
1993
1994
1995
1996
1997
1998
1999
2000
2001
2002
2003
2004
2005
2006
2007
F140,000
150,000
160,000
170,000
180,000
190,000
200,000
210,000
14,000
15,000
16,000
17,000
18,000
19,000
20,000
21,000
f(x) = 2296.02857142857 x + 146667.904761905
f(x) = 316.467857142857 x + 15395.4571428571
Total Milk Production and Milk per Cow, 1993-2007F
Total production
Trend in Milk Production
Production per cow
Trend in Milk Per Cow
Mil
k P
rod
uc
tio
n,
Mil
. lb
.
Mil
k p
er
Co
w,
lb.

1818
Consumer Price Indices for All Items (CPI-U), Food and Dairy, 1970-2006. (1982-84=100)
0
50
100
150
200
250
1970 1973 1976 1979 1982 1985 1988 1991 1994 1997 2000 2003 2006
Food Dairy CPI-U

1919
Total and Per Capita Milk Disappearance, Milkfat Basis, 1975-2005
y = 2.2552x + 106.24
300
400
500
600
700
800
900
1000
1975 1978 1981 1984 1987 1990 1993 1996 1999 2002 2005
Per
cap
ita,
lb.
60
80
100
120
140
160
180
200
To
tal,
bil.
lb.
Per Capita
Total
Trend in Total Disapp.

20
Demand
DomesticConventional productsrBST “free” (affects supply)Organic and specialty
productsExports
20

2121
Dairy Exports For 2006 and year-to-date in 2007
exports of dried milk powders, whey products, other milk components, showed strong revenue growthLow US prices in 2006 and early 2007Weakening dollarReduced production & exports from NZ
& AustraliaReduced exports from the EU as a
result of CAP reformsDemand growth, especially in Asia

2222
Jan-9
0
Nov-90
Sep-9
1
Jul-9
2
May
-93
Mar
-94
Jan-9
5
Nov-95
Sep-9
6
Jul-9
7
May
-98
Mar
-99
Jan-0
0
Nov-00
Sep-0
1
Jul-0
2
May
-03
Mar
-04
Jan-0
5
Nov-05
Sep-0
60.000
0.500
1.000
1.500
2.000
2.500
3.000Exchange Rates, Foreign Currency per
US$ New Zealand
EU12 Euro

2323
Milk P owder P ric es , US and Oc eania, US $ per Metric T on, 2000-07
0
1000
2000
3000
4000
5000
6000
2000:1 2001:1 2002:1 2003:1 2004:1 2005:1 2006:1 2007:1
$ per
Met
ric T
on
0
1000
2000
3000
4000
5000
6000
OC E ANIA S K IM MIL K P OWDE R
US NF DM, G rade A

2424
2000:129 5 33 9 37 13 41 17 45 21 49 252007:1290
1000
2000
3000
4000
5000
6000
0
1000
2000
3000
4000
5000
6000
Cheese Prices, US and Oceania, $ per Metric Ton, 2000-07
Oceania Cheddar Cheese
US American Cheese, Barrels
$ p
er
Me
tric
To
n

25
US Dairy Product Trade, US$, 1997-2006
0
0.5
1
1.5
2
2.5
3
1997 1998 1999 2000 2001 2002 2003 2004 2005 2006
$bill
ion
ExportsImports

26
US Nonfat Dry Milk Powder Exports, 1996-2006
0
100
200
300
400
500
600
700
1997 1998 1999 2000 2001 2002 2003 2004 2005 2006
$mill
ions
0
50
100
150
200
250
300
350
'000
Met
ric
Tons
ValueQuantity

27
2007 Exports Total Value of US dairy exports up
35% Jan-July ‘07 v. ’06 Sharply higher prices since January
Skim Milk Powder up 70%Cheese up 70%Butter up 90%
We may be seeing some price resistance

28
Current Situation 2006 US Milk Production @ 181.8 bil.
lb. 2.8%Milk per cow 19,951 lb, 2.0%Cow numbers @ 9.1 mil, 0.1%
2006 Commercial Sales 2.5%Cheese 4.6%Butter 0.5%Nonfat dry milk 4.5%Fluid milk 0.1%
28
29
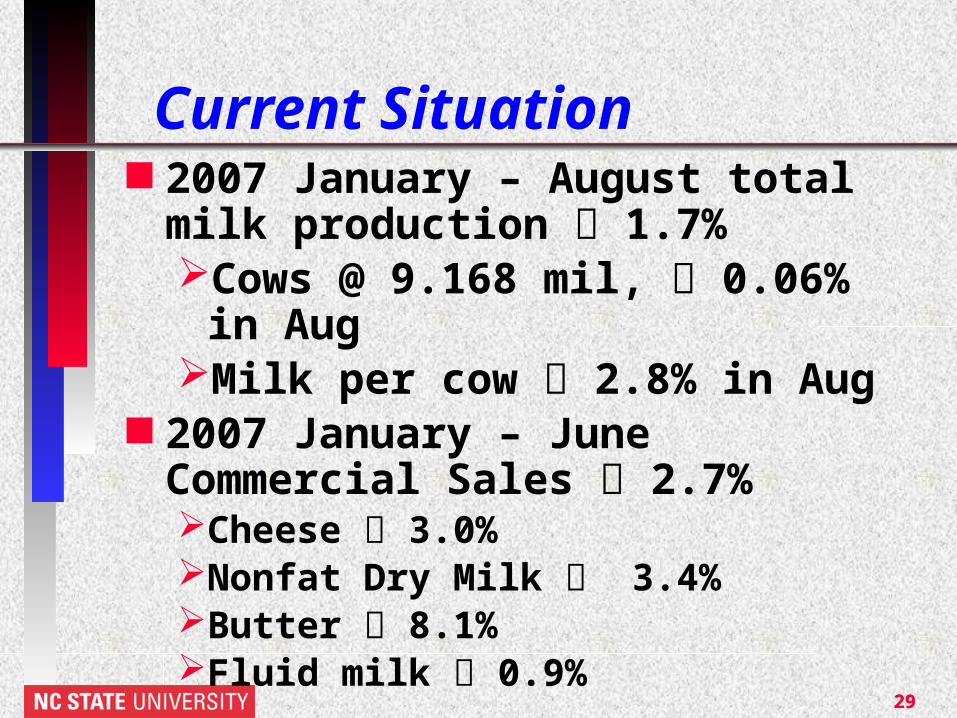
Current Situation 2007 January – August total milk
production 1.7%Cows @ 9.168 mil, 0.06% in AugMilk per cow 2.8% in Aug
2007 January – June Commercial Sales 2.7%Cheese 3.0%Nonfat Dry Milk 3.4%Butter 8.1%Fluid milk 0.9%
29

30
Outlook for 2008
30

31
Export Prospects Continued world demand growth but
consumer price resistance Continued weakness of the US$ Supply-demand balance in EU27 Normal supplies from New Zealand
but continued drought related problems in Australia
Some expansion of world supplies
World market prices will soften?31

3232
US Sales Outlook US Demand
+ Slow economic growth+ Continued population growth+ Continued producer & processor funded
advertising and promotion+ Lower consumer prices v. 2007
Overall sales will grow at trend rates, say +2.0%Cheese: 2-3%, adequate stocks, lower
pricesButter: adequate stocks, lower pricesFluid milk: little change Milk powders: little change in use

3333
Supply Outlook Cheese & butter inventories are edging up August cow numbers were up 54,000 over
August 2006 and up 11,000 over July ‘07July 1 heifer inventory was up 3.0% US will re-open Canadian border to
breeding stock November 19, 2007 Feed costs have increased but feed-milk
price ratio has been favorable = Cow cull rate is fairly neutral Milk/cow will be affected by reduced rBST Higher fertilizer and energy related costs

3535
1 4 7 10 13 16 19 22 25 28 31 34 37 40 43 46 49 5230
35
40
45
50
55
60
65
70
Dairy Cow Slaughter, F.I., Weekly, 2003-2007
2003
2005
2006
2007
Week
'00
0 H
ea
d

3636
Dairy Cattle, US & Canada
ItemUS
Mil. HeadCanada
Mil. HeadCanada % of US
Dairy Cows 9.15 0.98 10.7 %
Dairy Heifers
3.9(Over 500 lb.)
0.48(Over 12 mo.)
12.3 %
Heifers as % of cows 42.6 % 49.0 % --
Historically, US heifer imports = 50-75,000 head/year

3737
.Total Milk Production and Milk per Cow, 1993-2007
140,000
150,000
160,000
170,000
180,000
190,000
200,000
210,000M
ilk P
rod
uct
ion
, Mil.
lb.
.
14,000
15,000
16,000
17,000
18,000
19,000
20,000
21,000
Milk
per
Co
w, l
b.
Total productionProduction per cowTrend in Milk Per CowTrend in Milk Production

38
Fuel & Feed Costs Persistent higher oil & energy prices Ethanol demand and the knock-on
effects on other crops represents a permanent increase in feed costs for dairy farmers
Feed prices are projected to continue above historic averages in 2007-08Corn @ $3.10/bu, US farm avg.48% soybean meal @ $220/ton
Current Milk:Feed Price ratio remains high enough to make some more milk but forecast price ratio is unfavorable
38

3939
Feed costs $1.00 per bushel = $36/ton If you feed 2 tons of corn per cow per year
and if the cost increase: is $1.00/bu. = $72/cow/year is $1.50/bu. = $108/cow/year
If you feed 3 tons of corn per cow per year and if the cost increase: is $1.00/bu. = $108/cow/year is $1.50/bu. = $162/cow/year
If you sell 20,000 lb. of milk per cow, an increase of $100 = $0.50 per 100 lb.

40
Milk:Feed Price Ratio, Monthly, 2002-07
0
0.5
1
1.5
2
2.5
3
3.5
4

41
Prices Paid for Feed and Fuel
ItemApril 2003
April 2005
April 2006
April 2007
% 2003-07
Diesel, $/gal 1.24 1.97 2.28 2.43 + 96%
Gasoline, $/gal 1.60 2.23 2.60 2.64 + 65%
L.P. Gas, $/gal 1.21 1.47 1.69 1.73 + 43%
20% CP dairy Feed, $/ton 201 206 226 258 + 28%
41
Source: Ag. Prices, NASS, April issues, selected years

42
Prices Paid for Selected Fertilizers, $/ton
ItemApril 2003
April 2005
April 2006
April 2007
% 2003-07
Amm. Nitrate 243 292 366 382 + 57%Urea 261 332 362 453 + 74%30% N Solution 161 215 232 277 + 72%Super-phosphate 243 299 324 418 + 72%
Muriate of Potash 165 245 273 280 + 70%
42
Source: Ag. Prices, NASS, April issues, selected years

4343
19
89
19
90
19
91
19
92
19
93
19
94
19
95
19
96
19
97
19
98
19
99
20
00
20
01
20
02
20
03
20
04
20
05
20
06
20
07
F
-3.0
-1.5
0.0
1.5
3.0
4.5
6.0
7.5
Year-to-Year Changes in Total Milk Production, Cow Numbers and Milk per Cow, 1989-2007
Year-to-Year Change in Cow NumbersYear-to-Year Change in Milk per CowYear-to-Year Change in Total Milk Produc-tion10-year Average Change in Cow Numbers10-year Change in Milk per Cow
Pe
rce
nt

4444
USDA Forecast 2007 production
9.13 mil. cows -- 0.2%20,250 lb. per cow -- 1.5%184.9 bil. lb. milk -- 1.7%
2007 prices, midpointAll Milk @ $19.30/cwt -- $6.40 from
2006 at $12.90/cwtClass III Milk @ $ 18.20/cwt -- $6.31
from 2006 at $11.89/cwtClass IV Milk @ $18.45/cwt -- $7.39
from 2006 at $11.06/cwt. !!!!

4545
USDA Forecast 2008 production
9.15 mil. cows -- 0.2%20,610 lb. per cow -- 1.8%188.6 bil. lb. milk -- 2.3%
2008 prices, midpointAll Milk @ $18.75/cwt -- $0.55 from
2007 Class III Milk @ $16.90/cwt -- $1.30
from 2007Class IV Milk @ $18.00/cwt -- $0.45
from 2007

46
Class III prices, $/100 lb.
46

47
US & FO5 Milk Prices, $/cwt.
Item 2002 2003 2004 2005 2006 2007F 2008P
US All Milk
12.14 12.52 16.04 15.15 12.90 19.30 18.00
US Class III Milk
10.42 11.42 15.39 14.05 11.89 18.20 16.00
FO 5Blend
13.24 13.55 17.01 16.23 13.99 20.50 19.50
MILC 1.21 1.09 0.22 0.04 0.60 0.01 0.0

4848
.
Dairy Farms and Cows, United States, 1997-2006
60,000
70,000
80,000
90,000
100,000
110,000
120,000
130,000
140,000
1997 1998 1999 2000 2001 2002 2003 2004 2005 2006
Dai
ry F
arm
s
6,000
7,000
8,000
9,000
10,000
11,000
12,000
13,000
14,000
Co
ws,
'000
s
Farms Cows
10-yr decrease in farms = 39%
10-yr decrease in cows = 1.5%

4949
.
1-29 Cows
30-49 Cows
50-99 Cows
100-199 Cows
200-499 Cows
500+ Cows
0
5,000
10,000
15,000
20,000
25,000
30,000
35,000
40,000
45,000
US Dairy Farm Structure, 1997 & 2006
1997
2006
Herd Size
Fa
rms

5050
.Regional Changes in Milk Production and Population
-100%
-50%
0%
50%
100%
150%
200%
250%
No
rth
east
Lak
e S
tate
s
Co
rn B
elt
N. P
lain
s
S. P
lain
s
Ap
pal
ach
ia
So
uth
east
Del
ta
Mo
un
tain
Pac
ific
U.S
.
Milk, % Change ('89+'90) to ('05+'06)
Pop, % Change '90-'06

5151
Regional Per Capita Milk Production, lb. 2006
462
1,867
408
906
309184
111 100
1,334
961
607
0
200
400
600
800
1,000
1,200
1,400
1,600
1,800
2,000
Nor
thea
st
Lake
Sta
tes
Cor
n B
elt
N. P
lain
s
S. P
lain
s
App
alac
hia
Sou
thea
st
Del
ta
Mou
ntai
n
Pac
ific
U.S
.

52
Causes of Structural Change Productivity (milk/cow) has grown at a faster rate
than the rate of growth in dairy product sales Pressure on milk prices and profit margins per cow
and per cwt. Milk price pressures plus advances in
mechanization create incentives and opportunities to increase herd size, both to achieve economies of size and to sustain family living standards
Declining farm numbers as smaller farms leave & survivors expand
Regional differences in dairy farming systems and input costs create differences in profitability
Production is increasing in the west, with other regions losing market share

5353
Regional Competitiveness The southern region is quite diverse
The average herd size in Florida is 825 cows, selling 13.5 million pounds of milk annually
The average herd size in Kentucky is 79, selling 1.0 million pounds of milk annually
90% or more of the herds in Florida, Georgia, and North Carolina are confinement operations
~95% of the herds in Louisiana and ~75% in Mississippi are pasture-based
Several states have organic herds and/or on-farm processing, some have neither

5454
Summary 2007 saw record high milk prices The dairy industry is still on the price
rollercoaster – will it be a crash landing or will export markets continue to support prices?
Outlook is for continued growth in total US milk production and lower milk prices
Production costs have increased and will stay at higher levelsHigher corn and other feed pricesHigher energy pricesHigher fertilizer costs

5555
Summary Projections are for higher net incomes in
2007 because higher milk prices more than offset increases in production costs
Net income will be lower in 2008 Structural change will continue Regional competitiveness determines the
market share of the national milk production “pie”
Dairy diversity means at least some farms in a state and region are competitive

56
Implications The future will look a lot like the past Price volatility is not the cause of structural
change and there are strategies for managing around these price swings
National policies are unlikely to help but some states have provided subsidies
Some southeastern dairy producers are competitive but many will need to become more focused on profitability -- Many farmers do not know their cost of production, financial performance and financial status. Infrastructure is a concern
Is there more the LGUs can & should do?

57
Geoff Benson
Phone: 919.515.5184 Fax: 919.515.6268 E-mail:
[email protected] Web page: http://www.ag-econ.ncsu.edu/
faculty/benson/benson.html
57