Dairy Development for the Resource Poor, Part 3: Pakistan and India Dairy Development ... ·...
78
A Living from Livestock Pro-Poor Livestock Policy Initiative Dairy Development for the Resource Poor Part 3: Pakistan and India Dairy Development Case Studies PPLPI Working Paper No. 44-3 Steven J. Staal, Alejandro Nin Pratt, and Mohammad Jabbar
-
Upload
duonghuong -
Category
Documents
-
view
213 -
download
0
Transcript of Dairy Development for the Resource Poor, Part 3: Pakistan and India Dairy Development ... ·...

A Living fromLivestock
Pro-PoorLivestockPolicyInitiative
Dairy Development for the Resource Poor Part 3: Pakistan and India Dairy
Development Case Studies
PPLPI Working Paper No. 44-3
Steven J. Staal, Alejandro Nin Pratt,and Mohammad Jabbar

i
TABLE OF CONTENTS
Preface .............................................................................................................. iii Acronyms ............................................................................................................ iv Executive Summary ................................................................................................. v
Overview of the Study .......................................................................................... v A Conceptual Framework for Dairy Development .......................................................... v Comparative Trends in Dairy Development among Countries in East Africa and South Asia....... vii Country Case Studies from South Asia and East Africa – Kenya, Ethiopia, Pakistan and India.....viii Synthesis of Regional and Country Results: Defining an Agenda for Pro-Poor Dairy Policy and Development .................................................................................................... ix An Agenda For Pro-Poor Dairy Policy and Development ................................................. xii
Dairy Development in Pakistan ................................................................................... 1 Introduction: Some Dairy Development Trends ............................................................. 1 Policies and Institutions for Improving Dairy Production and Marketing ................................ 4 Other Policies Indirectly Affecting the Dairy Sector ....................................................... 9 Explaining Differences in Dairy Development Between Punjab and Sindh.............................11 Income and Employment Opportunities in Milk Production and Marketing ............................19 Main Lessons from Pakistan’s Dairy Development .........................................................25
Dairy Development in India.......................................................................................29 Introduction......................................................................................................29 Dairy Development Policy .....................................................................................29 Changing Demand Patterns for Dairy Products.............................................................41 Analysis of Regional Differences in Dairy Development in India ........................................43 Income and Employment Generation in the Indian Dairy Sector ........................................54 Main Lessons from Indian Dairy Development ..............................................................59
References ..........................................................................................................63
Tables
Table 1: Buffalo and cattle population, Pakistan 1960-2002 (millions) .................................. 2 Table 2: Patterns of household expenditure on food, 1990 and 2000.................................... 3 Table 3: Indicators of milk production growth and related factors for Punjab Province.............13 Table 4: Indicators of milk production growth and related factors for Sindh Province. .............14 Table 5: Employment and income from milk production in Punjab and Karachi. .....................20 Table 6: Income and employment in milk marketing and processing in Lahore, Punjab, and
Karachi, Sindh. ........................................................................................24 Table 7: Summary of the Indian dairy sector policy and market environment. .......................30 Table 8: Annual growth rate (%) of production of major livestock products in India. ................32 Table 9: Applied and bound tariffs (%) on selected dairy products in India............................35 Table 10: Growth pattern of livestock population in India: 1951-1992 (million). ......................40 Table 11: Per capita consumption of milk‡ and share of consumer expenditure spent on milk
& milk products (kg per capita per year). ........................................................41 Table 12: Income/expenditure elasticity of demand for milk in India. ..................................42 Table 13: Indicator of development of the dairy sector and variables affecting development for
different states grouped by level of development indicator (Index of the number of cross-bred cows and milking buffaloes per worker in agriculture)............................46
Table 14: Average values for the indicator of development of the dairy sector and variables affecting development for two groups of states.................................................47

Table of Contents
ii
Table 15: Comparison of values for the indicator of development of the dairy sector and variables affecting development between Punjab and Maharashtra and Uttar Pradesh and Madhya Pradesh. ................................................................................................48
Table 16: Parameter estimates for dairy development in Indian district level information for years 1982, 1987, and 1992, three different dependent variables...................................51
Table 17: Parameter estimates for dairy development, including role of co-operatives, from Indian district level information for years 1982, 1987, and 1992, for three different dependent variables................................................................................................53
Table 18: Employment in dairying in major states of India (in 1,000s) and its distribution in rural and urban areas. ......................................................................................55
Table 19: Percentage distribution of employment in dairying across social groups in major states of India (1999-2000). ....................................................................................55
Table 20: Income and employment in milk production on average in Haryana and Punjab, under different scales of production. .....................................................................57
Table 21: Employment generation in informal milk markets in Punjab and Haryana, and national predictions. ............................................................................................58
Figures
Figure 1: Values of milk and various crops in Pakistan, 1997-2002. ...................................... 1 Figure 2: Milk production trends from cattle and buffalo, 1960-2002.................................... 2 Figure 3: Artificial insemination coverage in Punjab Province, 1971-2000. ............................. 5 Figure 4: Annual growth in demand for processed milk, 1992-2001. ..................................... 8 Figure 5: Milk production per capita, Punjab and Sindh, 1960-2000. ...................................15 Figure 6: Milk production per worker, Punjab and Sindh, 1960-2000. ..................................15 Figure 7: Sources and intensity of feed use for animals, 1960-2000.....................................17 Figure 8: Per capita milk consumption, Punjab and Sindh. ...............................................17 Figure 9: Real prices and per capita consumption of milk, Punjab and Sindh provinces,
1960-2000. ............................................................................................18 Figure 10: Share of the total number of farmers and milk production by farm size in Punjab and
Sindh, 2002............................................................................................21 Figure 11: Share of employment generation in milk production by farm size in Punjab and Sindh,
2002. ...................................................................................................22 Figure 12: Share of different livestock products in total value output from livestock products,
2000-01 ................................................................................................29 Figure 13: Comparison of milk and dairy product flows through alternative markets in India. ......36 Figure 14: Changes in milk utilization patterns in India, 1951 and 1995. ................................43 Figure 15: Index of the number of cross-bred cows and milking buffaloes per worker as a measure
of development of the dairy sector plotted against GDP per capita.........................45 Figure 16: Milk procured to co-operatives and development of the dairy sector measured as number
of cross-bred cows per worker in agriculture by state.........................................49 Figure 17: Relationship between milk procured by co-operatives and development of the dairy
sector measured as an index of the number of cross-bred cows and milking buffaloes per worker in agriculture (district level)..............................................................49

For more information visit the PPLPI website at: http://www.fao.org/ag/pplpi.html or contact: Joachim Otte - Programme Coordinator - Pro-Poor Livestock Policy Facility Email: [email protected] Tel: +39 06 57053634 Fax: +39 06 57055749 Food and Agriculture Organization - Animal Production and Health Division Viale delle Terme di Caracalla 00153 Rome, Italy
iii
PREFACE
This is the 44th of a series of Working Papers prepared for the Pro-Poor Livestock Policy Initiative (PPLPI). The purpose of these papers is to explore issues related to livestock development in the context of poverty alleviation.
Livestock is vital to the economies of many developing countries. Animals are a source of food, more specifically protein for human diets, income, employment and possibly foreign exchange. For low income producers, livestock can serve as a store of wealth, provide draught power and organic fertiliser for crop production and a means of transport. Consumption of livestock and livestock products in developing countries, though starting from a low base, is growing rapidly.
The aims of this study are to analyse trends and determinants of dairy development in East Africa and South Asia in order to assess the role of policies and institutions on the evolution of the sector in general, and their impact on the poor in particular. Although traditional and commercial dairy production/marketing systems coexist in both regions, traditional/informal dairy production systems continue to dominate, are generally competitive, and have played a key role in sector development, because of continued strong demand for the products and services they offer. Policies which build on traditional production systems, with a particular focus on employment generation and food safety and quality, are therefore expected to be pro-poor.
We hope this paper will provide useful information to its readers and any feedback is welcomed by the authors, PPLPI and the Livestock Information, Sector Analysis and Policy Branch (AGAL) of the Food and Agriculture Organization (FAO).
Disclaimer The designations employed and the presentation of material in this publication do not imply the expression of any opinion whatsoever on the part of the Food and Agriculture Organization of the United Nations concerning the legal status of any country, territory, city or area or its authorities or concerning the delimitations of its frontiers or boundaries. The opinions expressed are solely those of the author(s) and do not constitute in any way the official position of the FAO.
Acknowledgements A very large number of people contributed to this study, which expanded in scope and depth during the course of its implementation. While thirteen people are listed among the co-authors of various sections of the three-part series, many other contributed to data collection in the field, particularly in Kenya and India, for which the authors would like to express their gratitude. For providing an important data source in India, we thank Partha Rao at ICRISAT. Finally, we acknowledge the many useful comments received from Archie Costales and colleagues at FAO-PPLPI, which materially improved the final outcome.
Keywords Smallholder dairy production, dairy development policy, informal markets, developing countries, poverty reduction, South Asia, East Africa.
Date of publication: 6 February 2008.

iv
ACRONYMS
5Y 5 Year ADBP Agricultural Development Bank of Pakistan AI artificial insemination APEDA Agricultural and Processed Food Products Export Development Authority DMI Directorate of Marketing and Inspection DMS Delhi Milk Scheme EEC European Economic Community EIC Export Inspection Council EU European Union FSMSC Food Safety Management Systems based Certification FTP Foreign Trade Policy GATT General Agreement on Tariffs and Trade GDP Gross Domestic Product GHP Good Hygiene Practices GMP Good Manufacturing Practices GTZ German Technical Co-operation programme ha hectare HACCP Hazard Analysis Critical Control Points ICDP Integrated Cattle Development Project IDDP Integrated Dairy Development Programme IFAD International Fund for Agriculture Development IK Idara-e–Kissan INR Indian Rupees km kilometre KVS Key Village Scheme MMPO Milk and Milk Products Order NDDB National Dairy Development Board NSSO National Sample Survey Organization OBC Other Backward Castes OFP Operation Flood Programme OGL Open General License PERI Punjab Economic Research Institute PKR Pakistan Rupees R&D research and development SC Scheduled Castes SMP skim milk powder SNF solids-not-fat SPS Sanitary and Phytosanitary ST Scheduled Tribes TMDD Technology Mission on Dairy Development UHT ultra-high temperature treated USD United States Dollar WTO World Trade Organization

v
EXECUTIVE SUMMARY
Overview of the Study
The process of dairy development that this study addresses is driven by underlying fundamental changes in economic growth, the value of resources and consumer demand. However, it is also shaped by public policies, interventions and investment decisions and will be accompanied by changes in impact on incomes, opportunities and livelihoods of producers and changes in opportunities and returns for market agents and investors. This study examines dairy development in two key dairy producing regions in the developing world: East Africa and South Asia. The aim of the study is to analyse the trends in dairy development in these two regions and identify their key determinants, to analyse the impact of policy interventions on those trends and to identify impacts of dairy development, particularly on the poor.
The study is reported in three parts: Part 1 presents a conceptual framework for dairy development, followed by a section presenting a regional analysis of dairy development trends across all the countries in the two regions and a synthesis of the outcomes of the case study analyses (see below), highlighting implications for policy interventions and investment, including proposing a model for pro-poor dairy development. Parts 2 and 3 consist of in-depth case studies and analyses of dairy development trends, determinants and outcomes in Kenya and Ethiopia (Part 2) and India and Pakistan (Part 3 – this report).
A Conceptual Framework for Dairy Development
As a simplistic description of the beginning and end points of the dairy development process, two stylized representations of dairy systems are used:
• the ‘traditional model’ (also known as the small-scale subsistence or Southern tropical model) to reflect the small-scale, farm-household milk production and informal market systems that predominate in most developing countries; and
• the ‘commercial model’ (also known as the large-scale industrial or Northern cold-chain model), representing the large-scale industrialized production and integrated marketing that is observed in developed countries.
It is important to note that elements of both models will often occur simultaneously in both rich and poor country settings. The characteristics of these models are described below and reflect both farm and market differences.
Characteristics of ‘traditional’ milk production systems include:
• multi-objective household model of farmer behaviour
• low levels of inputs and outputs
• nutrient deficit in both farm and household
Characteristics of ‘commercial’ milk production systems include:
• single objective enterprise model of farmer behaviour
• high levels of both inputs and outputs
• nutrient surplus in both farm and household

Executive Summary
vi
Characteristics of ‘traditional’ milk marketing systems include:
• diffuse market structure, consisting of many small-scale market agents
• artisanal processing, labour-intensive handling and transport methods
• low-cost products, mostly liquid and limited in diversity
• great diversity in market behaviour and roles
• no voice or role in dairy policy making
Characteristics of ‘commercial’ milk marketing systems include:
• concentrated market structure, consisting of relatively few, large-scale, vertically-integrated market agents
• industrial processing, based on capital-intensive technologies at all market levels
• value-added products, mostly non-liquid and diverse
• little diversity in market enterprise types
• loud voice and large role in dairy policy making
At the heart of this process is the shift from a multi-objective farm-household activity to a focused-objective enterprise activity. The conceptual framework poses a number of factors that drive this shift. These include:
Demand levels and consumption patterns, which are closely associated with income growth and urbanization and with local consumption traditions. Milk is not a commodity but rather a complex set of products, the demand for which is determined by:
• increased demand for quality, food safety and standardization
• changes in consumption habits and lifestyles
• demand for convenience
• changes in levels of demand
Opportunity costs of labour and land are also key driving forces for system change, which tend to bring about a substitution of capital for both of these factors and a general shift towards commercial systems. Aspects of this include:
• opportunity costs of labour in milk production
• opportunity costs of labour in milk markets
• opportunity costs of land
Market access, infrastructure and institutional development condition the structure and performance of production systems for a highly perishable product. Elements of these described in the report include:
• transaction costs and infrastructure
• transactions costs and institutions
• transaction costs and location of production
Finally, technology and policy interventions can alter the opportunities and incentives for dairy system change and development. Generally, improved technology will reduce costs and induce shifts towards more commercial systems; adapting to changes in other factors will be dependent on the availability of technological alternatives, ether existing or new. Policies - deliberate or inadvertent - for market regulation and infrastructure investment can alter market institutions and transactions costs. Critically, policies can partially determine the winners and losers

Executive Summary
vii
of structural changes in the sector, determine market participation of smallholders versus larger producers and employment generation and incomes at both farm and market level.
Impacts of Dairy Development on the Poor While development, meaning commercialization, of the dairy sector is favourably viewed by policymakers, it should be understood in the context of the contribution of livestock production to livelihoods and income generation for smallholder farmers through the production of higher-value products compared to most crops. Of key importance are the differences in policies that can condition those outcomes in terms of benefits to different communities and social groups. Elements of the outcomes for the poor include income and employment generation, which includes both self-employment of farmers and market agents but also hired labour on farm and in the market. Less tangible returns to milk production include the value of livestock assets for finance and insurance functions.
Dairy development is also linked to nutrition, both among farm families and resource-poor consumers of dairy products and also on farm in soil nutrients. Consumption of even small amounts of milk can have dramatic effects on improving the nutritional status of poor people and is especially important for children and nursing and expectant mothers. Further, as long as low soil fertility remains the primary constraint to agriculture in most developing countries, manure from dairy cows can provides a critical source of organic matter and nutrients, boosting smallholder’s crop yields on farms where chemical fertilizers are often unavailable and unaffordable.
Policy interventions, as well as market forces, can help to determine whether dairy development follows more or less equitable development paths. An equitable development path occurs when shifts towards farm and market commercialization are associated with increased alternative opportunities off-farm, in urban areas and in alternative agricultural enterprises or industries. An inequitable development path occurs when increased commercialization at farm and market levels are associated with reduced opportunities and alternatives for small-scale farmers and market agents.
Measuring Dairy Development Our conceptual framework has at its core the shift from labour intensive practices towards more capital intensive practices, both on farm and in market, due to increased opportunity costs of labour. That shift also implies higher productivity of labour. The stages of change between traditional and commercial can thus be measured in terms of labour productivity; if we equate that change with ‘dairy development’ we can use labour productivity as a general proxy for dairy development, reflecting changes in all parts of dairy systems. Due to data limitations, that productivity measure will take several different forms in the analyses that follow.
Comparative Trends in Dairy Development among Countries in East Africa and South Asia
These two regions represent some of the most important dairy development zones among poorer countries globally. Within them occur countries where dairy production and consumption has a long historical tradition and has been an important part of agricultural systems. In other countries in the same regions, however, dairy production has been a less significant enterprise, often for cultural reasons but also

Executive Summary
viii
due to limited potential. These regions thus present an excellent framework for understanding both the driving factors and the pro-poor implications of dairy development and of related policies and interventions. Data used from five South Asian countries and ten East African countries, based on FAOSTAT and the World Bank’s World Development Indicators database, is used in a regional analysis of comparative trends in milk production. Milk production is used as a proxy for dairy development. Explanatory variables include proxies for various aspects of demand and market development, inputs and labour markets, technology and human capital, infrastructure and transaction costs and policy.
Summary of Results of Regional Analyses East Africa. Demand-related factors play a key role in explaining development of the dairy sector in East Africa, as shown by the significant contribution to growth of demand-related factors in the three countries with the fastest growth in milk production (Sudan, Kenya and Uganda). Development of formal milk markets, input markets, technology and policy do not explain the differences between fast-growing countries and the rest. This suggests that adjusting supply to type and quality of products demanded, expanding demand by reducing consumer prices and reducing transaction costs should be a necessary condition to expand the dairy sector in East Africa.
South Asia. The dairy sector in South Asia is following a different path. Consumption of dairy products is higher on average than in East Africa and demand-related factors have been contributing to growth in the dairy sector for the past 30 years in all countries. Differences in growth are more related to the possibility of expanding supply to match the growing demand of dairy products. India and Pakistan were able to link the transformation in agriculture originated in the Green Revolution to successfully expand production and output; this is reflected in the contribution of input markets and technology to growth in milk production. In the case of countries with slow growth in milk production, such as Bangladesh and Nepal, development of cereal production, feed markets and a growing demand did not translate into technical change in the dairy sector, as was the case in India and Pakistan. The policy environment in these countries is also less favourable than in the fast-growing countries. Sri Lanka’s constraints to growth in the dairy sector appear to be mainly on the supply side. As in East Africa, development of formal milk markets in South Asia is not associated with increased growth rates.
Country Case Studies from South Asia and East Africa – Kenya, Ethiopia, Pakistan and India
These four countries represent a range of production conditions, histories and policy environments related to dairy development: India and Kenya are also held up as examples of ‘successful’ dairy development. Where available, detailed provincial and district data were gathered from each country on dairy development and its potential determinants. Data were analysed using similar approaches to those applied in the regional analysis, outlined above. Due to severe data limitations, relatively complete analyses were only possible in Kenya and in India. Data were also gathered from farm and market level on income and employment generation in different scales of dairy enterprises.
The results exhibit more similarities than differences. Of importance to dairy development in all cases are the roles of demand growth, the traditional market and availability of improved dairy animals. Policies related to investment and trade show mixed results. More detail from the four country case studies can be found in Part 2

Executive Summary
ix
(Kenya and Ethiopia) and Part 3 (Pakistan and India – this report) of this series. The final synthesis of the regional and case study results, summarized below, highlights the main outcomes from all the analyses.
Synthesis of Regional and Country Results: Defining an Agenda for Pro-Poor Dairy Policy and Development
Synthesis of Key Lessons for Dairy Development and Policy Demand-side change. The analyses highlight the importance of growth in consumption and demand, brought about either through growth in GDP per capita or exports, or through increased urbanization.
• Supply-side interventions can, in some cases, be over-credited with bringing about growth. The Indian milk revolution, for example, may be largely a result of demand-side forces, although the technical and agricultural sector factors discussed below played a key role as well. Unless these facts are understood, there may be overemphasis on supply-side interventions that have not been demonstrated to bring about development in some cases.
• Clear understanding of potential market trends and opportunities is needed for policy and planning in the dairy sub-sector. Because demand is highly conditioned by local perceptions and traditions regarding dairy consumption, this understanding should be pragmatic and based on local realities, not on assumed duplication of trends observed elsewhere. Where poor people play a large role in the consumption of dairy products, interventions to support the provision of low-cost products are likely to simulate dairy development.
• Interventions to facilitate better, more efficient supply-demand linkages are also likely to have positive impact.
Supply-side change Improved dairy animals and other farm technology. A consistent and clear outcome of the analysis, both at the regional and country-case levels, is that nearly all strong dairy development growth scenarios are associated with technical change in terms of yield per animal. Genetic improvement has obviously had dramatic impact on development and growth.
• Clearly, use of exotic cattle genes is a rapid and potentially sustainable path to higher productivity, even among small-scale and resource-poor farmers and in warm, semi-arid or humid climates. At the same time, the failures caused by importing high-grade animals should be noted and avoided.
• National and local breeding strategies need to address the realities of climate and disease risk. Given appropriate breeding strategies and disease control measures, however, it is possible to develop and sustain cross-bred dairy production systems; such systems have often played a key role in dairy development.
• Although it is difficult to capture the role of fodder technology in the aggregate analyses in this study, for the Kenya case it was possible to demonstrate that planted fodder technology played a key role in growth in dairy productivity.
• Research has shown that the ‘appropriateness’ of intensive fodder production is much more likely to depend on availability of cheap labour, scarcity of land and good access to milk markets, than it is on agro-climatic setting. Where labour is scarce, evidence shows that intensive fodder cultivation practices and feeding of crop residues to cattle, unless mechanized, are unlikely to be taken up.

Executive Summary
x
Interventions to promote those should pay very close attention to labour opportunity costs.
• Where relative land and labour values constrain uptake of specialized fodder technologies, a potential avenue for increased productivity is through improved ‘food-fodder’ crop varieties, bred to increase the fodder quality and digestibility of the straws and stovers they produce.
Agricultural sector growth. In some regions and countries, general agricultural sector growth and transformation was shown to play a role in dairy development; for example India and Pakistan were able to link the transformation in agriculture originated in the Green Revolution to expand milk production. The link with the agricultural sector is not as evident in some other South Asian countries or in East Africa. Productivity change in those cases may continue to rely on fodder technology, given the low opportunity costs of labour.
Traditional milk and dairy product markets. One of the key findings of the study is that traditional/informal milk markets have apparently played a key role in dairy development in both regions and in most countries. In countries with the strongest growth, such as Pakistan, India, Sudan and Uganda, traditional, small-scale markets control over 80% of marketed milk; there is no evidence that this basic structure will change significantly in the next few decades. These facts, which are often overlooked because traditional markets are generally not reflected in national dairy industry statistics, pose several important implications for dairy policy and development.
• All the evidence suggests that the traditional market dominance is not a result of lack of investment in formal market channels, or of non-enforcement of national milk standards; rather they are the result of continued strong demand for the products and services that they offer. As a consequence, in many cases, investment in formal dairy processing facilities, both in the private and public sectors, have failed leading to underutilized capacity surviving on subsidies or abandoned milk processing plants and cooling facilities.
• In some cases there is strong demand for traditional products by high-income consumers as well as the resource poor; growth in disposable income may not necessarily significantly reduce demand for traditional products.
• The analysis in this study does not support the view that formal market structures are required to stimulate dairy development. One of the countries in this study with the strongest growth, Pakistan, displays a negligible formal market share. In East Africa, the analysis suggests a negative association between formal market share and dairy development, as measured. This is likely to be because formal market share in that region was less a result of market forces but rather due to public investment decisions. Also, poorly managed formal market institutions provided a much less effective link between farmers and consumers than the traditional informal market.
• Traditional informal markets have clearly provided an effective, functional link between farmers and consumers which responds to consumer demand: they should not be regarded as market failures. Moreover, such markets are generally those most often serving the needs of small-scale farmers and resource-poor consumers. The analysis has also demonstrated the large and positive employment implications of such markets.
• Public policy-makers should engage constructively with traditional markets rather than oppose them directly, particularly as demand for food safety may grow with increases in disposable income. Policies that allow the continued functioning of such markets, but which support increased quality and food safety, are likely to be pro-poor in nature. Policies that simply oppose and attempt to police such markets are likely to impact negatively on small-scale farmers, consumers and small-scale market agents.

Executive Summary
xi
Dairy co-operative development. Mixed messages emerge from the analysis of the two countries where co-operatives have played a significant role in dairy development: Kenya and India. In Kenya, evidence suggests that dairy co-operatives played a significant role in fostering dairy development, primarily by providing a stable market environment and delivering services to farmers. In India, there was no empirical evidence that co-operative development was associated locally with dairy development as measured, although it were found to be associated with genetic improvement in dairy animals.
• Dairy co-operatives may play an important role in providing a base for service delivery to farmers, stable agricultural knowledge systems for uptake of improved technology and increased management skills among farmers.
• There is no empirical evidence that dairy co-operatives are more effective than other market channels in linking poor farmers to output markets. Pakistan illustrates very dramatically that strong market growth can occur in the absence of dairy co-operatives.
• The mixed experience suggests that dairy co-operative development is heavily dependent on good co-operative management, honest and effective investment of resources and accountability to the interests of the farmer members. Political and governmental influence in co-operatives needs to be minimized.
• Further, dairy co-operatives often cannot easily tap into the strong demand for traditional products and raw milk and generally remain tied to demand for formally processed products. While traditional demand remains the driving force, dairy co-operatives face the same growth impediments as the formal private sector.
• Investment in dairy co-operative development can be effective and pro-poor - if it is well-managed, placed outside strong political forces and is linked to strong demand. Because of these constraints, dairy co-operative development should not be the primary focus of dairy development efforts; rather it should be part of a mix of market channels, including formal private sector and small-scale traditional.
• Other less formal forms of farmer groups, such as self-help groups, could play important roles in some local cases.
Smallholder competitiveness. There is ample evidence to suggest that smallholder dairy producers are generally competitive and are likely to endure for some time, particularly where the opportunity costs of family labour and wages remain low. The most compelling evidence towards this is the continued dominance of smallholders in all the countries studied, even where there is steady economic growth. Furthermore, dairy as an enterprise is an option available to landless and socially marginalized groups.
• Policy-makers and development investors should resist the often-heard assumption that the role of smallholders is ending and that efforts should now be made to support larger-scale, ‘more efficient’ milk production to meet growing consumer demand. Instead, that growing demand should be used as a mechanism to help continue and sustain smallholder dairy enterprises.
• Smallholders may, in some cases, face increased barriers to participating in changing markets; alternative options, such as contract farming, should be explored and promoted where appropriate.
Public investment. Due to data limitations, the analysis was not able to show a link between agricultural research and development (R&D) and growth in dairy development, mainly because no measures of R&D investment specifically for dairy were available. In spite of the lack of strong empirical evidence in this analysis, it is reasonable to assume that investment in dairy R&D and provision of appropriate credit to smallholder producers will grow in importance, particularly as producers

Executive Summary
xii
shift towards greater commercial orientation, increasing their demand for improved technologies and investment.
Trade policy. Imports and exports, as well as macro policy and level of openness of the economy, show very mixed results and cannot apparently be demonstrated to play a consistent role in the pace of development.
• Exports, as demonstrated in South Asia, may play a role in dairy development. Export opportunities might increase if, for example, EU export subsidies are curtailed as is expected, although barriers to entry remain significant.
• Countries that do not have a strong tradition of milk production and consumption, such as Sri Lanka and Bangladesh, are particularly susceptible to import competition. Supporting the development of traditional markets takes on the added feature of helping buffer domestic producers from imports.
• Even though trade in dairy products tends to receive a disproportionate amount of attention, perhaps because of issues of national pride and self-sufficiency, there is little evidence that trade issues are of major importance for the welfare of the large majority of producers, market agents or even consumers. The projections of the Livestock Revolution (Delgado et al. 1999, 2001) show very clearly that the demand growth and opportunities in milk is going to happen domestically rather than across borders.
• Policy-makers and planners would be well advised to focus their attention to the much larger and more dynamic domestic markets, rather than the smaller and less welcoming international markets.
An Agenda for Pro-Poor Dairy Policy and Development
The lessons learned from this analysis, as well as those gleaned from the other research cited, suggest some elements of what might be termed an ‘agenda for pro-poor dairy policy and development’.
Objectives of pro-poor dairy development include:
• employment creation in rural and peri-urban areas, both on farm and along market distribution and value chains
• reliable income generation and asset accumulation for resource-poor farmers
• provision of low-cost and safe dairy products to resource-poor consumers
• improved natural resource management and sustained farming systems through dairy cattle-mediated nutrient cycling
• improved child nutrition and cognitive development in resource-poor households
Elements of a model for pro-poor dairy development
Such a model would simply incorporate the lessons and recommendations outlined above, and so would include the following main elements:
• build on traditional dairy product consumption habits and preferences, at the same time as promoting demand for new products
• support development and evolution of traditional domestic markets for milk and dairy products, at the same time as promoting appropriate formal market development

Executive Summary
xiii
• emphasize and support the role of smallholder dairy production as primary means of rural income generation and of sustaining the intensification of mixed crop-livestock systems:
o appropriate improved animals and the systems required to deliver these to smallholders
o fodder technologies and exchange mechanisms for fodder and crop residues o institutional mechanisms for enhancing smallholder participation in growing local
markets – co-operatives but also contract farming and other forms of farmer groups.

1
DAIRY DEVELOPMENT IN PAKISTAN
Khalid Mahmood, Mohammad Jabbar and Zelekawork Paulos
Introduction: Some Dairy Development Trends
A major structural transformation has occurred in the agricultural sector of Pakistan during the last two decades. While the share of agriculture in the national gross domestic product (GDP) has declined from 30% in 1980 to 24% in 2002, at the same time the contribution of the livestock sub-sector to agricultural GDP has increased from 26% to 47%. From 1960-2000, agricultural GDP grew by 3% per annum; the livestock sector output grew by 3% until 1980 and over 5% thereafter.
The dairy sub-sector played the most important role in this transformation as milk production increased from 5.4 million tonnes in 1960 to 28 million tonnes in 2000 (Economic Survey of Pakistan 2002-2003). The relative values of crops and milk products in recent years are shown in Figure 1. Within the livestock sector, dairy (milk) accounts for 66% of the value of output, ruminant meat accounts for 13%, poultry meat and eggs 8% and other products 13% (Agriculture Statistics of Pakistan 2001-2002).
Figure 1: Values of milk and various crops in Pakistan, 1997-2002.
Source: Agricultural Statistics of Pakistan, 2001-02
Annual production of milk increased more rapidly after 1986 due to a combination of changes in dairy population, species composition and yield per animal. Total population of cattle and buffalo, the main sources of milk, increased but the buffalo population increased faster than the cattle population since the mid 1980s; share of milk production from buffalo increased along with increase of total milk production
Economic Value of Milk Vs Crops
0
50
100
150
200
250
300
Rs
Bill
ion
Milk 225 255 270 275 290
Wheat 135 130 160 145 120
cotton 100 100 110 125 120
Rice 50 60 70 65 56
Sugar cane 53 55 59 47 53
1997-98 1998-99 1999-00 2000-01 2001-02

Dairy Development in Pakistan
2
(Table 1, Figure 2). Moreover, milk yield per animal increased at a rapid rate, especially in Punjab province, since the mid 1980s, partly because of a larger share of the buffalo population and partly due to higher per animal yield from better germplasm supplied through artificial insemination. Per capita milk production slightly decreased between 1960 and 1972 due to slower milk production increase compared to human population growth, but after 1972 per capita production increased, initially slowly up to 1986 then quite rapidly.
Figure 2: Milk production trends from cattle and buffalo, 1960-2002.
Milk Production (1960-2002)
0
5
10
15
20
25
30
1960 1970 1980 1990 2000 2002
mill
ion
tone
s Cow milkBuffalo milkTotal milk
Source: FAO and Agricultural Statistics of Pakistan (1960-2002)
Table 1: Buffalo and cattle population, Pakistan 1960-2002 (millions)
Buffalo Cattle
1960 8.2 16.6
1970 8.9 14.5
1980 11.4 13.9
1990 17.7 12.5
2000 22.7 22.0
2002 24.0 22.9
Source: Agriculture Statistics of Pakistan, 2001-02
A comparison of household expenditure patterns between 1990 and 2000 shows that in 1990, 21% and 14% of household food expenditures were spent on milk and meat, respectively; in 2000 these shares were 23% and 11%, respectively, but of a higher level of absolute expenditure (Table 2). With rapid GDP growth, as indicated earlier, there was therefore an increase in the demand for milk.

Dairy Development in Pakistan
3
Pakistan met its demand largely from domestic production; imports have been very marginal and have decreased over time. For example, import of powdered milk decreased from about 10,000 tonnes in 1990 to about 5000 tonnes in 2000 due to increased domestic production.
Table 2: Patterns of household expenditure on food, 1990 and 2000.
Food items % of 1990 expenditure
% of 2000 expenditure
Cereals 13 14
Milk 21 23
Meat 14 11
Pulses 18 21
Vegetables 14 9
Vegetable oil 10 12
Others 10 10
All 100 100
Source: Federal Bureau of Statistics, 2000
Although milk production increased approximately six-fold between 1960 and 2002, about 85-90% of milk consumption in both rural and urban areas of Pakistan remained in the form of raw unprocessed milk and traditional processed milk products, such as yoghurt, ghee/butter oil and butter. Raw milk is usually boiled at home. Most of the raw milk and traditional milk products are marketed by farmers in their own localities and by informal traders in urban and rural areas. Consumer demand for processed milk has been increasing slowly since the mid 1990s. Of the processed milk products, 50% is UHT milk, 40% powdered milk and 10% pasteurized milk, yoghurt, cheese and other milk products.
The above trends in the dairy sector with respect to production, consumption, trade and marketing patterns have been directly and/or indirectly influenced by different policies, programmes and institutional initiatives taken since the 1960s. Some policy measures remained effective for specific years or period, while others had a longer-term existence and therefore had confounding effects along with other short-term measures effective at the time. Moreover, some policies were focused on specific geographical areas, such as Punjab and Sindh, the main dairy producing areas of the country, while others had an economy-wide impact. The policy measures can be classified into two broad groups:
Policies, institutions and programmes directly affecting production and marketing of milk include:
• public investment in livestock extension and services
• promotion of dairy co-operatives
• targeted dairy development projects
• public sector investment in milk processing and marketing
• facilitating private sector investment in dairy processing
• import tariffs on milk powder and income tax exemption to dairy farmers

Dairy Development in Pakistan
4
Other policies indirectly affecting the dairy sector:
• promotion of Green Revolution technologies
• exchange rate policies
• tax policy for processed milk products and agricultural inputs
• regulations banning animals in metropolitan city areas
• regulations to control milk quality
In this summary review, it is not intended to quantify the exact effect of these policy measures and related regulations and institutions individually or collectively. Rather the objective is to indicate their effects, or likely effects, on dairy sector growth in a qualitative or logical manner. First, the overall dairy sector growth in the country is discussed with a focus on Punjab and Sindh provinces as they are the principal dairy producing areas in the country. Then differential growth in Punjab and Sindh provinces are discussed in much more detail. Compared to Sindh, Punjab covers a much larger geographical area, has fertile land, is more densely populated and there has been substantial investment in irrigation and other infrastructure, providing a larger and better environment for dairy development. A large part of Sindh is arid and development investment there occurred much later than in Punjab. These differences will partly explain, among other things, the differential performance of the two provinces.
Policies and Institutions for Improving Dairy Production and Marketing
Public Investment in Livestock Extension and other Services The Federal Ministry of Agriculture, through its Livestock Division, used to provide animal health, breed improvement, artificial insemination (AI) and extension services and also created milk processing and marketing infrastructure to promote commercial dairy production and meet urban demand. In 1970, the function was decentralized by creating a Provincial Department of Livestock in each province. The Department of Livestock in Punjab Province has been successful in promoting livestock development through some of the services and technologies, although in other cases there has been little impact.
One of the successful areas of intervention in the Punjab was the provision of AI services. Currently Punjab has AI coverage in all its 34 districts through a network of 750 AI centres and sub-centres operated by 286 AI technicians. There are four semen production centres in the province with a total capacity to produce 1.48 million doses of semen annually. As a result of these facilities, AI coverage increased from 15,000 inseminations in 1971 to 1.15 million in 2000 (Figure 3). Along with an increase in the buffalo population, coverage of buffalo with AI also increased rapidly, although at present only about 10% of breeding animals are inseminated. Average production of these animals is about 25% higher than naturally-bred local animals, so productivity improvement has partly contributed to the dairy sector growth. It is unclear what genetic material or breeds have been promoted through AI services and what affect it had on the genetic composition of the provincial dairy cattle and buffalo herd.
Public sector expenditure on research and extension for livestock and dairy development in Punjab Province increased from about USD 16 million in 1988/89 to about USD 25 million in 2001/02, an increase of 56% in real terms over the 12 year period. Although a large share of this budget has been spent on salaries and wages

Dairy Development in Pakistan
5
and for building and maintaining infrastructure, a good portion has also been spent on actual research and services that contributed to the growth of the sector. Such detailed figures for Sindh were not available.
Figure 3: Artificial insemination coverage in Punjab Province, 1971-2000.
Artificial Insemination coverage in Punjab(000 Animals)
-
50
100
150
200
250
300
350
400
450
500
550
600
650
1971 1975 1980 1985 1990 1995 2000
000
Head
s
ExoticCowBuffaloes
Source: Livestock Department of Punjab Provincial Government
Promotion of Dairy Co-Operatives The co-operative movement has a long history in Pakistan dating back to British colonial rule, but at that time the movement had few successes. Special efforts have been made since 1965 to organize producer co-operatives to supply agricultural inputs with assistance from a federal co-operative bank, but big landlords captured most of the benefits. Co-operatives apparently did not initially serve the livestock sector or dairy sub-sector. In 1983/84, a dairy development project was started in Pattoki Tehsil, Okara District in Punjab under a joint project run by the Punjab Provincial Livestock Department and the German Technical Co-operation programme (GTZ). The project promoted adoption of improved breeds through AI, improved fodder, health improvement and milk collection and processing for the urban market. The co-operative also performed other welfare functions for its members. In 1992, the project was formalized as a farmers’ co-operative under the Societies Act of 1980 and was named Idara-e–Kissan (IK), which then acquired a long-term lease for a non-functional government-owned milk processing plant near Lahore and another near Pattoki to increase its processing and marketing capacity. Currently, 19,000 farmer-members of the co-operative own the enterprise. The society started its development and operational activities under the Halla Union Council and later used ‘Halla’ as the trade name of all its milk products.
Dairy Development in Pakistan
6
In the milk collection area of IK, 70-80% of the households are small-scale livestock keepers with an average of two dairy animals. In 1992, milk collection covered 87 villages, with about 250 households per village; coverage increased to 326 villages by 2000 and 400 villages by 2003. Current daily collection is about 200,000 litres through 576 milk collection centres; 5-10% of milk is collected in the evening. From 1992 to 2000, average annual sales increased from 4 million to 39 million litres. Initially, pasteurized milk used to be produced but the market was limited as consumers were not yet ready to pay the extra cost of value addition; they were used to the lower-priced traditional liquid milk supply from gowalas (milkmen or milk retailers) and also from urban dairy farmers. In 1998, IK conducted a limited experiment with the supply of open pasteurized milk, sold without packing through small retail milk shops. This policy targeted a consumer segment looking for quality but not yet ready to pay for packaging. The strategy succeeded in getting consumer acceptance as price was comparable to raw milk supplied by the gowalas but quality was better. For example, in December 2003 the price per litre of UHT milk was PKR 30 (USD 0.50), pasteurized unpacked milk PKR 17 (USD 0.28) while raw milk sold by informal traders was PKR 12-18 (USD 0.20-0.30). The scheme was multiplied by establishing its own ‘Halla’ retail milk shops and IK’s market share in Lahore increased rapidly.
Currently, daily processing and sales through 450 Halla retail shops are roughly:
• 70,000 litres unpacked pasteurized (open pasteurized)
• 20,000 litres pouch-packed pasteurized
• 30,000 litres UHT
• 80,000 litres converted to powder and other products
The largest share of the UHT milk market is now held by Nestlé (Pakistan), a subsidiary of the multinational Nestlé, while IK dominates the pasteurized milk market. There is seasonal fluctuation in production as raw milk supply increases in the flush season (due to better feed availability) and drops in the summer. About 40% of the flush season milk collection is converted to powder and sold in the domestic market in the dry season.
IK has recently acquired another milk processing plant near Islamabad, previously owned by the Pakistan Agriculture Research Council. It has started milk collections from other regions of Punjab, based on a similar pattern of farmer organizations.
Targeted Dairy Development Projects In the past, the federal and provincial governments invested their own and/or donor resources in targeted livestock development projects in specific areas of the country with specific objectives to develop the livestock sector. One such project was the Punjab Smallholder Dairy Development Project, which operated from 1991-98. The project was jointly funded by a loan from the International Fund for Agriculture Development (IFAD) and a grant from the United Nations Development Programme (UNDP) at a total cost USD 14 million. It targeted 27,000 poor rural households in 720 villages in six Tehsils (Wazirabad, Hafizabad, Phalia, Kharian, Norowal and Sialkot) in Gujranwala Division to raise milk production for home consumption and income generation. The project created village milk collectors to collect and deliver milk to public or private sector milk collection centres of existing processing plants in the project areas, built 72 kilometres of farm-to-market roads and helped to connect rural producers with organized marketing channels. The project also contributed to an improved cropping pattern with hybrid seed, improved grass varieties and fodder production

Dairy Development in Pakistan
7
According to an evaluation report of the Punjab Economic Research Institute (PERI), milk production has increased by 26.5% among the targeted households and milk sales per household increased by up to 69%. The joint mission report of the Asian Development Bank and IFAD stated that milk production in the project area increased by 15%. As the results of the project were so encouraging, the project was incorporated into the Provincial Livestock Department in its regular programme of activities and several programmes, such as fodder improvement, animal production and milk marketing, are still functional. The project is planning to register Livestock Farmers Associations under the Co-operative Act and adopt a scheme for improvement of breeds.
Public Sector Investment in Milk Processing and Marketing Assuming that there was demand for clean, good quality milk in urban areas, the government considered that milk processing could bring development in the dairy sector by linking production and consumer demand. A policy was pursued to create dairy processing and marketing facilities under government ownership and management through dairy development projects, such as the Punjab Livestock Project. During the mid 1970s livestock development projects were conceived for increasing milk production: for example a Livestock Development Project was started in 1975 as an umbrella pilot project in some districts of all four provinces with an investment of PKR 78.4 million (USD 21.2 million) of which a World Bank loan covered PKR 36.9 million (USD 10 million) and PKR 41.4 million was generated from a Punjab government grant and equity fund. The project mainly invested in Sheikhupura District, Punjab, with the objective of increasing milk production by improving productivity of dairy animals through increased semen production for buffalo and cattle, improving marketing through establishment of milk plants with UHT technology and selling processed milk.
The implementation of the project was delayed by four years due to a change in management and delay in installation of machinery. Once implemented, it helped in creating capacity to process nearly one million litres of milk per day but consumer preference was not yet geared to accept processed milk. Consequently, capacity utilization was very low and most enterprises ran at heavy losses: the Lahore milk plant ran at about one-third of its capacity and lost PKR 3.12 million in 1984. The government disinvested these enterprises in the 1990s after the adoption of macroeconomic structural adjustment policies and a different set of policies was pursued to encourage private sector investment in the dairy industry.
Facilitating Private Sector Investment in Dairy Processing Since the mid 1970s, alongside establishing public sector dairy processing facilities, the government followed a policy to give soft loans (low interest, few collateral requirements) to private entrepreneurs in the dairy sector for dairy farming, milk collection and processing and also allowed duty-free import of dairy machinery that was not produced domestically. This policy increased private sector investment – both local and multinational - in the dairy sector. The Agricultural Development Bank of Pakistan (ADBP) financed a total of 32 milk-processing plants through this policy, in the process creating overcapacity for processed milk. Although there was no explicit policy to control informal trading, it was hoped that expansion of formal milk processing and marketing would automatically reduce the importance of the informal sector: this did not happened as rapidly as was anticipated and only a few of the processing plants are still operational; others closed down due to inadequate milk supply, lack of management skills and insufficient demand for their products. This failure also meant that there was little impact on dairy production through anticipated backward linkages.

Dairy Development in Pakistan
8
Since 1990, the ADBP has changed its policy, almost abandoning investment in the dairy sector after the bank was left with about PKR 1 billion in defaulted loans. Instead, the bank has been offering loans only for dairy farming, especially to small-scale producers.
Since the mid 1990s, demand for processed milk products has been increasing slowly (Figure 4); in response private sector investment in dairy processing has again started picking up. UHT technology has proved to be effective in increasing shelf-life of milk without cooling. Establishment of milk powder plants has enabled surplus ‘flush season’ milk to be converted into powder milk for selling in the dry season. One of the most successful dairy processing enterprises in the country is owned by Nestlé (Pakistan). The enterprise was originally known as Milkpak (a local company), which produced packaging materials for the dairy industry but in 1979 it established a processing plant of its own to produce UHT milk. Currently, it occupies the largest market share of UHT milk in the country, collecting milk from 130,000 farmers in 3000 villages in Punjab Province. The company also owns the biggest milk collection network, collecting one million litres of milk a day in the morning and evening. About 30% of members’ evening milk is collected with the remainder being used for family consumption and for making butter oil and other milk products. Like IK, the farm services of Nestlé are developing milk production belts by providing milk suppliers with extension services and promoting use of good quality feed and breed improvement. The company enjoyed 15% annual growth in sales from a low base over the last five years.
These developments helped to increase overall milk production and decrease importation of powdered milk from about 10,000 tonnes in 1990 to 5000 tonnes in 2000. Currently there are 44 milk plants in the country with installed capacity of 5 million litres per day; only 13 plants are operational with about 40% capacity utilization in total. Among these, the installed milk powder processing capacity is about 100,000 tonnes per year but plants operate at below 40% capacity due to competition with cheap milk powder dumped from European Union (EU) countries which offer export subsidies.
Figure 4: Annual growth in demand for processed milk, 1992-2001.
Milk production Vs UHT Milk processing Growth
0%
5%
10%
15%
20%
25%
30%
35%
40%
1992 1993 1994 1995 1996 1997 1998 1999 2000 2001
UHT milk growth rate
Milk Production Growtht
Dairy Development in Pakistan
9
Tariff on Imported Milk Powder and Income Tax Exemption to Dairy Farmers This policy was pursued since the middle of the 1970s with the intention of protecting domestic dairy producers and contributing to increased domestic production. From 1978 to 1987, domestic prices of milk were on average 80% higher than import parity prices. Using the equilibrium exchange rate of 1972-87, on average there was 35% import duty on milk. At present, even after structural adjustment policies, 25% custom duty is imposed on imported dairy products; this drops to 10% when the imported milk product is used as raw material for further milk processing. Currently the landed price of imported milk powder from EU is USD 1000 per tonne compared to USD 1920 for local product. The EU is offering an export subsidy of USD 660 per tonne for milk powder.
In reality, protection and income tax exemption might have slowed down growth rate and competitiveness by offering better price and income from low productivity. As mentioned earlier, current capacity utilization in the milk powder processing industry is about 40%, representing about 180 days of annual operation.
Other Policies Indirectly Affecting the Dairy Sector
Promotion of Green Revolution Technologies Since the mid 1960s, investment in Green Revolution technologies – high-yielding varieties of cereals, chemical fertilizers, pesticides, irrigation and mechanization of farm operations – significantly increased cereal crop productivity and output. Success in the crop sector created a platform for diversification of farm and non-farm activities in the rural areas including the livestock sector, especially the dairy sector. Some of the Green Revolution technologies had a direct impact on the dairy sector while others had an indirect impact.
Increased cereal productivity and output helped to reduce prices of cereals relative to other commodities in both rural and urban areas. This, along with increased income from high crop-sector growth, created demand for better-quality foods including livestock products. This created market opportunities and incentives for crop producers to diversify into higher-value products, such as milk, meat, vegetables and fruits.
Irrigation expansion along with other technological changes, combined with labour scarcity and higher labour costs, led to adoption of mechanization in various farm operations. This resulted in a reduction in the number of draft animals and their follower herds but increased the number of dairy animals as more dairy animals could be raised with the available feed. Since buffaloes are preferred for milk production due to the higher fat content of their milk, the buffalo population increased at a faster rate than the cattle population (Table 1). Consequently growth in milk production increased rapidly, especially after 1980, mainly due to the increased buffalo population but also due to improved milk yields. Punjab, where irrigation expansion was more widespread, experienced a greater increase in the buffalo population and better milk yield growth. Also, irrigation and higher cereal productivity has allowed an increase in green fodder production for dairy animals, from 1.27 million hectares in 1960 to about 2.2 million hectares today, contributing to higher productivity.

Dairy Development in Pakistan
10
Exchange Rates Overvalued exchange rates in the 1960s resulted in negative protection for the domestic economy, especially for tradable items. Policy simulation indicated that free trade in milk powder would have reduced producer prices of milk by about 60% and consumer prices by about 40% in the 1980s; milk output would have increased by 41% and milk consumption by 27% (Dorosh and Valdes 1990). These were potential losses for the dairy sector and the national economy.
Tax on Agricultural Inputs and Processed Milk Products This is a recently introduced policy. Tax on inputs is mainly applicable to seeds, fertilizer and pesticides so the crop sector was directly affected. Impact on the dairy sector has been indirect, through lower cereal crop residue output, which is the main source of feed, and lower fodder production for commercial dairy farms. Tax on milk and milk products, e.g. pasteurized and UHT milk, butter, cheese, yoghurt and flavoured milk, is currently under discussion. Its likely effect will be to limit the market by making these products too costly for low- to middle-income consumers.
Prohibition of Animal Rearing in Metropolitan City Areas Like many other developing countries, urban dairy has been a common feature in Pakistan cities. The largest concentration of animals used to be in Karachi and Lahore, where there are large populations and large milk markets. While Lahore used to receive milk supplies from a large river belt in the Punjab, as Karachi is located on the sea it has a much smaller hinterland. However, the health and transport hazards created by animals in Karachi became so serious that the Karachi Municipal Authority promulgated a law in 1965 banning animals from the metropolitan areas. Instead a dairy colony was created in Landhi, a few kilometres outside Karachi, where farmers were allocated a piece of land to establish stall-fed dairy farms. The dairy animal population, mainly buffaloes, increased rapidly and the area became one of the most densely populated livestock-rearing areas in the world. The population of Karachi still preferred raw milk so a new marketing chain involving wholesalers and retailers emerged. In addition, feed production and breeding stock supply chains emerged linking distant districts in Sindh and Punjab. This system contributed to increased milk output by creating backward linkages with feed and stock suppliers in the rural areas and forward linkages with consumers in the city.
The new system has also created some problems. Since raising pregnant and dry cows in this system became very expensive, farmers sell dry cows, even after the first lactation, to slaughter houses in Karachi and immediately buy pregnant heifers or milking animals, causing a serious drain on the country’s productive animal genetic resources. The colony has no waste disposal or management policy; manure piles up and its effluent drains into the sea causing serious environmental problems in the local area. And because of the expansion of the city limits, the dairy colony is no longer outside the city, rather it has become a part of the city with all the potential hazards that a concentrated dairy population can create. Several attempts to relocate it further away and to introduce environmental management procedures have failed.
Lahore Municipality also promulgated a law in 1985 banning animals in the municipal area but it did not become fully operational until 1995. Farmers were allocated land in a number of small milk colonies outside the city; due to the rapid expansion of the city, however, most of these dairy colonies are now once again within the city boundary. This relocation has contributed to increased output as producers started using intensive production methods, selecting better yielding animals and feeding

Dairy Development in Pakistan
11
them with concentrates. It has also changed the marketing pattern of milk creating a new set of milk wholesalers and retailers, as in Karachi.
Quality Control of Milk Concern for better food quality and safety is gaining prominence among urban consumers because of better awareness amongst other reasons. In the case of dairy, the importance of quality and safety increased with urbanization, commercial production and emergence of longer market chains from producer to consumer.
Quality of milk is controlled under the Food Act of 1965, which specifies the quality of raw milk. The law specifies the fat and solids-not-fat (SNF) contents of milk to be 3.5% and 8.9%, respectively. However, this act and other subsidiary food laws are inadequate to cover all aspects of food quality demanded by modern day consumers. The food law specifies only the chemical properties of dairy products; it says little about the biological properties of the food items and the regulations do not explicitly restrict the use of hazardous preservatives in milk. At present penicillin, formalin, hydrogen peroxide, milk productivity hormones and many other potentially harmful preservatives and residues are all found in milk. The long-term affects of these substances on human health are largely unknown. In addition, adulteration with up to 60% water, often of unknown quality, is common. Local government authorities and the Health Department are jointly responsible for enforcing the act: both are ill-equipped with inappropriate technology and inadequate manpower and the Food Act is generally not enforced.
Explaining Differences in Dairy Development between Punjab and Sindh
In the introductory section, some differences in the dairy production environment between Punjab and Sindh were described. In order to explain the contribution of these and other factors to differences in dairy growth, it was envisaged that econometric analysis would be applied to district level secondary data. However, apart from decennial population and livestock census, very few other statistics are generated and published at district level. Instead, limited data available for selected time points were used to analyse general trends in dairy growth, taking milk production per worker as an indicator for dairy sector development and relating to that a set of factors representing demography, demand, technology and input markets. As explained in the conceptual framework in Part 1 of this series (see Executive Summary), milk production per worker is expected to increase as the dairy sector develops and becomes more specialized and commercial. The discussion in this section is based on the data presented in 3 and 4 for Punjab and Sindh, respectively.
The transformation and commercialization of the livestock sectors in both provinces was primarily driven by changes in demand and success with Green Revolution technologies in the 1970s and 80s. High yielding cereals, irrigation, fertilizers, pesticides, tractors and other mechanical equipments played a major role in this transformation from both supply and demand sides, but at different rates in Punjab and Sindh. On the demand side, higher crop productivity levels led to increases in rural household incomes, which increased the demand for milk and other dairy products. Higher crop productivity reduced real prices of cereals for urban consumers, releasing income to increase demand for dairy products. On the supply side, promotion of irrigation and mechanization of farm operations released many draft animals that made way for increased numbers of dairy cows to be used for milk production. In general, development in input markets, agricultural services and mechanization resulted in substantial cereal crop productivity and output gains. All

Dairy Development in Pakistan
12
the indicators for input markets, presented in Table 3 and Table 4, indicate that Punjab has utilized higher level of inputs. For instance, in 1960 fertilizer application was 16 and 14 kg per hectare in Punjab and Sindh, respectively; by 1986 Punjab used 144 kg per hectare, almost double the amount in Sindh. As a result, cereal production per worker has been higher in Punjab than in Sindh, and this has indirectly (via feed availability) contributed to greater levels of milk production per capita (Figure 5) and milk production per worker (Figure 6) in Punjab. With these developments continuing beyond the mid 1980s, the rise in cereal productivity enhanced feed availability by releasing land to increase green fodder production for dairy animals, especially in Punjab.

Dairy Development in Pakistan
13
Table 3: Indicators of milk production growth and related factors for Punjab Province.
1960 1972 1986 1996 2000
Milk production (million tonnes) 4.4 5.7 8.0 15.9 18.9 Annual growth rate of milk production (percent) - 2.2 2.5 7.1 4.4 Milk production per capita (tonnes) 0.12 0.10 0.11 0.22 0.25 Milk production per worker (tonnes) 0.81 0.92 1.10 2.09 2.32 Input markets Fertilizer use (kg/ha) 16 50 144 152 166 Number of tractors 6157 25394 126968 210628 221159 Cereal production per worker (tonnes) 0.80 1.28 2.10 2.02 2.77 Feed Purchased feed per milking animal (tonnes) 0.02 0.05 0.07 0.10 0.11 Green fodder per milking animal (hectares) 0.17 0.17 0.13 0.12 0.09 Technology Milk yield per milking animal (tonnes) 0.56 0.73 0.81 1.41 1.46 Percentage of vaccinated animals (cattle + buffalo) 6 12 24 30 37 Total cattle (million heads) 9.7 8.2 8.8 9.4 10.4 Total buffalo (million heads) 6.1 7.4 11.2 13.1 15.5 Total cattle and buffalo (million heads) 15.8 15.6 20.0 22.5 25.9 Total milking animals (million heads) 7.9 7.8 10.0 11.2 13.0 Labour market Percentage employed in agriculture 60 58 56 45 40 Percentage employed in manufacture, services, others 37 40 43 55 60 Infrastructure Road network (km) 10635 21271 25940 30320 42307 Urbanization Percent of urban population 26 27 32 33 32 Consumer demand Per capita milk consumption (tonnes) 0.106 0.087 0.092 0.174 0.187 Per capita butter consumption (tonnes) 0.032 0.026 0.028 0.052 0.056 Per capita cheese consumption (tonnes) 0.005 0.009 0.009 Commercialisation of dairy sector Proportion of milk production sold 10 18 21 25 27 Milk purchases of consumers (shares)
From neighbourhood producers 0.05 0.03 0.03 0.02 0.02 From traders 0.95 0.94 0.94 0.93 0.93 From stores and supermarkets 0 0.03 0.03 0.04 0.05
Milk sales of producers (shares) To co-operatives and societies 0 0.02 0.02 0.02 0.02 To traders 0.95 0.92 0.92 0.91 0.90 Directly to consumers 0.05 0.05 0.05 0.05 0.05 Processing companies 0 0.01 0.01 0.02 0.03
Real milk prices in Lahore, Punjab (PKR/litre; 2000 prices) 32 57 17 13 16

Dairy Development in Pakistan
14
Table 4: Indicators of milk production growth and related factors for Sindh Province.
1960 1972 1986 1996 2000
Milk production (million tonnes) 1.0 1.2 2.3 6.8 7.7 Annual growth rate of milk production (percent) - 1.4 5.0 11.4 3.2 Milk production per capita (tonnes) 0.07 0.05 0.08 0.23 0.25 Milk production per worker (tonnes) 0.62 0.58 0.84 2.23 2.29 Input markets Fertilizer use (kg/ha) 14 45 80 106 103 Number of Tractors 2031 5079 25394 42126 44232 Cereal production per worker (tonnes) 0.74 1.10 1.35 1.41 1.16 Feed Purchased feed per milking animal (tonnes) 0.017 0.030 0.031 0.026 0.029 Green fodder per milking animal (hectares) 0.16 0.15 0.07 0.04 0.03 Technology Milk yield per milking animal (tonnes) 0.47 0.54 0.53 0.82 0.85 Percentage of vaccinated animals (cattle +buffalo) 5 7 7 9 11 Total cattle (million heads) 2.9 2.8 5.5 11.1 12.3 Total buffalo (million heads) 1.4 1.5 3.2 5.6 5.9 Total cattle and buffalo (million heads) 4.3 4.3 8.7 16.7 18.2 Total milking animals (million heads) 2.1 2.2 4.3 8.3 9.1 Labour market Percentage employed in agriculture 60 58 56 45 40 Percentage employed in manufacture, services and other 40 42 44 55 60 Infrastructure Road network (km) 3191 6381 7782 9096 12692 Urbanization Percent of urban population 41 43 44 45 45 Consumer demand Per capita milk consumption (tonnes) 0.049 0.037 0.058 0.162 0.173 Per capita butter consumption (tonnes) 0.020 0.011 0.014 0.040 0.043 Commercialisation of dairy sector Proportion of milk production sold 5 10 15 20 25 Milk purchases of consumers (shares) From neighbourhood producers 0.10 0.10 0.10 0.10 0.10 From traders 0.90 0.90 0.88 0.88 0.88 From stores and supermarkets 0 0.001 0.02 0.02 0.02 Milk sales of producers (shares) To co-operatives and societies 0 0 0 0 0.02 To traders 0.90 0.90 0.88 0.88 0.86 Directly to consumers 0.10 0.10 0.10 0.10 0.10 Processing companies 0 0.001 0.02 0.02 0.02 Real milk prices in Karachi city, Sindh (PKR/litre; 2000 prices) 34 47 23 25 23

Dairy Development in Pakistan
15
Figure 5: Milk production per capita, Punjab and Sindh, 1960-2000.
Milk output percapita
0.0
0.1
0.1
0.2
0.2
0.3
0.3
1960 1972 1986 1996 2000
Year
Tonn
es
Milk yield percapita, Punjab Milk yield percapita, Sindh
Figure 6: Milk production per worker, Punjab and Sindh, 1960-2000.
0.0
0.5
1.0
1.5
2.0
2.5
1960 1972 1986 1996 2000
Year
Tonn
es
Milk production per worker, Punjab Milk production per worker, Sindh

Dairy Development in Pakistan
16
High investments in farm mechanization coupled with developments in the labour market (more workers leaving for off-farm employment opportunities) resulted in a substitution of draft animals for tractors; this substitution was faster and more intensive in Punjab where the Green Revolution started much earlier and on a wider scale. With increased use of tractors, draft animals were replaced by milking animals leading to increased numbers of milking animals that could be raised with the available feed. Most of these increased animals were better yielding buffaloes, especially in Punjab, where the proportion of buffalo in the dairy population increased from 39% in 1960 to 60% in 2000, compared to 33 and 32% in those two years in Sindh. Purchased feed per milking animal, especially cottonseed and oilseed cakes, has increased in both provinces, but was faster in Punjab1 (Table 7). On the other hand, green fodder per milking animal has been declining, especially in Sindh, as green fodder production has not been able to keep up with the growth in milking animal population. These changes contributed to a faster growth in per animal yield, especially in Punjab where between 1986 and 2000 yield increased by about 80% compared to about 60% in Sindh.
Another factor that has contributed to better dairy sector performance in Punjab is the use of better genetic material and health management. Compared to Sindh, Punjab has had a larger proportion of its cattle and buffaloes vaccinated and artificially inseminated throughout the period under study. Milk production per milking animal in Punjab has remained at higher levels than Sindh’s.
Although initially milk production per worker in Sindh was much lower than in Punjab, a considerable jump in milk production and milk production per worker occurred in the province between 1986 and 1996, allowing it to catch up to the levels attained in Punjab. Several factors contributed to this outcome. The total number of milking animals in the province doubled between 1986 and 2000, from 4.3 million to 9.1 million (Table 3 and Table 4). More importantly, milk production per milking animal increased sharply from 0.53 tonnes in 1986 to 0.82 tonnes in 1996. Growth of cereal production per worker increased in Sindh during 1986 and 1996; at the same time Punjab experienced a drop in cereal production per worker. This may have also had a part to play as cereal crop residue output is the main source of feed. Also, employment in the agricultural sector declined from 56% to 45% due to developments in the labour market. In addition, a dramatic change occurred in Sindh’s per capita milk consumption, which grew from 60 kg in 1986 to 160 kg in 1996, almost closing the per capita milk consumption gap between Punjab and Sindh (Figure 8). Although Sindh Province is more urbanized, per capita milk consumption is higher in Punjab, probably due to differences in consumer preferences and other factors not evaluated here.
1 In this analysis, cottonseed and rapeseed cakes represent purchased feed. Although fodder and purchased feed might have been used for non-dairy animals such as followers, the usual practice is to give preference to milking cows for better quality feeds, hence the aggregate feed quantities are expressed on a per milk cow basis.

Dairy Development in Pakistan
17
Figure 7: Sources and intensity of feed use for animals, 1960-2000.
0.00
0.02
0.04
0.06
0.08
0.10
0.12
1960 1972 1986 1996 2000Year
Tonn
es
0.000.020.040.060.080.100.120.140.160.18
Hec
tars
(ha)
Purchased feed per milking animal (tonnes), PunjabPurchased feed per milking animal (tonnes), SindhGreen fodder per milking animal (ha), PunjabGreen fodder per milking animal (ha), Sindh
Note: In this analysis, cottonseed and rapeseed cakes represent purchased feed.
Figure 8: Per capita milk consumption, Punjab and Sindh.
-0.020.040.060.080.100.120.140.160.180.20
1960 1972 1986 1996 2000
Year
Tonn
es
Per capita milk consumption, PunjabPer capita milk consumption, Sindh

Dairy Development in Pakistan
18
The degree of commercialization of Punjab’s and Sindh’s dairy sectors can be seen by observing the proportion of milk production that is sold (Tables 3, 4). In both provinces, the dairy sector steadily commercialized but Sindh, where the degree of commercialization was much lower than in Punjab between 1960 and the mid 1980s, has managed to catch up to Punjab’s levels, especially after the mid 1990s.
Two separate marketing institutions have developed in the two provinces; although they played a minor role with about 2% of the market share, they may have contributed to differential dairy growth. In Punjab, co-operatives initially developed by the public sector and later taken over by a self-managed entity, and another set of farmer groups promoted by a private sector dairy processing industry, both enhanced dairy growth by providing improved inputs and services and regular market outlets for products. In Sindh, the highly concentrated intensive peri-urban dairy production system emerged by creating a backward linkage to rural areas for feed and a forward linkage through informal milk marketing to urban consumers. This system supplies about 70% of Karachi’s milk consumption. As a result of the changes and developments in the demand and supply of dairy products, real milk prices have generally declined over the time period under study, benefiting the consumers (Figure 9).
Figure 9: Real prices and per capita consumption of milk, Punjab and Sindh provinces, 1960-2000.
Per capita milk consumption (kg) and real milk prices (Rs/li), Punjab and Sindh
0
50
100
150
200
1960 1972 1986 1996 2000
Kg
0
10
20
30
40
50
60
Rs/
li
Per cap.Consumption -Punjab (kg)
Per cap.Consumption -Sindh (kg)
Prices -Punjab (Rs/li)
Prices - Sindh(Rs/li)
Another aspect of the commercialization and development of the livestock sector has been the changes in the structure of purchases and sales in the milk markets. Informal traders and market agents handle about 90% and 85% of milk in Punjab and Sindh, respectively. These shares have remained relatively stable, in spite of a four- to seven-fold increase in milk production, because demand for processed milk and expansion of the formal sectors’ involvement in marketing remained fairly small. However, some structural changes have occurred with urbanization, as indicated by sources of purchases by consumers and sales outlets of producers. Share of total milk purchases by consumers from neighbourhood producers (i.e. producer to consumer sales) has marginally decreased while the share of milk purchased from traders as well as stores and supermarkets has increased (Tables 3, 4). The same trend is

Dairy Development in Pakistan
19
confirmed by looking at sales outlets of producers. Share of direct milk sales to consumers has decreased to some extent, share of sales to processing companies, co-operatives and societies has increased and sales to informal traders remain the largest outlet (3, 4).
A total of 3.3 million litres of milk is consumed daily in Lahore, of which 8% is handled by the formal processing sector, 20% by large-scale distributors, while the majority, 72%, is handled by small-scale milkmen in the informal sector: the informal sector plays a critical role in Lahore’s milk market.
Karachi has around 10.5 million inhabitants with daily milk consumption of 4 to 5 million litres, thus making it the biggest milk consumption market in all of Pakistan. Peri-urban areas and cattle colonies supply 70% of Karachi’s milk supply, with the balance coming from rural areas. Although peri-urban farmers sell their milk to both formal and informal channels, most of the milk is sold to traders in the informal sector under prior-agreements that remain valid for a year. Milk traders collect milk from farmers twice a day and deliver it to urban retail shops and also directly to consumers. Thus, an efficient and vibrant informal sector dominates Karachi’s milk market chain supplying fresh milk to urban consumers twice a day. Retail milk shops that are specialized in milk and milk products sell more than half of the milk in Karachi. Milk is usually kept in deep freezers or chillers for longer storage; on average each milk shop sells about 500 litres of milk daily. Unlike Lahore, in Karachi processed milk has a very small (less than 1%) market share due to raw milk prices that are almost double those in Punjab. The farm-gate milk price in peri-urban Karachi is PKR 22 per litre. Karachi also has a unique wholesale milk market that is well organized by the private sector: the Karachi Dairy Association controls the milk trade on a daily basis and announces milk prices twice a day after assessing trends in demand and supply. Brokers or commission agents in the wholesale milk market charge milk buyers and sellers a commission of PKR 25 for every 40 litres of milk.
Income and Employment Opportunities in Milk Production and Marketing
Income and Employment Opportunities in Milk Production Data from a survey conducted during 2002/03 were used for this analysis. The survey for Punjab region was conducted in rural and peri-urban areas of Lahore while the survey for Sindh was conducted in peri-urban areas of Karachi. Analysis was done for small-, medium- and large-scale farms, defined respectively as owning 1-2, 3-5 and more than 5 cows. However, peri-urban large dairy farms in Lahore own an average of 10 animals while in Karachi owners of about 10 animals are called ‘Large 1’ and those owning an average of 20 animals are called ‘Large 2’ in this study.
In Punjab, small-scale milk producers either own up to 0.5 hectares of land or are rural landless farm households whose main source of income is off-farm employment, mostly as seasonal workers on larger crop farms in the region. Most of the milk is consumed at home as raw milk or used to make products such as butter, ghee, milk-based drinks and yoghurt. Only surplus milk is sold to the local milkmen to supplement household incomes. Medium-scale milk producers sell about 80% of their milk output in local markets. Besides dairy farming, off-farm employment and cash crop production are also main sources of income. Large farms in peri-urban areas have the advantages of proximity to markets, which allows milk to be sold directly to consumers via home delivery, as well as to milk shops.
In Punjab employment per 1000 litres of milk produced declines as the scale of farm increases (Table 5). Large-scale milk producers in peri-urban areas use higher levels

Dairy Development in Pakistan
20
of labour input than large-scale rural producers. Small- and medium-scale producers employ 242 hired and 73 family workers, respectively, per 1000 litres of milk handled daily. No hired workers are employed by these farm types. Large-scale rural producers employ 8.9 hired workers and 17.8 family workers while large-scale peri-urban producers employ 52.7 hired and 26.4 family workers per 1000 litres of milk handled daily.
Small- and medium-scale producers obtain one-third of their total income from dairy activities, while large-scale rural and peri-urban producers obtain 30% and 100% of their income from dairy activities, respectively. Income earned from dairy activities increases with the scale of milk production, although there seems to be no significant association between levels of gross profit and the scale of production. Small-scale producers incurred a loss, medium-scale producers earned more than large-scale rural producers, while highest gross profit levels were attained by large-scale peri-urban producers.
Similar to the results in Punjab, employment per 1000 litres of milk in Sindh declines with the scale of farm (Table 6). On average, both groups of producers employed 86.4 workers per 1000 litres of milk produced daily (52.4 hired and 33.9 family workers). Milk producers in both groups obtain almost all of their income from dairy activities. Although income and gross profit levels are higher for the Large 1 group, gross profit per litre of milk as well as per labour hour is higher for Large 2 group.
Table 5: Employment and income from milk production in Punjab and Karachi.
Large-scale farms (>5cows) Punjab
Small-scale farms
(1-2 cows)
Medium-scale farms (3-5 cows) Rural
Peri-urban
All large-scale farms (>5cows)
Total milk produced on a daily basis (tonnes/everyday) 20,926 18,173 15,970
Self employment 242.1 73.0 17.8 26.4 22.1
Hired personnel 0 0 8.9 52.7 30.8
Rate of employment (fulltime jobs / 1000L of milk produced on a daily basis)
Both self and hired personnel 242.1 73.0 26.8 79.1 52.9
Self employment 5,066,191 1,326,600 352,937
Hired personnel 0 0 491,876 Projected total employment generated in Punjab Both self and hired
personnel 5,066,191 1,326,600 844,813
Gross profit from dairy (PKR/year) -1,953 16,075 8,592 184,225 96,409
Karachi Urban
Large 1 Urban
Large 2
Large-Scale farms
(>5cows) Total milk produced on a daily basis (tonnes/everyday) 6,740 7,414 8,312
Self employment 33.3 34.6 33.9
Hired personnel 55.5 49.4 52.4
Rate of employment generation (fulltime jobs / 1000L of milk produced on a daily basis)
Both self and hired personnel 88.8 84.0 86.4
Self employment 282,084
Hired personnel 435,934
Projected total employment generated in Punjab
Both self and hired personnel 718,018
Gross profit from dairy (PKR/year) 86,825 99,939 93,382
Source: Field survey.

Dairy Development in Pakistan
21
There are a total of 9.3 million farmers in Punjab region who produced 20.1 million tonnes of milk in 2002. About 3.9 million farmers (42%) are small-scale producing 38% of the milk. Medium- and large-scale milk producers in Punjab make up 37% and 21% of the farmers, and produced 33% and 29% of the milk, respectively (Figure 10). In Sindh, 3.9 million farmers produced 8.2 million tonnes of milk. Rural based small-scale producers account for 40% of Sindh’s milk producers, producing 30% of the region’s milk. Medium-scale producers represent 33% of the farmers and produced 33% of the milk, whereas large-scale farmers (in both rural and peri-urban areas) make up 27% of the milk producers and produced 37% of milk. The ratio of milk production by large-scale farmers is higher in Sindh compared to Punjab due to commercial peri-urban farming in the former, especially in Karachi and Hyderabad districts. In Sindh, 41% of milk produced was sold in 2002 compared to 26% in Punjab as producers in Punjab are more rural and they also process a larger amount of milk into ghee and yoghurt for both home consumption and sale.
Extrapolation of farm survey results to the province level indicate that the number of workers employed in milk production total 8.6 million in Punjab and 3.2 million in Sindh (Figure 11). The structure of employment is similar in both provinces, with most workers employed in small-scale milk production, fewer workers employed in medium-scale milk production and large-scale production employing the least number of workers.
Figure 10: Share of the total number of farmers and milk production by farm size in Punjab and Sindh, 2002.
Size distribution of farms and share of milk output, Punjab and Sindh, 2002
0
10
20
30
40
50
Punjab Sindh Punjab Sindh
PERCENT OF FARMERS SHARE OF OUTPUT
Perc
ent Small (1-2 cows)
Medium (3-5 cows)Large (6+ cows)

Dairy Development in Pakistan
22
Figure 11: Share of employment generation in milk production by farm size in Punjab and Sindh, 2002.
Employment in milk production, 2002 (number of workers)
0%
20%
40%
60%
80%
100%
Punjab (8.6 mill. workers) Sindh (3.2 mill. workers)
Small-scale milk producers Medium-scale milk producersLarge-scale milk producers
Income and Employment Opportunities in Milk Markets Data from a milk market survey conducted during 2003-04 in Lahore and Karachi were used for this analysis. The formal sector is comprised of modern milk processors producing UHT and pasteurized milk and other high-value processed dairy products, while the informal sector is mainly comprised of milkmen dealing with raw milk and traditional dairy products. The informal sector also includes milk collection agents and milk shops. Distributors (also part of the informal sector) are those who specialize in delivering pasteurized and UHT milk (and are hereafter simply referred to as distributors). Unlike the farm-level analysis, there is no distinction between small, medium and large scales of operation; formal processors and the informal sector represent marketing agents of various scales.
Data were collected on both direct and indirect job opportunities arising out of formal milk processing and informal milk marketing activities. Direct employment in the formal sector included all workers (both permanent and casual) employed directly by the dairy processors, while indirect employment entailed jobs generated in other businesses that provide services and inputs to the dairy processors. In the informal sector, direct employment included self, family and wage employment while indirect employment referred to persons involved in providing services to the informal milk market agents.
In Lahore the sampled distributors have utilized 93% of their working capacity, the rest of the informal sector and formal processors have on average utilized 88% and 52% of their working capacity, respectively (Table 6). Formal processors handle the highest quantity of milk per worker while the informal sector handles the least. However, the informal sector (the majority of which are small-scale milkmen) generates the highest amount of employment per unit of milk (9 jobs per 1000 litres of milk), compared to distributors and formal processors that generate 4 jobs and 3 jobs per 1000 litres of milk, respectively. Formal processors provide 336 direct jobs

Dairy Development in Pakistan
23
while the informal sector and distributors provide three and two direct jobs, respectively. Women constituted less than 1% of employees of formal processors; information on the proportion of women employees was not available for distributors and the informal sector. Formal processors generate 36 indirect jobs (gender division not available) while distributors and the rest of the informal sector generate no indirect jobs. Average salary per worker was higher for formal processors compared to salaries earned by distributors and traders engaged in the informal sector.
In Karachi, the informal (including small-scale milkmen and distributors) and formal sectors handle 93% and 7% of the total milk consumed in the city, respectively. Formal processors utilize only 23% of their working capacity. In contrast to Lahore, formal processors in Karachi generate the highest number of jobs per unit of milk (4 jobs per 1000 litres of milk) compared to the informal sector and distributors that generate 3 jobs and 1 job per 1000 litres of milk, respectively. One reason for fewer numbers of jobs per unit of milk handled in the informal sector is that milk production is mostly concentrated in the urban/peri-urban area in densely populated milk colonies so traders require less time to assemble and transport milk to the market; additionally they gain from large economies of scale. Information on the gender aspects of employment generation in Karachi was not available but is likely to occur mostly among men. Distributors earn the highest average monthly salary or wage per worker, whereas formal processors and traders in the informal sector, on average, earn similar monthly incomes.
Extending the survey results to the province level, in Punjab it is estimated that milk trading in the informal sector generates 158,600 jobs while milk-processing companies generate 3,100 jobs. Similarly, the informal sector in Sindh is more important in employment generation creating an estimated 32,600 job opportunities whereas processing companies only generate 4,200 jobs.
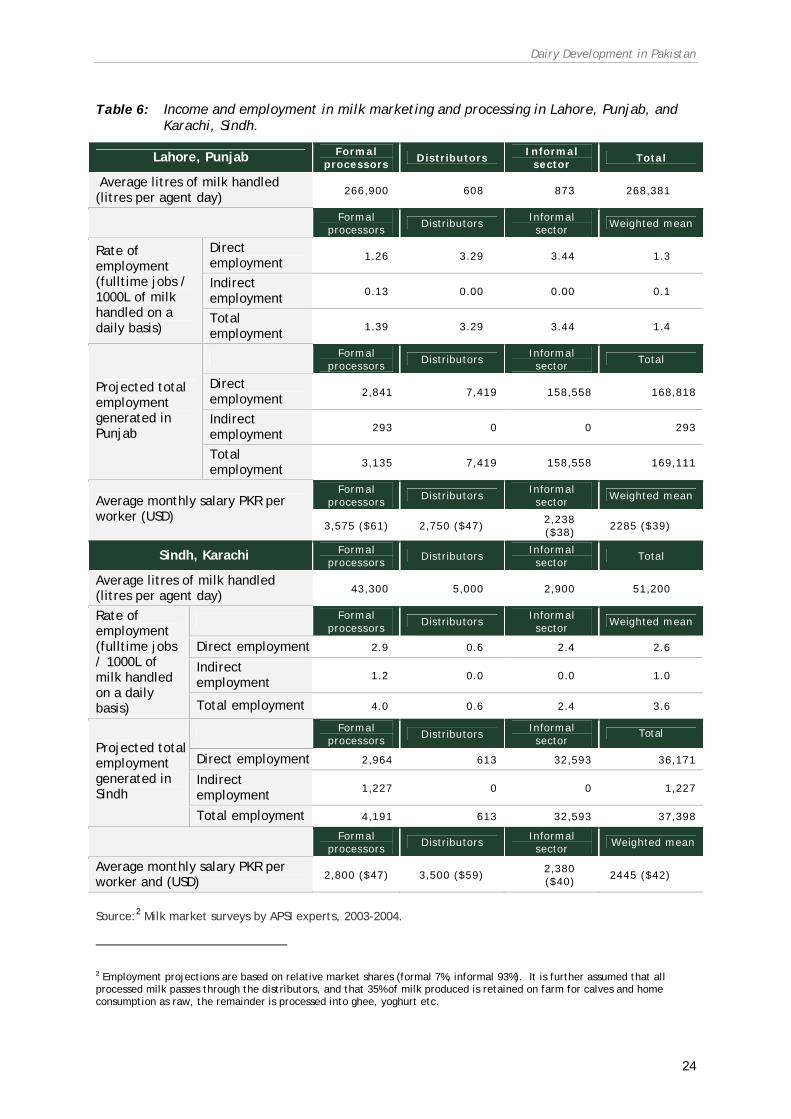
Dairy Development in Pakistan
24
Table 6: Income and employment in milk marketing and processing in Lahore, Punjab, and Karachi, Sindh.
Lahore, Punjab Formal processors
Distributors Informal
sector Total
Average litres of milk handled (litres per agent day) 266,900 608 873 268,381
Formal processors
Distributors Informal sector
Weighted mean
Direct employment 1.26 3.29 3.44 1.3
Indirect employment 0.13 0.00 0.00 0.1
Rate of employment (fulltime jobs / 1000L of milk handled on a daily basis)
Total employment 1.39 3.29 3.44 1.4
Formal processors
Distributors Informal sector
Total
Direct employment 2,841 7,419 158,558 168,818
Indirect employment 293 0 0 293
Projected total employment generated in Punjab
Total employment 3,135 7,419 158,558 169,111
Formal processors
Distributors Informal sector
Weighted mean Average monthly salary PKR per worker (USD)
3,575 ($61) 2,750 ($47) 2,238 ($38)
2285 ($39)
Sindh, Karachi Formal processors
Distributors Informal sector
Total
Average litres of milk handled (litres per agent day) 43,300 5,000 2,900 51,200
Formal processors
Distributors Informal sector
Weighted mean
Direct employment 2.9 0.6 2.4 2.6
Indirect employment 1.2 0.0 0.0 1.0
Rate of employment (fulltime jobs / 1000L of milk handled on a daily basis) Total employment 4.0 0.6 2.4 3.6
Formal processors
Distributors Informal sector
Total
Direct employment 2,964 613 32,593 36,171
Indirect employment 1,227 0 0 1,227
Projected total employment generated in Sindh
Total employment 4,191 613 32,593 37,398
Formal processors
Distributors Informal sector
Weighted mean
Average monthly salary PKR per worker and (USD) 2,800 ($47) 3,500 ($59)
2,380 ($40)
2445 ($42)
Source:2 Milk market surveys by APSI experts, 2003-2004.
2 Employment projections are based on relative market shares (formal 7%, informal 93%). It is further assumed that all processed milk passes through the distributors, and that 35% of milk produced is retained on farm for calves and home consumption as raw, the remainder is processed into ghee, yoghurt etc.

Dairy Development in Pakistan
25
Main Lessons from Pakistan’s Dairy Development
Identification of Effects of Key Factors and Policies on Dairy Development Trends From a historical perspective, two broad sets of policy measures influenced dairy sector growth directly and/or indirectly: (a) policies, institutions and programmes for improving dairy production and marketing, and (b) other policies that indirectly impacted the dairy sector.
Several policy, institution and programme areas stand out as major contributors to dairy development through improvement in production and marketing. First, increased public investment in extension, research and other support services, especially investment in artificial insemination, other breeding services and veterinary services, contributed significantly to yield and output growth by improving the genetics, health and overall quality of dairy animals.
Second, targeted dairy development projects in specific parts of the country that promoted use of improved feed, management and genetics, as well as dairy co-operatives that improved market access for inputs, services and products, contributed to dairy growth. A public sector-supported dairy co-operative project, namely Idare-e-Kishan, which later became more autonomous in terms of management, and a Nestlé (Pakistan)-led farmers’ group organization for delivery of improved technology and for marketing of milk, both developed in Punjab and played key roles in dairy development in that province.
Third, the policy of public sector investment in milk processing and marketing infrastructure was pursued in the 1970s to promote the formal sector milk market. This was done on the assumptions that there was demand for processed milk and that linking that demand backward to producers would contribute to rapid dairy growth. However, the investment in formal milk processing industry did not succeed in expanding formal milk marketing; consumers were not yet ready to pay for such value addition and tastes did not change as rapidly as anticipated. Later these enterprises were privatised and incentives were given though cheap credit and tax relief on imported machineries to establish processing plants. However, such incentives led to over investment and overcapacity as demand for formally processed dairy products has been increasing rather slowly.
Among the policies that indirectly impacted on the dairy sector, the promotion of Green Revolution technologies stands out clearly as it contributed to dairy growth from both supply and demand sides. On the demand side, higher cereal productivity and rural incomes enhanced demand for livestock products in the rural areas. Higher cereal productivity reduced real prices of cereals for urban consumers, enhancing their ability to increase consumption of dairy products. Green Revolution-induced demand growth acted as a pull-factor for dairy development. On the supply side, three interrelated factors emerged that contributed to enhance dairy growth. Mechanization of various farm operations at mature stages of the Green Revolution released draft animals thereby creating room for increased number of dairy cows to be raised with the available feed. Cattle were more used for draft purposes, so mechanization allowed an increase in the buffalo population and a higher milk yielding animal. Higher cereal productivity also released some land to increase production of green fodder for dairy animals. These factors together resulted in higher yield per animal and in higher output.
Second, overvalued exchange rate policies pursued in the 1960s protected the domestic market but stifled growth by giving a reasonable income from low productivity and providing a disincentive to invest in productivity improving technologies. Combined with this, the policy on high import duty on imported dairy

Dairy Development in Pakistan
26
products, mainly powdered milk, also stifled growth as it discouraged domestic producers to be competitive.
Third, a regulation that banned rearing dairy animals in urban centres changed the location of production and systems of marketing. Following the ban, dairy colonies were established in per-urban areas where intensive dairy farming practices have developed based on purchased feed - both concentrates and green feed sourced from rural areas. Also, a vibrant informal milk marketing system has emerged to serve urban consumers. Another important regulation is related to food hygiene and quality control. The existing food laws are ill-defined to meet the need of quality assurance for modern-day consumers and it is even more ineffective because of lack of enforcement of existing rules and procedures. Although the informal milk market plays a vital role in the industry, in the absence of proper regulations and enforcement and also in the absence of appropriate technology, this market channel does not satisfy most of the quality and hygiene concerns of consumers.
Milk production in the country is concentrated in Punjab and Sindh although growth patterns and trends in the two provinces were different. In both provinces milk production increased slowly until 1986 and thereafter increased very rapidly. Initially milk production per capita and per agricultural worker was much higher in Punjab but, by the mid 1990s, Sindh caught up with Punjab. These differences could be explained by a number of factors. First, the time path for dissemination of Green Revolution technologies, which contributed to dairy growth from both supply and demand sides, was different. It occurred earlier, faster and more widely in Punjab than in Sindh. Second, investment and promotion of improved dairy technology in terms of genetics, health and feeds were more intensive in Punjab than in Sindh. Third, public and private sector investment in building co-operatives and farmer groups for provision of inputs and services and regular market outlets were much more focused in Punjab than in Sindh.
Identification of Effects of Trends, Key Factors and Policies on the Poor Overall, given the developments that have taken place in the livestock sectors of Punjab and Sindh, it can be said that Pakistan’s dairy sector has evolved from a complementary enterprise in the smallholder mixed farming system to one that has become more specialized and commercialized; it is still in the process of further specialization and development. The effect of this dynamic process on the poor and the policies and institutions that made the process possible can be guessed at by looking at structural change in the production and marketing systems, the impact on employment and income and also opportunities that might have been lost due to certain policy measures.
With respect to change in the production structure, specialization and concentration has occurred primarily in the dairy colonies in peri-urban areas and in the peri-urban supply hinterland of the cities where intensive dairy farming is being practiced; average herd size has been increasing and is currently several times larger than in the remote rural areas. These farms captured a large proportion of the expanding urban market, which is largely served by the informal marketing channels involving mostly small- and medium-scale traders. In the rural areas, the livelihood of the majority of milk producers and marketing agents in Punjab and Sindh is based on small-scale milk production and milk marketing in the informal sector. Rural dairy production remains primarily a component of mixed farming systems in the country but the degree of commercialization has increased because average dairy herd size has been increasing slowly. This is apparently due to mechanization and replacement of draft animals with milk animals, adoption of more productive animals and, increasingly, larger number of farmers selling a larger proportion of their milk in the market. This phenomenon is observed more where co-operatives and farmer groups have created opportunities for access to improved inputs and technology as well as output market.

Dairy Development in Pakistan
27
Dairy growth resulted in lower real prices, which might have enabled more poor people to increase consumption.
With respect to income and employment effects, large-scale farmers as well as milk processors and distributors engaged in the urban/peri-urban production and marketing systems earn higher incomes than small- and medium-scale producers and milk traders in the informal sector in the rural areas. However, small-scale rural production and informal marketing created more jobs per unit of milk produced and marketed, so these producers and market agents created a much larger aggregate impact on the economy because of the involvement of a large number of people distributed over large geographical areas.
Policies that provided protection to domestic producers, e.g. the overvalued exchange rate and import tax on imports of dairy, and policies that promoted formal marketing and processing which did not materialize due to lack of demand, in effect resulted in lost opportunities for small-holder dairy producers. If the same public investment was made for building institutions and infrastructure to support smallholder dairy producers and informal market agents to help improve production and marketing over an extended period, the cumulative results could have been more beneficial for both rural producers and market agents and for urban consumers.
Identification of Policy Opportunities and Entry Points The findings narrated above point to a number of policy opportunities to facilitate dairy sector development, especially to use smallholder dairy as a tool for poverty alleviation and income and employment generation.
First, where livestock is a component of mixed farming system (as in Pakistan), there seems to be a clear sequence of crop and livestock development. There is evidence that significant development in the crop sector, in terms of production, productivity, input and output marketing and market infrastructure, should precede dairy and livestock development. This seems logical because both poor mixed farmers and urban consumers try to achieve energy security before they improve the quality of their diet with increased income. Once crop sector development generates income and marketable food surplus, attention can be given to deploy farm resources for improving productivity of livestock. The road and other market infrastructure, such as input marketing systems, created for crop sector development may complement dairy and other livestock development efforts, though new infrastructure and institutions specifically targeted to dairy and livestock also have to be created. Public policies and strategies that recognize this sequence and create integrated but balanced programmes and institutions to promote crop, livestock and other sub-sector development are likely to be more efficient and more successful.
Second, it is not necessary to establish large dairy farms, either in rural or peri-urban areas, to promote commercialization of dairy. High income and employment potential of small-scale dairy means that, if the necessary technologies are provided and market institutions are promoted for small-scale milk producers and market agents, overall employment and income generation can be increased which will enhance the welfare of the majority of the population engaged in milk production and marketing. This may create a momentum for change in dairy production and marketing structure in the country, propelled by general structural changes in the agricultural sector and the economy and most production units may gradually become larger.
Third, in spite of a substantial increase in dairy production, demand for processed dairy products still remains low; the informal market still supplies the majority of consumer demand. This is changing slowly but steadily with rapid urbanization and income growth and also due to changes in the marketing chain, such as the emergence of supermarkets. However, consumers in general are showing more concern about food quality, safety, convenience and hygiene in both formal and

Dairy Development in Pakistan
28
informal markets. Two sets of complementary policy interventions may be helpful for both producers, especially small-scale ones and consumers: (a) promote co-operatives and farmer groups for collection, bulking and marketing milk, irrespective of whether targeted to the processing industry or informal raw milk market. This has the potential to minimize risk, assure quality and reduce cost of marketing and pay attractive and stable price to producers. Such a policy may harmonize the complementary roles of formal and informal milk marketing and thus promote a more balanced and equitable dairy development pathway. And (b), given general public concern about adulteration and quality of milk and lack of properly defined regulations and enforcements to combat this problem, introduce licensing to informal traders and provide them with simple, appropriate technologies to extend shelf-life of raw milk. This will dissuade traders from using harmful additives and will encourage consumers to pay a price premium for assured quality within the limitations of informal marketing arrangements.
Fourth, generally urban and peri-urban dairy develop to meet urban consumer demand where poor road and other market infrastructure is a constraint for collection and delivery of milk from distant rural areas. Transportation of feeds from rural to urban and peri-urban areas may be less difficult but manure is not normally returned to the rural areas; a net nutrient transfer to urban areas deprive farmers from using manure for soil management and creates environmental management problems in urban areas. Over time, with expansion of road and communications network and with urban expansion and higher prices of land, urban and peri-urban dairy become less competitive. Moreover, urban public health and environmental regulations make operation of urban and peri-urban dairy more difficult and expensive; the result is that dairy relocates to rural areas. The emergence of dairy colonies in Lahore and Karachi can be similarly explained. However, public policy should discourage concentration and scaling-up of peri-urban dairy and encourage rural dairy for more equitable development.

29
DAIRY DEVELOPMENT IN INDIA
Vijay Paul Sharma, Alejandro Nin Pratt, Anjan Kumar, RajVir Singh and Steven Staal
Introduction
The livestock sector plays an important role in the national economy and also in the socio-economic development of millions of rural households in India. It has a strategic role in ensuring food and nutritional security, income and employment generation and in balancing rural inequity. The livestock sector has been among the few growth sectors in rural India and its contribution to GDP has increased from about 4.8% in 1980/81 to 5.6% in 2003/04. Though the share of agriculture in GDP has been consistently declining, the share of livestock in agricultural GDP has been increasing; from 14% in 1980/81 to over 25% in 2003/04 (National Accounts Statistics, 2005).
Among various livestock products, milk and milk products constitute a major share in the value of output from the livestock sector: in volume terms India is now the world’s largest milk producer. Dairy’s share of the total value from the livestock sector increased from about 49% in 1951/52 to some 70.8% in 2000/01 (equivalent to over USD 23 billion) followed by meat and meat products (15.6%), dung (7.5%) and eggs (2.8%) (Figure 12). Milk and milk products have emerged as the largest agricultural commodity category by value in recent years.
Figure 12: Share of different livestock products in total value output from livestock products, 2000-01.
Milk Group70.8%
Eggs2.8%
Dung7.5%
Others3.3%
Meat Group15.6%
Source: National Accounts Statistics, 2002
Dairy Development Policy
Agriculture, including the dairy sector, is a state responsibility; state governments are primarily responsible for development of the sector. Central government supplements the efforts of the state governments through various schemes for achieving accelerated growth of the sector. Though it is difficult to earmark the exact year for different phases, as a shift in policy action is often staggered over a number of years, we can divide government policies into three phases:

Dairy Development in India
30
• Pre-Operation Flood (pre-Independence through the 1960s)
• Operation Flood and pre-reform period (1970s-80s)
• Post-Operation Flood and post-reform period (1990s onwards)
A brief summary of major policy initiatives during the past few decades is given in Table 7.
Table 7: Summary of the Indian dairy sector policy and market environment.
Period Policy initiatives
Pre-Independence • Establishment of military dairy farms to supply the colonial army in early 1910s
• In 1928, the Royal Commission on Agriculture recommendation for breed improvement and some efforts towards breed improvement through artificial insemination
• Promotion of large farms in the big cities • A cattle colony established to supply to the Government Milk
Scheme in Bombay. Similar attempts at establishing cattle colonies in Calcutta and Madras
• Some private sector formal milk processing plants in major cities like Mumbai, Calcutta, Madras and New Delhi
Post-Independence Pre-Operation Flood (1950s-1960s)
• In the First Five Year (5Y) Plan, Key Village Scheme (KVS) implemented to improve breeding, feed and fodder availability, disease control and increase milk production.
• Promotion of government owned dairy plants and Delhi Milk Scheme (DMS) started in 1959
• Milk collection through own milk collection centres as well as through small milk vendors
• No major interventions for disease control except investments in veterinary hospitals and dispensaries
• Second 5Y Plan maintained and continued the same policies and strategies with no major changes
• Review of the KVS recommended adoption of crossbreeding on selective basis to rapidly increase the milk production
• Third 5Y plan, included emphasis on dual-purpose animals for milk as well as draft
• Implementation of Intensive Cattle Development Programme in high potential areas
• Third 5Y Plan (1961-66): 55 milk supply schemes for cities and industrial townships, eight rural creameries, six milk product factories established
• National Dairy Development Board (NDDB) set up in mid-1960s
Operation Flood and Pre-Reforms (1970s and 1980s)
• In a major policy shift, dairy development through producers' co-operatives and milk production based on milksheds in the rural areas became the emphasis
• Operation Flood Programme (OFP) launched with the help of World Food Programme, dairy commodity assistance from European Economic Community (EEC) and soft loan/credit from the World Bank
• Emphasis on provision of inputs like animal health care,

Dairy Development in India
31
vaccination, improved feed and fodder, breed improvement through artificial insemination
• National and Regional Milk Grids through linking surplus milk producing areas with deficit areas and urban consuming centres
• Establishment of Mother Dairies in Mumbai, Calcutta, Madras and Delhi and Government Milk Schemes co-existed
• Decline of City Milk Schemes and milk colonies • In 1989 Government of India launched a Technology Mission on Dairy
Development (TMDD) • Integrated Dairy Development Programme (IDDP) for promoting
dairy farming focusing mainly in non-OFP, hilly and backward areas • Protection to domestic industry from dairy imports through
quantitative restrictions on imports and exports, canalization, etc and protection to co-operative sector by prohibiting new private sector players into milk processing through licensing under Industrial Development and Regulation Act of 1951
Post-Operation Flood and Post-Reforms (1990s onwards)
• In 1991, dairy industry was de-licensed to encourage private investment and flow of capital and new technology
• In 1992, government promulgated the MMPO (Milk and Milk Products Order) under the Essential Commodities Act of 1955 and brought back the licensing requirements, including protection of co-operative sector
• In 1995, India became member of WTO and made commitments to remove restrictions on trade in dairy sector
• Non-tariff barriers on imports of skim milk powder (SMP) and butter oil removed in mid-1990s and on remaining products in subsequent years
• In 2002, the MMPO was amended and co-operative protections were removed but regulation on standards of quality and food safety retained
• Tenth 5Y Plan: major thrust on genetic upgrading of cattle and buffaloes, provision of health cover including creation of disease-free zones, provision of nutritious feed and fodder and production of quality milk and dairy products
• National project on cattle and buffalo breeding launched in 2000 • National Dairy Development Board (NDDB) evolved a Perspective
Plan 2010 to strengthen co-operative dairy sector
Pre-Operation Flood (Pre-Independence through 1960s) Outside of purely traditional systems, the earliest attempts at dairy development in India can be traced back to British rule, when the Defence Department established military dairy farms to ensure supply of milk and butter to the colonial army. This approach did not have any impact on the supply of milk to urban consumers, which was of major concern to civilian authorities but less important to the military. With the growth of populations in urban areas, consumers had to depend on milk vendors who kept cattle in these areas and sold their milk, often door-to-door.
To some extent, the Second World War gave impetus to private dairies with modestly modernized processing facilities. In the cities of Bombay, Calcutta, Madras and Delhi, and even in some large townships, processed milk, butter and ice-cream were available, though not on a large scale. These dairies were not concerned with improving breeds of dairy animals reared in rural areas but were content with

Dairy Development in India
32
contracting milk supplies through middlemen or their own staff. These early modern systems did not bring about any significant shifts in milk production, nor did they develop quality dairy animals. Despite some modernized processing facilities, milk and dairy product marketing remained informal.
In the post-independence era, with the initiation of India's first Five-Year Plan in 1951, modernization of the dairy industry became a priority for the government. The goal was to provide hygienic milk to the country's growing urban population. Initial government action in this regard consisted of promoting state-owned dairy plants to handle milk procurement, processing and marketing. In 1959, the Delhi Milk Scheme (DMS) was set up to supply milk to the urban population of Delhi. Though the collection was started from small-scale milk vendors initially, it ultimately ended up creating big contractors who purchased milk from the small-scale vendors and supplied it in bulk to the scheme. In the First Five-Year Plan, the Key Village Scheme (KVS), Integrated Cattle Development Project (ICDP) and some other programmes were launched to improve breeding, feed and fodder availability, disease control and milk production. The same policies and strategies continued in the Second Five-Year Plan. The Third Plan emphasized the need to develop dual-purpose animals for milk as well as draft use; crossbreeding of indigenous cattle was introduced during this plan.
During the 1960s, various state governments tried different strategies to develop dairying, including establishing dairies run by their own departments, setting up cattle colonies in urban areas and organizing milk schemes. Almost invariably, dairy processing plants were built in cities rather than in the milksheds where milk was produced. Such urban orientation to milk production led to the establishment of cattle colonies in Bombay, Calcutta and Madras. These government projects had extreme difficulties in organizing rural milk procurement and running milk schemes economically, yet none concentrated on creating an organized system for procurement of milk, which was left to contractors and middlemen. Inadequate milk collection required government-run dairy plants to use large quantities of relatively cheap, commercially-imported milk powder. The informal or unorganized sector consisting of milk vendors and contractors remained the dominant player. During the two decades between 1951 and 1970, the growth rate in milk production was barely 1% per annum (Table 8), while per capita milk availability was stagnant and sometimes declined.
Table 8: Annual growth rate (%) of production of major livestock products in India.
Period Milk Eggs Wool 1950/51 to 1960/61 1.64 4.63 0.38 1960/61 to 1973/74 1.15 7.91 0.34 1973/74 to 1980/81 4.51 3.79 0.77 1980/81 to 1990/91 5.68 7.80 2.32 1990/91 to 2004/05 3.95 4.46 2.01
Source: GOI (2004-05)
Operation Flood and Pre-Reforms Period (1970s – 1980s) The disappointing performance of the dairy sector during the 1950s and 1960s concerned policy makers, and the Government of India undertook new policy initiatives in this sector. Dairy development through producers' co-operatives and milk production based on milksheds in the rural areas, modelled on the successful experience of dairy co-operatives in Gujarat, became the cornerstone of the new

Dairy Development in India
33
dairy development policy. This policy initiative helped to turn the Indian dairy sector around and also led to several unarticulated spread effects.
The strategy for organized dairy development in India was conceived in the late 1960s after the National Dairy Development Board (NDDB) was founded in 1965, and rested on the Operation Flood Programme. During the 1970s, dairy commodity surpluses were building up in Europe and the potential was recognized for using the European surpluses as an investment in the modernization of India's dairy industry. With the assistance of the World Food Programme, food aid - in the form of milk powder and butter oil - was obtained from the countries of the European Economic Community (EEC) to finance the programme. Revenues generated from sales of the reconstituted dairy products were then reinvested in dairy development activities.
The Operation Flood Programme - a concessional import, reconstitution and co-operative development scheme - was designed to develop dairying by replicating the Anand Model of dairy development. The Anand Model included primary village co-operative societies linked to district and state co-operative unions for milk collection and processing and also for provision of animal health and breeding services. The first phase of Operation Flood was launched in 1970 and involved organizing dairy co-operatives at the village level; creating physical and institutional infrastructure for milk procurement, processing, marketing and production enhancement services at the district/union level; and establishing dairies in India's major metropolitan centres. The initial targets were India's major milksheds, linking them with the four main cities of Bombay, Calcutta, Delhi and Madras.
The second phase of the Operation Flood Programme was implemented between 1981 and 1985. Designed to build on the foundation laid in the first phase, it integrated the Indian Dairy Association-assisted dairy development projects, which were being implemented in some Indian states, into the overall programme. The third phase of Operation Flood, which was completed in 1996, aimed at ensuring that the co-operative institutions become self-sustaining and envisaged substantial expansion of processing and marketing facilities, extended milk procurement infrastructure, increased outreach of production enhancement activities and professionalization of management in the dairy institutions.
During Operation Flood, average milk procurement through co-operatives increased from less than 2.5 million kg per day during Phase I to nearly 11 million kg per day during Phase III, which was only about 6-7% of total milk production in the country. However, there are variations in the proportion of milk procured to total milk production across states. The striking pattern that emerges is the predominance of co-operatives in Gujarat and Maharashtra. In some other states, the success of Operation Flood co-operative development was mixed: this was due to a variety of factors including political interference in co-operative governance and competition from informal/traditional and private sector players.
In 1989, the Government of India launched a Technology Mission on Dairy Development (TMDD) to coordinate the input programmes for the dairy sector; TMDD ended in March 1999. An Integrated Dairy Development Programme (IDDP) in non-Operation Flood, hilly and backward areas was launched as a Centrally Sponsored Plan Scheme during the Eighth Plan and continued during the Ninth and Tenth Plans.
Despite all these efforts, the traditional sector remained the key player in milk marketing, handling about 90% of the total milk produced until the late 1980s. The share of the formal organized sector increased to about 15% in late 1990s.
To promote domestic production, India adopted an import-substitution strategy and protected the sector from external markets through means such as quantitative restrictions on imports and exports and canalization (restricting imports and exports through government or government-designated agencies). Competition within the

Dairy Development in India
34
formal sector was regulated through licensing provisions, which prohibited new entrants into the milk-processing sector.
Post-Operation Flood and Post-Reforms Period (1990s Onwards) The third phase of Indian dairy policy started in the early 1990s, when the Government of India introduced major economic policy reforms that favoured increasing privatization and liberalization of the economy. The dairy industry was delicensed in 1991 with a view to encourage private sector participation and investment. The government promulgated the Milk and Milk Product Order (MMPO) in 1992. This order required that any person/dairy plant handling more than 10,000 litres per day of milk, or 500 tonnes of milk solids per annum, must be registered. Through the milkshed concept, it also gave to the co-operative sector a means to exclude private investment if it was regarded as a competitive threat. In spite of the fact that amendments to the MMPO were made from time to time in order to make it more liberal and oriented to facilitate the private dairy entrepreneurs, concerns were raised about these government controls and licensing requirements that restricted large Indian and multinational players from making significant investments in this sector. As a consequence, in 2002 restrictions on setting up milk processing and milk product manufacturing plants were removed and the concept of the controlled milkshed was also abolished, removing the advantage that had been given to the co-operative sector. This amendment is expected to facilitate the entry of large companies, which will increase competition in the domestic markets.
Another major policy development in the Indian dairy sector occurred when India signed the Uruguay Round Agreement on Agriculture in 1994 and became a member of the World Trade Organization (WTO), which committed India to open up its agriculture sector, including dairy, to world markets. Until the signing of the Uruguay Round, agriculture including the dairy sector received special treatment under the General Agreement on Tariffs and Trade’s (GATT) rules through exemption, concessions and loopholes from most of the restrictions applying to manufactured goods. As a result, GATT allowed countries to implement measures disallowed for other sectors and enabled countries to maintain trade barriers. But as per the commitment under the WTO, the import and export of dairy products, which was restricted through quantitative measures (canalization, licensing, quotas) and other non-tariff barriers, was brought under the Open General License (OGL).
Imports and exports of dairy products were allowed freely by abolishing licensing requirements and canalization with certain inspection requirements. The first major step was taken in 1994/95 when import of skim milk powder and butter oil was decanalized and restrictions on the remaining products were removed from April 2002. Moreover, there has been a significant reduction in the import tariffs on dairy products after trade liberalization. However, India had bound its import tariffs for sensitive dairy products at low levels in the Uruguay Round schedules (Table 9). However, the imports of these products are allowed only against a sanitary import permit issued by the country of origin.

Dairy Development in India
35
Table 9: Applied and bound tariffs (%) on selected dairy products in India.
Applied as on April 2005 Bound
Fresh milk and cream 60 100 Butter and ghee 40 40 Cheese and curd 30 40 Milk powder 60 15-603 Yoghurt 30 150 Butter milk 30 150 Condensed milk 30 40 Dairy spreads 40 40
Source: Easy Reference Customs Tariff 2004-05.
The Indian dairy industry underwent substantial growth during the 1980s and 1990s: production of milk increased from 32 million tonnes in 1980/81 to 91 million tonnes in 2004/05. Buffalo and cow are both important dairy species with a share of 55% and 43%, respectively, in total milk output; goats account for most of the rest. Growth in total milk production, however, has decelerated marginally from 5.3% during 1980s to 3.95% from 1990-2004. The deceleration has been observed in the case of both cow and buffalo milk production. This rapid and sustained growth in milk heralded the country into an era of self-sufficiency towards the late 1990s; dependence on imports reduced considerably. This has not only made India the number one milk producer in the world, but also represents sustained growth in the availability of milk and milk products for the burgeoning population of the country. The per capita availability of milk has also increased to a level of about 232 grams per day; this is still low as compared to most developed nations or the world average of 285 grams per day, but is high compared to most developing countries.
However, throughout all of this period, the informal traditional sector has dominated and continues to play by far the largest role in the market, with a share of over 80% in the total market of milk and milk products (Dairy India 1997; Figure 13). In spite of its dominant role in the milk market, no concrete policy measures have been undertaken so far to give fillip to, or significantly constrain, the traditional sector involved in milk marketing and production of traditional Indian dairy products, some of which have tremendous potential in the domestic and export market. Nevertheless, small-scale informal market players are not completely unregulated; they are subject to state rules and regulations, which vary across states. Traditional market players are often required to obtain municipal licences and pay fees and other taxes where applicable, primarily based on their business activity rather than as a dairy enterprise.
3 India had committed zero bound rate of duty on milk powder, which was renegotiated with selected countries and a two-tier tariff structure (under Tariff Rate Quota TRQ) was finalized. If the imports are below 10,000 tonnes, the bound rate will be 15%; if imports exceed 10,000 tonnes the bound rate will be 60%.
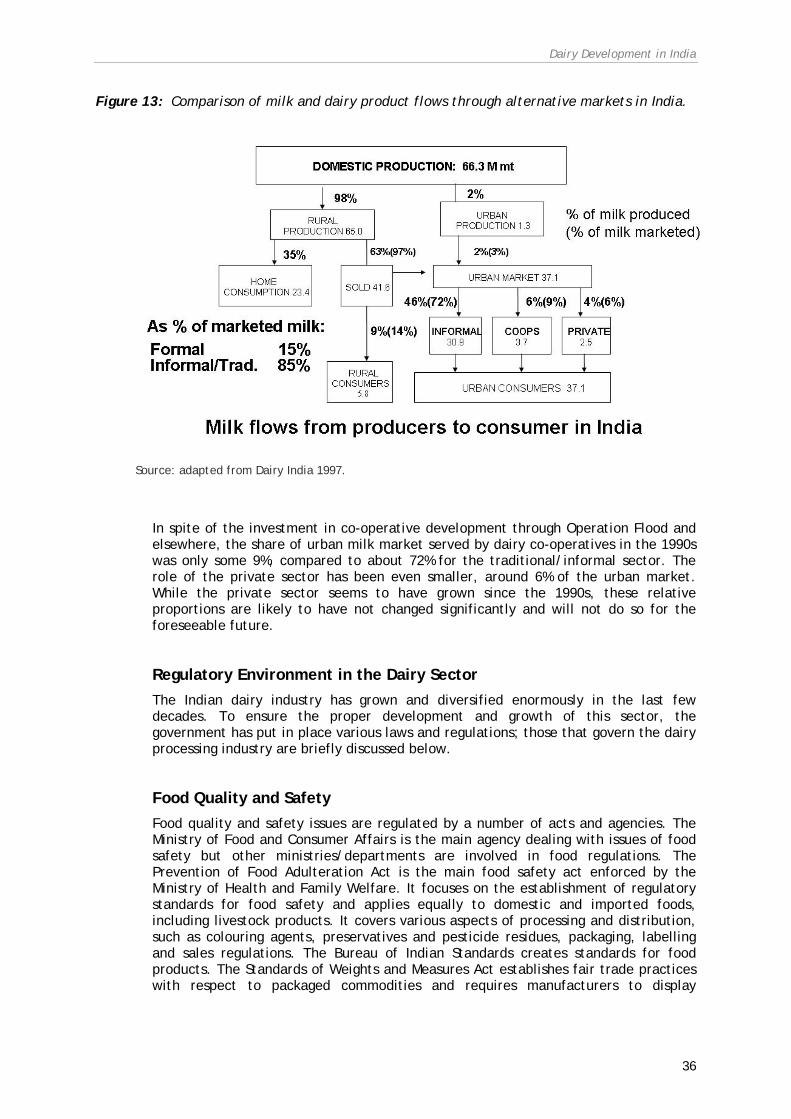
Dairy Development in India
36
Figure 13: Comparison of milk and dairy product flows through alternative markets in India.
Source: adapted from Dairy India 1997.
In spite of the investment in co-operative development through Operation Flood and elsewhere, the share of urban milk market served by dairy co-operatives in the 1990s was only some 9%, compared to about 72% for the traditional/informal sector. The role of the private sector has been even smaller, around 6% of the urban market. While the private sector seems to have grown since the 1990s, these relative proportions are likely to have not changed significantly and will not do so for the foreseeable future.
Regulatory Environment in the Dairy Sector The Indian dairy industry has grown and diversified enormously in the last few decades. To ensure the proper development and growth of this sector, the government has put in place various laws and regulations; those that govern the dairy processing industry are briefly discussed below.
Food Quality and Safety Food quality and safety issues are regulated by a number of acts and agencies. The Ministry of Food and Consumer Affairs is the main agency dealing with issues of food safety but other ministries/departments are involved in food regulations. The Prevention of Food Adulteration Act is the main food safety act enforced by the Ministry of Health and Family Welfare. It focuses on the establishment of regulatory standards for food safety and applies equally to domestic and imported foods, including livestock products. It covers various aspects of processing and distribution, such as colouring agents, preservatives and pesticide residues, packaging, labelling and sales regulations. The Bureau of Indian Standards creates standards for food products. The Standards of Weights and Measures Act establishes fair trade practices with respect to packaged commodities and requires manufacturers to display

Dairy Development in India
37
information about the nature of the commodity, date of manufacture and retail price on the label.
Besides these, there are a number of commodity-specific quality control orders issued under the Essential Commodities Act, such as the Milk and Milk Products Order for dairy products. This is applicable to both domestic and imported products and regulates the production, distribution and supply of milk products. It establishes sanitary requirements for dairy products, machinery and premises and establishes quality standards for milk and milk products. The Agricultural Products (Grading and Marketing) Act, 1937, commonly known as ‘AGMARK’, is enforced by the Directorate of Marketing and Inspection (DMI) under the Ministry of Rural Development. Under this act, grade standards are prescribed for agricultural and allied commodities. Grading under the provisions of this act is voluntary but manufacturers who comply with the standard are allowed to use ‘AGMARK’ labels on their products.
The fact that food safety regulations are enforced by these multiple agencies and acts is considered to be restrictive to growth of the food processing industry. Recognizing the growth potential of food processing and to create an enabling environment for value addition to agricultural products, the Government of India has taken an initiative to create a unified food law by merging/amending all the existing food laws and taking into consideration global food quality standards. The unified law, known as the Food Safety and Standards Bill, was introduced in the legislature in August 2005 and, after approval from parliament, all the prior acts/regulations related to food will be repealed. The proposed act will be implemented and coordinated by a single agency.
The export of milk, like other products, is governed by the Section 3 of the Export (Quality Control and Inspection) Act of 1963. The Export Inspection Council (EIC) of India was established under this act to ensure quality control of products for the export market. The EIC advises the government on measures to be taken to enforce quality control and inspection for exports. The EIC offers export inspection and certification services under the following systems: consignment-wise inspection; in-process quality control; or self-certification. Any one or more of the systems may be specified in the notifications of individual commodities. However, milk products, along with fish and egg products, are subject to mandatory export certification based on Food Safety Based Management Systems (FSMSC). The FSMSC is based on international standards of food safety management systems, such as HACCP/GMP/GHP, and involves approval and surveillance of food processing units. The EIC is also working to develop equivalence agreements with the official import control bodies of its major trading partners, as envisaged under the WTO’s Sanitary and Phytosanitary (SPS) Agreement.
Other Government Regulations
Industrial licence
No licence is required for setting up a dairy processing plant in India. A memorandum has to be submitted to the Secretariat for Industrial Approvals and an acknowledgment must be obtained. However, certificate of registration is required under the Milk and Milk Products Control Order, 1992.
Foreign investment
Foreign investment in dairying requires prior approval from the Secretariat of Industrial Approvals, Ministry of Industry, as dairying has not been included in the list of High Priority Industries. For High Priority Industries, automatic approval is given for up to 51% foreign investment, while in the case of other industries proposals are cleared on a case-by-case basis. The government may, at its discretion, allow 51%

Dairy Development in India
38
foreign ownership without enforcing the old limit of 40% which was applicable under Foreign Exchange Regulations Act.
Foreign technology agreements
Foreign technology agreements are freely allowed in high priority industries under certain conditions, although in the dairy sector these need prior approval.
Import of capital goods
Import of capital goods is automatically allowed if it is financed through foreign equity, otherwise approval is needed from the Secretariat of Industrial Approvals. Approval depends on the availability of foreign exchange resources. Import of second-hand goods is allowed subject to the following conditions:
• Minimum residual life of 5 years and the equipment should not be more than 7-years-old
• A certificate from a chartered engineer in the country of origin certifying the age and residual life
• Import allowed only for end users.
Export promotion
The Agricultural and Processed Food Products Export Development Authority (APEDA) is responsible for the promotion and regulation of exports of agricultural products, including livestock products. It provides support for export promotion and market development, strengthening of market intelligence and information channels, development of infrastructure and human resource capacity and modernization of processing facilities.
A new scheme called the Vishesh Krishi Upaj Yojana (Special Agricultural Produce Scheme) for promoting the export of agricultural products has been introduced in the five-year Foreign Trade Policy (FTP, 2004-09). The scheme has been extended to dairy/poultry and their value-added products in the FTP 2005-06. Under this scheme, exports of milk products are eligible for interest-free export credit of 5% of their value. This scheme has not made much dent in the export of milk products and it is felt that the level of incentive is not adequate.
Further, the Government of India provides Duty Drawback on products and goods exported by Indian manufacturers and merchant exporters on agro and milk products at varying rates. Although, skimmed milk powder, full cream milk powder and casein are all made from milk, the duty drawback benefit of 14% is allowed on casein alone. This has put skimmed milk powder and whole milk powder in a disadvantageous position in the export market.
Trade in Dairy Products Despite being the largest producer of milk in the world, India is a very small player in the world market. India had very little experience in the international trade of dairy products prior to the 1990s. Until the early 1970s, most of the demand-supply gap of liquid milk requirement for urban consumers was met by reconstituting imported butter/butter oil and milk powders. India started exporting surplus dairy commodities, such as milk powders, ghee and butter, in the 1990s. However, the exports of dairy products from India are negligible compared to both its own production and to international trade.
The import and export of dairy products was regulated through the Agricultural and Processed Food Products Development Authority until early 1990; in 2001 the government removed these restrictions and allowed free trade of most dairy
Dairy Development in India
39
products. India’s dairy product exports are occasional, primarily in the flush season. Although India exports a wide variety of dairy products, skim milk powder (63.3%), ghee and butter oil (11.7%) and whole milk powder (7.3%) remain the major export items. The exports of skim milk powder increased from 130 tonnes (1990/91) to a high of 6000 in (1994/95), but fell to 1350 tonnes (1997/98). These relatively small export figures clearly demonstrate that Indian exports are still in their infancy, although integration into global markets under WTO offers opportunities for increased dairy exports.
Livestock Population Trends India has one of the world’s largest livestock populations accounting for about 57% of the planet’s buffalo and 16% of cattle (GOI 2002). The growth pattern of the livestock population between 1951 and 2003 is given in Table 10. The cattle population increased until 1992, when it started declining. The turning point in the composition of the draft animal population was 1977 to 1982: at this time the male cattle population declined by over 12 million and the male buffalo population declined by some 2 million. Between 1992 and 2003 the cattle population declined by 9%, with the decline confined to indigenous stock that comprised 87% of the total cattle population in 2003. The number of indigenous cattle declined by 15%, while that of cross-breds increased by 62 percent4. Within the indigenous stock, the decline was particularly drastic for males (22%).
The main reasons for the decline in indigenous cattle are increasing substitution of draft animals with mechanical power and their low milk yield. This declining trend, however, is not uniform across the states: agriculturally advanced and more mechanized states, such as Punjab, Haryana, Andhra Pradesh, Kerala and Tamil Nadu, witnessed a sharper decline in working male population, while the less progressive and hilly states, such as Assam, Bihar, Madhya Pradesh, Orissa and West Bengal, showed increasing dependence on work animals. The population of buffaloes increased from 43.2 million in 1951 to 93 million in 2003, although growth in the buffalo population decelerated from around 2% per year during the 1970s and 1980s to around 1.2% thereafter. This is on account of faster deceleration in the growth of male buffalo population, which fell to 0.3% during the latter period from 0.7%. The proportion of females among the buffalo population has been increasing consistently and in 2003 accounted for about 55%.
The cattle crossbreeding programme, after an initial slow start during the 1960s, spread consistently and the population of cross-bred cattle has consequently been increasing over time. The number of artificial inseminations has gone up very significantly; from less than one million in the early 1970s to about 27 million in the late 1990s. The present production capacity of frozen semen is about 30 million doses against the estimated requirement of 65 million doses annually.
The share of cross-breeds in the total cattle population increased from 4.6% in 1982 to 10.1% in 1997 and reached 13.3% in 2003. Within these national trends there are significant regional variations: cross-bred cattle accounts for over 50% of total cattle in Punjab, Kerala, Tamilnadu, Sikkim and Nagaland; 25-50% in Haryana, Himachal Pradesh, Jammu and Kashmir and Mizoram; and 10-25% in Maharashtra, Bihar, Goa, Karnataka and Manipur, while in the rest of the states it is less than 10%. Apart from the introduction of exotic germplasm in cattle breeding, the native high-yielding Murrah buffalo has also been widely used for upgrading low-producing buffalo breeds in different regions of the country.
4 Cross-breds are defined as crosses of exotic cattle with indigenous cattle.

Dairy Development in India
40
Animal Health, Feeds and Fodder Policies With the improvement in the quality of livestock through the extensive crossbreeding programmes, the susceptibility of these animals to various diseases, including exotic ones, has increased. In order to reduce morbidity and mortality, efforts have been made to control diseases, such as rinderpest, foot-and-mouth disease, haemorrhagic septicaemia, black-quarter and anthrax, since the Second Five Year Plan. Although rinderpest has been eradicated from the country, the prevalence of other diseases continues to be a major problem. The creation of disease-free zones was sanctioned in the Ninth Plan but was not implemented.
There were only 1450 veterinary hospitals and dispensaries before the beginning of the First Five Year Plan, which increased to a network of 26,717 Polyclinics/Hospitals/ Dispensaries and 28,195 Veterinary Aid Centres (including Stockmen Centres/mobile dispensaries). These are supported by about 250 disease diagnostic laboratories, which are functioning in the States and Union Territories for quick and reliable diagnosis of diseases. A network of disease diagnostic laboratories is being put in place to collect information on prevalence of diseases and provide diagnostic services to help in control and eradication of diseases. However, there is no evidence of a significant decline in the disease incidence, which may be attributed to lack of emphasis on prophylactic measures.
Table 10: Growth pattern of livestock population in India: 1951-1992 (million).
Specie
1951 1956 1961 1966 1972 1977 1982 1987 1992 1997 2003
Cattle 155.3 158.7 175.6 176.2 178.3 180.0 192.5 199.7 204.6 198.9 178.9
Adult female cattle
54.4 47.3 51.0 51.8 53.4 54.6 59.21 62.07 64.36 64.4 59.2
Buffalo 43.4 44.9 51.2 53.0 57.4 62.0 69.78 75.97 84.21 89.9 93.2
Adult female buffalo
21.0 21.7 24.3 25.4 28.6 31.3 32.5 39.13 43.81 46.8 51.0
Total bovines
198.7 203.6 226.8 229.2 235.7 242.0 262.4 257.8 289.0 288.8 272.1
Total livestock
292.8 306.6 335.4 344.1 353.4 369.0 419.6 445.3 470.9 485.4 464.5
Growth rate (%/year)
1951-56
1956-61
1961-66
1966-72
1972-77
1977-82
1982-87
1987-92
1992-97
1997-03
Cattle 0.43 2.04 0.07 0.24 0.19 1.35 0.74 0.48 -0.56 -1.79
Adult female cattle
-2.76 1.52 0.31 0.61 0.45 1.63 0.95 0.73 0.02 -1.44
Buffalo 0.68 2.66 0.69 1.61 1.55 2.39 1.71 2.08 1.32 0.61
Adult female buffalo
0.66 2.29 0.89 2.40 1.82 0.76 3.78 2.28 1.12 1.47
Total bovines 0.49 2.18 0.21 0.56 0.53 1.63 1.01 0.94 -0.01 -1.01
Total livestock 0.93 1.81 0.51 0.53 0.87 2.60 1.20 1.12 0.65- -0.75
Source: Basic Animal Husbandry Statistics 2002, Department of Animal Husbandry and Dairying, Ministry of Agriculture, Government of India;17th Livestock Census (2003), Department of Animal Husbandry and Dairying, Ministry of Agriculture, Government of India.
Adequate supply of feed and fodders is essential for enhancing productivity in the dairy sector. Though production of high-quality fodder seeds has been a major focus since the early 1950s, India has a chronic deficit in feed and fodders. Animal feed

Dairy Development in India
41
production is mainly concentrated in the private sector, although co-operatives also manufacture and supply feed to farmers. Quality control measures are not very effective and poor quality of feeds has always been a problem.
According to the Tenth Five Year Plan, most livestock services, such as artificial insemination/natural service, vaccination and de-worming, are time-sensitive, which government institutions are not always able to deliver due to financial and bureaucratic constraints. This necessitates the provision for efficient and effective decentralized services which are in tune with demand from users. The government has emphasized the need for providing such services at the farmers’ door, linked with cost recovery to ensure economic viability.
Changing Demand Patterns for Dairy Products
Despite being the largest milk producer in the world, per capita availability and consumption of milk in India is still relatively low, although it is high by developing country standards. The per capita availability of milk, which declined slightly during the 1950s and 1960s (from 124 grams per day in 1950/51 to 121 grams in 1973/74) expanded substantially during the 1980s and 1990s and reached about 232 grams per day in 2004/05. Between 1983 and 1999/20005, per capita annual milk consumption increased from 43 kg to about 74 kg (Table 11). There is, however, considerable variation in consumption of milk across income classes and a strong positive association between quantity of milk consumed and income level.
Table 11: Per capita consumption of milk‡ and share of consumer expenditure spent on milk & milk products (kg per capita per year).
Rural Urban All
1983 37.0 55.5 43.0
1987-88 49.4 64.6 54.4
1993-94 54.7 65.2 58.6
1999-00 63.3 90.7 73.5
Share of milk and milk products in household consumption expenditure (%)
1983 7.6 9.5 8.4
1987-88 9.0 9.7 9.3
1993-94 9.7 9.6 9.6
1999-00 9.0 8.9 8.9
‡ includes milk and milk products (converted into milk equivalent). Source: Kumar and Birthal (2004)
Milk is consumed in a variety of forms, either as liquid milk or as processed products, such as ghee, curd, butter and sweets, but the milk utilization pattern in the country has changed over the years (Figure 14). The share of liquid milk in total milk consumption increased from 39.3% in 1951 to 45.7% in 1995, whereas the share of ghee (clarified butter) has declined from 39.3% to about 27.5% during the same period. The share of other products showed a significant increase from barely 2% in
5 Consumption data available only up to 1999-2000

Dairy Development in India
42
1951 to about 7% in 1995; this might be attributed to an increase in production of Western dairy products such as ice-cream, cheese, chocolates, milk powders and other dairy-based products. As may be observed, the market is shifting in favour of cheese, butter and other products and away from ghee. Demand for traditional dairy products like paneer, chhena, khoa and gulab jamun has increased; modern formal processors, recognizing the powerful demand for traditional products, have increasingly entered these markets, competing with the small-scale traditional sector.
Several factors have contributed to the increased demand for milk and dairy products in the country, including the strong cultural significance of milk in India where a large proportion of the population is lacto-vegetarian. The demand for milk and dairy products is income elastic; growth in per capita income is expected to increase demand for milk and milk products. Urbanization and changing food habits and lifestyles have also reinforced growth in demand for dairy products. Further, per capita consumption of milk is 1.5-times higher among urban households than rural households. Nevertheless, the per capita consumption of milk has been increasing faster in the rural areas. Between 1983 and 1999, consumption of milk increased by 71% in rural households and 63% in urban households. This suggests that, although urbanization would remain a key driver of demand, sustained growth in rural incomes would fuel rapid growth in rural demand for livestock products.
In 1999/2000 livestock products accounted for 12.9% of the total household consumption expenditure of rural households. This is slightly higher than that of urban households (12.6%). In rural areas, the share of livestock products increased from 11.0% in 1983, to 13.1% in 1987/88 and to 13.9% in 1993/94, and then slightly declined to 12.9%. In urban areas, however, it increased slightly during 1980s, but declined during 1990s. Both the rural and urban consumers spent about 70% of the total allocation to livestock products on milk and dairy products.
Given the relatively high income elasticity, the demand for milk and dairy products is expected to grow rapidly. A study conducted by Saxena (2000) using National Sample Survey (NSS) data for 1993-94 showed that the income elasticity of demand for milk and milk products is higher in rural areas (ranging from 1.24 in Punjab to 2.92 in Orissa) than in urban areas (ranging from 0.99 in Punjab to 1.78 in Bihar). Nationally, the income elasticity of demand is 1.96. Further increases in per capita income and changing consumption patterns would be expected to lead to an acceleration in demand for milk and other livestock products in India and thus would give a boost to this sector. Some other estimates are shown in Table 12.
Table 12: Income/expenditure elasticity of demand for milk in India.
Source Rural Urban Demand for milk by 2020 (million tonnes)
Radhakrishna & Ravi (1992) 1.15 0.99 - Gandhi and Mani (1995) 1.70 1.06 - Kumar (1998) - - 126.0 - 182.8@ Saxena (2000) 1.96 1.32 85.7# Delgado et. al. (2001) - - 132.0 Dastagiri (2001) 1.36 1.07 147.21
Note: #: Estimates for 2007-08; @: Estimates based on 4% growth in GDP (126.0), 5% growth (142.7) and 7% growth in GDP (182.8)

Dairy Development in India
43
Figure 14: Changes in milk utilization patterns in India, 1951 and 1995.
1951
Liquid milk39.3%
Ghee39.3%
Khoa4.4%
Butter6.0%
Curd8.8%
Others2.2%
1995
Others7.0%Curd
7.0%
Butter6.6%
Khoa5.6%
Ghee27.8%
Liquid milk46.2%
Source: Dairy India 1997
Analysis of Regional Differences in Dairy Development in India
In this section, a comparison of dairy development across states and districts within states in India is conducted in order to determine what factors explain differences in development (commercialization) of the dairy sector. First, a comparative analysis is performed to find differences in the levels of different factors affecting development of the dairy sector in different states. This is complemented by a regression analysis using a database containing information for districts within ten states and three years (1982, 1987 and 1992).
Comparing Dairy Development across States To compare dairy development regionally, a dataset with information for the years 1972, 1977, 1982, 1987, 1992 and 1997 is used. The information is available at the

Dairy Development in India
44
district level but not all districts are available in all states; the figures presented do not necessarily represent total values for the state but only for districts available. Although the dataset covers 10 states and approximately 250 districts, the total number of variables in this dataset is limited; only a partial picture of some of the main factors affecting the development of the dairy sector can be presented. One of the main limitations of the dataset is that figures for milk production are only given for two years (1982 and 1997) and only for some states. Because of this, an indicator of development of the dairy sector that does not use production figures was defined.
Using a variation of the discussion in the conceptual framework (see Part 1 of this series and the Executive Summary in this report), development of the livestock sector can be associated with increased production per agricultural worker. At early stages of development, the number of animals per worker would increase as smallholders increase their animal stock. Later in the process, increased production per animal and decreasing number of agricultural workers should keep the growing trend of milk production per worker. If this is the case, then the number of milking animals per worker is not a good indicator of development, given that it can decrease while productivity grows. In fact, this is what happened in India over the past years6.
Even if the total number of milking animals per worker is decreasing there might be differences in growth in different species and animal types. The analysis of the data shows that decreases in the number of milking animals per worker are explained by decreases in the number of milking cows, while the number of milking buffaloes is growing. The other growing category in the animal stock is the number of cross-bred cows, which captures changes in productivity and reflects growth in output per worker. A larger number of cross-bred cows per worker would reflect a more commercialized dairy sector; one using improved technologies and producing more milk per agricultural worker. An indicator using number of cross-bred cows and number of milking buffaloes per worker might better capture the expansion of the dairy sector if, for example, growth of the dairy sector in some regions is based on the expansion of milking buffaloes while in others growth occurs through technical change and the spread of genetically improved cattle.
Based on this, we define an index that combines the number of cross-bred cows with the number of milking buffaloes per worker in agriculture to be used as our indicator of development of the dairy sector7. Independent variables included in the analysis relate to developments of the crop sector, population density, literacy, labour market and infrastructure, income and policy, following the conceptual framework.
6 Regressing the log of the number of milking animals per worker against a time trend we obtain a negative and significant coefficient, showing that the number of milking animals per worker is decreasing through time in our sample.
7 The index is calculated assigning numbers from 1 to N to the district with lowest and highest number of cross-bred cows per worker in agriculture respectively, and repeating this for the number of milking buffaloes so that each district has two numbers assigned: one for the number of milking buffaloes and one for the number of cross-bred cows per worker. The final index results from adding these two numbers which mean that cross-bred cows and milking buffaloes contribute to the index with equal weight.

Dairy Development in India
45
Figure 15: Index of the number of cross-bred cows and milking buffaloes per worker as a measure of development of the dairy sector plotted against GDP per capita.
3
3.2
3.4
3.6
3.8
4
4.2
4.4
4.6
4.8
5
7.4 7.5 7.6 7.7 7.8 7.9 8 8.1 8.2 8.3 8.4 8.5 8.6 8.7 8.8 8.9
Log of GDP per capita (Rupees per month)
Inde
x of
hyb
rid c
ows a
nd m
ilkin
g bu
ffalo
s pe
wor
ker
PunjabHaryana
MaharashtraTamilnadu
GujaratKarnatakaAndhra Pradesh
Uttar Pradesh
Rajasthan
Madhya Pradesh
Figure 15 shows the relationship between GDP per capita of the states included in the analysis and the index of the number of cross-bred cows and milking buffaloes per worker. As expected, there is a positive and statistically significant relationship between these two variables. Punjab and Haryana appear to have the largest number of cross-bred cows and milking buffaloes per worker and they are within the group of four states with the highest income per capita (Punjab, Haryana, Maharashtra and Gujarat). Tamilnadu and Karnataka also have a relatively high income, although below the group of four states mentioned above. The poorest states in our sample are Andhra Pradesh, Maydha Pradesh, Uttar Pradesh and Rajasthan.
The relationship between the number of cross-bred cows and milking buffaloes per agricultural worker and income shows that Gujarat, Karnataka, Rajasthan and Andhra Pradesh have values for this indicator that are close to what is expected according to their level of income (Figure 15). Punjab, Haryana and especially Uttar Pradesh, appear to have a more developed dairy sector than expected, while Maharashtra, Tamilnadu and Madhya Pradesh have a less developed dairy sector than expected, according to their respective incomes.
Table 13 compares information for the states included in this analysis to explain differences in development of the dairy sector across states. Two groups of states were defined according to the value of the index of cross-bred cows and milking buffaloes per worker: Punjab, Haryana, Uttar Pradesh and Gujarat show higher values for this indicator (Group 1). While Table 13 presents values for several variables for each state, Table 14 shows averages for each group and variable. The difference between the average values of the variables in groups 1 and 2 (in percentage terms) is presented in the last column of Table 14.

Dairy Development in India
46
Table 13: Indicator of development of the dairy sector and variables affecting development for different states grouped by level of development indicator (Index of the number of cross-bred cows and milking buffaloes per worker in agriculture).
Group 1 Group 2 Variable
Punjab Haryana UttarP Gujarat Maharashtra Karnataka Rajasthan AndhraP Tamilnadu MadhyaP
Index cross-bred cows + milking buffaloes/worker 114 106 82 78 63 62 60 60 53 35
Cross-bred cows/worker 0.47 0.28 0.09 0.03 0.1 0.06 0.01 0.03 0.14 0.01
Milking buffaloes/worker 0.979 0.711 0.324 0.388 0.159 0.211 0.407 0.236 0.108 0.185
Urbanization 30 25 20 34 39 31 23 27 34 23
GDP per capita (INR/month) 5079 4516 2023 4505 5690 3109 2621 2521 3454 2286
Annual growth of GDP per capita (%) 2.8 2.6 1.6 7.8 6.8 3.5 4.4 3.7 5 3.9
Population density 3.27 3.26 3.67 1.78 1.76 1.91 1.1 1.93 3.43 1.16
Rural workers/population 0.2 0.2 0.27 0.23 0.33 0.29 0.28 0.36 0.29 0.36
Road density (km per hectare) 8.81 5.22 2.55 3.59 5.3 7.08 1.94 5.31 12.4 2.14
Crop area under irrigation (%) 762 634 380 142 80 115 147 147 208 108
Fertilizer per hectare of crops (kg) 238 190 73 39 37 43 16 55 67 18
Literacy rate (%) 42 40 28 42 43 38 23 29 47 28
Cattle/Buffalo 0.31 0.34 0.67 0.67 1.84 1.66 1.08 0.53 2.1 2.5
Milking animals/stock 0.51 0.36 0.34 0.41 0.36 0.34 0.41 0.34 0.35 0.33
Rain (mm per year) 901 602 1086 793 1145 1170 642 878 998 1205

Dairy Development in India
47
Table 14: Average values for the indicator of development of the dairy sector and variables affecting development for two groups of states.
Variable Group 1a/ Group 2 G1 - G2 (%)
Cross-bred cows/worker 0.22 0.06 279
Milking buffaloes/worker 0.60 0.22 176
Index cross-bred cows + milking buffaloes/worker 95.00 55.50 71
Urbanization 27.25 29.50 -8
GDP per capita (INR/month) 4030.75 3280.17 23
Annual growth of GDP per capita (%) 3.70 4.55 -19
Population density 3.00 1.88 59
Rural workers/population 0.23 0.32 -29
Road density (km per hectare) 5.04 5.70 -11
Crop area under irrigation (%) 479.50 134.17 257
Fertilizer per hectare of crops (kg) 135.00 39.33 243
Literacy rate (%) 38.00 34.67 10
Cattle/Buffalo 0.50 1.62 -69
Milking animals/stock 0.41 0.36 14
Rain (mm per year) 845.50 1006.33 -16
a/ Group 1 is the group of states with highest number of cross-bred cows and milking buffaloes per worker in agriculture
Major differences between groups 1 and 2 are revealed in irrigation and use of fertilizer. Smaller but still significant differences occur in the proportion of milking buffaloes to milking cattle and population density. These results suggest that development of the crop sector and the infrastructure related with this development during the period of the Green Revolution have played a key role in the development of the dairy sector. Punjab and Haryana, with the largest value of the dairy development index and the highest income per capita, were at the epicentre of the Green Revolution which also extended, although in a lesser degree, to Maharashtra, Gujarat and parts of Uttar Pradesh. Tamil Nadu in the south benefited from high-yielding rice varieties. The poor states of Andhra Pradesh, Madhya Pradesh and Rajasthan did not benefit as much from the period of agricultural-led growth, showing the least developed dairy sector and the lowest income per capita, although they have the agro-climatic potential (at least in part of their territory) to yield high returns in agriculture (Sachs et al. 2002).
It is important to notice that development of the crop sector and infrastructure affects the dairy sector from both the supply and demand side. The Green Revolution states with better infrastructure and high crop production are more likely to have better developed markets for feed (lower transaction costs). This development of the crop sector is also associated with higher income and higher demand for dairy products.
Two interesting comparisons are those between Uttar Pradesh and Madhya Pradesh and between Gujarat and Haryana. Uttar Pradesh is the poorest state in our sample with a relatively developed dairy sector given its level of income; Madhya Pradesh has a similar income to Uttar Pradesh but the least developed dairy sector in our group of

Dairy Development in India
48
states. Gujarat and Haryana are states with high income per capita, with Haryana showing a less developed dairy sector.
Table 15 summarizes the results of these comparisons. The value of the dairy development index, the number of cross-bred cows and the number of milking buffaloes per worker in Uttar Pradesh are 134, 682 and 75% higher, respectively, than in Madhya Pradesh, even though it is the state with the lowest income per capita and has similar levels of urbanization and infrastructure as Madhya Pradesh. However, hectares under irrigation and the use of fertilizer are three- to four-times larger in Uttar Pradesh than in Madhya Pradesh, showing again the importance of development of the crop sector as a factor explaining development of the dairy sector. Punjab’s dairy development index is 81% higher than that for Maharashtra and has 374 and 515% more cross-bred cows and milking buffaloes per worker, and at the same time has a larger irrigated area and fertilizer usage than Maharashtra.
Table 15: Comparison of values for the indicator of development of the dairy sector and variables affecting development between Punjab and Maharashtra and Uttar Pradesh and Madhya Pradesh.
Comparison Punjab-Maharashtra Comparison Uttar Pradesh - Madhya Pradesh
Punjab Maharashtra Punjab-
Maharashtra (%) Uttar
Pradesh Madhya Pradesh
Uttar P. - Madhya P
(%)
Index cross-bred cows + milking buffaloes/worker 114.00 63.00 81 82.00 35.00 134
Cross-bred cows/worker 0.47 0.10 374 0.09 0.01 682
Milking buffaloes/worker 0.98 0.16 515 0.32 0.19 75
Urbanization 30.00 39.00 -23 20.00 23.00 -13
GDP per capita (INR/month) 5079 5690 -11 2023 2286 -12
Annual growth of GDP per capita (%) 2.80 6.80 -59 1.60 3.90 -59
Population density 3.27 1.76 86 3.67 1.16 216
Rural workers/population 0.20 0.33 -39 0.27 0.36 -25
Road density (km per hectare) 8.81 5.30 66 2.55 2.14 19
Crop area under irrigation (%) 762 80 853 380 108 252
Fertilizer per hectare of crops (kg) 238 37 543 73 18 306
Literacy rate (%) 42 43 -2 28 28 0
Cattle/Buffalo 0.31 1.84 -83 0.67 2.50 -73
Milking animals/stock 0.51 0.36 42 0.34 0.33 3
Rain (mm per year) 901 1145 -21 1086 1205 -10
Results so far show that developments in the crop sector, which are attributed to the Green Revolution, have played a key role in boosting the development of India’s dairy sector. As a result, states with more developed crop sectors, higher use of fertilizers and larger irrigated crop areas have more developed dairy sectors.

Dairy Development in India
49
However, our analysis has not considered the role of policy in the development of the sector: starting with Operation Flood in 1970/1971, this should have played a major role in this process. In order to include the policy and institutional dimension in the analysis, a second dataset is used to study the effect of co-operatives on dairy sector development. This dataset includes information on the average quantity of milk procured by co-operatives (in litres per day) for the year 1997, for which data were available. Only districts with information on milk procured by co-operatives are included in this database.
Figure 16: Milk procured to co-operatives and development of the dairy sector measured as number of cross-bred cows per worker in agriculture by state.
0
0.1
0.2
0.3
0.4
0.5
0.6
0.7
0.8
Punjab Haryana Uttar Pradesh Maharashtra Gujarat Karnataka Andhra Pradesh Rajasthan0
100
200
300
400
500
600
Liters of milk to coops per milking cow Number of hybrid cows and milking buffalos per worker
Figure 17: Relationship between milk procured by co-operatives and development of the dairy sector measured as an index of the number of cross-bred cows and milking buffaloes per worker in agriculture (district level).
3
3.5
4
4.5
5
5.5
6
6.5
7
-5 -4 -3 -2 -1 0 1
Log of milk to coops in liters per milking cow and per day
I nde
x nu
mbe
r of h
ybrid
cow
s and
milk
in
buffa
los p
er w
orke
r

Dairy Development in India
50
The quantity of milk procured to co-operatives per milking animal (Figure 16) provides a measure of the importance of co-operatives in each state. Gujarat, Maharashtra and Karnataka, followed by Andhra Pradesh and Punjab, are the states where most milk is procured by co-operatives, while Haryana, Uttar Pradesh and Rajasthan rank the lowest. No information was available for Tamilnadu and Madhya Pradesh.
Figure 16 does not show a clear relationship between development of the dairy sector and milk procured by co-operatives. In order to assess this relationship, Figure 17 plots the average quantity of milk procured by co-operatives per milking animal (in litres) against the index of cross-bred animals and milking buffaloes per agricultural worker at the district level. Data used are for 250 districts in the states shown in Figure 17. The results suggest that there is a small but positive relationship between milk procured by co-operatives and the indicator of dairy development. However, this result is not consistent, as demonstrated by the data for Punjab, Haryana and Uttar Pradesh, which have the highest levels of improved dairy animals yet relatively low levels of dairy co-operative activity.
Determinants of Dairy Development Information available for districts in several Indian states does not cover all variables affecting developing of the dairy sector but gives a partial picture of some of the main factors affecting this development. In this section, a regression analysis is conducted relating the indicator of development of the dairy sector used in the previous section to some of the factors affecting this development. The total number of observations in our database is 670, covering information for districts in 10 states and three years (1982, 1987 and 1992). The dependent variable, as defined above, was regressed against variables representing development of the crop sector, infrastructure, literacy, labour market, climate, stock composition, urbanization, income and dummy variables that capture changes in policy. Given that data on co-operatives were available only for some of the districts, a second database was used to regress the dependent variable against a similar set of independent variables, but also including a new variable measuring the importance of co-operatives in the dairy sector of the different districts. This database covers the same years as the first database but includes a smaller number of districts in most states and no information for Tamilnadu and Madhya Pradesh. The total number of observations in this database is 294.
Table 16 presents the result of the first regression using the log of the index of cross-bred animals and milking buffaloes per worker in agriculture as the dependent variable for the years 1982, 1987 and 1992. The table also presents the results of regressing the number of cross-bred cows and the number of milking buffaloes per worker using the same set of independent variables. According to our results, the main factors contributing to development of the dairy sector are: development of the crop sector as reflected in the significance of the coefficients for irrigation and fertilizer use; the proportion of cross-bred cows in total milking cows and the proportion of milking buffaloes in total number of buffaloes. The relationship between dairy development and the ratio of agricultural workers to total population is negative and significant. A negative relationship also occurs between the dependent variable and road density.

Dairy Development in India
51
Table 16: Parameter estimates for dairy development in Indian district level information for years 1982, 1987, and 1992, three different dependent variables.
Dependent Variable Index cross-bred cows-milking buffaloes per
worker
Cross-bred cows per worker
Milking buffaloes per worker
Estimated coefficient Estimated coefficient Estimated coefficient
Fertilizer per hectare of crops (kg) 0.07** 0.40** 0.07**
Road density (km per hectare) -0.07* 0.13 -0.02
Population density -0.02 0.52** 0.01
Crop area under irrigation (%) 0.15** -0.08 0.19**
GDP per capita 0.19 0.11 0.27
Urbanization (%) 0.93 1.41 -0.01
Annual growth of GDP per capita -0.01 0.77** -0.04
Rural workers/population -0.44** -0.40** -0.72**
Literacy rate (%) -0.03 0.21 -0.10
Milking cows/total cattle 0.06 0.54** -0.24**
Cross-bred/milking cow 0.13** - -0.07**
Milking buffaloes/total buffaloes 0.56** -0.50** 1.07**
Rain (mm per year) 0.06* -0.01 -0.06
Trend -0.01 0.00 0.00
Dummy 1990s 0.05 0.02 0.12*
Policy dummy a/ 0.00 -0.03 -0.03
Andhra Pradesh -0.13 -0.84* -0.30*
Gujarat -0.11 -1.57** 0.03
Haryana 0.41** 0.85* 0.83**
Karnataka -0.05 0.36 -0.19
Madhya Pradesh 0.08 -0.70 -0.25
Maharashtra -0.16 -0.06 -0.12
Punjab 0.13 2.01** 1.29**
Rajasthan 0.21 -1.17 -0.05
Tamilnadu -0.46 0.01 -0.89**
Constant b/ 28.33 -16.36 5.51
R2 0.76 0.66 0.75
Notes: a/ Takes value of 1 for the year 1992 and for states conducting macro policy reforms according to Sachs et al (2002). b/ Constant term represents the average effect of all regions. Effects of states on dairy production are obtained by adding the state coefficient and the constant term.
GDP per capita, urbanization, the ratio of milking cows to cattle and the rainfall are positively related to the dependent variable, while population density, GDP growth and literacy show a negative relationship with the dependent variable. However, the coefficients are not all statistically significant.
Policy changes at the macro level during the 1990s are introduced in the analysis in the form of a dummy variable: this is defined with a value of one for the year 1992,

Dairy Development in India
52
but only for the reform-oriented states (Maharashtra, Tamilnadu, Gujarat, Karnataka and Andhra Pradesh, as described in Sachs et al. 2002) and zero otherwise. A similar dummy variable but including all states instead of only the reform-oriented states is introduced to capture the impact of the post-Operation Flood period. Both coefficients are positive but not statistically significant, meaning that differential effects of the economic environment on the dairy sector cannot be detected with this database.
Finally, dummy variables are defined assigning a value of 1 when the district belongs to a particular state and zero otherwise to capture a state effect on dairy production. The dummy variable for Uttar Pradesh is dropped for estimation and the constant term represents the average of all states; significant coefficients for the states should be interpreted as differences with respect to the average of all states.
Results for the regressions of number of cross-bred cows per worker and number of milking buffalo per worker show similar results to those in the first regression. The number of cross-bred cows per worker is positively and significantly related to population density and annual growth in income, while the number of milking buffaloes is not, which explains the non-significant coefficients of these variables in the first regression. The number of cross-bred cows per worker is negatively related to the proportion of milking buffaloes in the total buffalo stock; similarly the number of milking buffaloes is negatively related to the ratio of milking cows to cattle and cross-bred cows to milking cows.
The results confirm the importance of the development of the crop sector on dairy development, as discussed in the previous section, together with development of the labour market and increases in the opportunity cost of labour. Results also show that there appear to be two strategies to expand output per worker of the dairy sector: one based on increasing the number of milking buffaloes and a second based on the expansion of cross-bred cows and technical change associated with this expansion.
To account for the impact of co-operatives in dairy development, a variable is introduced which measures the average quantity of milk procured by co-operatives (in litres per year) per milking animal in each district. As information on milk procured by co-operatives is only available for 1997; for some of the districts a new dataset is used including only information for the years 1982, 1987 and 1992 for the districts with information on co-operatives. The independent variables are the same as before with the exception of the variable measuring the importance of co-operatives. The districts with information about co-operatives included in this database appear to have, on average, higher number of cross-bred cows per worker than the districts in the larger database used for the first regression.
Results of regressions including the co-operative variable are presented in Table 17 and show that the effect of co-operatives on the index of milking buffaloes and cross-bred cows per worker is positive but not significant. However, there is a positive and significant relationship between milk procured by co-operatives and the number of cross-bred cows per worker, while the number of milking buffaloes per worker and milk received by co-operatives is positive but not significant. This is evidence showing that co-operatives are important in those districts where the dairy sector is expanding through the use of improved technology in milk production.

Dairy Development in India
53
Table 17: Parameter estimates for dairy development, including role of co-operatives, from Indian district level information for years 1982, 1987, and 1992, for three different dependent variables.
Dependent Variable Index cross-bred cows-milking buffaloes per
worker
Cross-bred cows per worker
Milking buffaloes per worker
Coefficient Coefficient Coefficient
Fertilizer per hectare of crops (kg) -0.04** 0.08 -0.06**
Road density (km per hectare) 0.03 0.43 0.05
Population density -0.04 0.30* 0.06
Crop area under irrigation (%) 0.22** 0.15 0.29**
GDP per capita 0.26 0.26 0.33
Urbanization (%) 0.23 0.76 -0.73
Annual growth of GDP per capita 0.01 0.93** -0.02
Rural workers/population -0.25** 0.48 -0.47**
Literacy rate (%) 0.09 -0.38 0.19*
Milking cows/total cattle -0.04 1.35** -0.44**
Cross-bred/milking cow 0.14** - -0.09**
Milking buffaloes/total buffaloes 0.40** 0.34 0.66**
Milk procured by co-operatives a/ -0.01 0.24** 0.01
Rain (mm per year) 0.04 0.66** -0.16*
Trend -0.01 0.03 0.01
Dummy 1990s 0.07 -0.38 0.14
Andhra Pradesh -0.30** -1.47** -0.45**
Gujarat -0.05 -1.72** -0.01
Haryana 0.41** 1.98** 0.66**
Karnataka -0.29** -0.23 -0.43**
Punjab 0.48** 2.22** 1.36**
Rajasthan -0.07 -2.06** -0.44**
Constant b/ 17.97 -59.14 -17.24
R2 0.78 0.67 0.69
Notes: a/ Calculated as litres of milk procured by co-operatives per day and per milking animal. Value only for 1997 so variable is defined as a constant term for each district. b/ Constant term represents the average effect of all regions. Effects of states on dairy production are obtained by adding the state coefficient and the constant term.
In sum, there is one consistent pattern explaining differences in the number of cross-bred cows per worker across states: the contribution of the Green Revolution on development of the crop sector and its impact on infrastructure and income. According to our Conceptual Framework, these factors should act through increased demand for dairy products, lower transport and transaction costs and more developed feed and output markets. The impact of co-operatives is significant only when related to the growth in the number of cross-bred cows per worker but not with the expansion of milking buffaloes.

Dairy Development in India
54
Income and Employment Generation in the Indian Dairy Sector
Dairy enterprises are very important in terms of improving the socio-economic status of the rural poor by reducing the longstanding problems of unemployment and under-employment. Since distribution of livestock is more equitable than is land, growth in the livestock sector is deemed to be antipoverty and equity-oriented. In 1999/2000 dairying, including processing and selling of products, engaged about 18 million people in India, 5.5% of total workers (Table 18). Of the total workforce engaged in dairying activities, 92% are concentrated in rural areas.
The distribution of workers among rural and urban areas differs considerably across states; the share of urban workers in dairying is very high in Assam (43%) and West Bengal (24%). The share of persons engaged in urban areas in dairying is also higher than the national average in Jammu and Kashmir, Karnataka, Kerala, Madhya Pradesh, Maharashtra, Orissa and Rajasthan.
Dairying seems to promote gender and social equity: 58% of the total workers engaged in the dairying sub-sector are women, although in urban areas it is only 37%. The participation of women in other activities, including agriculture, is low compared to that in animal husbandry, particularly dairying. Further, the majority of dairy workers belong to socially and economically disadvantaged communities: Scheduled Tribes (STs), Scheduled Castes (SCs) and Other Backward Castes (OBCs) together constitute about 69% of the persons employed in dairy sector (Table 19). Further, about 92% of workers in the dairy industry are engaged in farming and allied activities pertaining to primary production, including cattle rearing, goat rearing for milk production, breeding, ranching and grazing.
Processing, including manufacturing of different dairy products, such as butter, ghee, milk powder, ice-cream, kulfi, khoya and cheese, engages only 1.2% of dairy workers in both the formal and traditional informal sectors. A little over 6% of workers in the dairy sub-sector are engaged in selling of milk and milk products, including both wholesaling as well as retailing. As expected, a higher proportion of workers in the dairy sector in rural areas are engaged in production-related activities (95 %) and less than 1% in processing. But in urban areas about 31% of the dairy workers are engaged in selling of milk and milk products.

Dairy Development in India
55
Table 18: Employment in dairying in major states of India (in 1,000s) and its distribution in rural and urban areas.
State Rural Urban All Rural (%) Urban (%)
Andhra Pradesh 1986 158 2143 92.6 7.4
Assam 35 27 62 57.0 43.0
Bihar 664 64 727 91.3 8.7
Gujarat 1709 142 1851 92.3 7.7
Haryana 783 65 848 92.3 7.7
Himachal Pradesh 234 3 237 98.9 1.1
Jammu & Kashmir 28 5 34 83.7 16.3
Karnataka 470 76 546 86.1 13.9
Kerala 459 71 530 86.6 13.4
Madhya Pradesh 305 57 362 84.4 15.6
Maharashtra 842 169 1011 83.3 16.7
Orissa 178 30 208 85.6 14.4
Punjab 1559 84 1643 94.9 5.1
Rajasthan 2585 92 2677 96.6 3.4
Tamilnadu 844 135 979 86.3 13.7
Uttar Pradesh 3350 241 3592 93.3 6.7
West Bengal 182 58 240 75.8 24.2
India 16,267 1,520 17,787 91.5 8.5
Source: Computed from unit level NSSO database (55th round)
Table 19: Percentage distribution of employment in dairying across social groups in major states of India (1999-2000).
State Scheduled Castes
Scheduled Tribes
Other Backward
Castes Others
Andhra Pradesh 11.6 20.8 51.1 16.5 Assam 8.9 9.2 26.6 55.3 Bihar 2.6 14.0 72.9 10.4 Gujarat 11.7 8.6 46.7 33.0 Haryana 0.2 23.4 29.5 46.8 Himachal Pradesh 1.5 17.4 5.2 75.9 Jammu & Kashmir 5.5 17.5 6.2 70.7 Karnataka 7.5 22.5 38.7 31.3 Kerala 0.7 10.5 48.7 40.1 Madhya Pradesh 13.7 17.9 57.7 10.8 Maharashtra 10.1 8.1 21.7 60.0 Orissa 19.1 10.5 48.2 22.3 Punjab 0.2 36.7 13.1 50.0 Rajasthan 23.5 13.5 35.6 27.3 Tamilnadu 1.5 23.5 72.4 2.6 Uttar Pradesh 1.9 25.4 43.2 29.6 West Bengal - 31.6 14.5 53.9 India 8.2 19.6 40.9 31.2
Source: Computed from unit level NSSO database (55th round).
Dairy Development in India
56
Employment Generation in Milk Production Several farm-level studies have highlighted the importance and potential of dairy farming in generating regular employment and income (Shiyani and Singh 1995; Sharma & Singh 1995; Singh, 1997; Dixit 1999). These studies found that the estimated employment generation by a dairy bovine was in the range of 60-100 man days per annum, depending upon the region, categories of farm households and type of livestock species: on a per household basis, the employment generated varied from 150-300 man days per year.
It is widely accepted by various studies that the livestock sector provides much higher employment and more regular income than any other agricultural or allied activity. Aggregate figures suggest that productivity of labour in dairying is about 2.5-times higher than in agriculture generally, based on aggregate output per worker in each sector. Annual return per unit of labour is about INR 45,000 (USD 1020) in dairying and about INR 17,000 (USD 390) in the agriculture sector as a whole. This is because of its labour intensive nature, ability to generate employment from small land areas throughout the year and its role in redistribution of rural income. In addition, the livestock sector has the potential to generate employment in industries such as feed manufacturing, dairy equipment, animal skin and leather industries and service sectors in the form of veterinary hospitals and dispensaries, institutional and non-institutional finance, insurance and trade.
An exercise was conducted to estimate and analyse the employment and income generated at the production level in rural and commercial dairy farms and also in marketing of milk through different informal channels. For this purpose the study analysed the employment-generating potential of dairying in two of the most dairy developed states, Punjab and Haryana. Two districts each from Punjab and Haryana were selected; from each of these four districts, two villages were randomly chosen. From each of these, eight clusters of farmers were selected on the basis of herd size representing three groups: small (< 4 dairy animals, including both cattle and buffalo, and including calves and males), medium (4-10), large (> 10) and, based on availability, another category in the form of commercial units. In total, a sample size of 260 farm units was covered in the study. The data on labour used in various operations and wage rates for workers were collected in addition to general description of the bovine population and milk yields in the individual farm units. In the case of rural production units, direct employment included self, family and hired labour while indirect employment referred to labour involved in providing services to the milk producing farms.
Analysis revealed that the proportion of family labour to total labour used was highest in the large farms and the lowest in commercial units. The rural farms used mainly family labour, which varied from 53% to 77% of total, while the commercial units hired 60% of their total labour requirements.
Table 20 shows the employment and income implications of dairy production, combining the data from both Punjab and Haryana. As expected, the level of employment generated per unit of milk production decreases dramatically as herd size increases. For every 1000 litres of milk produced on a daily basis on small farms, some 230 jobs are created, mostly family labour (194 jobs). The rate of employment per unit declines to 17.6 jobs in the largest commercial operations, with most of that in the form of hired labour (10.6). The data also reveals (although not shown here) that less labour is used per unit milk production in Punjab than in Haryana; this is consistent with the perception of the higher level of development of Punjab dairy farms, which are likely to employ more labour-substituting strategies.

Dairy Development in India
57
Table 20: Income and employment in milk production on average in Haryana and Punjab, under different scales of production.
Small Medium Large Commercial Total milk production (litres/farm/day) 4.5 19.6 60.6 140.8
Self employment 193.6 58.6 17.0 7.0
Hired labour 36.5 38.2 8.4 10.6 Rate of employment generated (jobs/1000L produced on daily basis) Total employment 230.1 96.8 25.4 17.6
Employment Generation in the Milk Market Employment in milk marketing and processing was also estimated. The data were collected from rural milk producers and commercial farms and also informal milk processing and marketing units. Data related to both direct and indirect job opportunities created in the production, processing and marketing of milk were collected. The data on labour used in various operations and wage rates were collected. The data collection focused on the informal and locally processed channels, but includes retailers of packaged pasteurized milk.
The key channels for milk and dairy product flows, which reflect both traditional and formal markets, are listed below although not all are described in the employment data:
Producer – Consumer
Producer – Vendor - Consumer
Producer – Creamery / Halwai - Consumer
Producer – Vendor- Creamery / Halwai – Consumer
Producer – Vendor- Retailer - Consumer
Producer – Milk plants – Consumer
Producer – Ice Creamery – Consumer
Producer - Vendor – Milk Plants - Consumer
Producer – MPCC – Milk plant – Distributor – Retailer- Consumer
Among these, the direct Producer-Consumer channel, without any intermediaries, is still the predominant one in terms of market share, not only in the study sites but also in India as a whole (Dairy India 1997).

Dairy Development in India
58
Table 21: Employment generation in informal milk markets in Punjab and Haryana, and national predictions.
Employment rate (jobs per
1000L) assuming 8
working hrs/day
Proportion of marketed milk
that is handled by type of agent (using entire Indian data)**
Estimated quantity of milk handled by type
of agent nationally (Mt/day)
Estimated total number
of jobs generated nationally
% of the total
number of jobs
Milk vendors (dudhias) 10.6 (.4)* 0.58 92,897 980,000 55
Halwais (sweet shops) 19.9 (.2)* 0.20 32,204 640,000 36
Creameries 13.4 (.9)* 0.01 991 13,000 1
Milk sachet sales (retailers) 5.4 (5.4)* 0.15 23,782 129,000 7
Ice-cream producers 25.9 (1.7)* 0.004 637 106,500 1
Total 0.94 150,511 1,778,500 100
*Indirect jobs in parenthesis. **Source for national market channel proportions: Dairy India, 1997.
The levels of employment generated in the informal milk markets are significant. Every 1000 litres handled on a daily basis employs 10.6 milk vendors (dudhias), who each handle some 98 kg of milk per day and collect milk from an average of 19 milk producers (Table 21). Nearly all the jobs created are in the form of self-employment. Due to value addition, some 20 jobs are created for the same quantity of milk in sweet shops, which employ 2-3 permanent workers, or more than 13 jobs in creameries. Creameries produce indigenous milk products, such as paneer, butter, ghee, cream and dahi, and collect milk from 13-14 vendors on average. Retail sales of packaged milk generate some 5 jobs per 1000 litres daily; on average a retailer employs 12 persons who carry milk sachets in cycles/rickshaws and deliver them door-to-door. Also, due to value addition, the employment generated in local ice-cream production is high, estimated at some 26 jobs per 1000 litres of milk handled daily, of which 1.7 are in the form of service providers to maintain and repair equipment.
The data gathered on income from these activities was considered not to be reliable, so they are not presented. It is expected, however, that wages and returns to labour in these activities are comparable to other informal sector enterprises and thus offer useful livelihoods.
Extrapolating these figures to the national level, which requires the large assumption that similar employment levels are found per unit of milk across the country, allows some understanding of the level of employment generated through these sorts of small-scale milk markets. In terms of proportions of milk flowing through each channel, national data were used (Dairy India 1997). They show that of the milk passing through the traditional market channels, besides that sold directly from producers to consumers, the milk vendors or dudhias collectively handle the largest proportion of milk, 58%. They mainly procure directly from farmers and sell to other market intermediaries or final consumers. Sweet makers also play an important role, handling some 20% of all the milk passing through the traditional channels.
These volumes translate into an estimated 1.8 million jobs, with milk vendors accounting for 55% of the total followed by halawis (36%). This excludes persons employed in the formal processing sub-sector but includes retailers of pasteurized milk (milk sachet sellers/retailers). This figure amounts to some 10% of the estimated total direct employment of 18 million in the dairy sector. This is comparable to but higher than the estimates based on the National Sample Survey Organization (NSSO)

Dairy Development in India
59
database, which indicate about 1.3 million jobs in the processing and marketing of milk and milk products at national level, particularly since the NSSO data do not include processing of milk at farm level, which is combined with milk production activities. The variation with the national estimates can be attributed to the fact that the NSSO database pertain to 1999/2000. Some changes in the composition of employment pattern are inevitable and heterogeneity of dairy development across different regions is not captured in the data collected from a specific region. In spite of the divergence, both the estimates reaffirm the significant opportunities that small-scale and traditional milk market activities present.
It can be summarized that the informal and small-scale dairy industry generates significant labour at each stage, from production through procurement, transport, processing and marketing of milk, much of which is available to low-skilled individuals who may have few other employment opportunities. Compared to processed markets, which employ many fewer workers per unit milk, the traditional market is seen to be comprised of labour-intensive enterprises with an enormous potential for employment generation in the rural sector.
The significance of dairying in providing regular employment and income is indispensable, particularly to landless labourers and marginal and small-scale farmers who still form the majority among milk producers in India. The fact that the rural farms create more employment opportunities than the commercial units should be considered in the formulation of policies for rural employment. Besides the employment generated at the production level in rural setting, dairy creates ample opportunities in the processing and marketing activities, with multiplier effects of dairying in creating jobs in other firms providing services.
Main Lessons from Indian Dairy Development
Having achieved the status of the largest milk producing nation in the world, India offers a number of important lessons for dairy development and the policies associated with it.
Effects of Key Factors and Policies on Dairy Development Trends Multiplier effects of the Green Revolution. Development of the crop sector and the infrastructure related with this development during the period of the Green Revolution has played a key role in dairy development. The analysis clearly shows that the role of irrigation and fertilizer, through increasing year-round availability of fodder and through broader innovation processes of farmer technology uptake, have been some of the main driving forces for dairy development in India.
Improved dairy animals. Improved (through selection) and cross-bred cattle, as well as dairy buffaloes, have played a key role in India’s dairy development. This process has been accelerated by the mechanization of agriculture and increased use of tractors, which has freed farmers to choose animals aimed solely at milk production rather than for dual milk-draft use. The success of local cattle crossed with exotic dairy genes offers important lessons for similar approaches in other tropical settings.
Demand and demographic change. Although the data were not able to show this clearly, it is apparent that growth in demand associated with income and population growth, as well as changes in rural demographics, have driven both overall scale of the dairy industry and productivity change through changes in land and labour availability.
Meeting traditional demand. Related to the growth in demand was a shift by formal market processors to traditional Indian products, such as paneer, chhena, khoa and

Dairy Development in India
60
gulab jamun - products formerly supplied almost entirely by the informal market. This created new market opportunities and allowed the formal market to build on traditional demand patterns, rather than trying to create demand for Western-style products. Some of the latter, however, such as sweetened yoghurt and ice-cream, also helped create new markets.
Raw milk and traditional markets. These markets continue to dominate the dairy industry in terms of market share, although they are gradually giving way to processed products from the formal sector. By virtue of their colossal scale, they have clearly played a role in being the primary mechanism for linking growing demand among consumers with increased production from producers. A key policy ingredient in this role was the laissez faire approach by regulators and policy-makers towards small-scale informal market activity. That policy stance, perhaps not stated but nevertheless implemented and observed, has allowed the relatively efficient operation of a highly diffuse, organized and mostly competitive milk and dairy product chain.
Milk and Milk Products Order. Data were not available to assess the contribution of this set of regulations, which gave preference for new dairy processing investment to co-operatives versus the private sector, among other things. Although it may have contributed to sustaining co-operatives in areas where they might otherwise not have been competitive, the growth in the private dairy sector in last few years suggests that the restrictive aspects of the MMPO may have restrained private sector investment and dairy development generally. However, the amended MMPO does not have any restrictions on setting-up new capacity and did away with the concept of milksheds to target and regulate investment, focusing only on sanitary conditions, hygiene, food quality and safety.
Co-operative development. Although Operation Flood and the role of dairy co-operatives is always mentioned as a key factor in the growth of the dairy sector in India, the empirical evidence suggests that the role of co-operatives in growth was not as direct as generally stated. Co-operatives still account for a small proportion of dairy market share and there is little evidence to show that development of milk markets through co-operatives has driven growth in dairy: some of the states with the strongest growth, such as Punjab, have had little activity by dairy co-operatives. However, the evidence does suggest that dairy co-operatives have had impact on the supply side, in fostering the introduction of new technology, particularly improved dairy cattle. The role of co-operatives may thus have been more in terms of supporting technology development and uptake.
Investment of donor aid. Related to co-operative development was the role of aid in the form of imported surplus dairy products, the proceeds from the sales of which were reinvested in dairy development activities, particularly co-operative development. This allowed the establishment of the co-operative sector and also contributed to the development of infrastructure for improved breeding services. Key to the success of that aid, however, was the integrity and efficiency of use of the investments.
Effects of Trends, Key Factors and Policies on the Poor Employment. The dairy industry has been shown to be an important source of employment for the rural and urban poor. Nationally, between 1.3 and 1.8 million people are estimated to be employed in the raw milk and traditional products market that dominates the sector. Small-scale entrepreneurs have successfully entered into a diversity of products, including ice-cream, expanding opportunities by tapping into shifting tastes and income trends. At the production level, some 18 million people are directly employed in dairy production, either as farmers or hired labourers on dairy farms. There is no question that growth in the dairy sub-sector and consequent

Dairy Development in India
61
growth in smallholder production and marketing has played an important role in poverty alleviation and in providing incomes for women; many of those hired on dairy farms are likely to come from the poorest sectors of society. Also, considering that a significant proportion of milk production comes from landless and socially marginalized producers, dairying provides significant opportunities for these groups, for whom alternatives may be very few. As has been demonstrated in studies elsewhere (Moll 2005), livestock assets used in dairy production may provide a key avenue for capital accumulation, financing other productive activities and acting as insurance for these resource-poor households.
Trends in productivity and scale. Results from both the farm survey and the wider analysis of trends show that India has experienced significant growth in productivity at the farm level. That productivity growth is also reflected in scale of production: the amount of labour used per animal decreases as the herd size increases. There is thus lower unit employment with dairy development. However, higher productivity is likely to be associated with higher returns to labour and wages for hired labour. If increase in scale of production and productivity is a result of rising opportunity costs of labour due to economic development, as seems to be the case in Punjab for example, then, as described in the Conceptual Framework, these trends can be seen as positive and associated with increased commercialization and evolution of small-scale production and improved producer livelihoods. At the same time, however, the continued dominance of smallholder producers suggests that they can still compete strongly. This is further supported by recent work (Sharma et al. 2003) that shows that profits per unit milk are highest on Indian farms producing less than 10 litres per day and that profit efficiency on small-scale farms is also greater than on larger farms. The pattern thus has multiple facets, with gradual increase in scale and productivity particularly in areas with general agricultural commercialization, such as Punjab. This is accompanied by generally strong competitiveness of small-scale and even landless producers across India, pointing towards continued dominance of small-scale production, even while larger producer gradually gain greater share in certain areas.
Crop-livestock market integration. Successful and sophisticated fodder markets in India, and also exchange mechanisms for dung, mean that landless producers can enter into viable dairy production. These institutions are critical for assisting the participation of the poorest households; landless producers can exchange dung for crop residues and fodder with crop producers. Associated with this is the fact that small-scale producers are shown to create the lowest levels of negative environmental externalities caused by animal wastes (Sharma et al. 2003).
Market linkages. Several factors have worked to ensure that smallholder dairy producers can retain participation in the gradually changing market. Key among these has been dairy co-operatives in a number of states, to which tens of millions of smallholder rural milk producers belong and on which they rely to sell their milk. Another increasingly important avenue for reliable market linkages that provides scope for increased productivity and scale are contract farming arrangements with private dairy processors, such as those with Nestlé in Punjab. It appears that, to some extent, smallholders can participate in these. However, the available evidence suggests that the informal/traditional market has been the primary avenue for linking to output markets for the large majority of producers, particularly the smallest and most marginalized. This has implications for the policy strategies below.
Policy Opportunities and Entry Points, Strategies and Resources The evidence available points to several avenues and strategies for policy interventions to support dairy development and its role in rural livelihoods and employment:

Dairy Development in India
62
Support mechanisms for smallholder participation in markets: contract farming. As discussed above, in some cases where smallholders are commercializing, contract farming with private processors offers assured and remunerative markets. Further support to such efforts should be encouraged. However, policy-makers may need to evaluate the conditions and barriers to small-scale farmer entry into such contracts and provide incentives for processors to include small-scale producers in their schemes.
Address raw milk and traditional markets constructively. Given the continued dominance of these markets for the foreseeable future, it would be prudent to address these markets in a constructive manner. The general laissez faire approach historically followed should allow these markets to function competitively, but increased attention to quality by the growing middle class may require policy-makers to pay more attention to those issues. One means of doing that is to begin to introduce training and certification programmes for small-scale milk and dairy product traders and processors, as has been done in Kenya under the Smallholder Dairy Project. This would allow some bridging of the quality gap, at the same time allowing these markets to function and play their vital role in serving poor farmers and consumers and in generating employment.
Targeting traditional demand. India is an excellent example of how to target demand for traditional products to help grow the formal processed market. The last 10 to 15 years have seen a large growth in supply of traditionally processed products, such as paneer, from formal processors who previously, partly due to imported processing methods, had been promoting many Western products, such as hard cheeses. Additional support and attention can be given to this process, which allows strong demand for traditional products to be better met.
Support continued animal breed improvement. India also provides a strong case for continued investment in improved breeds of cattle and buffalo. With the proportion of cross-bred dairy cattle in the population at over 70% in some states (including crosses between indigenous breeds), it is clear that exotic dairy genes can play an important role, even in semi-arid, high-temperature settings. The regional analysis shows that improved animals have been critical to dairy productivity and development. Further public support to this process, as well as through co-operatives, is central to the continued progress of the dairy industry.
Pursue trade opportunities. Studies have shown that Indian dairy production is competitive in comparison with other countries (Sharma et al. 2003). While the domestic market may provide the largest engine for growth, support should be given to identifying and tapping into export markets, possibly related to demand for traditional products from Indian communities throughout the world.

63
REFERENCES
Dairy India. 1997). V. R. Gupta (eds), Priyadarshini Vihar, New Delhi.
Dastagir, M B. 2001. Demand for livestock products in India: Current Status and Projections for 2020, Agricultural Economics Research Review (Conference Proceedings), pp-176-182.
Delgado, C., M. Rosegrant, H. Steinfeld, S. Ehui, and C. Courbois. 1999. Livestock to 2020: The next food revolution. Food, Agriculture, and the Environment Discussion Paper 28. Washington, DC: International Food Policy Research Institute.
Christopher L. Delgado, Mark W. Rosegrant and Siet Meijer. 2001. Livestock to 2020: The Revolution Continues. Paper presented at the annual meetings of the International Agricultural Trade Research Consortium (IATRC), Auckland, New Zealand, January 18-19, 2001.
Dorosh, Paul and Valdes, Alberto. 1990. Effect of exchange rate and trade polices on Agriculture in Pakistan. Research Report 84. International Food Policy Research Institute, Washingtonne D.C. USA.
Dixit, P.K. 1999. Economics of dairying – an important sector of Indian economy, Plant Horti Tech, vol. 1, July- Aug., 1999.
Gandhi, V.P. and G. Mani. 1995). Average Monthly Per Capita Consumption Expenditure, Indian Journal of Agricultural Economics, 50(3):283-293.
GOI. 2002. Basic Animal Husbandry Statistics, Department of Animal Husbandry and Dairying, Ministry of Agriculture, GoI.
Kumar, Praduman. 1998. Food Demand and Supply Projections for India, agricultural Economics Policy Paper 98-01, Division of Agricultural Economics, Indian Agricultural Research Institute, New Delhi.
Kumar, P. and P.S. Birthal. 2004. Changes in consumption and demand for livestock and poultry products in India. Indian Journal of Agricultural Marketing, 18(3):110-123.
Moll, H. 2005. Costs and benefits of livestock systems and the role of market and non-market relationships. Agricultural Economics, 32 (2005), 181-193.
National Sample Survey Organization. NSSO. 55th Round (1999-00) database CD on Employment and Unemployment.. Central Statistical Organization, Ministry of Statistics and Programme Implementation, Government of India, New Delhi.
Radhakrishna, R. and C. Ravi. 1992. Effects of Growth, Relative Price and Preference of Food and Nutrition, Indian Economic Review, 27(Special Number), 303-323.
Sachs, J.D., N. Bajpai and A. Ramiah. 2002. “Understanding regional economic growth in India.” CID Working Paper No. 88, March 2002.

References
64
Saxena, Rakesh. 2000. Dynamics of Demand for Milk in this Millennium, Paper presented at the XXXth Dairy Industry Conference, Calcutta, December 8-9,2001,pp 32-47
Sharma, V.P. and Singh, R.V. 1994. An economic analysis of milk production by different breeds of milch animals in humid temperate zone of Himachal Pradesh, Indian J. Dairy Sci. 47(9): 749-755.
Sharma, V.P., Delgado, C., Staal, S. And Singh, R.V. 2003. Policy, Technical, and Environmental Determinants and Implications of the Scaling-Up of Milk Production in India. In: Delgado, C., Narrod, C.A., Tiongco, M. M., Policy, Technical, and Environmental Determinants and Implications of the Scaling-Up of Livestock Production in Four Fast-Growing Developing Countries: A Synthesis. Final Research Report of IFPRI-FAO Project on Livestock Industrialization, Trade and Social-Health-Environment Impacts in Developing Countries. IFPRI, Washingtonne, DC. 2003
Shiyani R.L. and Singh, R.V. 1995. Economics of milk production – A comparative study, Ind.Jr.DairySci.48 (1):21-26.
Singh M. 1997. Economic analysis of dairy enterprise in Nalanda district of Bihar, Unpublished M.Sc. thesis, NDRI, Deemed University, Karnal.